
The Development Aid for the Agricultural Sector of African, Caribbean and Pacific Countries—Determinants and Allocation

Abstract
1. Introduction
2. Materials and Methods
- Fm—common factors;
- aj1, …, ajm—loads of common factors;
- Uj—specific factor;
- dj—specific factor load.
- X1—share of population of working age (% of population).
- X2—urbanization rate (%).
- X3—share of exports of goods and services (% of GDP).
- X4—urban population growth (%).
- X5—share of employees in services (%).
- X6—share of employees in industry (%).
- X7—share of employees in agriculture (%).
- X8—current account balance (% of GDP).
- X9—life expectancy (years).
- X10—gross national product per capita (USD/person).
- X11—gross domestic product per capita (USD/person).
- X12—annual growth of gross domestic product (%).
- X13—quality of bureaucracy.
- X14—crops and livestock products (USD 1000).
- X15—food Excluding Fish products(USD 1000).
- X16—CO2 emissions (kg/person).
- X17—population growth (%).
- X18—infant mortality (per 1000 live births).
- X19—dependency ratio (% of working age population).
- X20—unemployment rate (%).
- X21—share of agriculture in GDP (%).
- X22—share of industry in GDP (%).
- X23—total fertility rate (births per woman aged 15–49).
- X24—number of births per 1000 women aged 15–19.
- X25—internal conflict.
- X26—corruption.
- X27—religious tension.
- Class I: qi~ ≥ q- + sq.
- Class II: q- + sq > qi~ ≥ q-.
- Class III: q- > qi~ ≥ q--sq.
- Class IV: qi~ < q—sq.
- Z—objective function;
- Bi—budgetary expenses for a typological group of countries i;
- i = 1, …, n—index of considered groups of countries;
- zi—coefficient of the objective function (values of socioeconomic index).
- r = 1, …, m—is the index of restrictions (equations or inequations);
- ari—is the coefficient of restriction r for group i;
- br—is the value of restriction r.
3. Results
4. Discussion
5. Conclusions
Author Contributions
Funding
Institutional Review Board Statement
Data Availability Statement
Conflicts of Interest
Correction Statement
References
- Todaro, M.; Smith, S. Economic Development; Perasons Education Limited: UK, London, 2015. [Google Scholar]
- Farias, D.B. Outlook for the ‘developing country’ category: A paradox of demise and continuity. Third World Q. 2019, 40, 668–687. [Google Scholar] [CrossRef]
- Mbaku, J. Foreign-aid and Economic-growth in Cameroon. Appl. Econ. 1993, 25, 1309–1314. [Google Scholar] [CrossRef]
- Liu, X.; Shu, C.; Sinclair, P. Trade, foreign direct investment and economic growth in Asian economies. Appl. Econ. 2009, 41, 1603–1612. [Google Scholar] [CrossRef]
- Todoro, M. Theoretical Note on Labour as an Inferior Factor in Less Developed Economies. J. Dev. Stud. 1969, 5, 252–261. [Google Scholar] [CrossRef]
- Ssozi, J.; Asongu, S.; Amavilah, V. The Effectiveness of Development Aid for Agriculture in Sub-Saharan Africa. J. Econ. Stud. 2019, 46, 284–305. [Google Scholar] [CrossRef]
- Ibe, G.I. Financial Intermediation and Human Capital Development for Sustainable Development: Evidence from Sub-saharan African Countries. Eur. J. Econ. Financ. Res. 2017, 2, 2–89. [Google Scholar]
- Roj, M. Financial dependence and growth: Further evidence. Appl. Econ. Lett. 2009, 16, 325–330. [Google Scholar] [CrossRef]
- Stiglitz, J.E. Rethinking Development Economics. World Bank Res. Obs. 2011, 26, 230–236. [Google Scholar] [CrossRef]
- Niebel, T. ICT and economic growth—Comparing developing, emerging and developed countries. World Dev. 2018, 104, 197–211. [Google Scholar] [CrossRef]
- Ravallion, M.; Datt, G. How important to India’s poor is the sectoral composition of economic growth? World Bank Econ. Rev. 1996, 10, 1–25. [Google Scholar] [CrossRef]
- Smolińska, K. The Role of Agriculture in the National Economy of China and India—A longterm analysis. Ann. Pol. Assoc. Agric. Agribus. Econ. 2019, 21, 432–440. [Google Scholar] [CrossRef]
- Witt, L. Measures for the Economic Development of Under-Developed Countries. J. Farm Econ. 1951, 33, 585–587. [Google Scholar] [CrossRef]
- Kołodziejczyk, K. Przyszłość grupy krajów Afryki, Karaibów i Pacyfiku. Stos. Międzynarodowe 2016, 52, 253–264. [Google Scholar]
- Tomczak, F. Gospodarka Rodzinna w Rolnictwie: Uwarunkowania i Mechanizmy Rozwoju; Instytut Rozwoju Wsi i Rolnictwa Polskiej Akademii Nauk: Warszawa, Poland, 2005. [Google Scholar]
- Stokke, O. International Development Assistance: Policy Drivers and Performance; Springer: Berlin/Heidelberg, Germany, 2019. [Google Scholar]
- OECD. Available online: https://www.oecd.org/en/topics/development.html (accessed on 20 January 2024).
- Ahmed, M.M. Macroeconomic Determinants of Official Development Assistance in Developing Countries: A Cross Country Panel Study. J. Appl. Econ. Bus. Reserch 2019, 9, 127–140. [Google Scholar]
- Chiang, A.C. Fundamental Methods of Mathematical Economics; 3. Auflage; Mc_Graw-Hill: Singapore, 1984. [Google Scholar]
- Kirschke, D.; Jechlitschka, K. Interaktive Programmierungsansätze für die Gestaltung von Agrar-und Umweltprogrammen. Agrarwirtsch 2003, 52, 211–217. [Google Scholar]
- Kiryluk-Dryjska, E.; Beba, P. Region-specific budgeting of rural development funds- An Application Study. Land Use Policy 2018, 77, 126–134. [Google Scholar] [CrossRef]
- Bui, T.X.; Jarke, M. Communications design for co-oP: A group decision suport system. ACM Trans. Off. Inf. Syst. 1986, 4, 81–103. [Google Scholar] [CrossRef]
- Matsatsinis, N.F.; Samaras, A.P. MCDA and preference disaggregation in group decision support systems. Eur. J. Oper. Res. 2001, 130, 414–429. [Google Scholar] [CrossRef]
- Jelassi, T.; Kersten, G.; Zionts, S. An introdutoction to group decision nad negotiation suport. In Readings in Multiple Criteria Decision Aidm; Bana e Costa, C.A., Ed.; Springer: Berlin/Heidelberg, Germany, 1990. [Google Scholar]
- Dyer, J.S.; Fishburn, P.C.; Steuer, R.E.; Wallenius, J.; Zionts, S. Multiple Criteria Decision Making, Multi attribute Utility Theory: The next ten years. Manag. Sci. 1992, 38, 645–654. [Google Scholar] [CrossRef]
- Kim, J. A model and case for supporting participatory public decision making in e-democracy. Group Decis. Negot. 2008, 17, 179–193. [Google Scholar] [CrossRef]
- De Agostini, P. Identifing the Best Combination of Environmental Functions Using Multi-Criteria Analysis. In Edward Elgar, Cheltenham; Cooper, J.C., Perali, F., Veronesi, M., Eds.; Integrated Assessment and Public Managment of public Resources: Northampton, UK, 2006; pp. 121–156. [Google Scholar]
- Bell, M.; Hobbs, B.; Elliot, E.; Ellis, H.; Robinson, Z. An evaluation of multi-criteria methods in integrated assessment of climate policy. J. Multi-Criteria Decis. Anal. 2001, 10, 29–256. [Google Scholar] [CrossRef]
- Kangas, J.; Kangas, A.; Leskinen, P.; Pykalainen, J. MSDA for Strategic Planning of Forestry on state-owned lands in Finland: Application and Experiences. J. Multicriteria Decis. Anal. 2001, 10, 257–271. [Google Scholar] [CrossRef]
- Tecle, A.; Bijaya, P.; Shrestha, B.; Duckstein, L. A Multiobjective Decision Support System for Multi source Forest Managment. Group Decis. Negot. 1998, 7, 23–40. [Google Scholar] [CrossRef]
- Johannsen, R.M.; Prina, M.G.; Østergaard, P.A.; Mathiesen, B.V.; Sparber, W. Municipal energy system modelling–A practical comparison of optimisation and simulation approaches. Energy 2023, 269, 126803. [Google Scholar] [CrossRef]
- Schmid, J.; Häger, A.; Jechlitschka, K.; Kirschke, D. Programming rural development funds—An interactive linear programmingapproach applied to the EAFRD program in Saxony-Anhalt. In SiAg-Working Paper; Humboldt University Berlin, Department of Agricultural Economics: Berlin, Germany, 2010; p. 7. [Google Scholar]
- Teich, J.E.; Wallenius, H.; Kuula, M.; Zionts, S. A Decision support approach for negotiation with an application to agricultural income policy negotiations. Eur. J. Oper. Res. 1995, 81, 76–87. [Google Scholar] [CrossRef]
- Jin, G.; Peng, J.; Zhang, L.; Zhang, Z. Understanding land for high-quality development. J. Geogr. Sci. 2023, 33, 217–221. [Google Scholar] [CrossRef]
- Wang, Q.; Guo, J.; Li, R. Official development assistance and carbon emissions of recipient countries: A dynamic panel threshold analysis for low-and lower-middle-income countries. Sustain. Prod. Consum. 2022, 29, 158–170. [Google Scholar] [CrossRef]
- Yáñez-Sandivari, L.; Cortés, C.E.; Rey, P.A. Humanitarian logistics and emergencies management: New perspectives to a sociotechnical problem and its optimization approach management. Int. J. Disaster Risk Reduct. 2021, 52, 101952. [Google Scholar] [CrossRef]
- Spearman, C. “General Intelligence” Objectively Determined and Measured. Am. J. Psychol. 1904, 15, 201–292. [Google Scholar] [CrossRef]
- Czyż, T. Zastosowanie metody analizy czynnikowej do badania ekonomicznej struktury regionalnej Polski. Prace Geogr. 1971, 92. [Google Scholar]
- Kiryluk-Dryjska, E. [Formalization of Public Choice Decisions. Application for the Allocation of Structural Funds of the EU Common Agricultural Policy in Poland], Formalizacja Decyzji Wyboru Publicznego. Zastosowanie do Alokacji Środków Strukturalnych Wspólnej Polityki Rolnej UE w Polsce; Wydawnictwo Naukowe PWN: Warszawa, Poland, 2014; ISBN 978-83-01-17549-8. [Google Scholar]
- Kiryluk-Dryjska, E.; Beba, P.; Poczta, W. Local determinants of the Common Agricultural Policy rural development funds’ distribution in Poland and their spatial implications. J. Rural Stud. 2020, 74, 201–209. [Google Scholar] [CrossRef]
- Smolińska-Bryza, K.; Józefowicz, K. Socio-economic development and urbanization in the organization of African, Caribbean and Pacific states. Sci. Pap. Silesian Univ. Technol.—Organ. Manag. Ser. 2023, 188, 605–620. [Google Scholar]
- Zakrzewska, M. Analiza Czynnikowa w Budowaniu i Sprawdzaniu Modeli Psychologicznych; Wydawnictwo Naukowe Uniwersytetu im. Adama Mickiewicza w Poznaniu: Poznań, Poland, 1994. [Google Scholar]
- Stanisz, A. Przystępny kurs Statystyki z Zastosowaniem STATISTICA PL na Przykładach z Medycyny; Tom 3. Analizy Wielowymiarowe; StatSoft Polska: Kraków, Poland, 2007. [Google Scholar]
- Barrett, P.T.; Kline, P. The observation to variable ratio in factor analysis. Personal. Study Group Behav. 1981, 1, 23–33. [Google Scholar]
- Beba, P. Modele Optymalizacyjne Regionalnej Alokacji Środków Strukturalnych Wspólnej Polityki Rolnej w Polsce; Wydawnictwo Uniwersytetu Przyrodniczego w Poznaniu: Poznań, Poland, 2017. [Google Scholar]
- Stec, M. Analiza porównawcza poziomu rozwoju społeczno-gospodarczego Polski na tle krajów Unii Europejskiej i krajów do niej kandydujących. Nierówności Społeczne A Wzrost Gospod. 2004, 5, 9–22. [Google Scholar]
- Głodowska, A. Edukacja a rozwój społeczno-gospodarczy w krajach Unii Europejskiej. Wyższa Szkoła Zarządzania W Rzesz 2008, 8, 329–330. [Google Scholar]
- Cieślik, E. Rozwój gospodarki chińskiej w okresie realnego socjalizmu–analiza podstawowych wskaźników makroekonomicznych. Gdańskie Stud. Azji Wschod. 2017, 11, 59–82. [Google Scholar] [CrossRef]
- Mazumdar, K. Level of development of a country: A possible new approach. Soc. Indic. Res. 1996, 38, 245–274. [Google Scholar] [CrossRef]
- Świerczyńska, K.; Kryszak, Ł. Wpływ stabilności politycznej i praworządności na efektywność gospodarek w krajach Afryki Subsaharyjskiej. Ekonomista 2019, 5, 608–635. [Google Scholar] [CrossRef]
- Świerczyńska, K.; Kaczmarek, F.; Kryszak, Ł. Political stability as a factor affecting growth in agricultural sub-Saharan African countries. Nierówności Społeczne A Wzrost Gospod. 2020, 63, 160–176. [Google Scholar] [CrossRef]
- Moreno-Enguix, M.D.R.; Lorente-Bayona, L.V.; Gras-Gil, E. Social and Political Factors Affect the Index of Public Management Efficiency: A Cross-Country Panel Data Study. Soc. Indic. Res. 2019, 144, 299–313. [Google Scholar] [CrossRef]
- Taniguchi, H.; Marshall, G.A. Trust, political orientation, and environmental behavior. Environ. Politics 2018, 27, 385–410. [Google Scholar] [CrossRef]
- Wysocki, F.; Lira, J. Statystyka Opisowa; Wydawnictwo Akademii Rolniczej im. Augusta Cieszkowskiego w Poznaniu: Poznań, Poland, 2007. [Google Scholar]
- Tinbergen, J. On the Theory of Economic Policy; North-Hollang Publishinh Company: Amsterdam, The Netherlands; Oxford, UK; American Elsevier Publishing Company, Inc.: New York, NY, USA, 1954. [Google Scholar]
- Dorosiewicz, S.; Kłopotowski, J.; Kołatkowski, D.; Sosnowska, H. Matematyka, Oficyna Wydawnicza SGH; Szkoła Główna Handlowa: Warszawa, Poland, 2004. [Google Scholar]
- Bankes, S.C. Exploratory Modeling and the Use of Simulation for Policy Analysis; Paper RAND Library Collection No. N-3093-A; RAND Institute: Santa Monica, CA, USA, 1992. [Google Scholar]
- Geurts, J.L.A.; Joldersma, C. Methodology for participatory policy analysis. Eur. J. Oper. Res. 2001, 128, 300–310. [Google Scholar] [CrossRef]
- Vennix, J.A.M. Mental Models and Computer Models: Design and Evaluation of a Computer Based Learning Environment for Policy Making. Ph.D. Thesis, Unversität Nijmegen [Hrsg.], Beuningen, The Netherlands, 1990. [Google Scholar]
- Hao, X.; Li, Y.; Ren, S.; Wu, H.; Hao, Y. The role of digitalization on green economic growth: Does industrial structure optimization and green innovation matter? J. Environ. Manag. 2023, 325, 116504. [Google Scholar] [CrossRef]
- Vågerö, O.; Zeyringer, M. Can we optimise for justice? Reviewing the inclusion of energy justice in energy system optimisation models. Energy Res. Soc. Sci. 2023, 95, 102913. [Google Scholar] [CrossRef]
- Kopiński, D. Pomoc Rozwojowa. Teoria i Polityka; Wydawnictwo Difin: Warszawa, Poland, 2011. [Google Scholar]
- Kherallah, M.W.; Beghin, J.C.; Peterson, E.W.F.; Ruppel, F.J. Impacts of Official Development Assistance on Agricultural Growth, Savings and Agricultural Imports. Agric. Econ. 1994, 11, 99–110. [Google Scholar] [CrossRef]
- Mosley, P.; Suleiman, A. Aid, agriculture and poverty in developing countries. Rev. Dev. Econ. 2007, 11, 139–158. [Google Scholar] [CrossRef]
- Ji, S.U.; Lim, S.S. An empirical analysis of the determinants of agricultural official development assistance. Agric. Econ. 2018, 64, 206–215. [Google Scholar] [CrossRef]
- McArthur, J.; Sachs, J. Agriculture, Aid, and Economic Growth in Africa. World Bank Econ. Rev. 2019, 33, 1–20. [Google Scholar] [CrossRef]
- Rajack-Talley, T. Agriculture, Trade Liberalization and Poverty in the ACP Countries. In Agricultural Development and Food Security in Developing Nations; IGI Global: Hershey, PA, USA, 2017; pp. 1–20. [Google Scholar]
- Mondal, P.; Basu, M. Adoption of precision agriculture technologies in India and in some developing countries: Scope, present status and strategies. Prog. Nat. Sci. 2009, 19, 659–666. [Google Scholar] [CrossRef]
- Jorgenson, A.; Kuykendall, K. Globalization, Foreign Investment Dependence and Agriculture Production: Pesticide and Fertilizer Use in Less-developed Countries, 1990–2000. Soc. Forces 2008, 87, 529–560. [Google Scholar] [CrossRef]
- Flento, D.; Ponte, S. Least-Developed Countries in a World of Global Value Chains: Are WTO Trade Negotiations Helping? World Dev. 2017, 94, 366–374. [Google Scholar] [CrossRef]
- Thiam, A.; Bravo-Ureta, B.; Rivas, T. Technical efficiency in developing country agriculture: A meta-analysis. Agric. Econ. 2001, 25, 235–243. [Google Scholar]

| Factor | Eigenvalues Extracting: Principal Components | |||
|---|---|---|---|---|
| Eigenvalue | % of Total Variance | Cumulative Eigenvalue | Cumulative % of Variance | |
| 1 | 13.074 | 48.424 | 13.074 | 48.424 |
| 2 | 2.972 | 11.007 | 16.046 | 59.431 |
| 3 | 2.218 | 8.215 | 18.264 | 67.646 |
| 4 | 1.729 | 6.405 | 19.994 | 74.051 |
| 5 | 1.321 | 4.893 | 21.315 | 78.944 |
| Factor Loadings (Varimax Normalized Rotation) Extraction: Principal Components (Labeled Charges > 0.5) | |||||
|---|---|---|---|---|---|
| Factor I | Factor II | Factor III | Factor IV | Factor V | |
| X1—share of population of working age (% of population) | 0.104 | −0.525 | 0.000 | 0.953 | 0.022 |
| X2—urbanization rate (%) | −0.121 | 0.651 | −0.025 | 0.051 | 0.307 |
| X3—share of exports of goods and services (% of GDP) | −0.056 | 0.239 | 0.041 | 0.094 | −0.084 |
| X4—urban population growth (%) | −0.156 | 0.649 | −0.008 | 0.084 | 0.065 |
| X5—share of employees in services (%) | 0.016 | −0.062 | −0.021 | −0.855 | 0.252 |
| X6—share of employees in industry (%) | 0.039 | 0.040 | 0.102 | −0.754 | 0.095 |
| X7—share of employees in agriculture (%) | −0.024 | 0.035 | −0.014 | 0.615 | −0.221 |
| X8—current account balance (% of GDP) | −0.596 | 0.220 | 0.052 | −0.121 | 0.024 |
| X9—life expectancy (years) | 0.113 | 0.749 | −0.023 | −0.003 | −0.100 |
| X10—gross national product per capita (USD/person) | 0.547 | 0.121 | −0.024 | −0.015 | −0.057 |
| X11—gross domestic product per capita (USD/person) | 0.599 | 0.149 | −0.033 | −0.022 | −0.101 |
| X12—annual growth of gross domestic product (%) | −0.617 | 0.021 | 0.097 | 0.147 | −0.114 |
| X13—quality of bureaucracy | 0.160 | 0.582 | −0.003 | 0.021 | −0.312 |
| X14—crops and livestock products (USD 1000) | 0.014 | −0.022 | −0.571 | 0.079 | −0.048 |
| X15—food Excluding Fish products (USD 1000) | 0.010 | −0.018 | −0.564 | 0.064 | −0.046 |
| X16—CO2 emissions (kg/person) | −0.813 | −0.148 | 0.005 | 0.102 | 0.218 |
| X17—population growth (%) | 0.143 | −0.870 | −0.036 | 0.006 | 0.001 |
| X18—infant mortality (per 1.000 live births) | 0.053 | 0.695 | 0.051 | 0.069 | −0.083 |
| X19—dependency ratio (% of working age population) | 0.095 | −0.673 | 0.004 | 0.018 | 0.051 |
| X20—unemployment rate (%) | 0.756 | 0.501 | −0.071 | 0.042 | −0.372 |
| X21—share of agriculture in GDP (%) | −0.685 | 0.181 | 0.014 | 0.037 | 0.076 |
| X22—share of industry in GDP (%) | 0.938 | −0.309 | 0.025 | −0.011 | 0.062 |
| X23—total fertility rate (births per woman aged 15–49) | 0.089 | −0.709 | 0.018 | −0.034 | 0.072 |
| X24—number of births per 1000 women aged 15–19 | 0.102 | −0.835 | 0.003 | 0.054 | 0.024 |
| X25—internal conflict | 0.028 | 0.047 | 0.086 | −0.440 | 0.665 |
| X26—corruption | 0.108 | −0.071 | −0.057 | −0.352 | 0.522 |
| X27—religious tension | −0.016 | 0.084 | 0.118 | −0.352 | 0.556 |
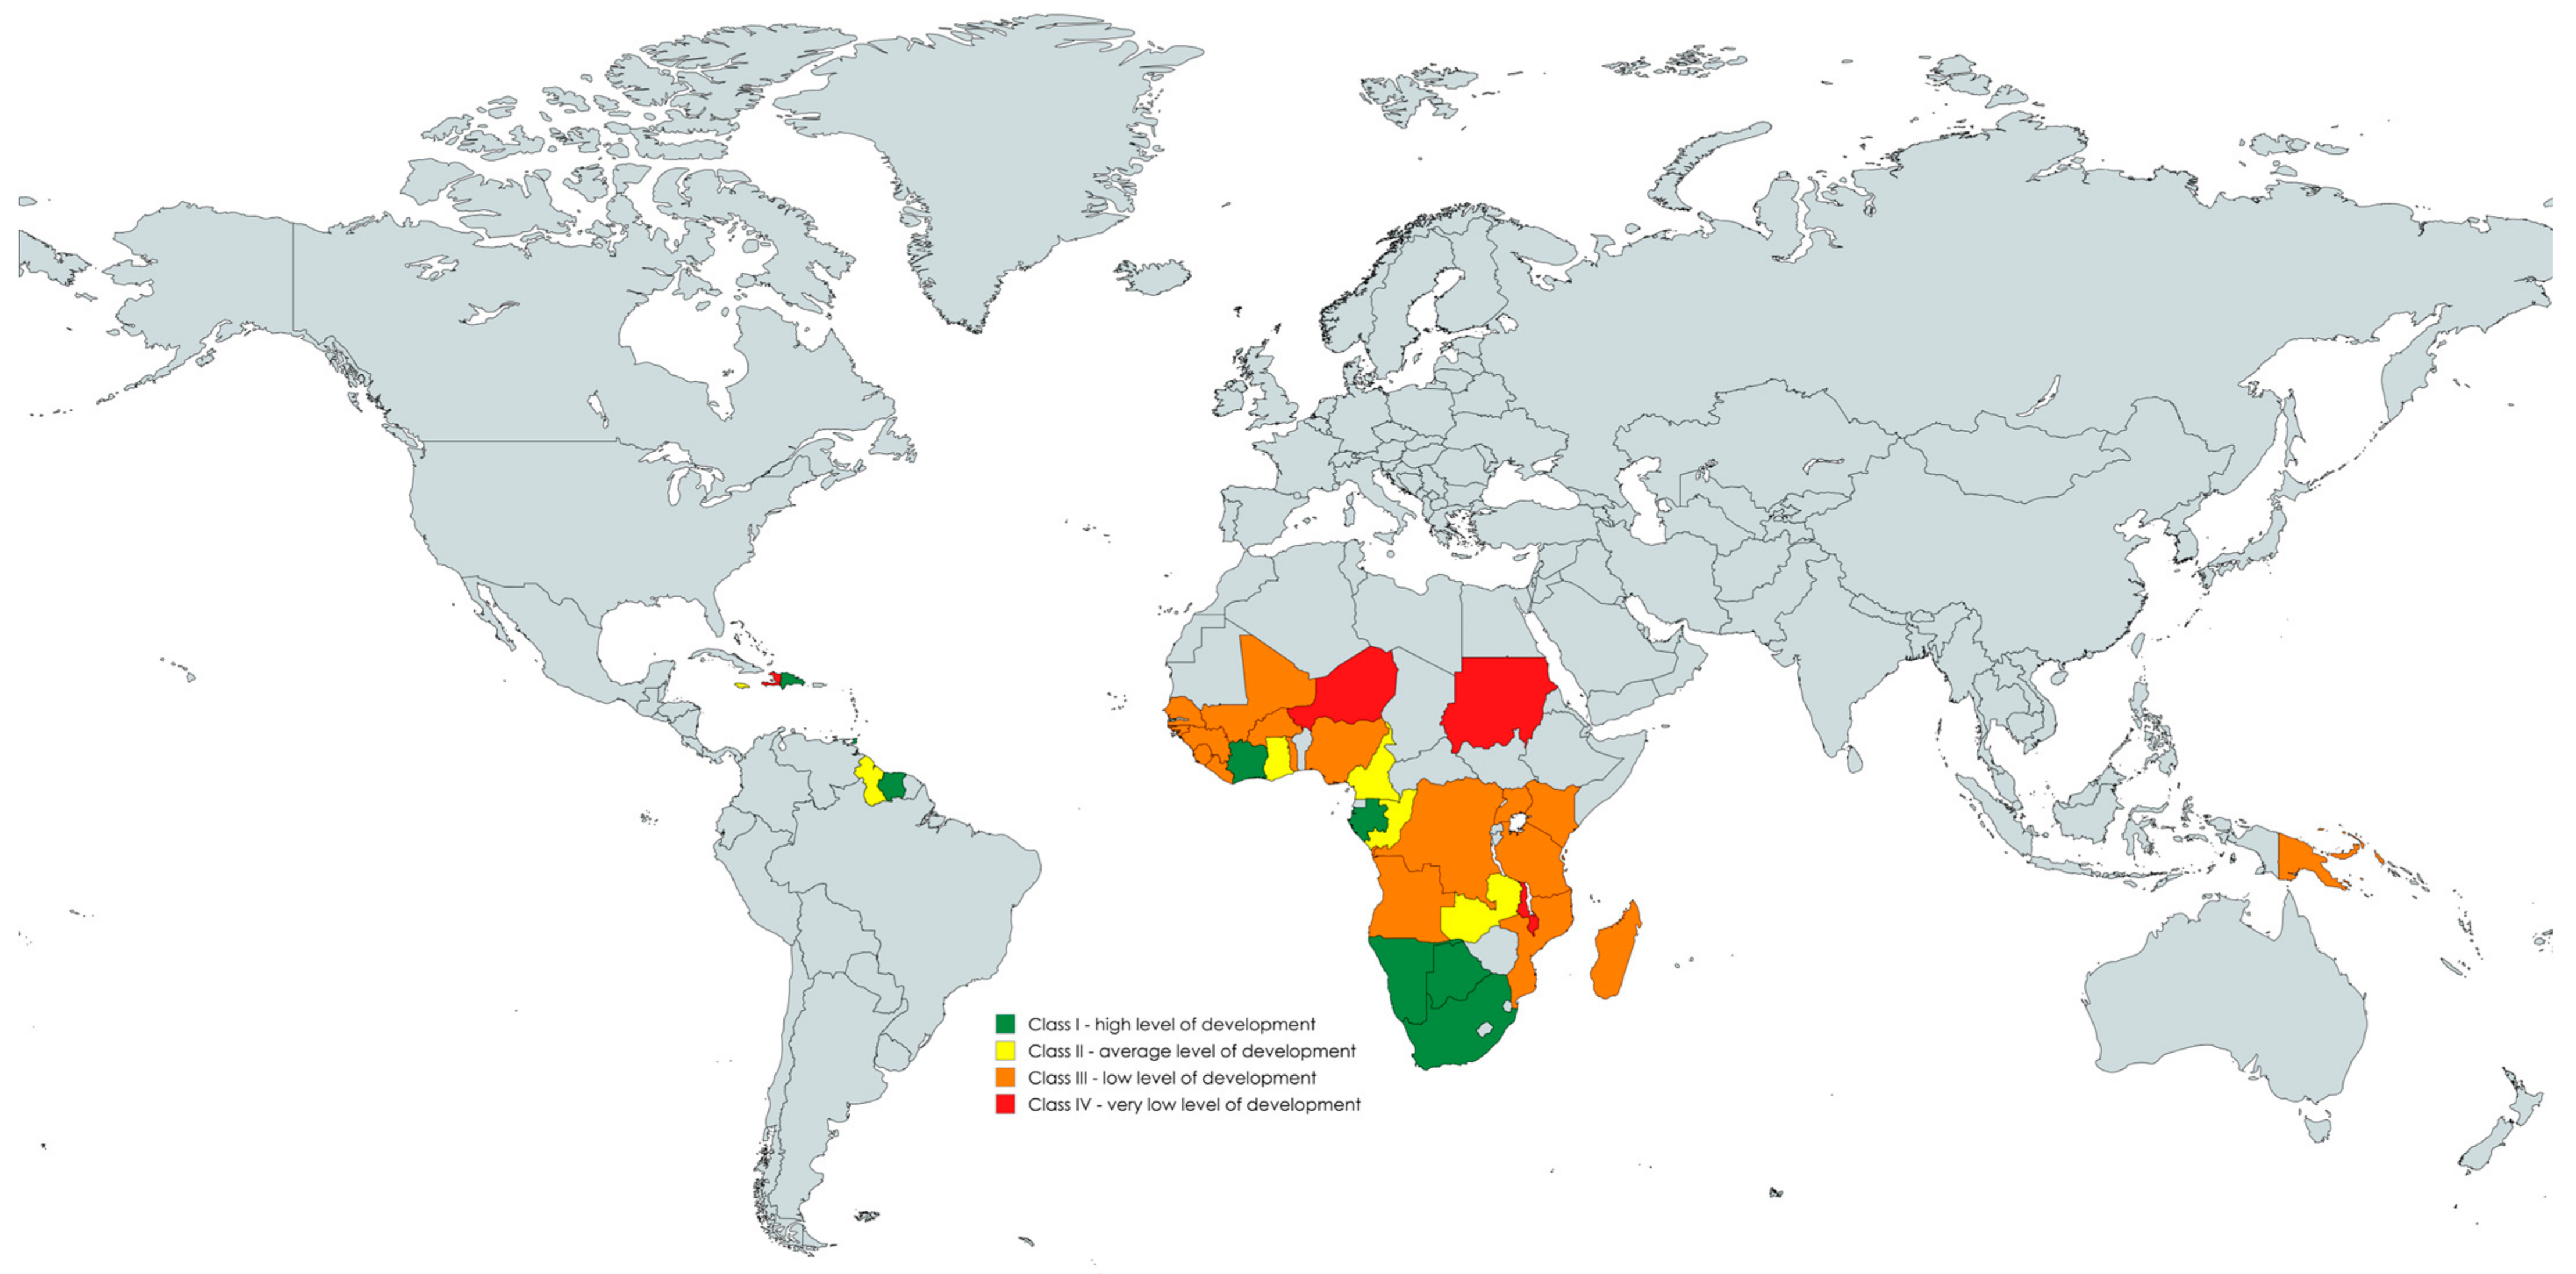
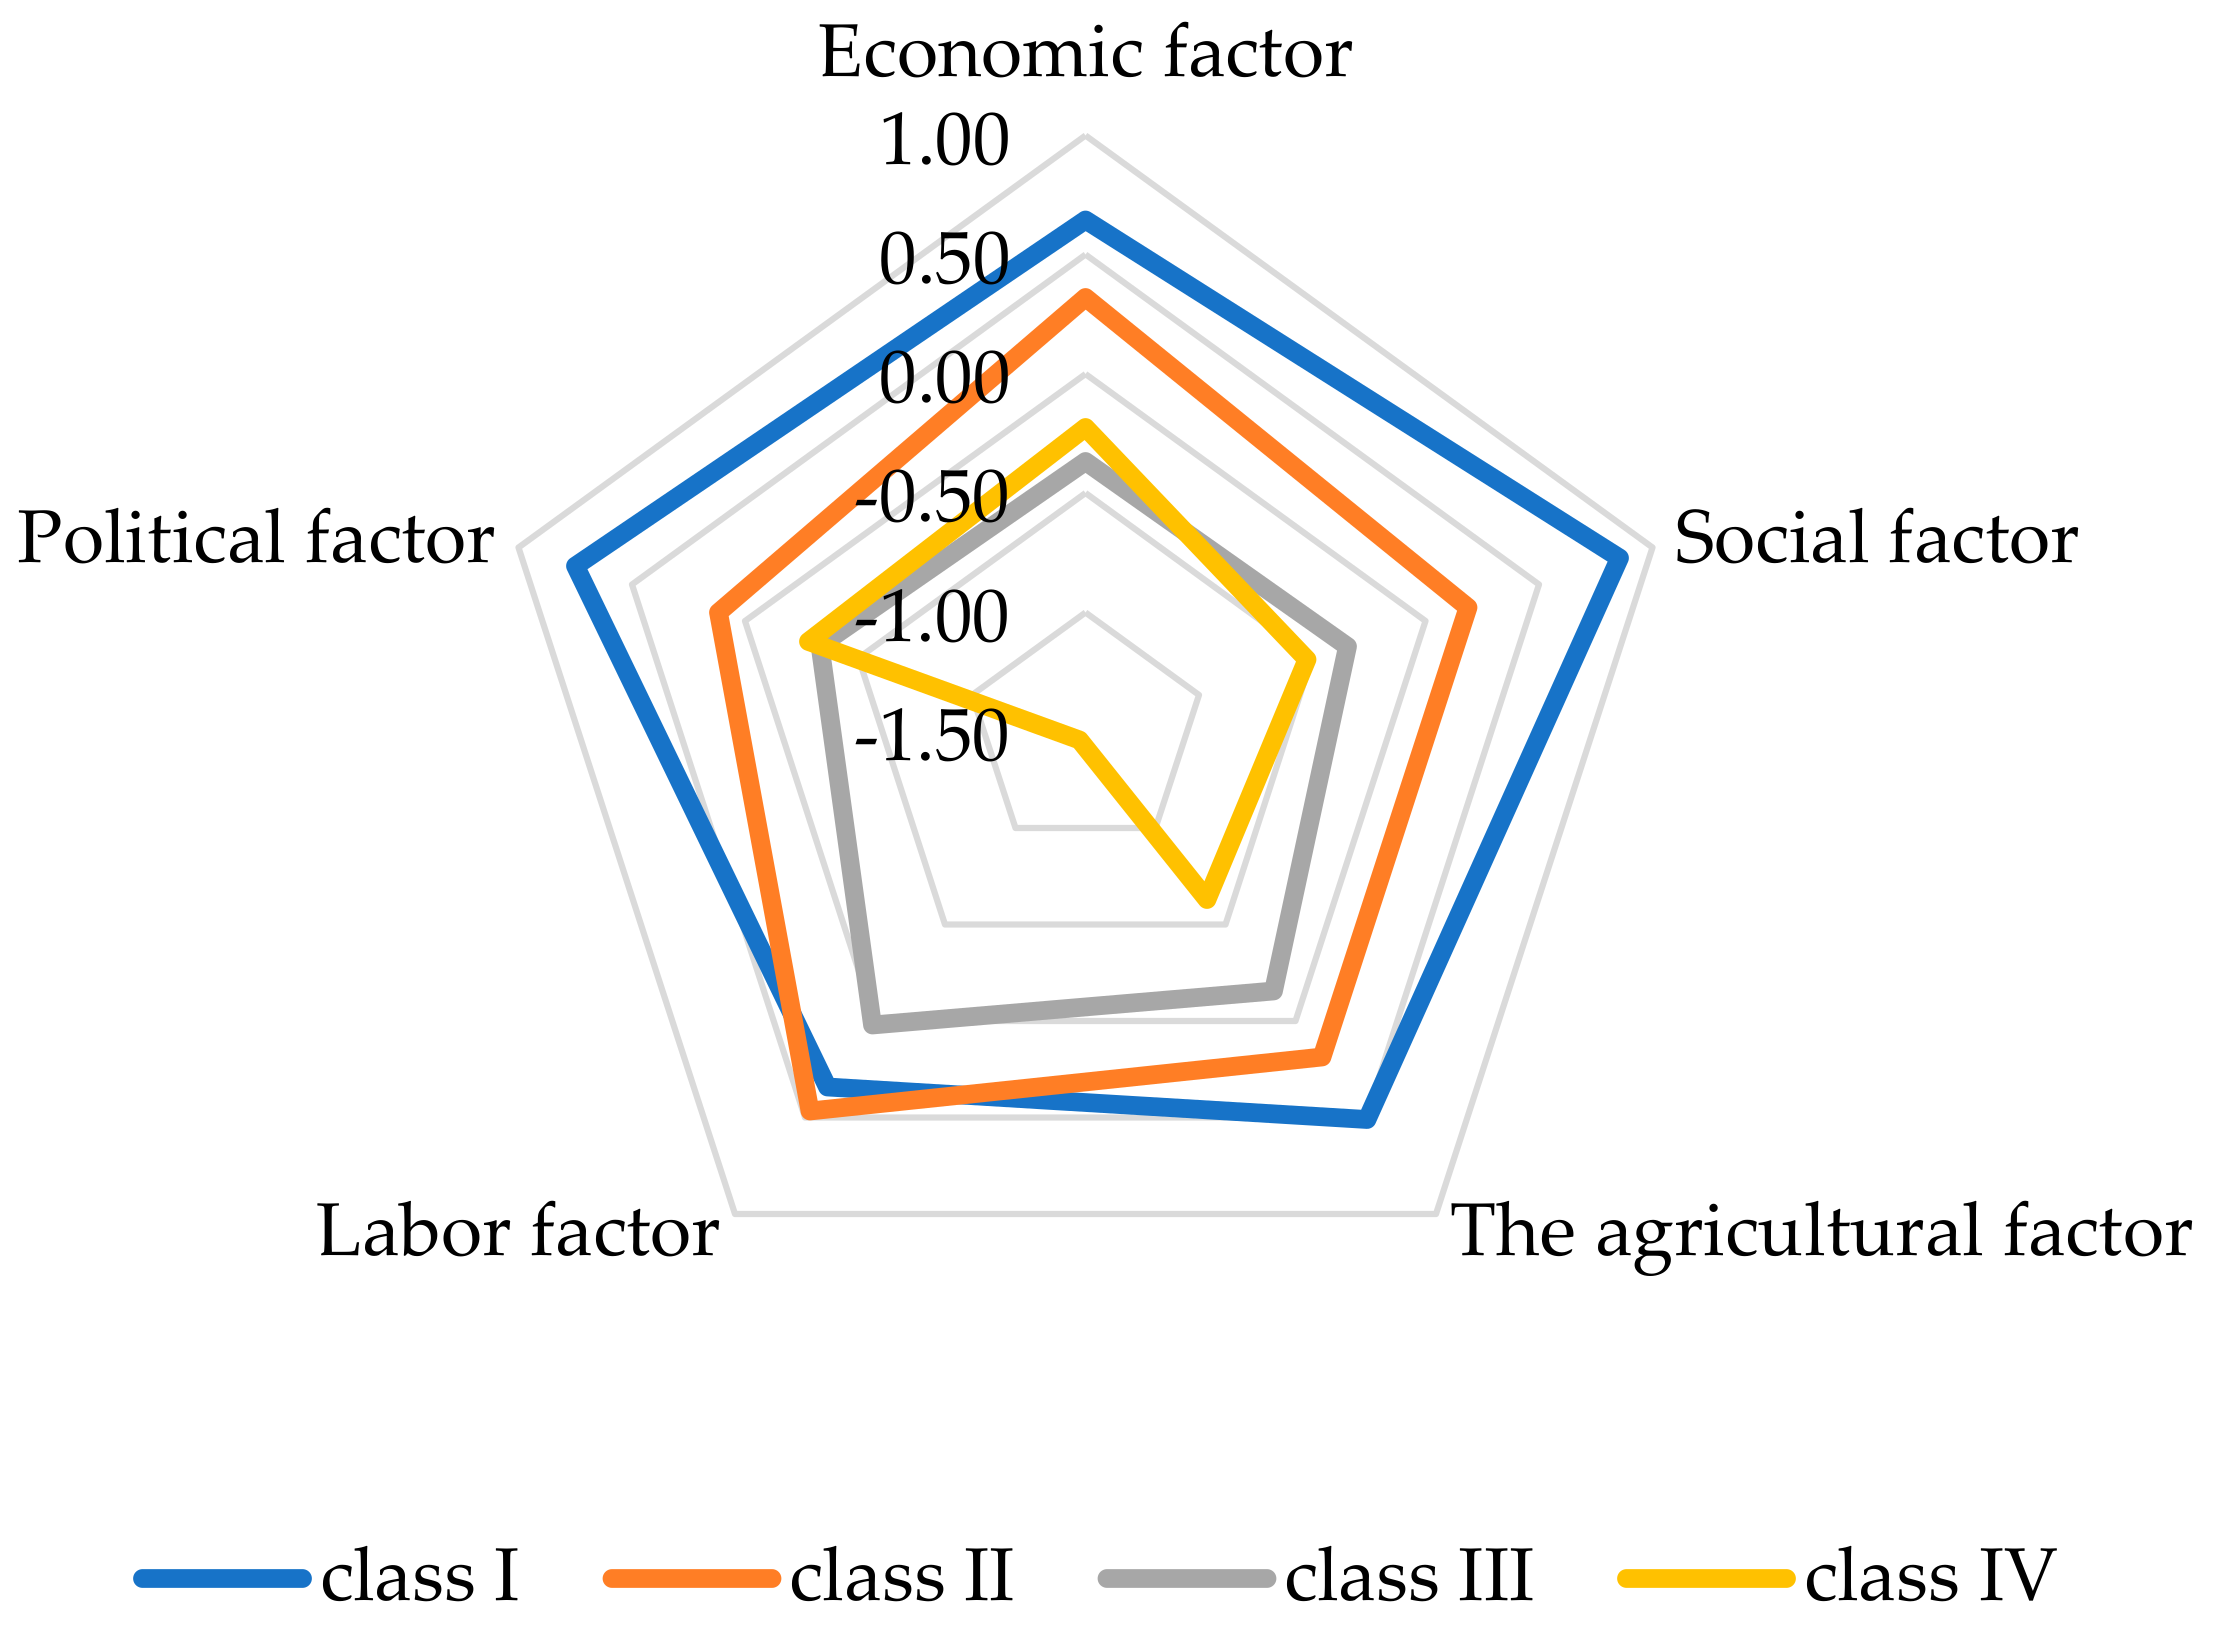
| Class | Country | Factor Values Rotation: Varimax Normalized Extraction: Principal Components | |||||
|---|---|---|---|---|---|---|---|
| Economic Factor | Social Factor | Agricultural Factor | Labor Factor | Political Factor | Average | ||
| Class I—high level of development | South Africa | 0.888 | 0.220 | 1.817 | −0.001 | 2.111 | 1.007 |
| Botswana | 0.192 | 1.003 | 0.055 | 1.996 | 0.829 | 0.815 | |
| Gabon | −0.722 | 2.094 | −0.142 | 0.228 | 1.430 | 0.578 | |
| Suriname | 1.521 | 0.615 | −0.048 | 0.237 | 0.507 | 0.566 | |
| Trinidad and Tobago | 3.099 | 2.654 | −0.481 | −0.884 | −1.701 | 0.537 | |
| Namibia | 0.104 | 0.035 | −0.116 | 1.620 | 0.921 | 0.513 | |
| Cote d’Ivoire | −0.716 | 0.348 | 3.471 | −1.367 | 0.755 | 0.498 | |
| Dominican Republic | 0.803 | −0.136 | −0.479 | 0.901 | 1.149 | 0.448 | |
| Class II—average level of development | Ghana | 0.191 | −0.074 | 0.892 | 0.974 | −0.326 | 0.332 |
| Jamaica | 2.083 | −0.734 | −0.553 | 0.636 | 0.224 | 0.331 | |
| Zambia | −1.197 | 0.860 | 0.378 | 1.442 | 0.029 | 0.302 | |
| Congo. Rep. | −0.578 | 1.632 | 0.041 | −0.937 | 1.083 | 0.248 | |
| Guyana | 2.072 | −0.654 | 0.201 | 0.037 | −0.420 | 0.247 | |
| Cameroon | −0.637 | 0.091 | 0.159 | 0.640 | 0.117 | 0.074 | |
| Class III—low level of development | Burkina Faso | −0.674 | −0.055 | 0.463 | 0.037 | 0.216 | −0.002 |
| Papua New Guinea | 0.678 | 0.289 | 0.255 | 0.190 | −1.531 | −0.024 | |
| Togo | −0.198 | −0.557 | 0.176 | 0.295 | 0.100 | −0.037 | |
| Madagascar | −0.334 | −0.396 | 0.105 | 1.012 | −0.702 | −0.063 | |
| Senegal | −0.306 | −0.184 | −0.263 | −0.330 | 0.661 | −0.084 | |
| Nigeria | 0.568 | −1.416 | −1.091 | −0.285 | 1.628 | −0.119 | |
| Tanzania | −0.757 | −0.043 | 0.494 | 0.376 | −0.789 | −0.144 | |
| Liberia | −0.227 | −1.501 | −0.224 | 0.264 | 0.292 | −0.279 | |
| Kenya | 0.463 | −0.780 | 0.324 | −0.518 | −0.941 | −0.290 | |
| Angola | −1.260 | 1.723 | −2.035 | 0.078 | −0.039 | −0.307 | |
| Mozambique | −0.762 | −0.861 | −0.594 | 1.561 | −0.995 | −0.330 | |
| Guinea-Bissau | −0.122 | −1.040 | −0.031 | −0.242 | −0.391 | −0.365 | |
| Guinea | −0.362 | 0.022 | −0.170 | −0.352 | −0.983 | −0.369 | |
| Sierra Leone | −0.148 | −1.884 | −0.383 | 0.693 | −0.222 | −0.389 | |
| Uganda | −0.608 | 0.267 | 0.682 | −1.046 | −1.256 | −0.392 | |
| Congo. Dem. Rep. | −1.091 | 0.760 | −0.381 | −0.793 | −0.489 | −0.399 | |
| Mali | −1.074 | −0.205 | 0.005 | −0.633 | −0.154 | −0.412 | |
| Class IV—very low level of development | Malawi | 0.048 | −0.679 | 0.415 | −0.352 | −1.593 | −0.432 |
| Sudan | 0.511 | −1.285 | −0.022 | −2.883 | 1.403 | −0.455 | |
| Niger | −0.874 | −0.027 | 0.146 | −0.937 | −1.664 | −0.671 | |
| Haiti | −0.576 | −0.103 | −3.064 | −1.657 | 0.745 | −0.931 | |
| Class | Factor Values Socioeconomic Development Index |
|---|---|
| Class I—high level of development | 0.620 |
| Class II—average level of development | 0.256 |
| Class III—low level of development | −0.236 |
| Class IV—very low level of development | −0.622 |
Disclaimer/Publisher’s Note: The statements, opinions and data contained in all publications are solely those of the individual author(s) and contributor(s) and not of MDPI and/or the editor(s). MDPI and/or the editor(s) disclaim responsibility for any injury to people or property resulting from any ideas, methods, instructions or products referred to in the content. |
© 2025 by the authors. Licensee MDPI, Basel, Switzerland. This article is an open access article distributed under the terms and conditions of the Creative Commons Attribution (CC BY) license (https://creativecommons.org/licenses/by/4.0/).
Share and Cite
Smolińska-Bryza, K.; Kiryluk-Dryjska, E. The Development Aid for the Agricultural Sector of African, Caribbean and Pacific Countries—Determinants and Allocation. Agriculture 2025, 15, 190. https://doi.org/10.3390/agriculture15020190
Smolińska-Bryza K, Kiryluk-Dryjska E. The Development Aid for the Agricultural Sector of African, Caribbean and Pacific Countries—Determinants and Allocation. Agriculture. 2025; 15(2):190. https://doi.org/10.3390/agriculture15020190
Chicago/Turabian StyleSmolińska-Bryza, Kinga, and Ewa Kiryluk-Dryjska. 2025. "The Development Aid for the Agricultural Sector of African, Caribbean and Pacific Countries—Determinants and Allocation" Agriculture 15, no. 2: 190. https://doi.org/10.3390/agriculture15020190
APA StyleSmolińska-Bryza, K., & Kiryluk-Dryjska, E. (2025). The Development Aid for the Agricultural Sector of African, Caribbean and Pacific Countries—Determinants and Allocation. Agriculture, 15(2), 190. https://doi.org/10.3390/agriculture15020190