Article

The Effect of Nitrogen Dose and Plant Density Interactions on Potato Yield and Quality in Dry Cultivation: The Role of Photosynthesis and C–N Metabolism

1
State Key Laboratory of Arid Land Crop Science, College of Agronomy, Gansu Agricultural University, Lanzhou 730070, China
2
College of Resources and Environment Science, Gansu Agricultural University, Lanzhou 730070, China
*
Author to whom correspondence should be addressed.
Agriculture 2025, 15(19), 2065; https://doi.org/10.3390/agriculture15192065
Submission received: 15 August 2025 / Revised: 27 September 2025 / Accepted: 29 September 2025 / Published: 1 October 2025
(This article belongs to the Section Crop Production)

Abstract

The problems of excessive nitrogen fertilizer application and mismatch between varieties and planting density are common in potato production in the dryland farming areas of Loess Plateau, and it is of great significance to select suitable nitrogen application rates and planting densities for the green and sustainable production of dryland potatoes in this area. In this study, Longshu 16 was selected as the potato variety, and we investigated two nitrogen application rates: 200 kg·hm−2 (N1), 300 kg·hm−2 (N2); and three planting densities: 37,500 plants·hm−2 (D1), 52,500 plants·hm−2 (D2), 67,500 plants·hm−2 (D3). The effects of different nitrogen fertilization rates and planting densities on photosynthetic characteristics, leaf carbon and nitrogen metabolism enzyme activities, and yield and quality of potato were measured and analyzed. The results showed that during the tuber swelling stage, the activity of ribose-1,5-diphosphate carboxylase oxygenase (Rubisco) in potato leaves was increased by 9.05%. During the starch accumulation stage, the activity of glutamine synthetase (GS) in potato leaves was increased by 3.02~22.34% in N1D2 treatment compared with other treatments, and the activity of glutamate synthase (GOGAT) was increased by 2.83~7.35% compared with other treatments. During the starch accumulation stage, the activity of ADP-glucose pyrophosphorylase (AGPase) in potato leaves was increased by 7.85~31.17% in N1D2 treatment compared with other treatments. The contents of protein, starch, vitamin C, and calcium in potato tubers in N1D2 treatment were the highest, and the yield was the highest in N1D2 treatment. In conclusion, the recommended nitrogen application rate of 200 kg·hm−2 and planting density of 52,500 plants·hm−2 in dry-fed potato production improved the yield and quality of potato by enhancing activities of GAPDH, GS, and AGPase.

1. Introduction

Potato is the fourth largest food crop in the world. China has a history of more than 400 years of potato planting [1]. At present, it is the largest potato producer in the world. As the main edible organ, its tuber is rich in nutrients. Quality is the most important economic trait of potato. The quality determines the application value and market competitiveness of potato-processed products. Potato contains 8–34% starch, 2–3% protein, 0.2% fat, and a variety of inorganic salts, vitamins, and physiologically active substances [2,3]. Nitrogen application is one of the effective cultivation measures to improve the yield and quality of potato tuber, but the demand for exogenous nitrogen in potato is not consistent in different regions and different soil fertilities. However, excessive or insufficient nitrogen application is still common in potato field production [4]. The survey found that in the central region of Gansu Province, the proportion of farmers with excessive nitrogen application was 15.1%, and the proportion of farmers with insufficient nitrogen application was 52.8% [5]. Studies have shown that reasonable nitrogen fertilizer application plays an important role in promoting the growth and development of potato plants, improving the photosynthetic efficiency of plants, increasing potato yield, and improving quality [6]. In addition, planting density is also one of the important cultivation measures affecting the yield and quality of potato tubers. The study found that increasing the planting density within a certain range can increase the number of plants and stems per unit area, the leaf area index, and the number of tubers, thereby increasing yield and quality [7]. Both excessively high and low planting densities can directly lead to a decrease in yield. The study found that potato planting density in northwest China above 70,000 plants·hm−2 and below 30,000 plants·hm−2 significantly reduces yield [8]. Potato is widely planted in the hilly and gully region of the Loess Plateau, with obvious seasonal drought characteristics; the soil is loessal soil, nutrient is relatively poor, there is a lack of organic matter, nitrogen, and phosphorus fertilizer, potassium fertilizer is relatively rich, there are no irrigation conditions by natural precipitation, and is a rain-fed agricultural area [9]. The key factor restricting local potato production is drought; less rain and large evaporation. Ridge and furrow film mulching and rainwater harvesting technology have the advantages of rainwater collection, utilization, and inhibition of evaporation, and can break through multiple environmental factors such as lower rainfall, large variability, and strong evaporation in this area. Thus, it has become a widely used cultivation mode of dryland potato in the hilly and gully region of Loess Plateau [10]. However, how to coordinate the amount of nitrogen application and planting density in this mode is one of the urgent problems to be solved.
The results showed that excessive nitrogen fertilizer can lead to excessive growth of potato stems and leaves, delayed growth period, unbalanced distribution of dry matter, reduced tuber yield and dry matter content. When the proportion of nitrogen fertilizer reduction was more than 50%, although the soil fertility was higher, the soil fertility no longer increased with the increase in the proportion of nitrogen fertilizer reduction [11]. High nitrogen levels also cause oxidative stress in plants, reducing tuber yield, starch, Vc, and soluble sugar content, and have a certain impact on potato processing quality. It was found that the starch content of tubers increased by 0.41~0.59% after reducing nitrogen fertilizer [12]. Appropriate amounts of nitrogen fertilizer can promote the growth of potato aboveground, increase the maximum Pn and enzyme activity of potato leaves, increase the yield, increase the content of starch, protein, and Vc, and control the nitrate content [13,14]. Related studies have shown that density regulation has a great influence on the agronomic traits of potato, and the leaf area of potato will increase or decrease due to a change in planting density [7,8]. Reasonable density is conducive to coordinating the relationship between potato population and individual plants, promoting the absorption of nutrients by roots and the accumulation of photosynthetic products in leaves, increasing the number of tubers per plant, and thereby improving the yield of both plants and populations [15]. Therefore, it is of great significance to study the effects of different planting densities on the yield and quality of potato tubers. However, current research has rarely considered the effects of interaction between nitrogen fertilizer and density on the growth, development, yield, and quality of dryland potato.
Studies have shown that leaf nitrogen metabolism enzymes are closely related to crop growth and yield. Reasonable nitrogen fertilizer management can increase the activity of nitrogen metabolism enzymes and yield [16]. It was found that nitrogen application can significantly increase chlorophyll content and key enzyme activities of nitrogen metabolism in leaves at the late growth stage of potato, and ultimately increase grain protein content and yield [17]. Planting density affects the process and quality of crop carbon and nitrogen metabolism by changing the field microclimate, population photosynthetic efficiency, and crop utilization of water and fertilizer [18]. Studies have shown that the enzyme activities of nitrogen metabolism in potato showed a trend of increasing first and then decreasing with the increase in planting density [19]. Research has shown that nitrogen nutrition affects the activity of starch synthase, thus affecting the biosynthesis of starch [20]. The study found that different nitrogen fertilizer application rates had significant effects on potato amylase activity and related gene expression levels, and different nitrogen fertilizer application rates were recommended for different varieties [21]. Studies have shown that under high planting density, the dry matter synthesized by the population light energy is lower, which ultimately leads to the synthesis of less starch [22]. However, current research on the effect of enzyme activity in potato leaves on yield and quality under the interaction of nitrogen application rate and planting density is not in-depth and detailed.
In conclusion, the effects of leaf enzyme activity on yield and quality of dryland potato under the interaction of nitrogen application rate and planting density were rarely considered. In the hilly and gully region of Loess Plateau, the studies on potato nitrogen metabolism and starch synthase activity are mostly focused on the effects of nitrogen application rate, planting density, drought or temperature, etc., while the response of potato nitrogen metabolism enzyme and starch synthase activity to the interaction of nitrogen application rate and planting density needs to be further studied. Therefore, we established treatments with different nitrogen application rates and planting densities. The aims were to clarify: (1) the response of potato growth, development, and leaf enzyme activity to nitrogen–density interaction, and (2) the regulatory effect of potato leaf enzyme activity on quality and yield under nitrogen–density interaction. In doing so, we provide theoretical guidance and technical support for reducing fertilizer application and increasing efficiency and sustainable green production of dryland potato in the hilly and gully region of Loess Plateau.

2. Materials and Methods

2.1. Experimental Site

The experiment was carried out at the Comprehensive Experimental Station of Dry Farming Agriculture of Gansu Agricultural University (104°36′ E, 35°35′ N) in Lijiapu Town, Dingxi City, Gansu Province from 2022 to 2023. The experimental station is located in the south-central part of Gansu Province, which is a temperate and semi-arid area. The average altitude is 2000 m, annual average solar radiation is 592.85 kJ·cm−2, sunshine hours is 2476.6 h, annual average temperature is 6.4 °C, ≥0 °C accumulated temperature is 2933.5 °C, ≥10 °C accumulated temperature is 2239.1 °C, and the frost-free period is 140 d. The average annual precipitation is 390.9 mm, the annual evaporation is 1531 mm, and the dryness is 2.53. It is a typical semi-arid rain-fed agricultural area. The rainfall in 2022, 2023 and 2001–2023 annual average is shown in Figure 1. The soil in the test area is typical loessal soil, which is soft and uniform. The average soil bulk density in 0~30 cm soil layer is 1.26 g·cm−3, pH value is 8.39, soil organic matter is 10.71 g·kg−1, total nitrogen is 0.71 g·kg−1, total phosphorus is 1.59 g·kg−1, available phosphorus is 27.32 mg·kg−1, and available potassium is 151.66 mg kg−1.

2.2. Experimental Design and Field Management

This experiment adopted a two-factor random block design. The study found that the recommended nitrogen fertilizer application rate for the Loess Plateau dryland farming region in Longzhong is 188–225 kg·hm−2, but the actual usage has increased. Therefore, nitrogen fertilizer application was set at two levels: 200 kg·hm−2 (N1) and 300 kg·hm−2 (N2), with three planting density levels: 37,500 plants·hm−2 (D1), 52,500 plants·hm−2 (D2), and 67,500 plants·hm−2 (D3). A total of six treatment groups were set: N1D1, N1D2, N1D3, N2D1, N2D2, and N2D3. In this experiment, the N2D1 treatment group combines the local conventional nitrogen application rate with the conventional planting density [23,24]. The experiment was designed with three repetitions, corresponding to three blocks (the division of blocks is based on a slight fertility gradient from north to south of the field, and blocks are divided along the east–west direction to ensure consistent soil fertility and drainage conditions within the same block). Each block contained six plots, and the treatments within each block were randomly arranged using a lottery method. In total, eighteen plots were established in the entire area, with each plot covering 40 m2 (4 m × 10 m). The potato variety used in the experiment was ‘Longshu 16’, which was planted in double rows with wide ridge and film mulching. Potatoes are sown in double rows on ridges, with a ridge width of 80 cm, a ridge height of 15 cm, a ridge distance of 40 cm, an average row spacing of 32 cm, and a sowing depth of 15 cm. Nitrogen fertilizer was applied with urea (N46%), phosphorus fertilizer was applied with calcium superphosphate (P2O5 12%) 225 kg·hm−2, and potassium fertilizer was applied with potassium sulfate (K2O 24%) 292.5 kg·hm−2. All fertilizers were applied at sowing. Other field management followed local practices.

2.3. Measurement Index and Method

2.3.1. Photosynthetic Parameters and Photosynthetic Enzyme Activity of Potato Leaves

During the tuber formation, tuber bulking, and starch accumulation stages of potato growth in 2022 and 2023, between 09:00 and 11:00 on sunny mornings, the photosynthetic rate (Pn), transpiration rate (Tr), stomatal conductance (Gs), and intercellular CO2 concentration (Ci) were measured by using the German GFS-3000 portable photosynthesis-fluorescence measurement system (Heinz Walz GmbH, Effeltrich, Germany).
During the tuber formation, tuber bulking, and starch accumulation stages of potato growth in 2022 and 2023, 15 inverted 4-leaf compound leaves were randomly collected from uniformly grown plants within each plot and pooled to form one composite sample, which represented one biological replicate (i.e., one observation plot). Each treatment consisted of three replicate plots (n = 3). For enzyme activity determination using the ELISA method, each composite sample was analyzed with two technical replicates, and the mean value was used for statistical analysis. Thus, the variance reflects the variability among plots (biological replicates), while technical replicates served only to minimize analytical error. Ribose-1,5-bisphosphate carboxylase oxygenase (Rubisco) and glyceraldehyde 3-phosphate dehydrogenase (GAPDH) [25] were determined by a two-antibody one-step sandwich enzyme-linked immunosorbent assay (ELISA) kit. The substrate TMB was used to color, the absorbance (OD value) was measured at 450 nm with a microplate reader (SpectraMax i3x, Molecular Devices, Urstein, Austria), and the sample activity was calculated. The blank experiment was used as the reference zero, and the absorbance values of the experimental results were brought into the corresponding standard curves:
Rubisco activity (U·g−1) = 9.4458x − 0.4944  R2 = 0.9994
GAPDH activity (U·g−1) = 235.0519x − 1.7102 R2 = 0.9942

2.3.2. Nitrogen-Metabolizing Enzyme Activity of Potato Leaves

The sampling procedure for nitrogen metabolism enzyme assays was identical to that used for photosynthetic enzyme measurements. Nitrate reductase (NR) [26], nitrite reductase (NIR) [27], glutamine synthetase (GS) [28], and glutamate synthase (GOGAT) [29] were determined by a two-antibody one-step sandwich enzyme-linked immunosorbent assay (ELISA) kit. The substrate TMB was used to color, the absorbance (OD value) was measured at 450 nm with a microplate reader (SpectraMax i3x, Molecular Devices, Urstein, Austria), and the sample activity was calculated. The blank experiment was used as the reference zero, and the absorbance values of the experimental results were brought into the corresponding standard curves:
NR activity (U·g−1) = 68.7818x − 4.1696    R2 = 0.9969
NIR activity (U·g−1) = 179.0661x − 12.6091    R2 = 0.9945
GS activity (U·g−1) = 32.1499x − 1.8524     R2 = 0.9974
GOGAT activity (U·g−1) = 324.4195x − 13.0817 R2 = 0.9969

2.3.3. Starch Synthase Activity of Potato Leaves

During the tuber formation, tuber bulking, and starch accumulation stages of potato growth in 2022 and 2023, 15 inverted 4-leaf compound leaves were collected from uniformly grown plants in each plot. ADP-glucose pyrophosphorylase (AGPase), starch branching enzyme (SBE), soluble starch synthase (SSS), and granule-bound starch synthase (GBSS) [30,31] were determined by a two-antibody one-step sandwich enzyme-linked immunosorbent assay (ELISA) kit. The substrate TMB was used to color, the absorbance (OD value) was measured at 450 nm with a microplate reader (SpectraMax i3x, Molecular Devices, Urstein, Austria), and the sample activity was calculated. The blank experiment was used as the reference zero, and the absorbance values of the experimental results were brought into the corresponding standard curves:
AGPase activity (U·g−1) = 604.6973x − 35.2724 R2 = 0.9957
SBE activity (U·g−1) = 46.2680x − 2.5556    R2 = 0.9978
SSS activity (U·g−1) = 510.7673x − 36.9966    R2 = 0.9995
GBSS activity (U·g−1) = 133.7603x − 1.5691   R2 = 0.9948

2.3.4. Potato Yield and Yield Components

Potato tubers were collected during the harvest period in 2022–2023. In the field experiment, all plants within each net plot were harvested, and the number of tubers per plant as well as the average tuber weight were recorded. The total fresh tuber weight of each plot was subsequently extrapolated to yield per hectare.

2.3.5. Potato Quality

Following the harvest in 2022–2023, five potato tubers were randomly selected from each plot. In the middle of each tuber, 1-cm-thick potato chips with different inner diameters were cut to avoid decay and potato skin. The contents of starch, vitamin C, reducing sugar, protein, and calcium in fresh potato tubers were determined by using an FOSS near-infrared analyzer (FOSS Analytical A/S, Hillerød, Denmark) [32]. Each potato tuber was measured three times.

2.4. Statistical Analysis

Potato photosynthetic parameters, photosynthetic enzyme activities, nitrogen metabolism enzyme activities, starch synthase activities, tuber quality, yield, and yield components were measured in both 2022 and 2023. For the purposes of analysis in this study, all traits except yield and yield component factors were evaluated based on the two-year average data. Microsoft Excel 2021 was used to organize the data, and SPSS 18.0 statistical analysis software was used for two-way analysis of variance, correlation, and Partial Least Squares Regression (PLS) analysis. Duncan‘s multiple comparison test was used to test the significance between treatments (p < 0.05, p < 0.01) via Origin Pro 2022 (OriginLab, Northampton, MA, USA).

3. Results

3.1. Changes in Photosynthetic Parameters and Photosynthetic Enzyme Activities in Potato Leaves Under the Interaction of Nitrogen and Density

As shown in Figure 2A, the Pn of potato showed a decreasing trend during the growth period, and the N1D2 treatment significantly increased by 25.37% compared with N1D3 treatment, N2D2 treatment increased by 23.53% compared with N2D3 treatment, and N1D1 treatment increased significantly compared with N2D1 treatment by 17.24% at the tuber swelling stage. At the starch accumulation stage, N1D2 treatment significantly increased by 28.33% compared with N1D3 treatment, and there was no significant difference between the treatments under the same nitrogen application rate and planting density. Nitrogen application rate and planting density had significant effects on potato photosynthetic rate from tuber formation to starch accumulation. In the starch accumulation stage, the interaction effect of nitrogen fertilizer and density had a significant effect on the photosynthetic rate.
As shown in Figure 2B, the Tr of leaves at the same density was N2 > N1 at the tuber formation stage, and N1 > N2 at the tuber swelling stage and starch accumulation stage. During the starch accumulation stage, the Tr of N1D2 treatment was significantly increased by 44.54% and 36.07% compared with N1D3 treatment and N2D2 treatment, respectively. Nitrogen application rate had a significant effect on the Tr of potato at the tuber formation stage and tuber swelling stage, but the planting density and the interaction effect between the two had no significant effect from the tuber formation stage to the starch accumulation stage.
As shown in Figure 2C, the Ci of potato showed an opposite trend to the photosynthetic rate. In the tuber swelling stage, the intercellular CO2 concentration of N1D1 treatment was significantly lower than that of N2D1 treatment by 22.45%, and that of N1D2 treatment was significantly lower than that of N2D2 treatment by 15.68%. Nitrogen fertilization rate had a significant effect on the intercellular CO2 concentration of potato at the tuber swelling stage, while neither nitrogen fertilizer, density, nor the interaction effect of the two had a significant effect on the intercellular CO2 concentration at other stages.
As shown in Figure 2D, the Gs of potatoes decreased with the advancement of growth period between treatments. The stomatal conductance of N1D2 treatment was significantly increased by 13.59% compared with N1D3 treatment at the tuber formation stage. In the starch accumulation stage, the stomatal conductance of N1D2 treatment was significantly increased by 21.33% compared with N1D3 treatment. The effect of nitrogen application rate on stomatal conductance of potato had a significant effect on the tuber expansion and starch accumulation stages, the effect of planting density on stomatal conductance had a significant effect on the tuber formation stage and starch accumulation stage, and the interaction effect of the two on stomatal conductance did not reach a significant level from the tuber formation stage to the starch accumulation stage.
As shown in Figure 3A, with the advancement of growth period, the activity of potato Rubisco enzyme decreased, and the activity of Rubisco enzyme in each treatment was the highest in the tuber formation stage. In the tuber swelling stage, the activity of Rubisco enzyme in N1D2 treatment was significantly increased by 13.48% compared with N1D3 treatment, and the activity of Rubisco enzyme in N1D2 treatment was significantly increased by 9.37% and 10.01% compared with N2D1 and N2D3 treatments, respectively. The effects of nitrogen application rate and planting density on Rubisco enzyme activity in potato leaves were significant in the tuber swelling stage, but did not reach a significant level in the other stages.
As shown in Figure 3B, the activity of GAPDH in potato leaves decreased with the advancement of growth period. In the starch accumulation stage, the N1D2 treatment was significantly increased by 9.40% and 15.85% compared with the N1D1 treatment and the N1D3 treatment, respectively, the N2D2 treatment was significantly increased by 9.85% compared with the N2D1 treatment, and the N2D2 treatment was significantly increased by 16.38% compared with the N2D3 treatment. At the tuber swelling stage, the effect of nitrogen fertilization rate on GAPDH activity in potato leaves was significant. During the starch accumulation stage, the effect of planting density on GAPDH activity in potato leaves was extremely significant. The interaction effect between the two did not reach a significant level from the tuber formation stage to the starch accumulation stage.

3.2. Changes in Nitrogen Metabolism Enzymes Activities in Potato Leaves Under the Interaction of Nitrogen and Density

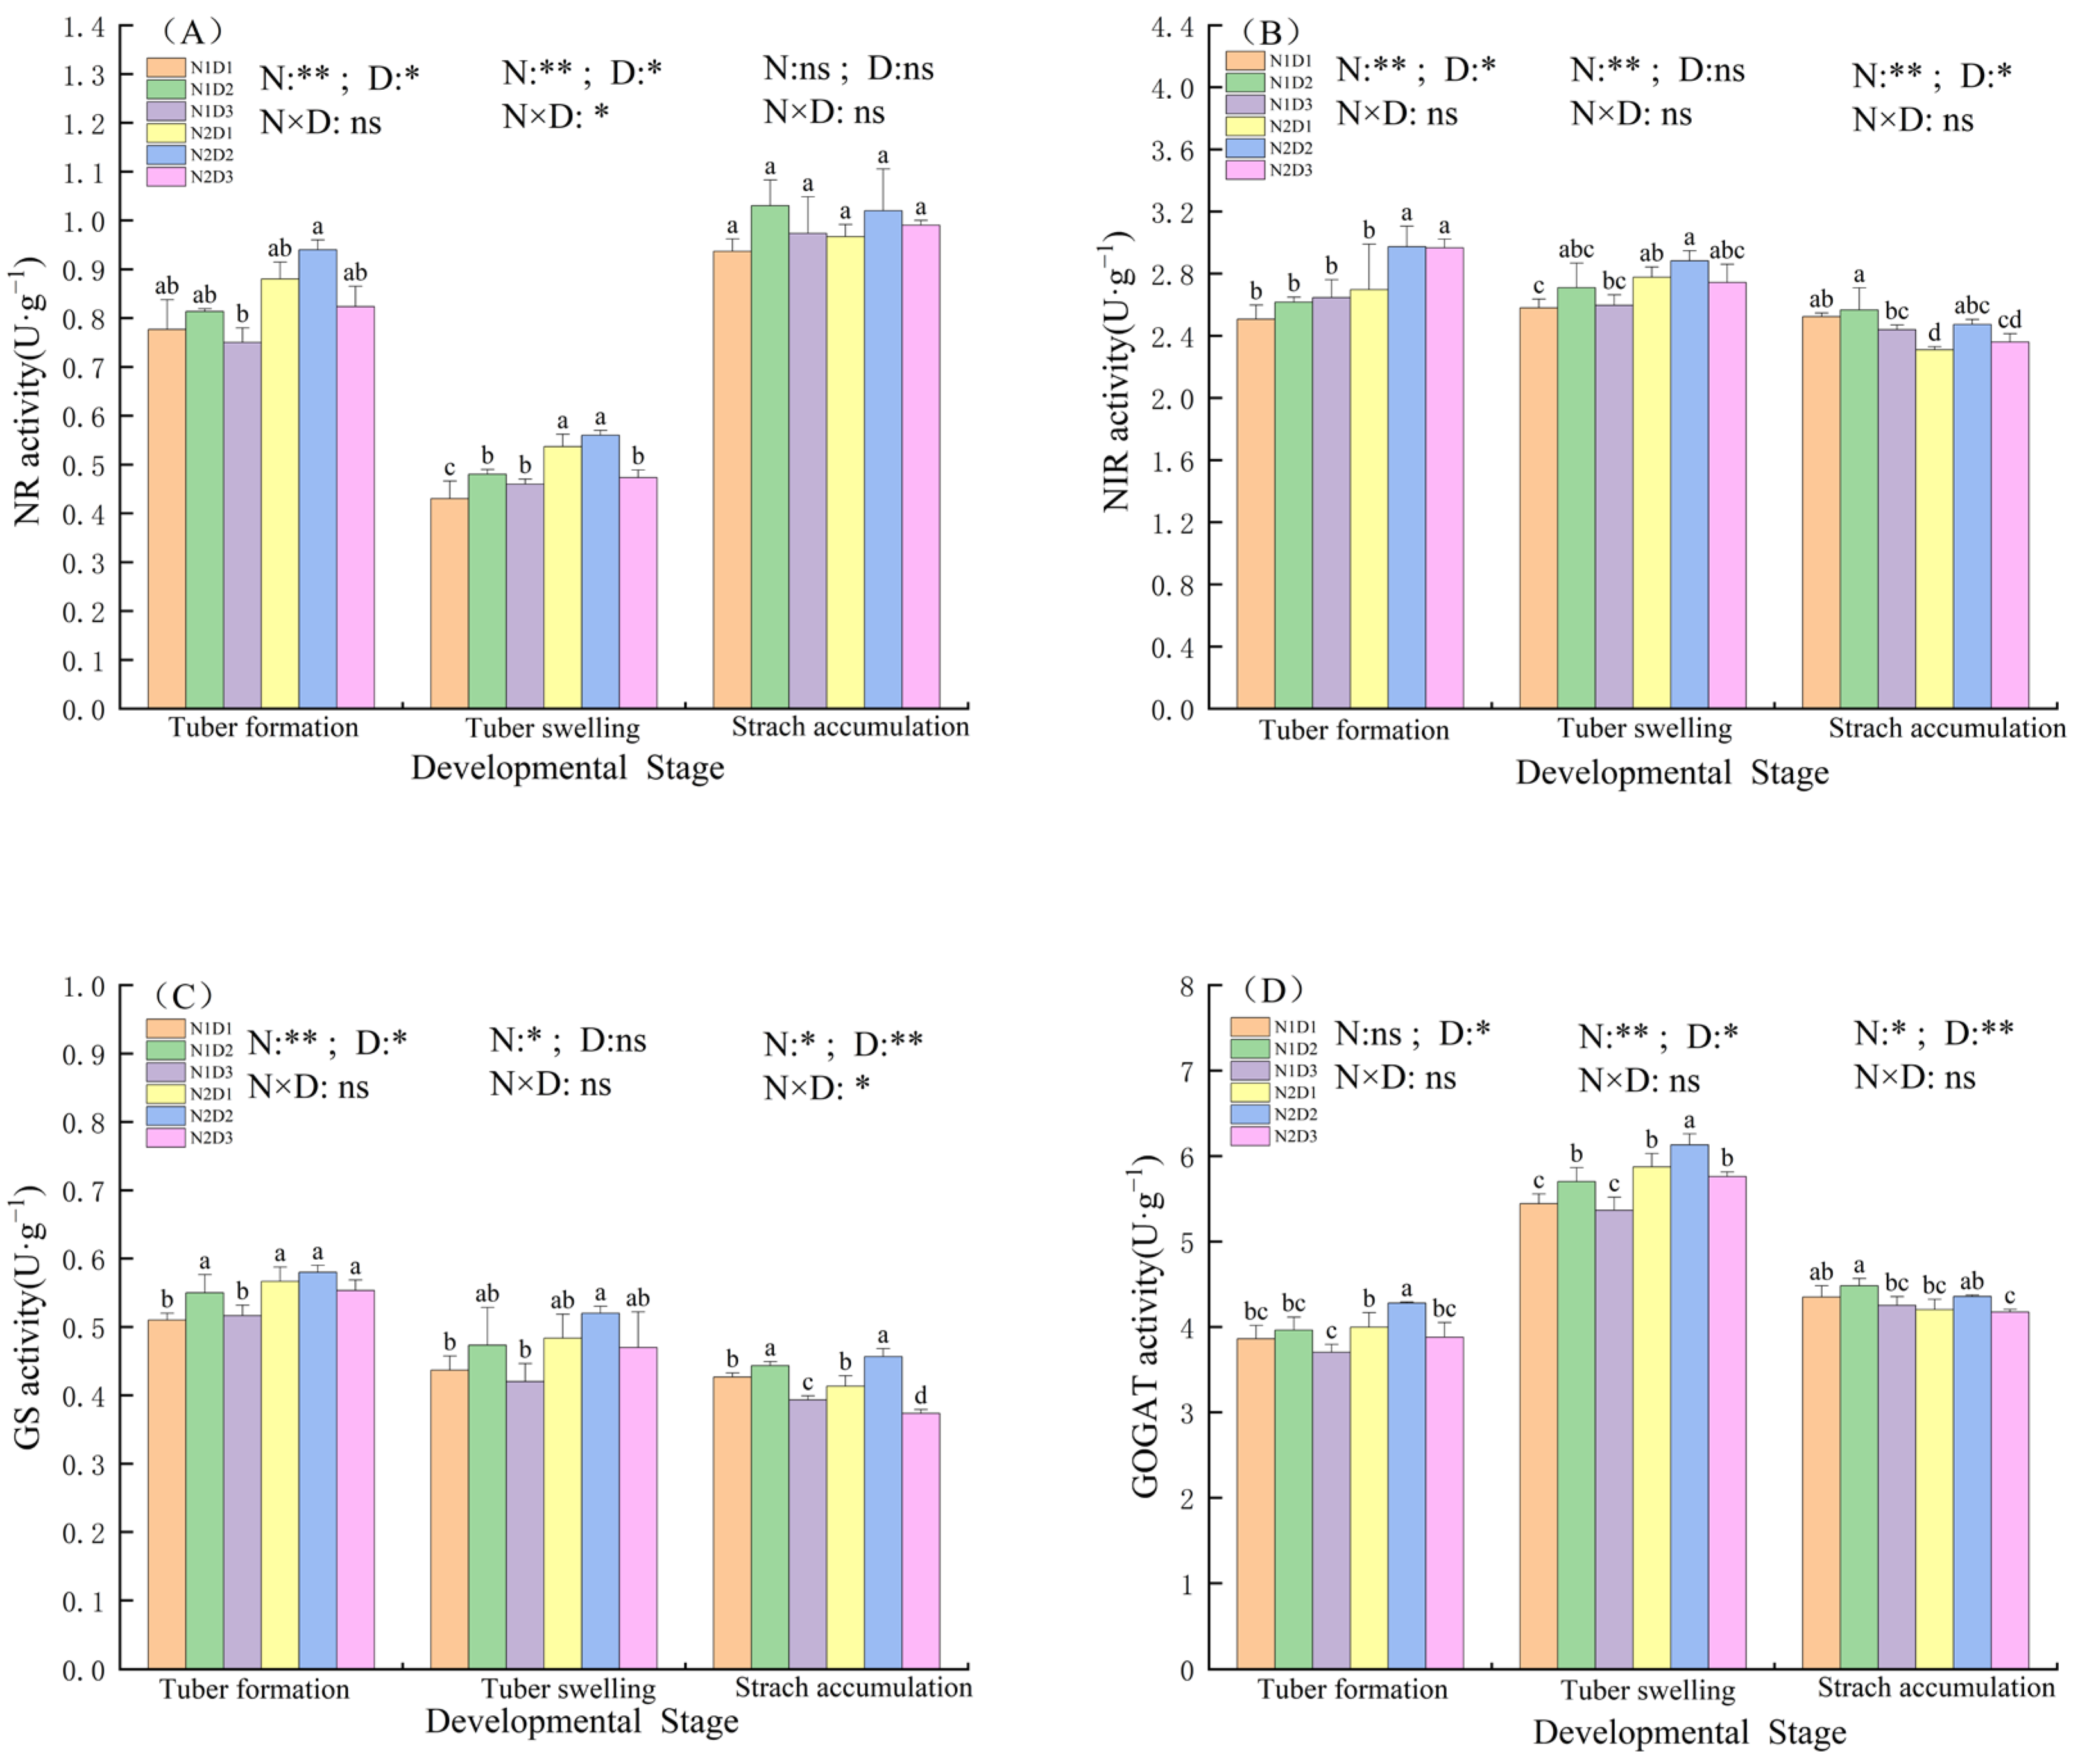
As shown in Figure 4A, the NR activity of potato leaves decreased first and then increased during the growth period. At the tuber formation stage, the nitrate reductase activity of potato leaves in each treatment was greater than that of N2 treatment and N1 treatment, but the difference between treatments did not reach a significant level under the same nitrogen application rate or planting density. Compared with N1D1 treatment, N1D2 and N1D3 treatments were significantly increased by 11.63% and 6.98%, respectively. From the tuber formation stage to the tuber swelling stage, the effect of nitrogen fertilization rate on the NR of potato leaves was extremely significant. The effect of planting density on NR activity of potato leaves was significant. The interaction effect of the two was only significant at the tuber swelling stage.
As shown in Figure 4B, the NIR activity of potato leaves showed a downward trend during the growth period. In the tuber swelling stage, N2D1 treatment was significantly increased by 7.62% compared with N1D1. In the starch accumulation stage, N1D2 treatment was significantly increased by 5.19% compared with N1D3 treatment, N2D2 treatment was significantly increased by 7.07% compared with N2D1, and N1D1 treatment was significantly increased by 9.23% compared with N2D1 treatment. From tuber formation stage to starch accumulation stage, the effect of nitrogen fertilization rate on NIR activity of potato leaves was extremely significant. At the tuber formation stage and starch accumulation stage, the effect of planting density on the NIR activity of potato leaves was significant. The interaction effect of the two did not reach a significant level.
As shown in Figure 4C, nitrogen application rate and planting density also had an effect on GS activity in potato leaves. Compared with N1D1 and N1D3, N1D2 treatment was significantly increased by 7.84% and 6.44% in the tuber formation stage. At the tuber swelling stage, the differences between the tubers did not reach a significant level under the same nitrogen application rate and the same planting density. Compared with N1D1 and N1D3, N1D2 treatment significantly increased by 10.50~22.34% at the starch accumulation stage, the effect of nitrogen application rate on GS activity in potato leaves was extremely significant at the tuber formation stage, and the planting density was notably at a significant level. At the tuber swelling stage, the effect of nitrogen fertilization rate on GS activity in potato leaves was significant. During the starch accumulation stage, the effects of nitrogen application rate and planting density on GS activity of potato leaves were significant, the effect of nitrogen application rate was significant, and the planting density was extremely significant. In the starch accumulation period, the interaction effect between the two was significant.
As shown in Figure 4D, the activity of GOGAT in potato leaves showed a unimodal trend during the growth period. In the tuber formation stage, N2D2 treatment was significantly increased by 7.99% compared with N1D2 treatment. Compared with N1D1 and N1D3 treatments, N1D2 treatment was significantly increased by 4.72% and 6.21%, respectively, and N2 treatment was significantly increased by 7.90%, 7.54%, and 7.33%, respectively, under the same planting density. In the starch accumulation stage, N1D2 treatment was significantly increased by 5.33% compared with N1D3 treatment. At the tuber formation stage, the effect of planting density on the activity of potato leaves GOGAT was significant, the effect of nitrogen application rate on the activity of potato leaves was significant, and the planting density was extremely significant at the tuber swelling stage. In the starch accumulation stage, the effects of nitrogen application rate on the GOGAT activity of potato leaves were significant, the planting density was extremely significant, and the interaction effect between the two was not significant from the tuber formation stage to the starch accumulation stage.

3.3. Changes in Starch Synthase Enzymes Activities in Potato Leaves Under the Interaction of Nitrogen and Density

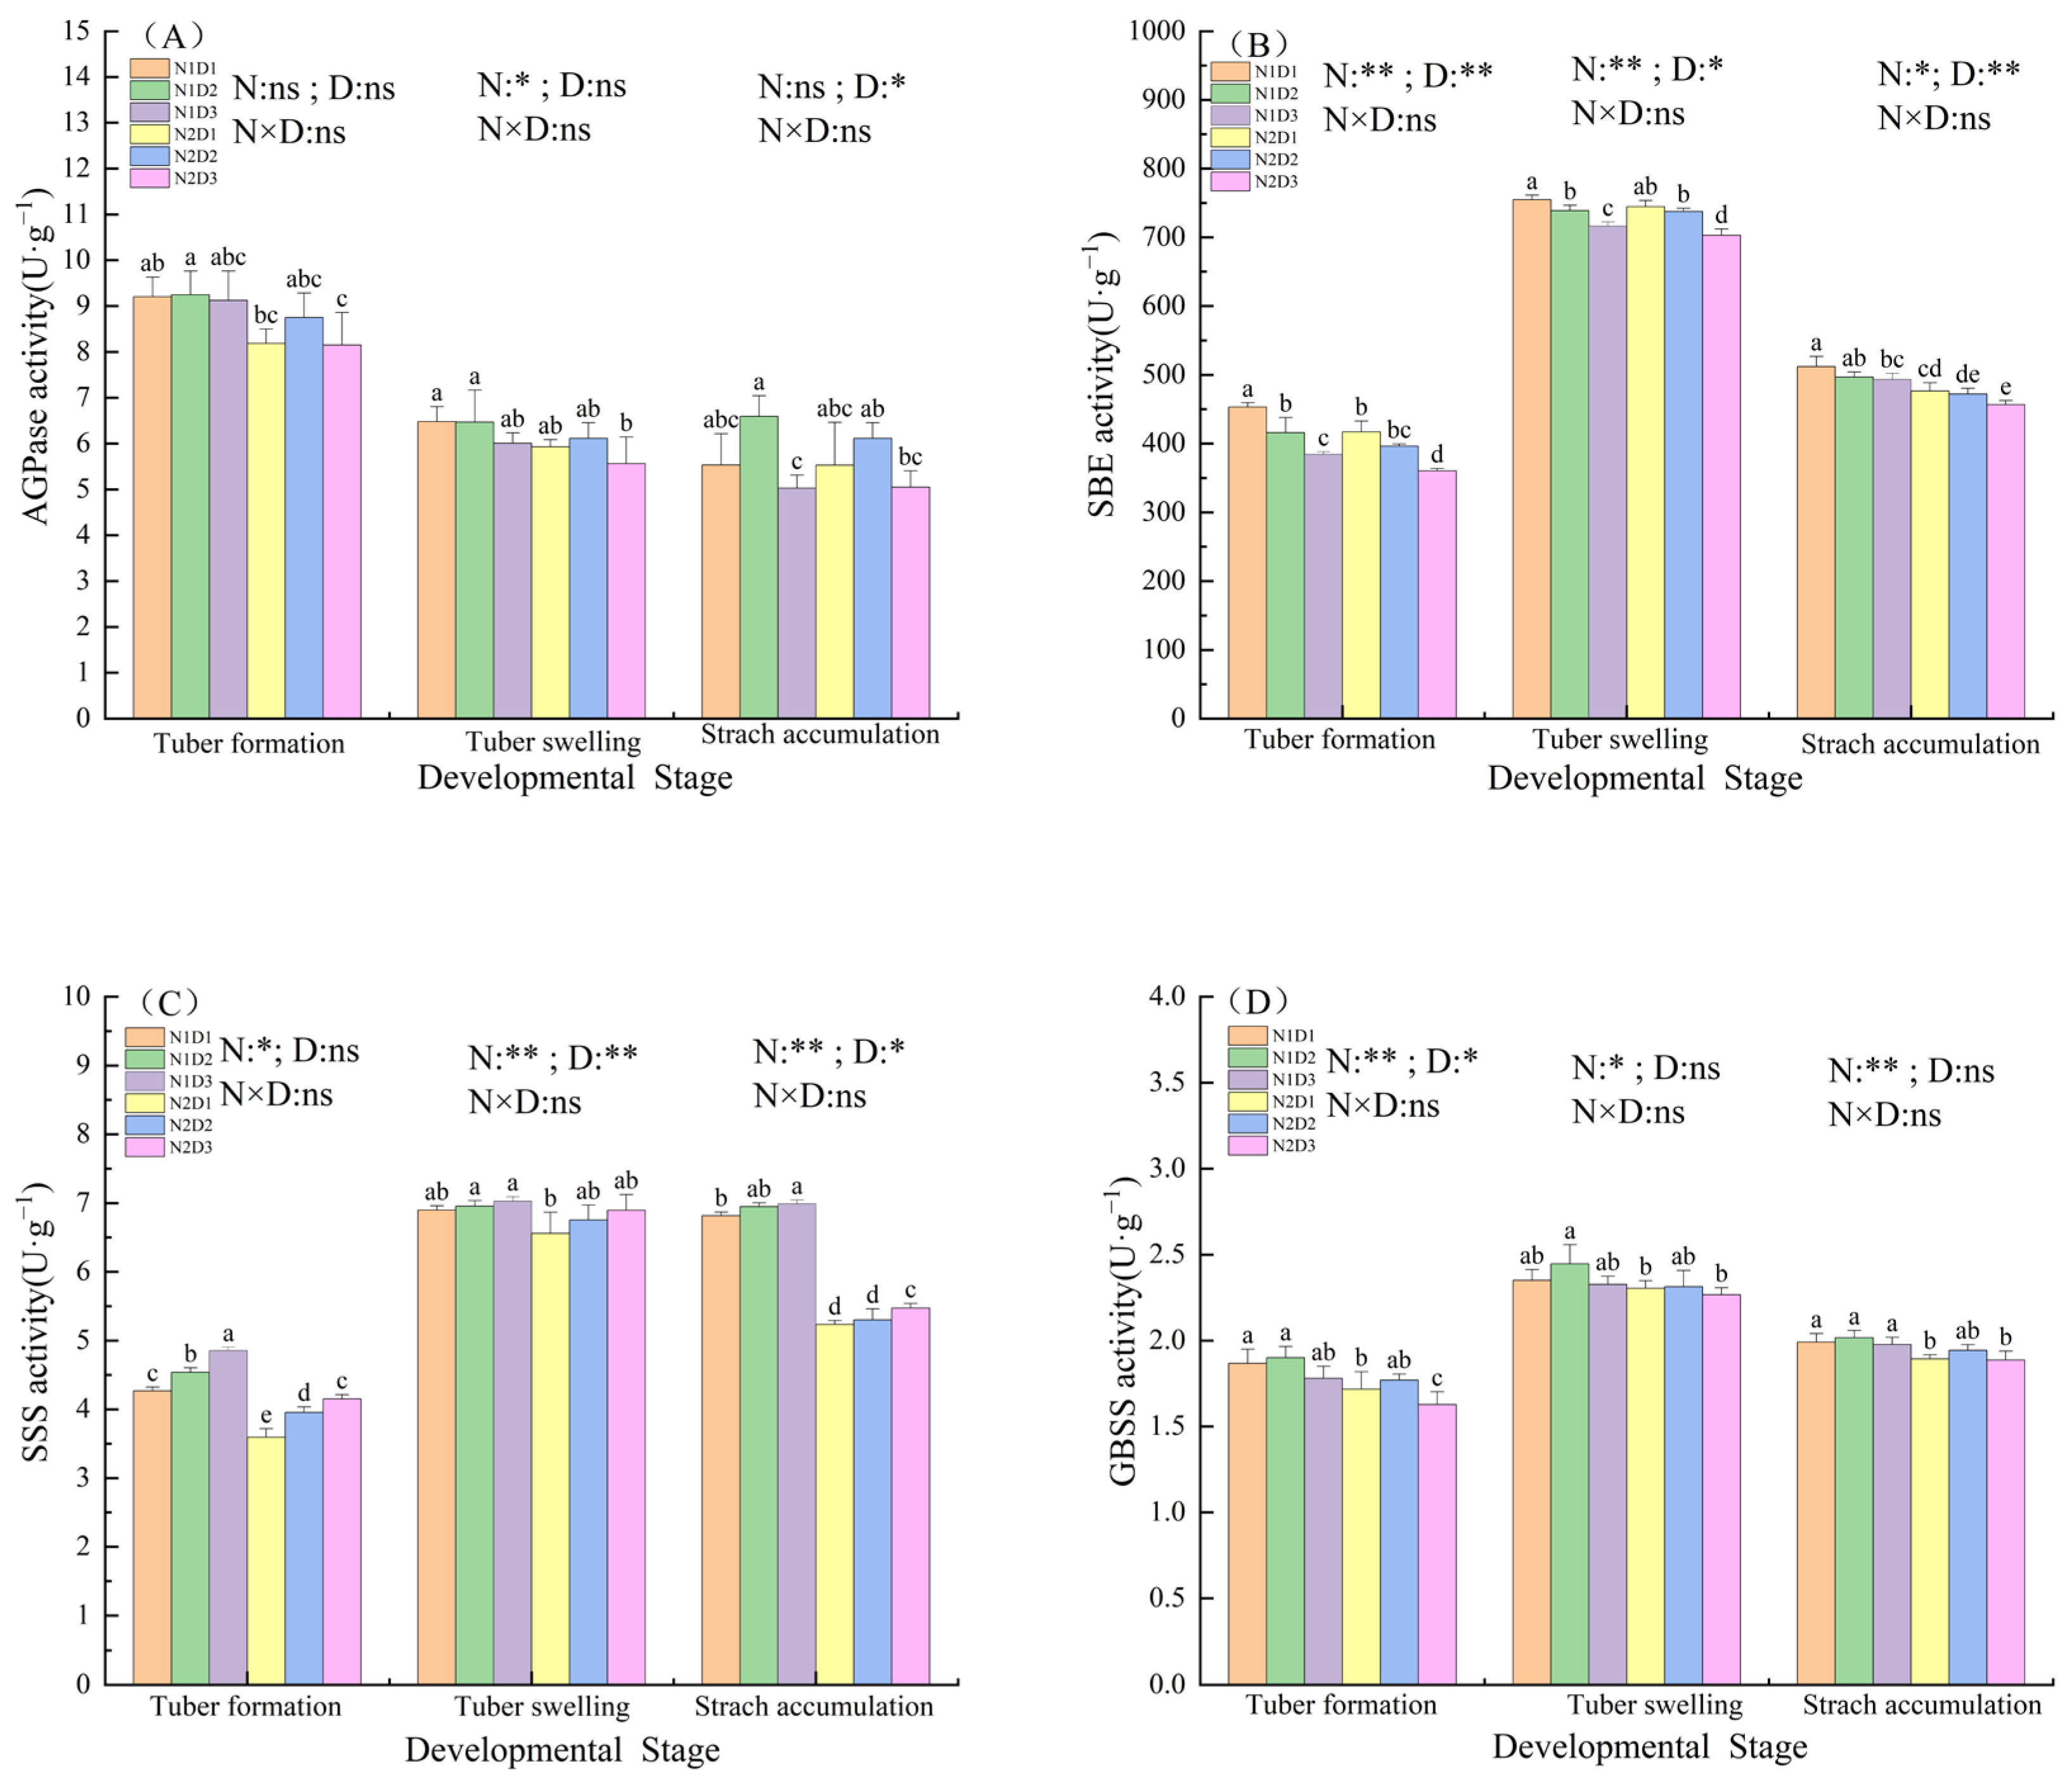
As shown in Figure 5A, the AGPase activity of potato leaves showed a decreasing trend with the advancement of growth period. In the starch accumulation stage, N1D2 treatment was significantly increased by 31.17% compared with N1D3 treatment. The differences between the other treatments did not reach a significant level. The effect of nitrogen fertilization rate on AGPase activity in potato leaves was significant. During the starch accumulation stage, the effect of planting density on AGPase activity in potato leaves was significant. However, the interaction effect did not reach a significant level in the three periods.
As shown in Figure 5B, the SBE activity of potato leaves increased first and then decreased during the growth period. In the tuber formation stage, N1D2 treatment was significantly increased by 8.14% compared with N1D3 treatment, and the N2D1 treatment and N2D2 treatments were significantly increased by 15.69% and 5.19%, respectively. In the tuber swelling stage, N1D2 treatment was significantly increased by 3.15% compared with N1D3 treatment, and the N2D1 treatment and N2D2 treatment were significantly increased by 5.89% and 4.89%, respectively. At the starch accumulation stage, the N1 treatment was significantly increased by 7.50%, 5.14%, and 8.06% compared with the N2 treatment under the same planting density. The effects of nitrogen application rate on SBE activity in potato leaves at the tuber formation stage and tuber swelling stage were extremely significant, and the planting density was significantly level. During the starch accumulation stage, the effects of nitrogen application rate and planting density on SBE activity in potato leaves were significant. However, from tuber formation stage to starch accumulation stage, the interaction effect of the two had no significant effect on SBE activity in potato leaves.
As shown in Figure 5C, the SSS activity of potato leaves increased first and then decreased during the growth period, and the N1 treatment showed no obvious downward trend from the tuber swelling stage to starch accumulation stage. At the tuber formation stage, the N1 treatment was significantly increased by 14.76~17.11% compared with the N2 treatment under the same planting density. At the starch accumulation stage, the N1 treatment was significantly increased by 30.19%, 31.07%, and 27.73% compared with the N2 treatment under the same planting density. The effects of nitrogen fertilization on SSS in potato leaves were significant from tuber formation stage to starch accumulation stage, at a significant level in tuber formation stage, and extremely significant level from the tuber swelling stage to starch accumulation stage. From the tuber swelling stage to starch accumulation stage, the effects of planting density on SSS in potato leaves were extremely significant, but the interaction effect of the two was not significant in the three growth stages.
As shown in Figure 5D, the GBSS activity of potato leaves increased first and then decreased during the growth period. At the tuber formation stage, N2D1 and N2D2 treatments were significantly increased by 5.53% and 8.81% compared with N2D3 treatment, respectively, N1D1 treatment was significantly increased by 8.74% compared with N2D1 treatment, and N1D3 treatment was significantly increased by 9.42% compared with N2D3 treatment. In the starch accumulation stage, N1D1 treatment was significantly increased by 5.11% compared with N2D1 treatment, and N1D3 treatment was significantly increased by 4.77% compared with N2D3 treatment. At the tuber formation stage, the effect of nitrogen application rate on GBSS activity in potato leaves was extremely significant, and the planting density was significantly high. At the tuber swelling stage, the effect of nitrogen application rate on the GBSS activity of potato leaves was significant, and the effect of nitrogen application rate on the GBSS activity of potato leaves was extremely significant at the starch accumulation stage, while the effect of planting density on the GBSS activity of potato leaves from the tuber swelling stage to the point starch accumulation stage did not reach a significant level. The interaction effect between the two did not reach a significant level in the three growth stages.

3.4. Potato Yield and Yield Components Under the Interaction of Nitrogen and Density

As shown in Figure 6, the number of tubers per plant in the two years showed that N1 treatment was greater than N2 treatment and showed a decreasing trend with the increase in planting density. Under the same planting density in 2022, the number of tubers per plant of N1 treatment was significantly increased by 16.47%, 10.55%, and 32.43%, respectively, compared with N2 treatment. Under the same nitrogen application rate, N1D1 and N1D2 treatments were significantly higher than N1D3 treatment by 9.86% and 4.54%, respectively. N2D1 treatment was significantly higher than N2D2 and N2D3 treatments by 3.36% and 29.43%, respectively. N2D2 treatment was significantly higher than N2D3 treatment by 25.23%. In 2023, under the same planting density, N1 treatment significantly increased by 20.30%, 26.07%, and 37.25% compared with N2 treatment; under the same nitrogen application rate, N1D1 significantly increased by 16.12% compared with N1D3 treatment, and N2D1 significantly increased by 36.31% compared with N2D3 treatment. The effect of nitrogen application rate on the number of potato tubers per plant in the two years was extremely significant, and the effect of planting density on the number of potato tubers per plant was significant. The interaction effect of the two did not reach a significant level.
The single potato quality of N2 treatment was higher than that of N1 treatment in the two years, and showed an increasing trend with the increase in planting density. In 2022, the single-tuber weights of the N1D2 and N1D3 treatments were significantly increased by 12.35% and 16.96%, respectively, compared with N1D1 treatment. The single-tuber weight of each treatment under N2 treatment did not reach a significant level. Under the same planting density, N2 treatment significantly increased by 19.10~32.67% compared with N1 treatment; in 2023, the single potato weight of N1D2 and N1D3 treatments were significantly higher than that of N1D1 treatment by 11.20% and 13.90%, respectively. The single potato weight of each treatment under N2 treatment did not reach a significant level. Under the same planting density, N2 treatment was significantly higher than N1 treatment by 22.76~32.04%; in 2022, the yield of N1D1 treatment was significantly increased by 27.15% compared with N2D1 treatment, and the yield of N1D2 treatment was significantly increased by 15.75% compared with N2D2 treatment. In 2023, the yield of N1D2 and N1D3 treatments were significantly increased by 22.55~27.60% compared with that of N1D1 treatment. N2D2 and N2D3 treatments significantly increased by 20.79–19.58% compared with N2D1 treatment, and N1D2 treatment significantly increased by 7.18% compared with N2D2 treatment. The effect of nitrogen application rate on the number of potato tubers per plant in the two years was extremely significant, and the effect of planting density on the number of potato tubers per plant was significant. The interaction effect of the two did not reach a significant level.
In 2022, the yield of N1D1 treatment was significantly increased by 27.15% compared with N2D1 treatment, and the yield of N1D2 treatment was significantly increased by 15.75% compared with N2D2 treatment. In 2023, the yield of N1D2 and N1D3 treatments were significantly increased by 22.55~27.60% compared with N1D1 treatment, N2D2 and N2D3 treatments were significantly increased by 20.79~19.58% compared with N2D1 treatment, and N1D2 treatment was significantly increased by 7.18% compared with N2D2 treatment. The amount of nitrogen application had a significant effect on the yield of potato in the two years. Planting density had a very significant effect on potato yield in both years. The interaction between the two had a significant effect on potato yield in 2022 and no significant effect in 2023.
The yield of N1D2 treatment was the highest in both years, which was 14,155.84 kg·hm−2 and 16,555.05 kg·hm−2, respectively. The results showed that the potato yield increase effect was better under the cultivation mode of 200 kg·hm−2 nitrogen application rate and 52,500 plants·hm−2 sowing density.
According to the direct regression coefficient of potato tuber yield and yield components (Table 1), the effect of yield components on tuber yield was as follows: tuber number per plant (0.3740) > single tuber weight (−0.0261), indicating that the effect of tuber number per plant on tuber yield was higher than that of single tuber weight. According to the indirect regression coefficient of potato tuber yield and each yield component factor, it can be seen that the contribution rate of single-potato quality to yield through the number of tubers per plant is the largest (0.2908). The interaction of nitrogen and density can improve the yield by changing the number of tubers and the quality of single potato, and the effect of increasing the number of tubers per plant is more obvious.

3.5. Potato Quality Under the Interaction of Nitrogen and Density

As shown in Table 2, nitrogen fertilizer and planting density had significant effects on potato tuber protein, starch, reducing sugar, vitamin C, and calcium content, but there was no significant difference among the same treatments. The protein content of N1D2 treatment was the highest, and N1D2 treatment was significantly higher than N1D1 treatment and N1D3 treatment by 7.73% and 18.40%, respectively. The starch content of N1D2 treatment was significantly higher than that of N1D1 treatment and N1D3 treatment by 2.96% and 4.37%, respectively. The starch content of N1D2 treatment was significantly higher than that of N2D2 treatment by 4.03%. Under the same planting density, the reducing sugar content of N1 treatment was significantly lower than that of N2 treatment, and N1 treatment was significantly lower than N2 treatment by 9.09~11.76%. Under the same planting density, the vitamin C content of N1D2 treatment was significantly higher than that of N1D1 treatment by 1.73%, and the vitamin C content of N2D1 treatment was significantly higher than that of N2D2 treatment and N2D3 treatment by 1.82% and 2.30%, respectively. Under the same planting density, the vitamin C content of N1 treatment was significantly higher than that of N2 treatment, and the vitamin C content of N1 treatment was significantly higher than that of N2 treatment by 3.37~7.07%. The calcium content of potato among treatments was N1D2 > N1D3 > N1D1 > N2D2 > N2D3 > N2D1, but there was no significant difference between treatments.

3.6. Correlation and Partial Least Squares Regression (PLS) Analysis of Photosynthetic Parameters, Photosynthetic Enzymes Activities, and Potato Tuber Yield Under the Interaction of Nitrogen and Density

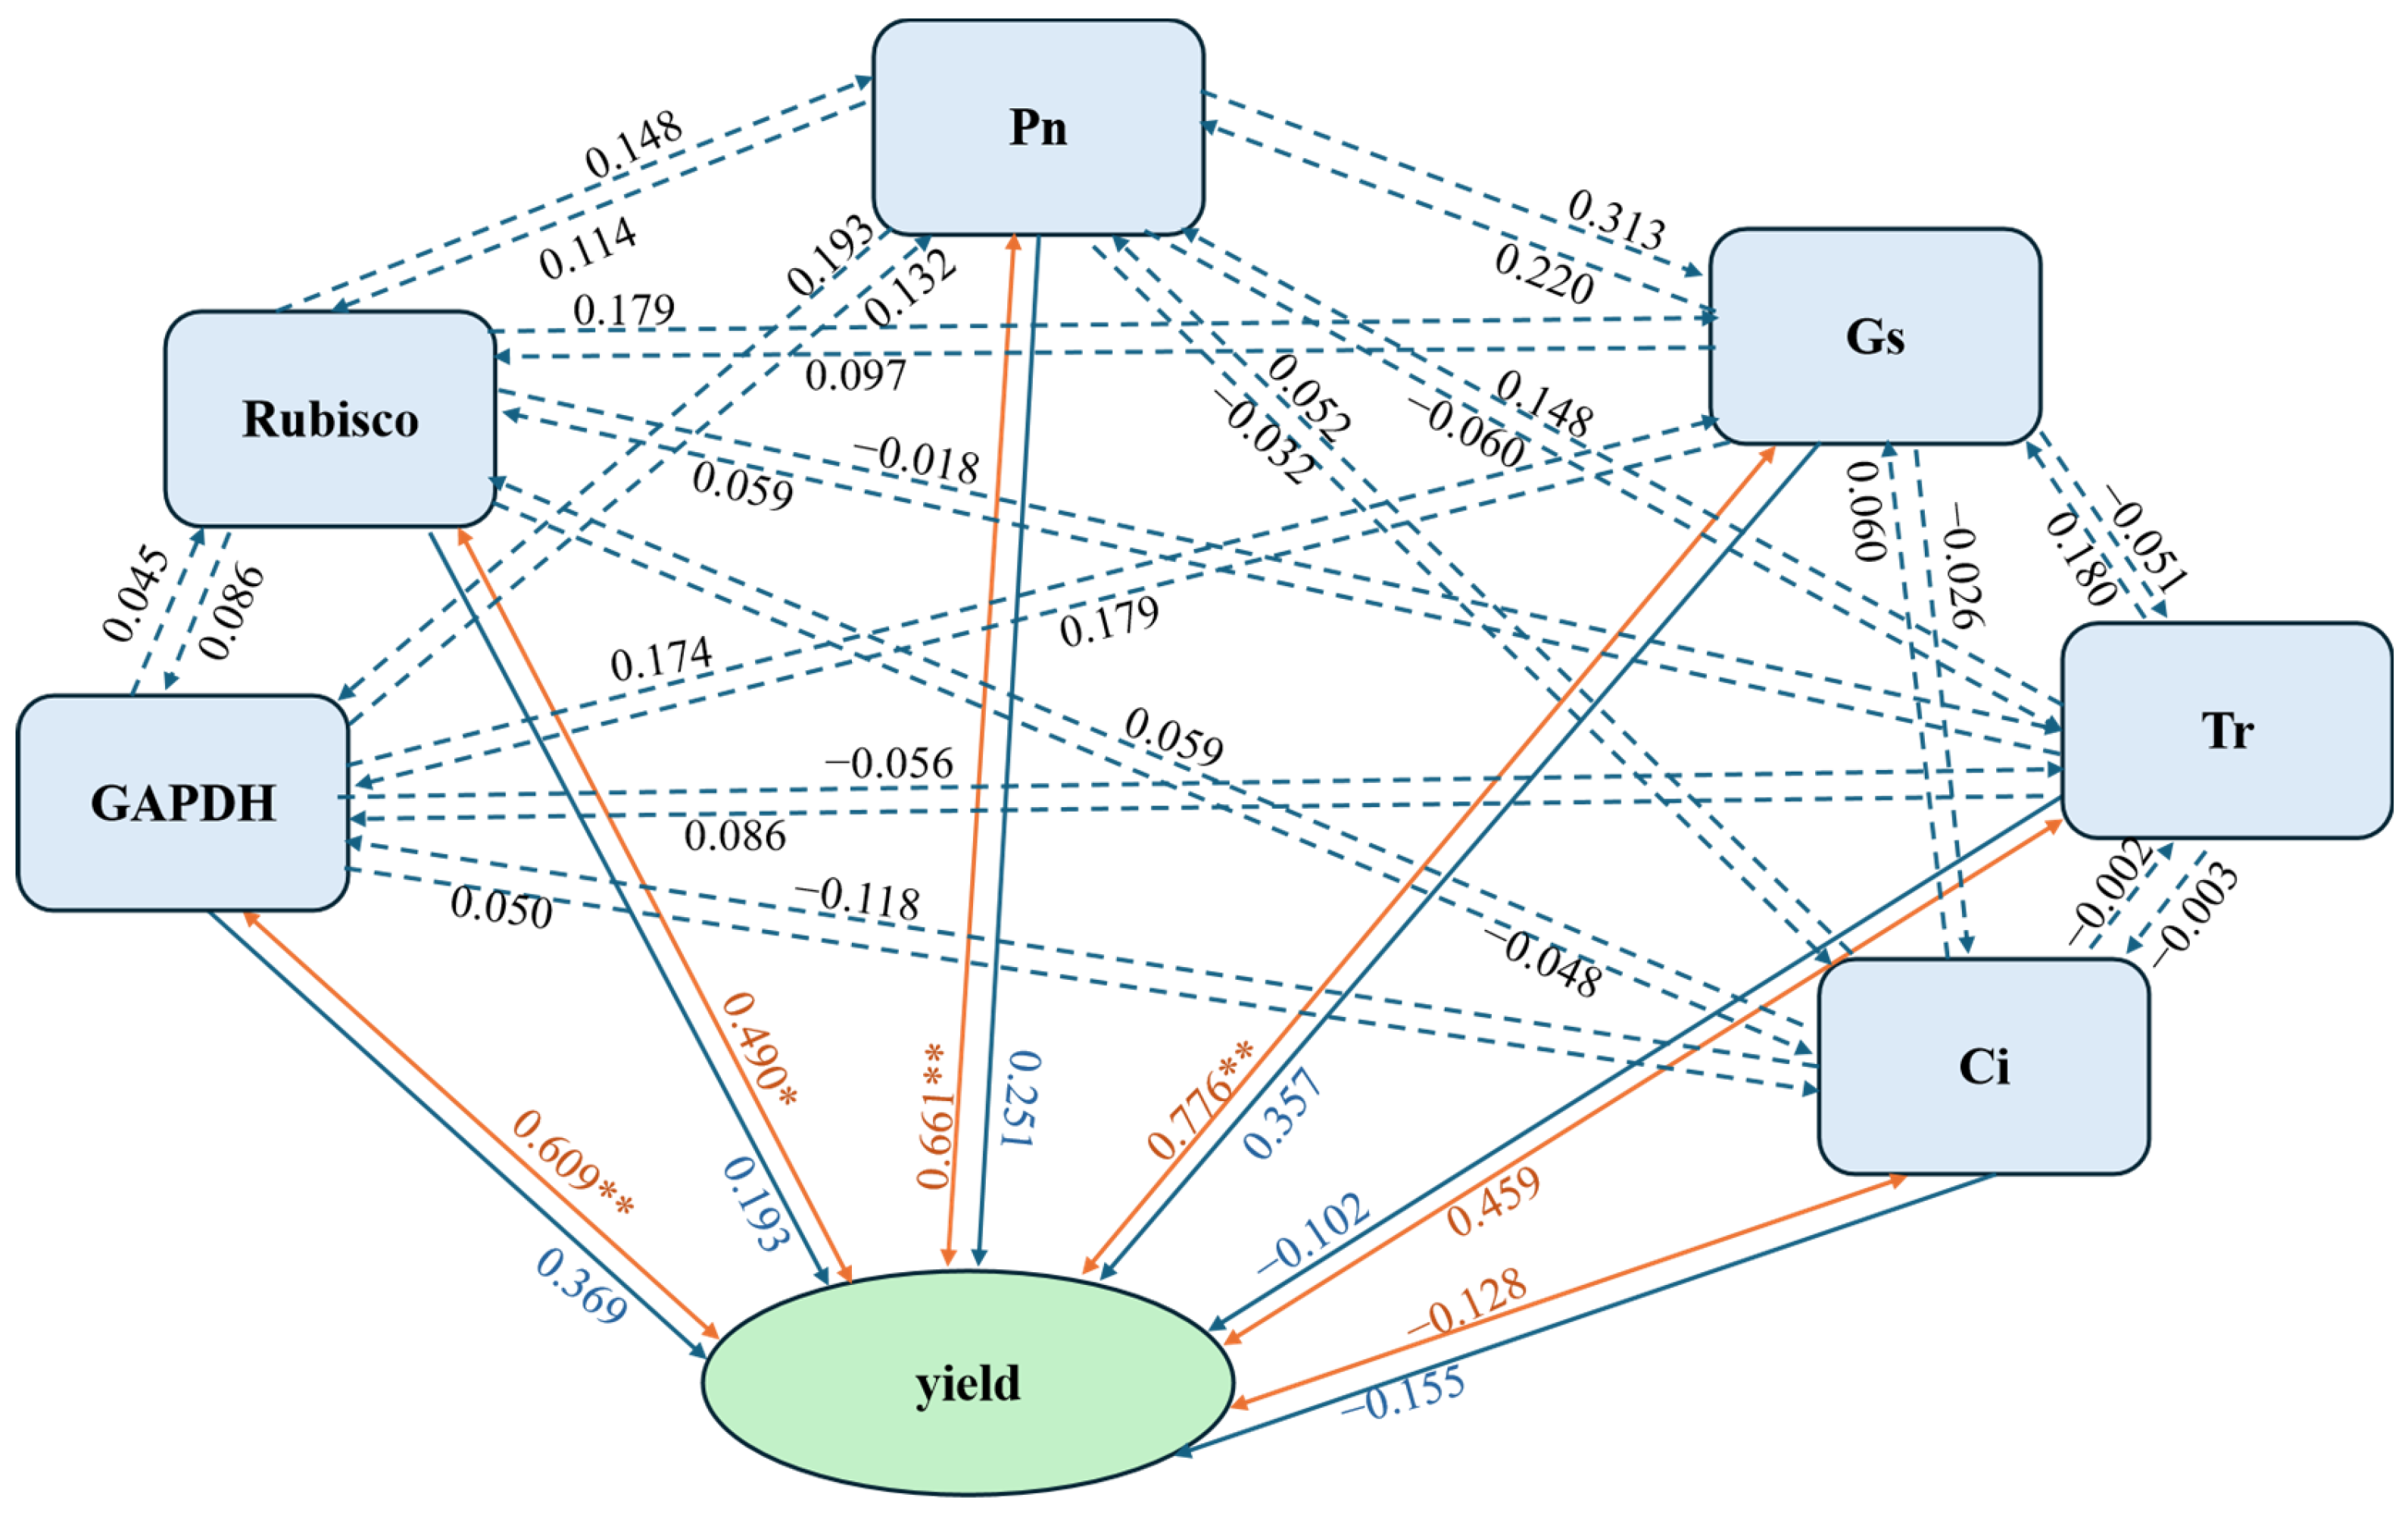
As shown in Figure 7, the direct regression coefficient of potato tuber yield, photosynthetic parameters, and enzyme activities were GAPDH (0.369) > Gs (0.357) > Pn (0.251) > Rubisco (0.193) > Ci (−0.155) > Tr (−0.102), indicating that Pn, Gs, and GAPDH enzymes had the greatest influence on potato tuber yield. It can be seen from the indirect regression coefficient of potato tuber yield, photosynthetic parameters, and enzyme activity that Pn contributed the most to potato tuber yield through Gs (0.313), Gs showed the largest contribution to potato tuber yield through GAPDH (0.179), Tr contributed the most to potato tuber yield through Gs (0.180), Ci contributed the most to potato tuber yield through GAPDH (−0.118), Rubisco contributed the most (0.179) to potato tuber yield through Gs, and GAPDH contributed the most (0.174) to potato tuber yield through Gs. These results indicated that different nitrogen–density interactions changed the activities of Gs, Pn, and GAPDH in potato, thereby increasing the yield of potato tubers.

3.7. Correlation and Partial Least Squares Regression (PLS) Analysis of Nitrogen Metabolism, Starch Synthase Enzymes Activities, and Potato Tuber Yield Under the Interaction of Nitrogen and Density

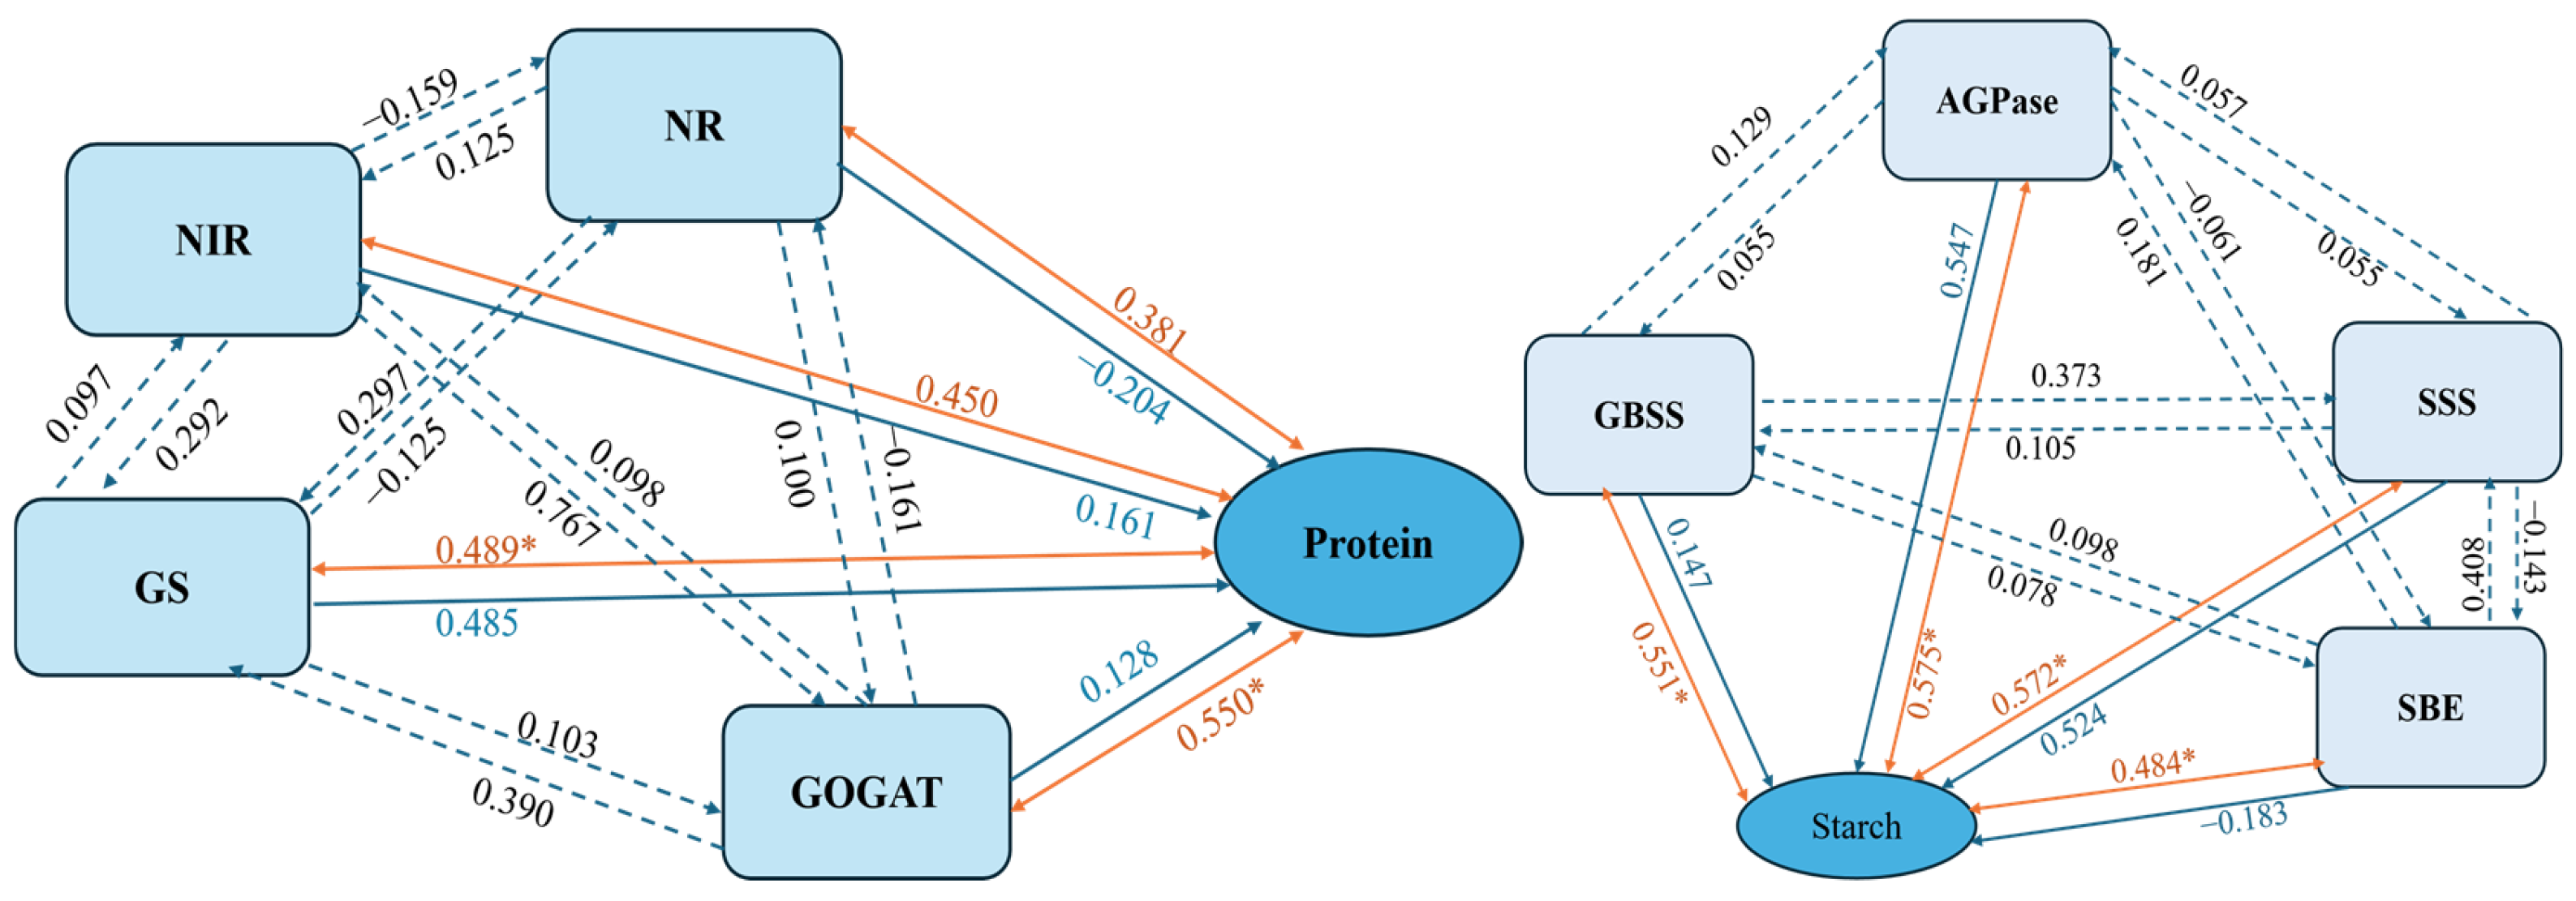
As shown in Figure 8, the direct regression coefficient of potato tuber yield and nitrogen metabolism enzymes activities were NIR (0.386) > GS (0.383) > GOGAT (0.176) > NR (0.025), indicating that the NIR enzyme had the greatest impact on potato tuber yield. It can be seen from the indirect regression coefficient between potato tuber yield and nitrogen metabolism enzymes activities that NIR contributed the most to potato tuber yield through GS (0.255), GOGAT showed the largest contribution to potato tuber yield through NIR (0.194), GS contributed the most to potato tuber yield through NIR (0.253), and GS contributed the most to potato tuber yield through NR (0.383), indicating that different nitrogen–density interactions changed the NIR and GS activities of potatoes and thus increased potato tuber yield.
The direct regression coefficient of potato tuber yield and starch synthesis enzyme activities were AGPase (0.659) > GBSS (0.147) > SSS (0.145) > SBE (0.110), indicating that AGPase had the greatest impact on tuber yield. It can be seen from the indirect regression coefficient between potato tuber yield and starch synthesis enzyme activities that AGPase contributed the most to potato tuber yield through GBSS (0.119), GBSS showed the largest contribution to potato tuber yield through AGPase (0.532), SSS contributed the most to potato tuber yield through GBSS (0.326), and SBE showed the largest contribution to potato tuber yield through AGPase (0.419), indicating that different nitrogen–density interactions changed the AGPase and GBSS of potato to improve potato tuber yield.

3.8. Correlation and Partial Least Squares Regression (PLS) Analysis of Nitrogen Metabolism, Starch Synthase Enzymes Activities, and Potato Tuber Quality Under the Interaction of Nitrogen and Density

As shown in Figure 9, the direct regression coefficient of potato tuber protein content and nitrogen metabolism enzymes activities were GS (0.485) > NR (−0.204) > NIR (0.161) > GOGAT (0.128), indicating that GS has the greatest influence on the protein content of tubers. It can be seen from the indirect regression coefficient of potato tuber protein content and nitrogen metabolism enzymes activities that NR showed the largest contribution to potato tuber protein content through GS (0.297), NIR showed the largest contribution to potato tuber protein content through GS (0.292), and GOGAT showed the largest contribution to potato tuber protein content through NIR (0.767). NR showed the largest contribution to tuber protein content through GS (0.297), indicating that different nitrogen–density interactions changed the GS activity of potatoes and thus increased the protein content of potato tubers.
The direct regression coefficient of potato tuber starch content and starch synthase enzymes activities were AGPase (0.547) > SSS (0.524) > SBE (−0.183) > GBSS (0.147), indicating that AGPase has the greatest influence on the starch content of tubers. It can be seen from the indirect regression coefficient of potato tuber starch content and starch synthase enzymes activities that AGPase had the largest contribution to the starch content of potato tubers (−0.061) through SBE, GBSS had the largest contribution to the starch content of potato tubers (0.373) through SSS, SSS had the largest contribution to the starch content of potato tubers (−0.143) through SWE, and SBE had the largest contribution to the starch content of tubers (0.408) through SSS, indicating that different nitrogen–density interactions changed the activities of AGPase and SSS in potatoes and thus increased the starch content.

4. Discussion

Photosynthetic rate, transpiration rate, stomatal conductance, and intercellular CO2 concentration are the key physiological indicators to judge the intensity of potato leaf photosynthesis [33]. The results of this experiment showed that the Pn, Gs, and Tr of each potato treatment decreased during the growth period, but the values of N1D2 treatment and N2D2 treatment were the largest; its activity is closely related to photosynthesis, nitrogen is closely related to photosynthesis, and the nitrogen content in leaves affects the photosynthetic pigment content in leaves and the activity of Rubisco [34]. It was found that under the same planting density, the activity of Rubisco in potato leaves showed N2 > N1 in the early growth period, and N1 > N2 in the late growth stage. The activity of Rubisco enzyme was D2 > D1 > D3 at the same nitrogen application rate (Figure 3), probably because the density factor plays a neutralizing role. GAPDH is one of the key enzymes in the Calvin cycle, and its activity has an effect on the photosynthetic rate; during the reduction phase of the C3 pathway, 3-phosphoglyceric acid is reduced by GAPDH to glyceraldehyde 3-phospho, it acts both as a product of chloroplast photosynthesis and as a substrate for subsequent ribulose-5-phosphate formation [35]. We found that the activity of GAPDH enzyme showed the same trend as that of Rubisco, showing a downward trend from the tuber swelling stage to the starch accumulation stage (Figure 3), which is basically consistent with the results of previous studies [36].
Previous studies have shown that rational application of nitrogen fertilizer can effectively increase the activity of nitrate reductase in potato functional leaves, while no nitrogen application or excessive nitrogen application will play a reverse role in the activity of nitrate reductase [37]. The results show that the activity of NR in potato leaves was N2 > N1 under the same planting density, and the NR enzyme activity of D2 treatment was the strongest under the same nitrogen application rate. It was found that NIR activity in potato leaves was N2 > N1 from the tuber formation stage to the tuber swelling stage, and N1 > N2 at the starch accumulation stage under the same planting density (Figure 4). This may be due to the nitrogen application rate exceeding the threshold, while the D2 treatment showed that the NIR enzyme activity was the strongest under the same nitrogen application rate, which was consistent with the trend of NR enzyme activity. Previous studies showed that high nitrogen treatment could significantly increase the activity of GS in functional leaves and grains of crops [17]. In this study, it was found that the enzyme activities of GS and GOGAT in potato leaves showed N2 > N1 from the tuber formation stage to the tuber swelling stage under the same planting density. As a result, the nitrogen metabolism intensity was weak, the enzyme activity was higher under the planting density of D2 treatment, and the nitrogen metabolism process was stronger, which was conducive to the growth and development of potato leaves.
AGPase is a key enzyme that catalyzes starch synthesis and is also a rate-limiting enzyme for starch synthesis, and the size of AGPase activity directly determines the amount of potato starch content synthesized [22]. Under the same planting density, AGPase activity is N1 > N2, and under the same nitrogen application rate, it is basically D2 > D1 > D3 (Figure 5). Through the correlation analysis between AGPase activity and potato starch content, it can be seen that its effect on potato starch content is the most significant. Previous studies have shown that SSS is a key enzyme controlling potato starch accumulation [36]. This study showed that the activities of GBSS and SBE were N1 > N2 at the same planting surface density, D2 > D1 > D3 under the same nitrogen application rate, and the correlation analysis between GBSS and SBE activity and potato starch content showed that its effect on potato starch content is significant.
Some studies have pointed out that under the condition of good water and fertilizer supply, theoretically higher photosynthesis should result in higher yield [37]. The results showed that Pn, Gs, Rubisco, and GAPDH were significantly positively correlated with potato yield (Figure 7). The correlation coefficient between Gs and tuber yield was the largest, while Pn and GAPDH activities do increase potato tuber yield. The results showed that the potato yield showed a parabolic trend with the increase in nitrogen application rate, and the appropriate amount of nitrogen fertilizer could effectively improve the potato yield, so the reasonable nitrogen application rate played a role in promoting the increase in yield [38]. It was found that the yield of potatoes was N1 > N2 under the same planting density (Figure 6). The results showed that the appropriate nitrogen application rate significantly increased the number of potatoes per plant, but the quality of potatoes per plant did not change significantly. Additionally, the number of tubers per unit area of potato increased with the increase in sowing density, but the tuber weight and commercial potato rate decreased. In this study, the number of potatoes per plant decreases with the increase in plant density, which may be due to the excessive setting of the density range. The quality of single potatoes was the same as that of previous studies, showing a trend of increasing with the increase in plant density. The results indicated that increasing the plant density appropriately was a direct and effective way to increase the yield.
Previous studies have shown that the interaction between density and nitrogen application has a significant effect on yield, and leaf nitrogen metabolism enzymes are closely related to crop growth and yield [19]. In this study, NIR, GOGAT, and GS were significantly positively correlated with potato tuber yield, and NR was positively correlated with tuber yield, but the correlation was not significant (Figure 8). The correlation coefficient between GOGAT and tuber yield was the largest, and it can be seen from the general analysis that NIR and GOGAT had the greatest direct effect on tuber yield. As the main storage material of some crop products and an important product of potato photosynthesis, starch is closely related to yield. The results showed that AGPase, GBSS, and SBE were significantly positively correlated with potato yield, and SSS was positively correlated with tuber yield but not significant (Figure 8). The correlation coefficient between AGPase and tuber yield was the largest. From the correlation and thorough analysis, it was found that starch synthase mainly increased the yield of potato tubers by changing AGPase under nitrogen–density interaction.
Research has pointed out that the accumulation of amino acids in potato tubers increases when the nitrogen fertilizer application rate and plant density increases, obtaining a higher biological yield of tubers, and at the same time ensuring that the harvest of protein per unit area does not affect the improvement of nutritional quality [39]. This study showed that the GOGAT enzyme had the greatest effect on potato tuber protein content (Figure 9). From the analysis, it can be concluded that the protein content of potato tubers is more affected by changes in the activity of the GS enzyme. However, this study found that the direct passage coefficient of the NR enzyme on the protein content of potato tubers was negative, which may be caused by the nitrogen fertilizer treatment being too little, the gradient being too large, and leaf enzyme activity. The study found that different nitrogen fertilizer application rates and plant density had significant effects on potato amylase activity and starch synthesis [40]. The results showed that potato starch increased first and then decreased with the increase in fertilizer amount, and this study found that the AGPase enzyme had the greatest effect on potato tuber starch content (Figure 9). It can be concluded that the starch content of potato tubers was more affected by the effects of AGPase enzyme activities, and it was found that the AGPase activity in the starch accumulation stage was the highest under N1D2 treatment, the enzyme activity was the highest under N1D3 treatment, and there was no significant difference between AGPase activity and N1D2 during the starch accumulation stage.
This study provides valuable insights into the interactive effects of nitrogen dose and plant density on potato yield, photosynthesis, and C–N metabolism under dryland conditions. However, several limitations must be acknowledged. First, the range of nitrogen doses and planting densities tested was limited, and no zero-nitrogen control was included, which may have restricted the generalizability of the results. Second, the study did not incorporate an environmental risk assessment, such as nitrogen balance, residual soil nitrogen, or greenhouse gas emissions, which are essential for evaluating the sustainability of fertilization strategies. Third, an economic analysis of different nitrogen–density combinations was not performed, which would be valuable for guiding practical recommendations for farmers. Finally, as the experiments were conducted under field conditions, year-to-year climatic variability may have influenced the outcomes. Future studies should therefore extend the range of treatments, integrate environmental and economic assessments, and validate the findings under diverse agro-ecological conditions.

5. Conclusions

The recommended nitrogen application rate for dryland potato production is approximately 200 kg·hm−2, with a planting density of about 52,500 plants·hm−2. Under these conditions, potato plants showed improved net photosynthetic rate, stomatal conductance, and the activities of key enzymes, including glyceraldehyde-3-phosphate dehydrogenase in photosynthesis, glutamine synthetase in nitrogen metabolism, and ADP-glucose pyrophosphorylase in starch synthesis. These physiological improvements promoted the synthesis and accumulation of protein and starch, thereby enhancing both yield and quality. Overall, this cultivation strategy supports the goal of achieving high-yield and high-quality potato production in the Loess hilly and gully region.

Author Contributions

Conceptualization, H.M. and L.L.; methodology, H.M. and C.W.; software, C.W. and X.T.; validation, J.X. and L.W.; formal analysis, C.W. and H.M.; investigation, C.W. and X.B.; resources, H.M. and L.L.; data curation, C.W. and H.M.; writing—original draft preparation, C.W. and H.M.; writing—review and editing, C.W., H.M. and L.L.; visualization, C.W. and X.T.; supervision, J.X., L.W. and Z.L.; project administration, H.M. and L.L.; funding acquisition, H.M. and L.L. All authors have read and agreed to the published version of the manuscript.

Funding

This research was funded by Research Program Sponsored by the State Key Laboratory of Aridland Crop Science of China (GSCS-2022-04), National Key R&D Program of China (2021YFD1900700, 2022YFD1900300), Innovation Group of Basic Research in Gansu Province (25JRRA807), Gansu Youth Science and Technology Fund (23JRRA1437), Gansu Agricultural University Public Recruitment Doctoral Scientific Research Startup Project (GAU-KYQD-2021-42).

Data Availability Statement

The original contributions presented in this study are included in the article. Further inquiries can be directed to the corresponding author(s).

Conflicts of Interest

The authors declare that they have no known competing financial interests or personal relationships that could have appeared to influence the work reported in this paper.

References

  1. Zhang, H.; Xu, F.; Wu, Y.; Hu, H.H.; Dai, X.F. Progress of potato staple food research and industry development in China (Review). J. Integr. Agric. 2017, 16, 2924–2932. [Google Scholar] [CrossRef]
  2. Villalba, A.; Martínez-Ispizua, E.; Morard, M.; Crespo-Sempere, A.; Albiach-Marti, M.R.; Calatayud, A.; Penella, C. Optimizing sweet potato production: Insights into the interplay of plant sanitation, virus influence, and cooking techniques for enhanced crop quality and food security. Front. Plant Sci. 2024, 15, 1357611. [Google Scholar] [CrossRef] [PubMed]
  3. Zhou, B.Y.; Yuan, J.L.; Liang, L.J.; Zhang, F.; Wang, Y.P. Genotype × environment interactions for potato yield and quality traits: Identification of ideotypes adapted in different ecological regions of Northwest China. BMC Plant Biol. 2025, 25, 737. [Google Scholar] [CrossRef] [PubMed]
  4. Zhang, R.X.; Zhang, J.F.; Li, T.; Xiong, S.T. Spatial Variability of Potato (Solanum tuberosum L.) Yield and quality on sand soil in the arid region of Northwest China. Appl. Ecol. Environ. Res. 2022, 20, 1969–1989. [Google Scholar] [CrossRef]
  5. Liu, X.; Li, S.; He, P.; Zhang, P.; Duan, Y. Yield and nutrient gap analysis for potato in northwest China. J. Agric. Sci. 2018, 156, 971–979. [Google Scholar] [CrossRef]
  6. Zhang, F.; Chen, M.R.; Fu, J.T.; Zhang, X.Z.; Li, Y.; Shao, Y.T.; Xing, Y.Y.; Wang, X.K. Coupling effects of irrigation amount and fertilization rate on yield, quality, water and fertilizer use efficiency of different potato varieties in Northwest China. Agric. Water Manag. 2023, 287, 108446. [Google Scholar] [CrossRef]
  7. Conti, S.; Borrelli, C.; Maddaluno, P.; Carputo, D.; Caruso, G.; Frusciante, L. Effect of mulching and plant density on out-of-season organic potato growth, yield and quality. Adv. Hortic. Sci. 2013, 27, 115–121. [Google Scholar] [CrossRef]
  8. Yang, J.; He, Y.; Luo, S.; Ma, X.; Li, Z.; Lin, Z.; Zhang, Z. Optimizing the optimal planting period for potato based on different water-temperature year types in the agro-pastoral ecotone of North China. Agriculture 2021, 11, 1061. [Google Scholar] [CrossRef]
  9. Wang, C.L.; Shen, S.H.; Zhang, S.Y.; Li, Q.Z.; Yao, Y.B. Adaptation of potato production to climate change by optimizing sowing date in the Loess Plateau of central Gansu, China. J. Integr. Agric. 2015, 14, 398–409. [Google Scholar] [CrossRef]
  10. Qin, S.H.; Li, L.L.; Wang, D.; Zhang, J.L.; Pu, Y.L. Effects of limited supplemental irrigation with catchment rainfall on rain-fed potato in semi-arid areas on the Western Loess Plateau, China. Am. J. Potato Res. 2013, 90, 33–42. [Google Scholar] [CrossRef]
  11. Assunçao, N.S.; Fernandes, A.M.; Soratto, R.P.; Mota, L.H.S.O.; Ribeiro, N.P.; Leonel, M. Tuber Yield and quality of two potato cultivars in response to nitrogen fertilizer management. Potato Res. 2021, 64, 147–166. [Google Scholar] [CrossRef]
  12. Jiang, L.L.; Jin, G.H.; Zhang, G.Z.; Zhang, C.Y. Tuber yield and french fry processing quality response of potatoes to nitrogen rate. Potato Res. 2022, 65, 255–271. [Google Scholar] [CrossRef]
  13. Ghosh, U.; Hatterman-Valenti, H.; Chatterjee, A. Russet potato yield, quality, and nitrogen uptake with enhanced efficiency fertilizers. Agron. J. 2019, 111, 200–209. [Google Scholar] [CrossRef]
  14. Li, S.C.; Chen, H.Y.; Jiang, S.C.; Hu, F.Q.; Xing, D.Y.; Du, B. Selenium and nitrogen fertilizer management improves potato root function, photosynthesis, yield and selenium enrichment. Sustainability 2023, 15, 6060. [Google Scholar] [CrossRef]
  15. Liang, Q.G.; Chen, H.R.; Chang, H.L.; Liu, Y.; Wang, Q.N.; Wu, J.T.; Liu, Y.H.; Kumar, S.; Chen, Y.; Chen, Y.L.; et al. Influence of planting density on sweet potato storage root formation by regulating carbohydrate and lignin metabolism. Plants 2023, 12, 2039. [Google Scholar] [CrossRef] [PubMed]
  16. Han, Z.; Lu, Y.; Zhao, Y.; Wang, Y.; Han, Z.; Han, Y.; Zhang, J. Analysis of relative expression of key enzyme genes and enzyme activity in nitrogen metabolic pathway of two genotypes of potato (Solanum tuberosum L.) under different nitrogen supply levels. Horticulturae 2022, 8, 769. [Google Scholar] [CrossRef]
  17. Yan, W.; Qin, J.; Jian, Y.; Liu, J.; Bian, C.; Jin, L.; Li, G. Analysis of potato physiological and molecular adaptation in response to different water and nitrogen combined regimes. Plants 2023, 12, 1671. [Google Scholar] [CrossRef]
  18. Gholamin, R.; Jamaati-e-Somarin, S.; Khayatnezhad, M.; Zabihi-e-Mahmoodabad, R. Quantitative and qualitative yield of potato tuber by used of nitrogen fertilizer and plant density. Am. Eurasian J. Agric. Environ. Sci. 2010, 9, 310–318. [Google Scholar]
  19. Yari, A.; Jamaati-e-Somarin, S.; Zabihi-e-Mahmoodabad, R. Response of agronomical, physiological, apparent recovery nitrogen use efficiency and yield of potato tuber (Solanum tuberosum L.), to nitrogen and plant density. Am. Eurasian J. Agric. Environ. Sci. 2010, 9, 16–21. [Google Scholar]
  20. Duan, W.X.; Zhang, H.Y.; Xie, B.T.; Wang, B.Q.; Hou, F.Y.; Li, A.X.; Dong, S.X.; Qin, Z.; Wang, Q.M.; Zhang, L.M. Nitrogen utilization characteristics and early storage root development in nitrogen-tolerant and nitrogen-susceptible sweet potato. Physiol. Plant. 2021, 173, 1090–1104. [Google Scholar] [CrossRef]
  21. Ding, K.X.; Shan, Y.; Wang, L.C.; Zhang, Y.; Tian, G.K. Transcriptomics combined with physiological analysis and metabolomics revealed the response of potato tuber formation to nitrogen. BMC Plant Biol. 2024, 24, 1109. [Google Scholar] [CrossRef]
  22. Kingori, G.G.; Nyamori, A.J.; Khasungu, I.D. Optimization of seed potato specific density, starch and dry matter contents and tuberization capacity of resultant plants through integrated irrigation, nitrogen and phosphorus management. J. Plant Sci. 2015, 3, 225–233. [Google Scholar]
  23. Wang, C.Y.; Meng, H.F.; Li, L.L.; Xie, J.H.; Wang, L.L.; Liu, B.X.; Tian, X.; Bao, X.Y. Effects of nitrogen-dense interaction on photosynthetic characteristics, dry matter accumulation and yield of dryland potatoes. Agric. Res. Arid Area. 2024, 42, 118–127. (In Chinese) [Google Scholar]
  24. Zhang, F.; Chen, M.R.; Zheng, Y.; Xie, Y.X.; Xing, Y.Y. Optimizing irrigation and fertilization to simultaneously improve potato tuber yield, water and fertilizer use efficiency and net income in northwest China. Agronomy 2024, 14, 1124. [Google Scholar] [CrossRef]
  25. Cheng, Z.Y.; Zhang, Z.A. Experimental Instructionf Plant Physiology; China Agricultural Press: Beijing, China, 2022. (In Chinese) [Google Scholar]
  26. Campbell, W.; Remmler, J. Regulation of corn leaf nitrate reductase: I. immunochemical methods for analysis of the rnzyme’s protein component. Plant Physiol. 1986, 80, 435–441. [Google Scholar] [CrossRef] [PubMed]
  27. Oaks, A.; Wallace, W.; Stevens, D. Synthesis and turnover of nitrate reductase in corn roots. Plant Physiol. 1972, 50, 649–654. [Google Scholar] [CrossRef] [PubMed]
  28. Kamachi, K.; Yamaya, T.; Mae, T.; Ojima, K. A role for glutamine synthetase in the remobilization of leaf nitrogen during natural senescence in rice leaves. Plant Physiol. 1991, 96, 411–417. [Google Scholar] [CrossRef]
  29. Masclaux-Daubresse, C.; Daniel-Vedele, F.; Dechorgnat, J.; Chardon, F.; Gaufichon, L.; Suzuki, A. Nitrogen uptake, assimilation and remobilization in plants: Challenges for sustainable and productive agriculture. Ann. Bot. 2010, 105, 1141–1157. [Google Scholar] [CrossRef]
  30. Cheng, F.M.; Zhong, L.J.; Sun, Z.X. Effect of temperature at grain-filling stage on starch biosynthetic metabolism in developing rice grains of early-indica. Sci. Agric. Sin. 2003, 36, 492–501. (In Chinese) [Google Scholar]
  31. Li, T.G.; Shen, B.; Chen, N.; Luo, Y.K. Effect of Q-enzyme on the chalkiness formation of rice grain. Acta Agron. Sin. 1997, 23, 338–344. (In Chinese) [Google Scholar]
  32. Zhou, C.T.; Zhang, R.Y.; Shi, M.F.; Zhang, W.N.; Yuan, W.Y. Effect of different iron fertilizer forms iron fertilizer on endogenous hormones, yield and quality of potato. J. Northwest AF Univ. 2022, 50, 42–49. (In Chinese) [Google Scholar]
  33. Yao, Y.B.; Lei, J.; Niu, H.Y.; Zhang, X.Y. Combined impact of elevated CO2 concentration and climatic warming on potato yield and quality in semi-arid regions. Potato Res. 2021, 64, 97–113. [Google Scholar]
  34. Bailey-Serres, J.; Pierik, R.; Ruban, A.; Wingler, A. The dynamic plant: Capture, transformation, and management of energy. Plant Physiol. 2018, 176, 961–966. [Google Scholar] [CrossRef] [PubMed]
  35. Cheema, H.N.; Ma, H.Y.; Wang, K.X.; Tang, M.X.; Zhang, K.Q.; Jahandad, A.; Saba, T.; Fang, X.T.; Shahzad, M.A.; Ansar, M.; et al. Deciphering nitrogen dynamics in aeroponics: Physio-biochemical and enzymatic responses influencing nitrogen use efficiency in contrasting potato genotypes. Sci. Hortic. 2024, 338, 113768. [Google Scholar] [CrossRef]
  36. Cheng, S.H.; Su, Z.H.; Xie, C.H.; Liu, J. Effects of variationin activities of starch-sugar metabolic enzymes on reducing sugar accumulation and processing quality of potato tubers. Sci. Agric. Sin. 2004, 37, 1904–1910. (In Chinese) [Google Scholar]
  37. Akkamis, M.; Caliskan, S. Responses of yield, quality and water use efficiency of potato grown under different drip irrigation and nitrogen levels. Sci. Rep. 2023, 13, 9911. [Google Scholar] [CrossRef]
  38. Getie, A.T.; Dechassa, N.; Tana, T. Response of potato (Solanum tuberosum L.) Yield and yield components to nitrogen fertilizer and planting density at haramaya, eastern ethiopia. J. Plant Sci. 2015, 3, 320–328. [Google Scholar]
  39. Tsibart, A.S.; Dillen, J.; Van Craenenbroeck, L.; Elsen, A.; Postelmans, A.; van de Ven, G.; Saeys, W. Scenarios for precision nitrogen management in potato: Impact on yield, tuber quality and post-harvest nitrate residues in the soil. Field Crops Res. 2024, 319, 109648. [Google Scholar] [CrossRef]
  40. Vasilyev, A.A. Dependence of the yield and quality of potato tubers in the forest-steppe zone of Southern Urals on the level of mineral nutrition and planting density. Russ. Agric. Sci. 2014, 40, 422–425. [Google Scholar] [CrossRef]
Figure 1. Precipitation in the experimental area during 2022, 2023 and 2001–2023 annual average.
Agriculture 15 02065 g001
Figure 2. Changes in photosynthetic rate (Pn) (A), transpiration rate (Tr) (B), stomatal conductance (Gs) (C) and intercellular CO2 concentration (Ci) (D) in potato leaves under the interaction of nitrogen and density. N1D1: nitrogen 200 kg·hm−2, planting density 37,500 plants·hm−2; N1D2: nitrogen 200 kg·hm−2, planting density 52,500 plants·hm−2; N1D3: nitrogen 200 kg·hm−2, planting density 67,500 plants·hm−2; N2D1: nitrogen 300 kg·hm−2, planting density 37,500 plants·hm−2; N2D2: nitrogen 300 kg·hm−2, planting density 52,500 plants·hm−2; and N2D3: nitrogen 300 kg·hm−2, planting density 67,500 plants·hm−2. N indicates the amount of nitrogen application, D indicates planting density, N × D indicates interaction between nitrogen application rate and planting density. * and ** indicate statistically significant p-values at less than 0.05 and 0.001, respectively, ns indicates no statistically significant change. The black vertical lines of different lengths represent the least significant difference (LSD) between treatments, while longer lines indicate larger significant differences.
Agriculture 15 02065 g002
Figure 3. Changes in ribose-1,5-bisphosphate carboxylase oxygenase (Rubisco) (A) and glyceraldehyde 3-phosphate dehydrogenase (GAPDH) activities (B) in potato leaves under the interaction of nitrogen and density. N1D1: nitrogen 200 kg·hm−2, planting density 37,500 plants·hm−2; N1D2: nitrogen 200 kg·hm−2, planting density 52,500 plants·hm−2; N1D3: nitrogen 200 kg·hm−2, planting density 67,500 plants·hm−2; N2D1: nitrogen 300 kg·hm−2, planting density 37,500 plants·hm−2; N2D2: nitrogen 300 kg·hm−2, planting density 52,500 plants·hm−2; and N2D3: nitrogen 300 kg·hm−2, planting density 67,500 plants·hm−2. N indicates the amount of nitrogen application, D indicates planting density, N × D indicates interaction between nitrogen application rate and planting density. Error bars indicate standard deviation. Different letters above bars indicate significant differences at p < 0.05 according to Duncan’s multiple range test. * and ** indicate statistically significant p-values at less than 0.05 and 0.001, respectively, ns indicates no statistically significant changes.
Agriculture 15 02065 g003
Figure 4. Changes in nitrate reductase (NR) (A), nitrite reductase (NIR) (B), glutamine synthetase (GS) (C) and glutamate synthase (GOGAT) (D) activities in potato leaves under the interaction of nitrogen and density. N1D1: nitrogen 200 kg·hm−2, planting density 37,500 plants·hm−2; N1D2: nitrogen 200 kg·hm−2, planting density 52,500 plants·hm−2; N1D3: nitrogen 200 kg·hm−2, planting density 67,500 plants·hm−2; N2D1: nitrogen 300 kg·hm−2, planting density 37,500 plants·hm−2; N2D2: nitrogen 300 kg·hm−2, planting density 52,500 plants·hm−2; and N2D3: nitrogen 300 kg·hm−2, planting density 67,500 plants·hm−2. N indicates the amount of nitrogen application, D indicates planting density, N × D indicates interaction between nitrogen application rate and planting density. Error bars indicate standard deviation. Different letters above bars indicate significant differences at p < 0.05 according to Duncan’s multiple range test. * and ** indicate statistically significant p-values at less than 0.05 and 0.001, respectively, ns indicates no statistically significant changes.
Agriculture 15 02065 g004
Figure 5. Changes in ADP-glucose pyrophosphorylase (AGPase) (A), starch branching enzyme (SBE) (B), soluble starch synthase (SSS) (C), granule-bound starch synthase (GBSS) (D) activities in potato leaves under the interaction of nitrogen and density. N1D1: nitrogen 200 kg·hm−2, planting density 37,500 plants·hm−2; N1D2: nitrogen 200 kg·hm−2, planting density 52,500 plants·hm−2; N1D3: nitrogen 200 kg·hm−2, planting density 67,500 plants·hm−2; N2D1: nitrogen 300 kg·hm−2, planting density 37,500 plants·hm−2; N2D2: nitrogen 300 kg·hm−2, planting density 52,500 plants·hm−2; and N2D3: nitrogen 300 kg·hm−2, planting density 67,500 plants·hm−2. N indicates the amount of nitrogen application, D indicates planting density, N × D indicates interaction between nitrogen application rate and planting density. Error bars indicate standard deviation. Different letters above bars indicate significant differences at p < 0.05 according to Duncan’s multiple range test. * and ** indicate statistically significant p-values at less than 0.05 and 0.001, respectively, ns indicates no statistically significant changes.
Agriculture 15 02065 g005
Figure 6. Potato yield and yield components under the interaction of nitrogen and density. N1D1: nitrogen 200 kg·hm−2, planting density 37,500 plants·hm−2; N1D2: nitrogen 200 kg·hm−2, planting density 52,500 plants·hm−2; N1D3: nitrogen 200 kg·hm−2, planting density 67,500 plants·hm−2; N2D1: nitrogen 300 kg·hm−2, planting density 37,500 plants·hm−2; N2D2: nitrogen 300 kg·hm−2, planting density 52,500 plants·hm−2; and N2D3: nitrogen 300 kg·hm−2, planting density 67,500 plants·hm−2. Error bars indicate standard deviation. N indicates the amount of nitrogen application, D indicates planting density, N × D indicates interaction between nitrogen application rate and planting density. Different letters above bars indicate significant differences at p < 0.05 according to Duncan’s multiple range test. * and ** indicate statistically significant p-values at less than 0.05 and 0.001, respectively, ns indicates no statistically significant changes.
Agriculture 15 02065 g006
Figure 7. Correlation and Partial Least Squares Regression (PLS) analysis of photosynthetic rate (Pn), transpiration rate (Tr), stomatal conductance (Gs), intercellular CO2 concentration (Ci), ribose-1,5-bisphosphate carboxylase oxygenase (Rubisco) activities, glyceraldehyde 3-phosphate dehydrogenase (GAPDH) activities, and potato tuber yield under the interaction of nitrogen and density. Solid lines of orange two-way arrows and orange numbers indicate the correlation and correlation coefficient between indicators; solid lines of blue one-way arrows indicate the direct relationship and direct regression coefficient between indicators; dotted lines of blue one-way arrows and black numbers indicate indirect relationship and indirect regression coefficient between indicators. * and ** indicate statistically significant p-values at less than 0.05 and 0.01, respectively.
Agriculture 15 02065 g007
Figure 8. Correlation and Partial Least Squares Regression (PLS) analysis of nitrate reductase (NR), nitrite reductase (NIR), glutamine synthetase (GS), glutamate synthase (GOGAT), ADP-glucose pyrophosphorylase (AGPase), starch branching enzyme (SBE), soluble starch synthase (SSS), granule-bound starch synthase (GBSS) activities, and potato tuber yield under the interaction of nitrogen and density. Solid lines of orange two-way arrows and orange numbers indicate the correlation and correlation coefficient between indicators; solid lines of blue one-way arrows indicate the direct relationship and direct regression coefficient between indicators; dotted lines of blue one-way arrows and black numbers indicate indirect relationship and indirect regression coefficient between indicators. ** indicates statistically significant p-values at less than 0.01, respectively.
Agriculture 15 02065 g008
Figure 9. Correlation and Partial Least Squares Regression (PLS) analysis of nitrate reductase (NR), nitrite reductase (NIR), glutamine synthetase (GS), glutamate synthase (GOGAT), ADP-glucose pyrophosphorylase (AGPase), starch branching enzyme (SBE), soluble starch synthase (SSS), and granule-bound starch synthase (GBSS) activities, potato tuber protein and starch content under the interaction of nitrogen and density. Solid lines of orange two-way arrows and orange numbers indicate the correlation and correlation coefficient between indicators; solid lines of blue one-way arrows indicate the direct relationship and direct regression coefficient between indicators; dotted lines of blue one-way arrows and black numbers indicate indirect relationship and indirect regression coefficient between indicators. * indicates statistically significant p-values at less than 0.05, respectively.
Agriculture 15 02065 g009
Table 1. Partial Least Squares Regression (PLS) analysis of yield and yield components under the interaction of nitrogen and density. X1 indicates number of potatoes per plant, X2 indicates single potato weight; Y indicates yield.
Indirect Coefficient
Yield ComponentsThe Coefficient of Direct Regression with yDirect CoefficientX1→yX2→y
X10.6270.374−0.2031
X20.615−0.02610.2908
Table 2. Potato quality under the interaction of nitrogen and density. N1D1: nitrogen 200 kg·hm−2, planting density 37,500 plants·hm−2; N1D2: nitrogen 200 kg·hm−2, planting density 52,500 plants·hm−2; N1D3: nitrogen 200 kg·hm−2, planting density 67,500 plants·hm−2; N2D1: nitrogen 300 kg·hm−2, planting density 37,500 plants·hm−2; N2D2: nitrogen 300 kg·hm−2, planting density 52,500 plants·hm−2; and N2D3: nitrogen 300 kg·hm−2, planting density 67,500 plants·hm−2. Values are means ± SD (n = 3). Different letters in the Table 2 indicate significant differences at p < 0.05 according to Duncan’s multiple range test.
TreatmentsProtein
(mg·g−1)
Starch
(%)
Sugar
(%)
Vitamin C
(mg·100 g−1)
Calcium
(mg·kg−1)
N1D12.33 ± 0.13 b18.55 ± 0.12 b0.3 ± 0.01 b15.64 ± 0.1 b14.96 ± 0.05 ab
N1D22.51 ± 0.1 a19.1 ± 0.14 a0.3 ± 0.01 b15.91 ± 0.09 a15.29 ± 0.5 a
N1D32.12 ± 0.04 c18.3 ± 0.11 c0.31 ± 0.01 b15.82 ± 0.03 ab15.23 ± 0.42 a
N2D12.4 ± 0.08 ab18.33 ± 0.17 bc0.33 ± 0.01 a15.13 ± 0.1 c14.45 ± 0.28 b
N2D22.4 ± 0.08 ab18.36 ± 0.09 bc0.34 ± 0.02 a14.86 ± 0.24 d14.79 ± 0.07 ab
N2D32.25 ± 0.04 bc18.2 ± 0.07 c0.35 ± 0.01 a14.79 ± 0.07 d14.73 ± 0.18 ab
Disclaimer/Publisher’s Note: The statements, opinions and data contained in all publications are solely those of the individual author(s) and contributor(s) and not of MDPI and/or the editor(s). MDPI and/or the editor(s) disclaim responsibility for any injury to people or property resulting from any ideas, methods, instructions or products referred to in the content.