Article

A Two-Stage Weed Detection and Localization Method for Lily Fields Targeting Laser Weeding

College of Information and Technology, Jilin Agricultural University, Changchun 130118, China
*
Author to whom correspondence should be addressed.
Agriculture 2025, 15(18), 1967; https://doi.org/10.3390/agriculture15181967
Submission received: 28 July 2025 / Revised: 2 September 2025 / Accepted: 16 September 2025 / Published: 18 September 2025
(This article belongs to the Special Issue Plant Diagnosis and Monitoring for Agricultural Production)

Abstract

The cultivation of edible lilies is highly susceptible to weed infestation during its growth period, and the application of herbicides is often impractical, leading to the rampant growth of diverse weed species. Laser weeding, recognized as an efficient and precise method for field weed management, presents a novel solution to the weed challenges in lily fields. The accurate localization of weed regions and the optimal selection of laser targeting points are crucial technologies for successful laser weeding implementation. In this study, we propose a two-stage weed detection and localization method specifically designed for lily fields. In the first stage, we introduce an enhanced detection model named YOLO-Morse, aimed at identifying and removing lily plants. YOLO-Morse is built upon the YOLOv8 architecture and integrates the RCS-MAS backbone, the SPD-Conv spatial enhancement module, and an adaptive focal loss function (ATFL) to enhance detection accuracy in conditions characterized by sample imbalance and complex backgrounds. Experimental results indicate that YOLO-morse achieves a mean Average Precision (mAP) of 86%, reflecting a 3.2% improvement over the original YOLOv8, and facilitates stable identification of lily regions. Subsequently, a ResNet-based segmentation network is employed to conduct semantic segmentation on the detected lily targets. The segmented results are utilized to mask the original lily areas in the image, thereby generating weed-only images for the subsequent stage. In the second stage, the original RGB field images are first converted into weed-only images by removing lily regions; these weed-only images are then analyzed in the HSV color space combined with morphological processing to precisely extract green weed regions. The centroid of the weed coordinate set is automatically determined as the laser targeting point.The proposed system exhibits superior performance in weed detection, achieving a Precision, Recall, and F1-score of 94.97%, 90.00%, and 92.42%, respectively. The proposed two-stage approach significantly enhances multi-weed detection performance in complex environments, improving detection accuracy while maintaining operational efficiency and cost-effectiveness. This method proposes a precise, efficient, and intelligent laser weeding solution for weed management in lily fields. Although certain limitations remain, such as environmental lighting variation, leaf occlusion, and computational resource constraints, the method still exhibits significant potential for broader application in other high-value crops.

1. Introduction

Lily is a perennial herb and a traditional medicinal and edible plant in China, with significant dietary and therapeutic value [1]. It possesses a sweet and mild nature and is traditionally used to tonify the middle qi, nourish yin and moisten the lungs, and calm the mind. Consequently, lily has wide-ranging applications in the food and pharmaceutical industries. Currently, the large-scale cultivation of medicinal and edible lilies in China mainly focuses on Lanzhou lily, which is the only sweet lily variety used for both edible and medicinal purposes in China and Southeast Asia [2]. Lily exhibits a relatively long growth cycle, particularly during the first-year seedling stage when plants are small and fragile, making them highly susceptible to field weeds. In the early stages of lily cultivation, weeds typically display high species diversity, large abundance, and irregular distribution, competing with lily plants for water, nutrients, and light, which can severely affect growth, yield, and quality [3]. Weed management is, therefore, a critical aspect of lily cultivation. Due to the medicinal and edible nature of lily, chemical herbicides are not suitable, and weed control largely relies on manual labor. Although manual weeding is safe, it is labor-intensive, inefficient, and costly, limiting its practicality for modern high-efficiency and intelligent agricultural production [4]. Accordingly, laser weeding has emerged as a promising solution for field management of lilies.
In laser weeding technology, accurate and rapid weed detection and precise localization are critical challenges that need to be addressed. Early studies have proposed various weed detection methods based on traditional image processing and machine learning. Aravind et al. [5] extracted green regions from RGB images and converted them into a binary format. Weeds were then identified using a threshold-based rule on the number of white pixels in the region of interest (ROI). Hamuda et al. [6] combined the HSV color space with morphological operations to classify crops and weeds, applying erosion and dilation to optimize target regions after threshold segmentation. Zhang et al. [7] proposed an image segmentation method based on GrabCut and local discriminant prediction, first removing the background using GrabCut, then clustering to segment weeds, and finally extracting low-dimensional features via a locally weighted maximum edge discriminant, with classification performed using a random forest. Wang et al. [8] employed support vector machines (SVM) for crop–weed classification, achieving an identification accuracy of up to 97%. Although these methods can achieve high accuracy under controlled conditions, their performance often deteriorates in actual field environments. This is primarily because these approaches rely on manually designed image features, such as color, shape, or texture, which lack adaptability under complex conditions, including changes in illumination, variations in crop leaf color across growth stages, diverse weed species, and crop occlusion, thus making high-precision real-time localization difficult.
Common image analysis methods for weed detection tasks include semantic segmentation and instance segmentation. Semantic segmentation classifies each pixel, enabling the precise delineation of crop and non-crop regions, which is suitable for scenarios requiring overall crop coverage information; however, it has limitations in distinguishing adjacent or overlapping targets. Instance segmentation not only differentiates pixel categories, but also individually annotates each target instance, making it suitable for handling densely packed or morphologically similar weeds and crops, although it is computationally more complex and has relatively slower inference speed. In practical field applications, the choice of method should consider crop type, target density, and real-time processing requirements. In this study, existing segmentation networks were applied in the lily–weed two-stage detection framework to achieve the accurate delineation of plant and non-plant regions, providing a foundation for subsequent weed extraction. Ferro et al. [9] compared the applications of instance and semantic segmentation in precise canopy segmentation and analyzed how segmentation errors (e.g., misclassification of shadows or background pixels) may affect agronomic metrics. Given that the two-stage approach of lily weed in this study also relies on accurate plant–non-plant segmentation for precise laser targeting, this research provides an important reference for the segmentation strategy used here.
With the continuous advancement of deep learning technologies, object detection networks have introduced significant breakthroughs in weed recognition within the field of agricultural computer vision. In general agricultural scenarios such as maize and soybean fields, deep learning detectors have demonstrated strong robustness, with mean Average Precision (mAP) values commonly exceeding 90%. Zoubek et al. [10] reported that detection networks achieved an accuracy of approximately 90% in weed and crop recognition, providing a feasible technical pathway for addressing detection challenges under complex field environments. Currently, deep detection networks can be broadly categorized into single-stage and multi-stage detectors. Single-stage detectors, such as the YOLO series, do not require region proposals and offer faster inference speed, making them particularly suitable for resource-constrained real-time scenarios, which aligns with the efficiency and real-time requirements of laser weeding systems. Existing studies have shown that integrating detection networks with segmentation networks and applying them in laser weeding systems can achieve effective weed control in various crop fields. For example, Gao et al. [11] improved DeepLabv3+, achieving a mIoU, mAP, and overall accuracy of 88.57%, 91.52%, and 97.10%, respectively, and conducted field experiments in cabbage fields with a laser system, attaining a weed recognition rate of 93.6%. Zhao et al. [12] enhanced the YOLOv8-Pose model, achieving mAP scores of 88.5% and 85.0%, and combined it with a CO2 laser to perform trials in strawberry fields, realizing a weed control rate of 92.6% with only 1.2% seedling damage. These studies demonstrate the strong application potential of detection and segmentation networks in laser weeding. However, these approaches primarily target regularly planted crops; in complex field backgrounds such as lily fields, where weeds are diverse, morphologically similar, and densely distributed, the difficulty of detection and precise laser targeting is further increased.
To enhance detection performance, numerous studies have focused on improving the YOLO series of models. Although models such as MKD8 [13] and Star-YOLO [14] have achieved significant improvements in general metrics by integrating complex modules or replacing backbone networks, their critical evaluation reveals certain limitations. First, these improvements often come at the cost of increased computational complexity, and their real-time performance on resource-constrained field laser weeding devices remains unclear. Second, their training and validation are mostly conducted on general-purpose or specific crop datasets, which cannot fully represent the extreme conditions in lily fields, where lily seedlings and multiple weed species are highly similar in morphology and densely co-exist. Similarly, although YOLO-CWD [15] emphasizes robustness in complex environments, its validation has not been specifically targeted at lily fields, where the feature distinction between targets and background interference is extremely low. Therefore, the direct relevance and effectiveness of these architectures for detection tasks in lily fields remain to be further validated. In Li et al. [16], ShuffleNetv2 and a hybrid attention mechanism were integrated to reconstruct the feature extraction module, while an EIoU loss function was designed to optimize multi-scale and overlapping target detection. In Montalvo et al. [17], the combination of the SE module with an adaptive spatial feature fusion mechanism optimized YOLOv4, achieving crop and weed detection rates of 91% and 92% in sesame fields, respectively. In Tao et al. [18], the proposed STBNA-YOLOv5 model integrated a Swin Transformer encoder with a BiFPN+NAM structure, raising mAP50 to 90.8%. Nevertheless, in real field environments where crops and weeds exhibit high morphological similarity and irregular distribution, these methods still face high missed detection rates, and the precise determination of laser targeting points remains challenging, thus constraining the overall weeding efficiency and robustness of the system.
To overcome the limitations of deep detection models in complex backgrounds, some studies have combined deep neural networks with traditional image processing methods to further enhance weed detection and localization in the field. For example, Rai et al. [19] employed U-Net to segment crop regions, combined with color indices and the OTSU adaptive thresholding method to finely extract vegetation areas, thereby improving the distinguishability of foreground targets. Calderara-Cea et al. [20] proposed a two-stage detection strategy, in which the first stage used CNNs to extract candidate regions, and the second stage further discriminated irregularly shaped weeds, ultimately achieving a detection accuracy of 97.16% and an average recognition rate of 89.94%. Although such methods have achieved certain improvements in detection stability, in lily fields—where crops and weeds exhibit extremely similar morphologies and are densely distributed—problems such as target confusion and frequent missed detections persist, which affect the precision of laser targeting and the overall system performance.
To address the problem of weed detection and localization in field conditions, this paper proposes a two-stage detection and localization method. The first stage focuses on lily crop detection, which constitutes the primary emphasis and core contribution of this study. Based on this step, crop regions are removed to obtain weed-only mask images. Subsequently, morphological completion and HSV color space processing are applied to the weed-only images (obtained after removing lily background regions) to further extract the spatial information of weeds, with the centroid designated as the laser weeding target point. It should be noted that although this study also explores and implements the processes of localization and laser targeting, the main contribution and research focus remain on the design and validation of the detection method. The main contributions of this study are as follows:
(1)
A high-quality image dataset for weed detection in lily fields was constructed, consisting of 1200 images collected from lily fields in Yuzhong, Lanzhou, Gansu Province, China. The dataset covers various natural conditions, including different times of day, lighting conditions, weed densities, and lily growth stages. All images were manually annotated with high precision. Built under real farmland conditions, the dataset is highly representative and provides reliable data support for the development and evaluation of weed detection algorithms in complex environments.
(2)
To address the challenges in lily images, such as small target size, significant pose variations, and distinct phenological stages, this study proposes a collaborative crop-region removal method based on detection and segmentation. In the detection stage, an improved YOLOv8-Morse network is constructed. Specifically, SPD-Conv and ATFI modules are introduced and modified in the feature extraction stage to enhance small object perception and alleviate the issue of sample imbalance. Meanwhile, a multi-scale feature fusion module (MSFM) is designed to strengthen cross-level feature interaction. On this basis, the MSFM is combined with the improved RCS-OSA structure to develop the RCS-MSA attention module, which serves as the core feature enhancement component of the network. In the segmentation stage, a lightweight ResNet18 network is adopted to achieve the high-precision extraction of lily regions while balancing boundary extraction accuracy and computational efficiency. Experimental results demonstrate that the proposed method can effectively separate lily and weed regions under complex field environments, significantly improving the accuracy of subsequent weed detection and providing reliable technical support for intelligent laser weeding.
(3)
A weed region extraction and localization strategy based on color space analysis was designed. After removing the lily crop regions, the remaining weed areas in the field image are accurately segmented using HSV color space thresholding combined with morphological processing. The centroid coordinates of the segmented weed regions are then calculated using spatial moments and used as laser targeting positions. This method effectively reduces the system’s reliance on deep models while enhancing the real-time performance and accuracy of weed targeting. Moreover, the method can be extended to other agricultural scenarios with similar crop–weed color characteristics, highlighting its broader applicability.

2. Materials and Methods

2.1. Dataset Acquisition

To address the specific requirements of lily object detection and semantic segmentation, two independent datasets were constructed from the same image collection, providing the basis for model training and evaluation. The data were acquired from a lily cultivation site in Yuzhong County, Lanzhou, Gansu Province, China, in late June 2024, during the early growth stages of lilies (single-leaf, double-leaf, and multi-leaf stages), when weed interference is most critical. RGB images were captured using an Intel RealSense D435i depth camera, manufactured by Intel Corporation, Santa Clara, CA, USA. mounted vertically at approximately 50–60 cm above ground level. The camera was configured with an RGB resolution of 1028 × 1028, a focal length of 3.5 mm, a field of view (FOV) of 87° × 58°, and a spectral response range of 400–700 nm. To ensure data consistency, automatic white balance and geometric calibration were applied before acquisition and illumination conditions and acquisition times were recorded. The data set covers sunny and cloudy conditions three times of the day: morning (6:00–9:00), noon (11:00–14:00), and evening (17:00–19:00). In total, 1200 images were collected, each simultaneously containing lily crops and weeds, including 600 in sunny conditions and 600 in cloudy conditions, with 300 for each time period. Representative samples of the different stages of lily growth are shown in Figure 1.
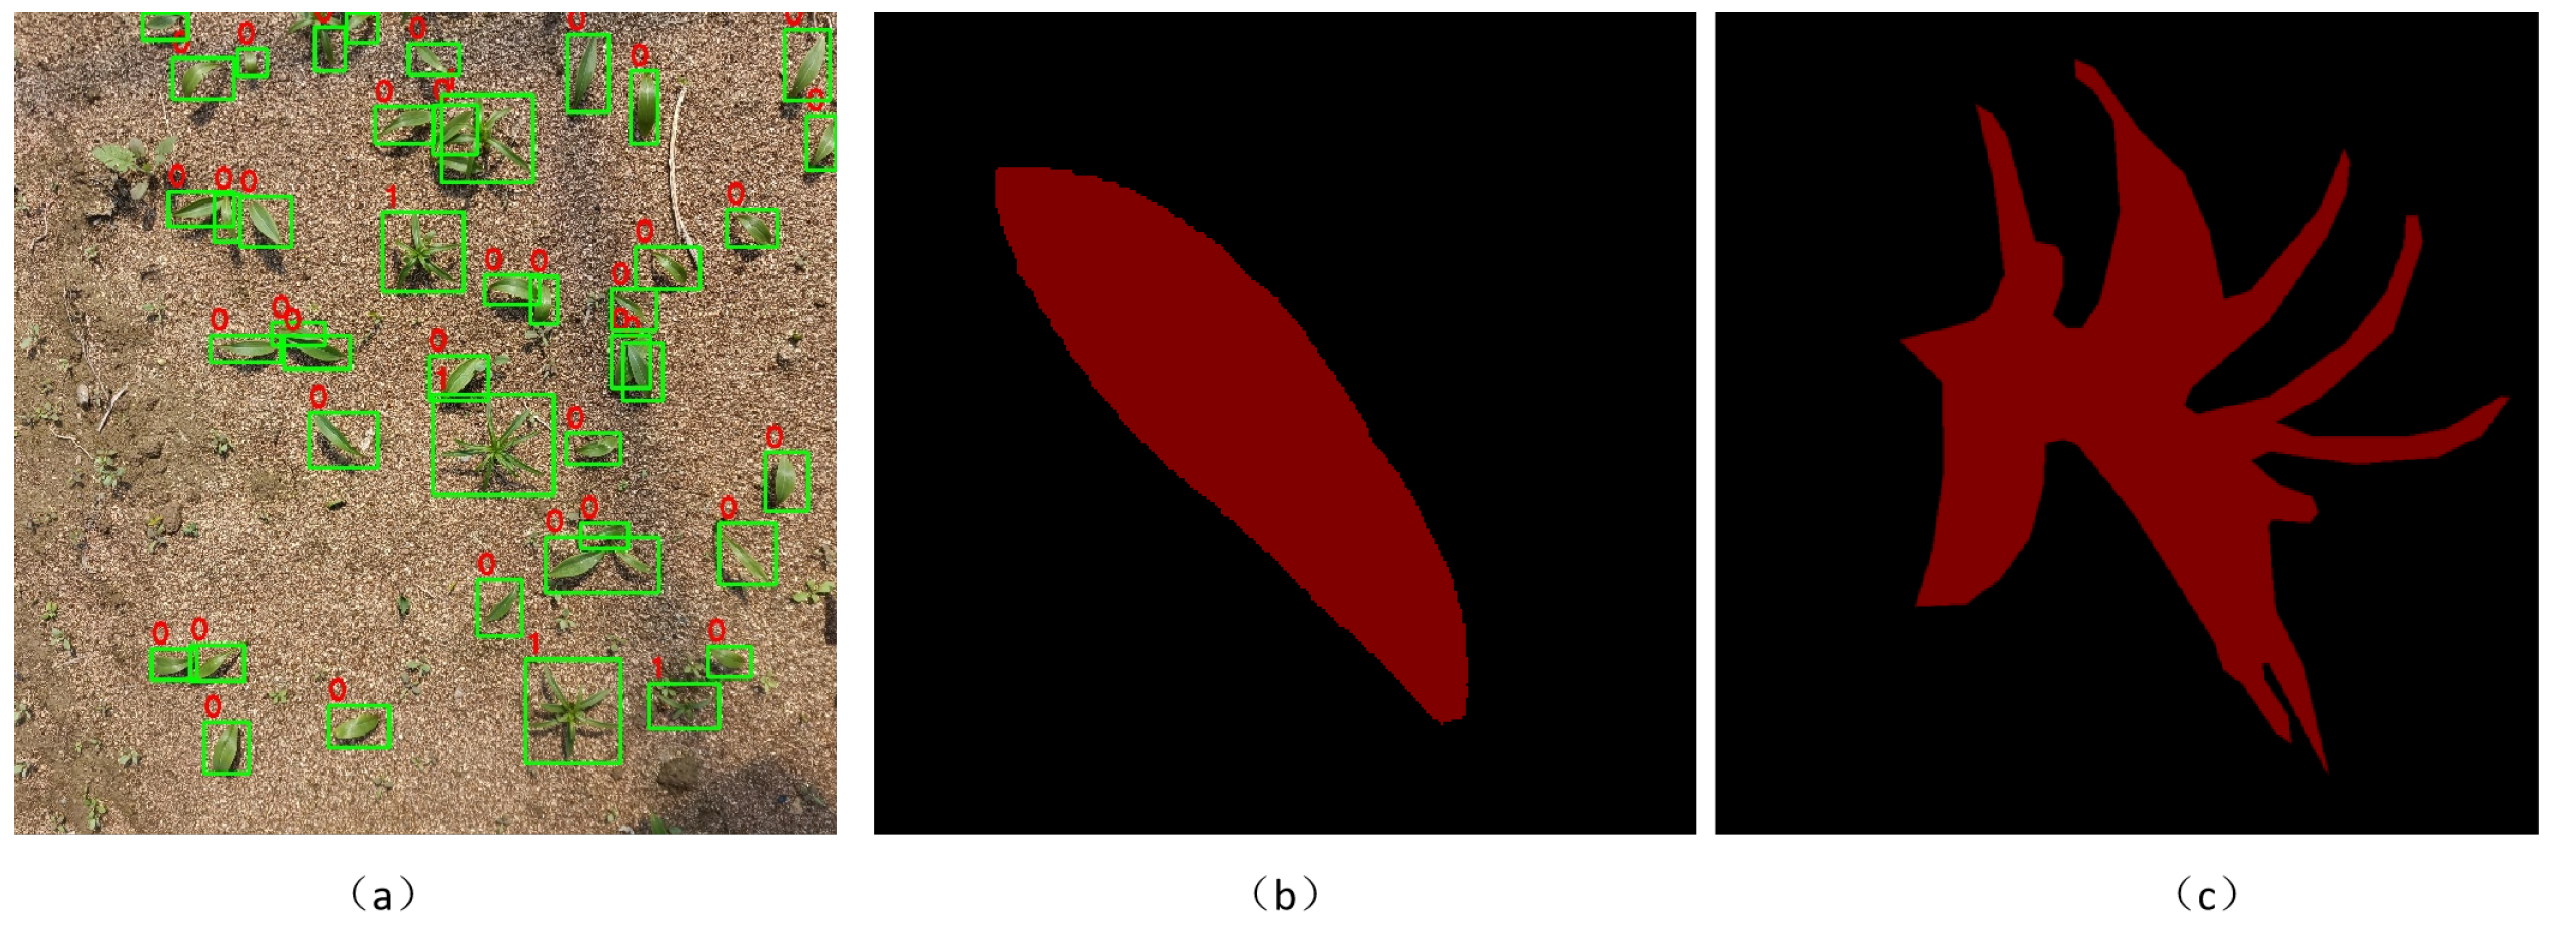
For data annotation, a single annotator used LabelImg 3.6 to generate bounding box annotations for the detection task. According to the growth stage of lilies, the dataset was divided into three categories: single-leaf, double-leaf, and multi-leaf stages. A total of 1200 images were annotated, including approximately 5000 single-leaf targets, 4900 double-leaf targets, and 4600 multi-leaf targets (as shown in Figure 2a). The dataset was split into training, validation, and test sets in a ratio of 7:2:1. To improve model robustness, data augmentation techniques such as contrast enhancement, brightness enhancement, random rotation (±20°), and color jitter were applied to the training and validation sets, expanding the detection dataset to five times its original size. For the segmentation task, approximately 1000 lily region samples were cropped from the original images, with a nearly balanced distribution across the three growth stages: 330 single-leaf, 340 double-leaf, and 330 multi-leaf samples (as shown in Figure 2b,c).The irregular polygon tool in LabelImg was employed to carefully delineate the contours of each target to generate segmentation masks. Considering the high sensitivity of segmentation to boundary accuracy, additional augmentations including horizontal flipping, geometric distortion, and elastic deformation were applied to the training and validation sets, enlarging the dataset to five times its original size and improving robustness under occlusion and illumination variations. Finally, the segmentation dataset was also split into training, validation, and test sets in a 7:2:1 ratio.

2.2. Workflow of the Dual-Stage Weed Detection Method

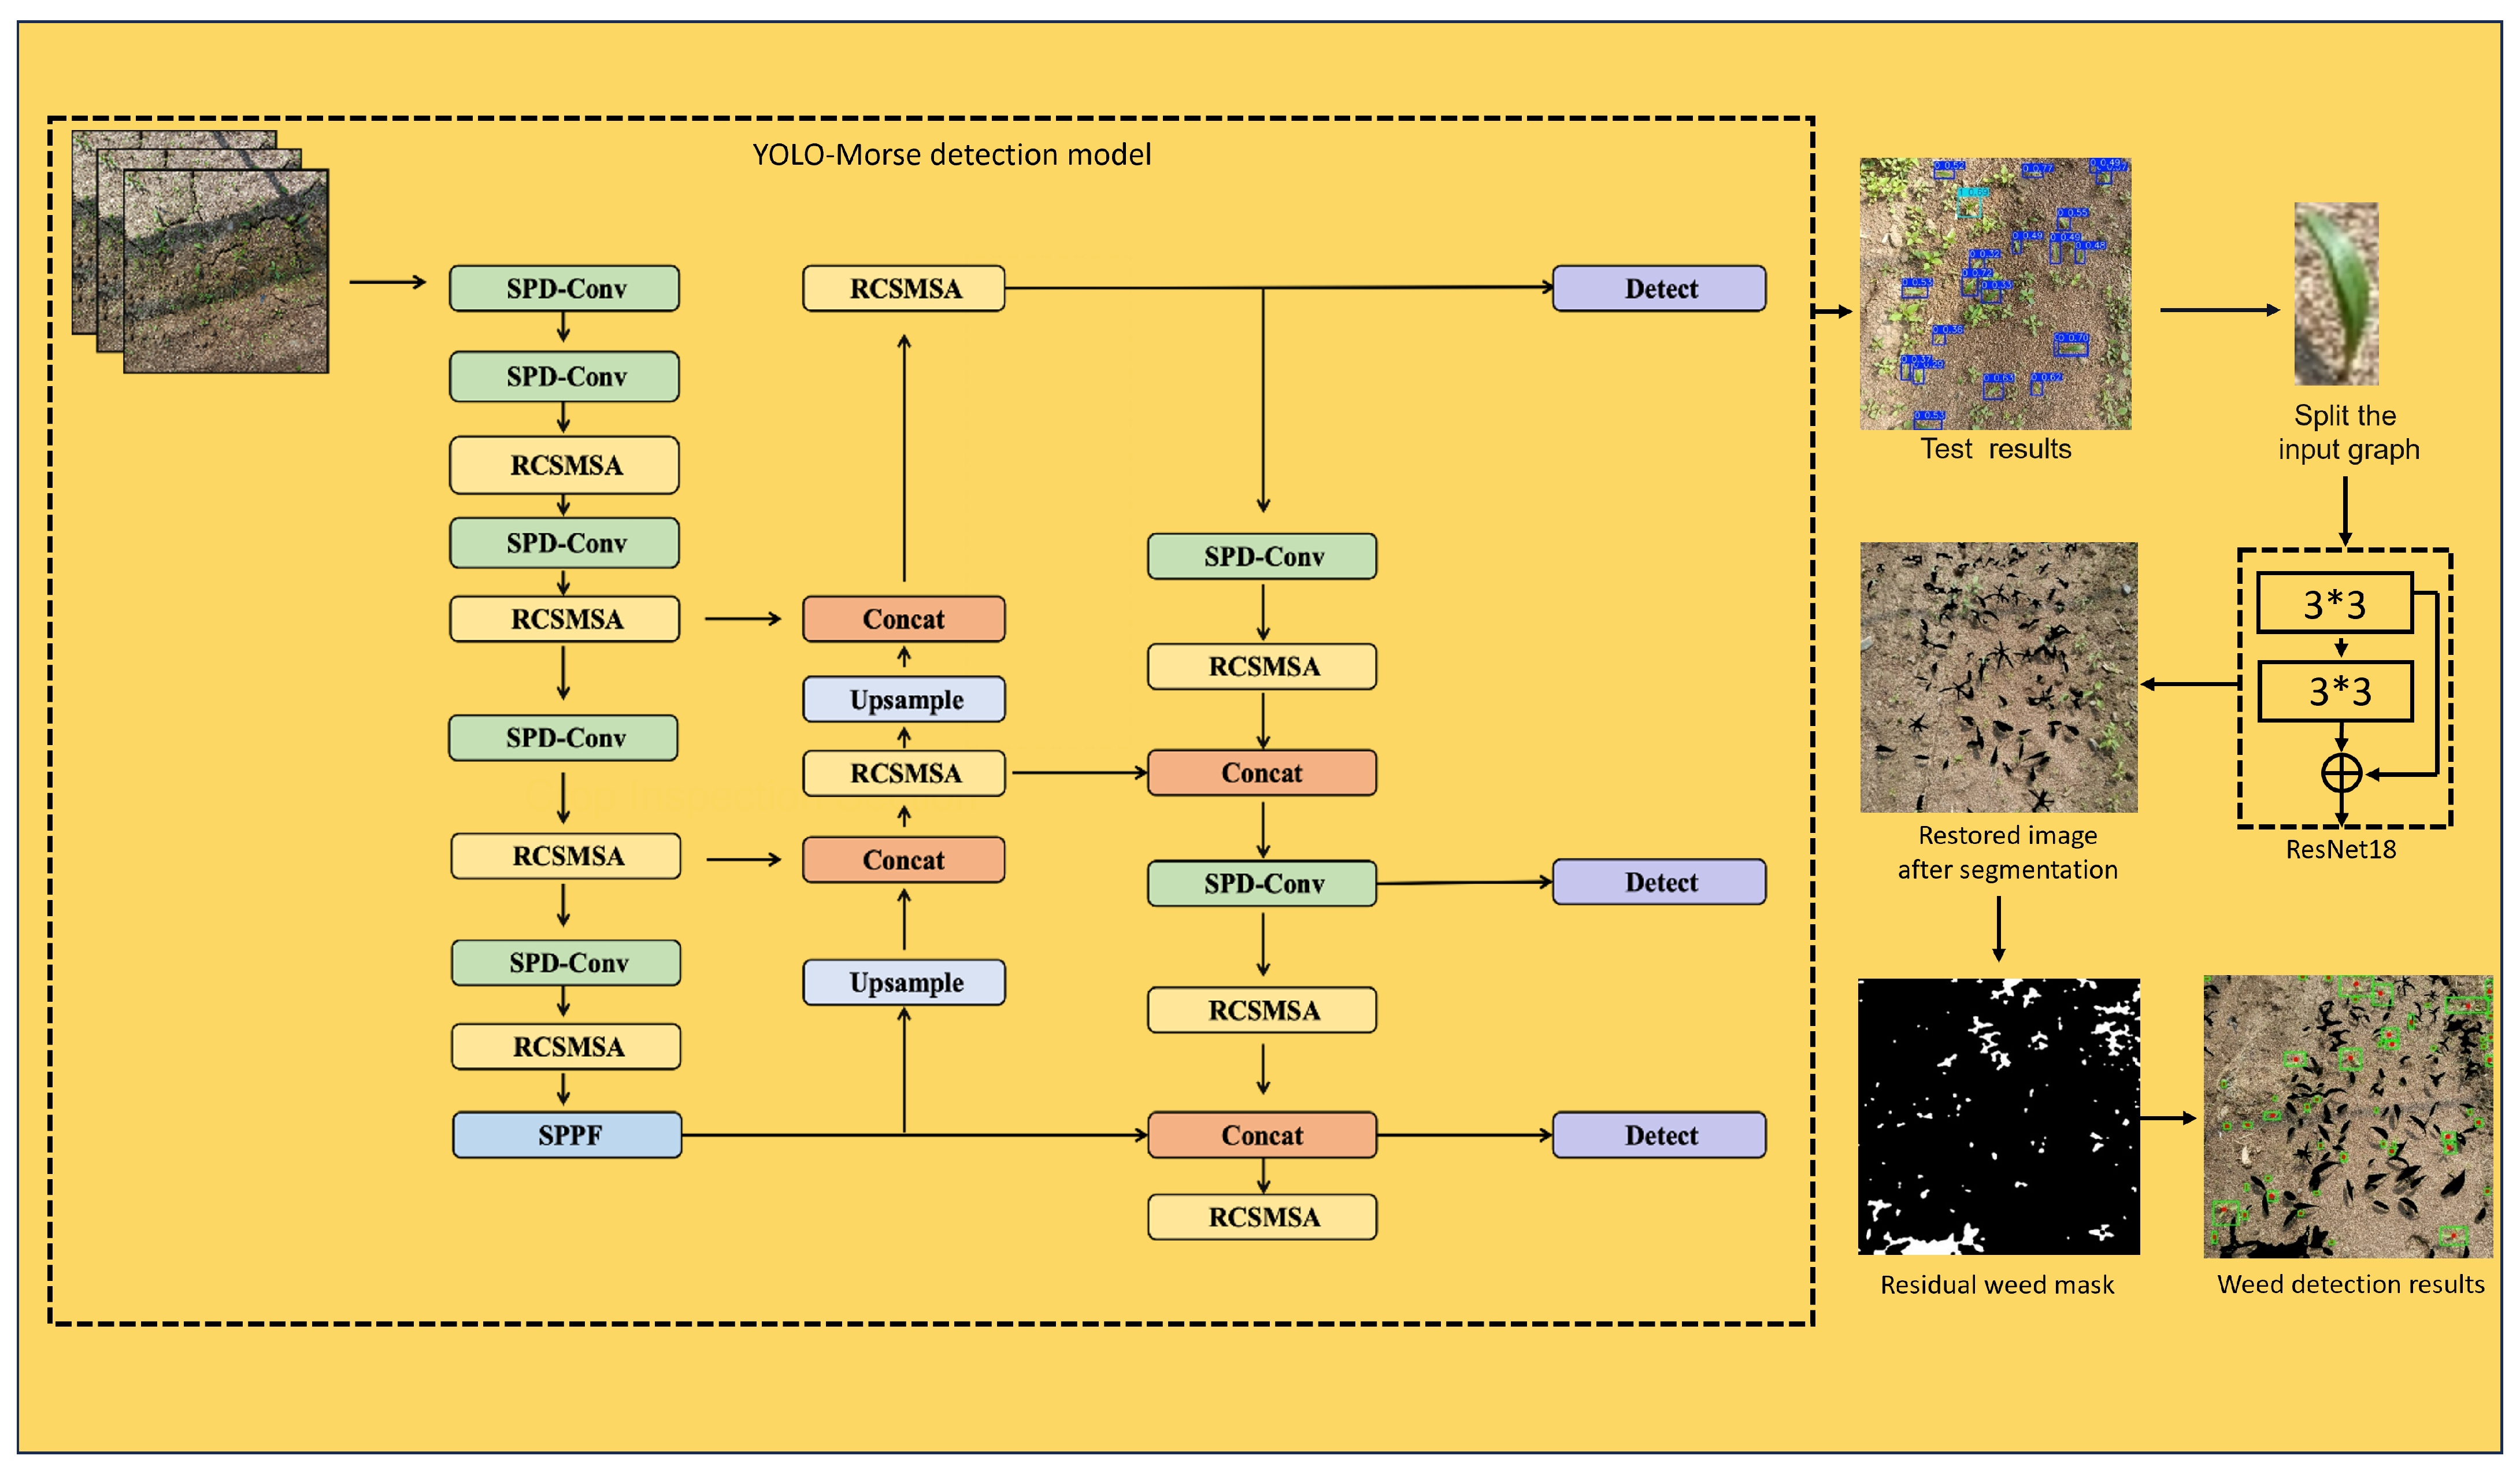
This study proposes an integrated weed detection method tailored for complex field environments, aiming to achieve precise weed localization and accurate laser targeting, especially in scenarios where weed distribution is irregular and the morphology and scale vary significantly. The workflow is as follows: An improved YOLOv8-Morse object detection network is first introduced to identify lily crops within the image, efficiently outputting the bounding box coordinates of lily targets. Once the bounding boxes are obtained, each corresponding lily region is extracted from the original image to form a subset of lily images for segmentation. These cropped subimages are then normalized to match the input requirements of the subsequent segmentation network, ResNet18, whose selection is detailed in Section 3.3.3. Normalized images are fed into the ResNet18 network in batches to perform precise semantic segmentation, allowing the accurate extraction of edge and shape information. The segmentation network produces clear binary masks that effectively outline the contours of the lily targets. These binary segmentation masks are then mapped back to their corresponding bounding box positions in the original image to mask out the detected lily regions. This operation removes the influence of lily crops from the scene, reducing background interference in the subsequent weed detection phase and improving both accuracy and robustness. Additionally, it helps minimize the risk of crop damage during the laser weeding process. Based on the masked image, we convert the data into the HSV color space, leveraging its sensitivity to green vegetation to extract the remaining green regions. Using color thresholding, non-lily weed areas are segmented, and their coordinates are obtained. The centroid of each weed region is then computed using image moments. These centroids represent the spatial center of each weed patch and remain reliable under rotation, making them suitable as laser targeting points in the weeding system. This approach ensures precise localization while avoiding errors introduced by irregular weed shapes and complex boundaries, thus providing a more stable and accurate geometric basis for laser targeting. The overall system architecture is illustrated in Figure 3.

2.3. Improved YOLOv8-Morse Algorithm

The YOLO model has long been a pioneering representative of object detection techniques in the field of computer vision. Its outstanding performance and efficiency have led to widespread adoption in both academia and industry. With continuous technological advancements, the YOLO series has undergone multiple iterations of optimization and upgrades, with each generation bringing improvements in terms of accuracy, speed, and applicability. In 2023, Ultralytics released YOLOv8, marking another significant milestone in the YOLO family. Compared with previous versions such as YOLOv5 and YOLOv7, YOLOv8 introduced breakthroughs in several aspects, most notably precision and efficiency, and has since become one of the preferred models for object detection tasks [21].
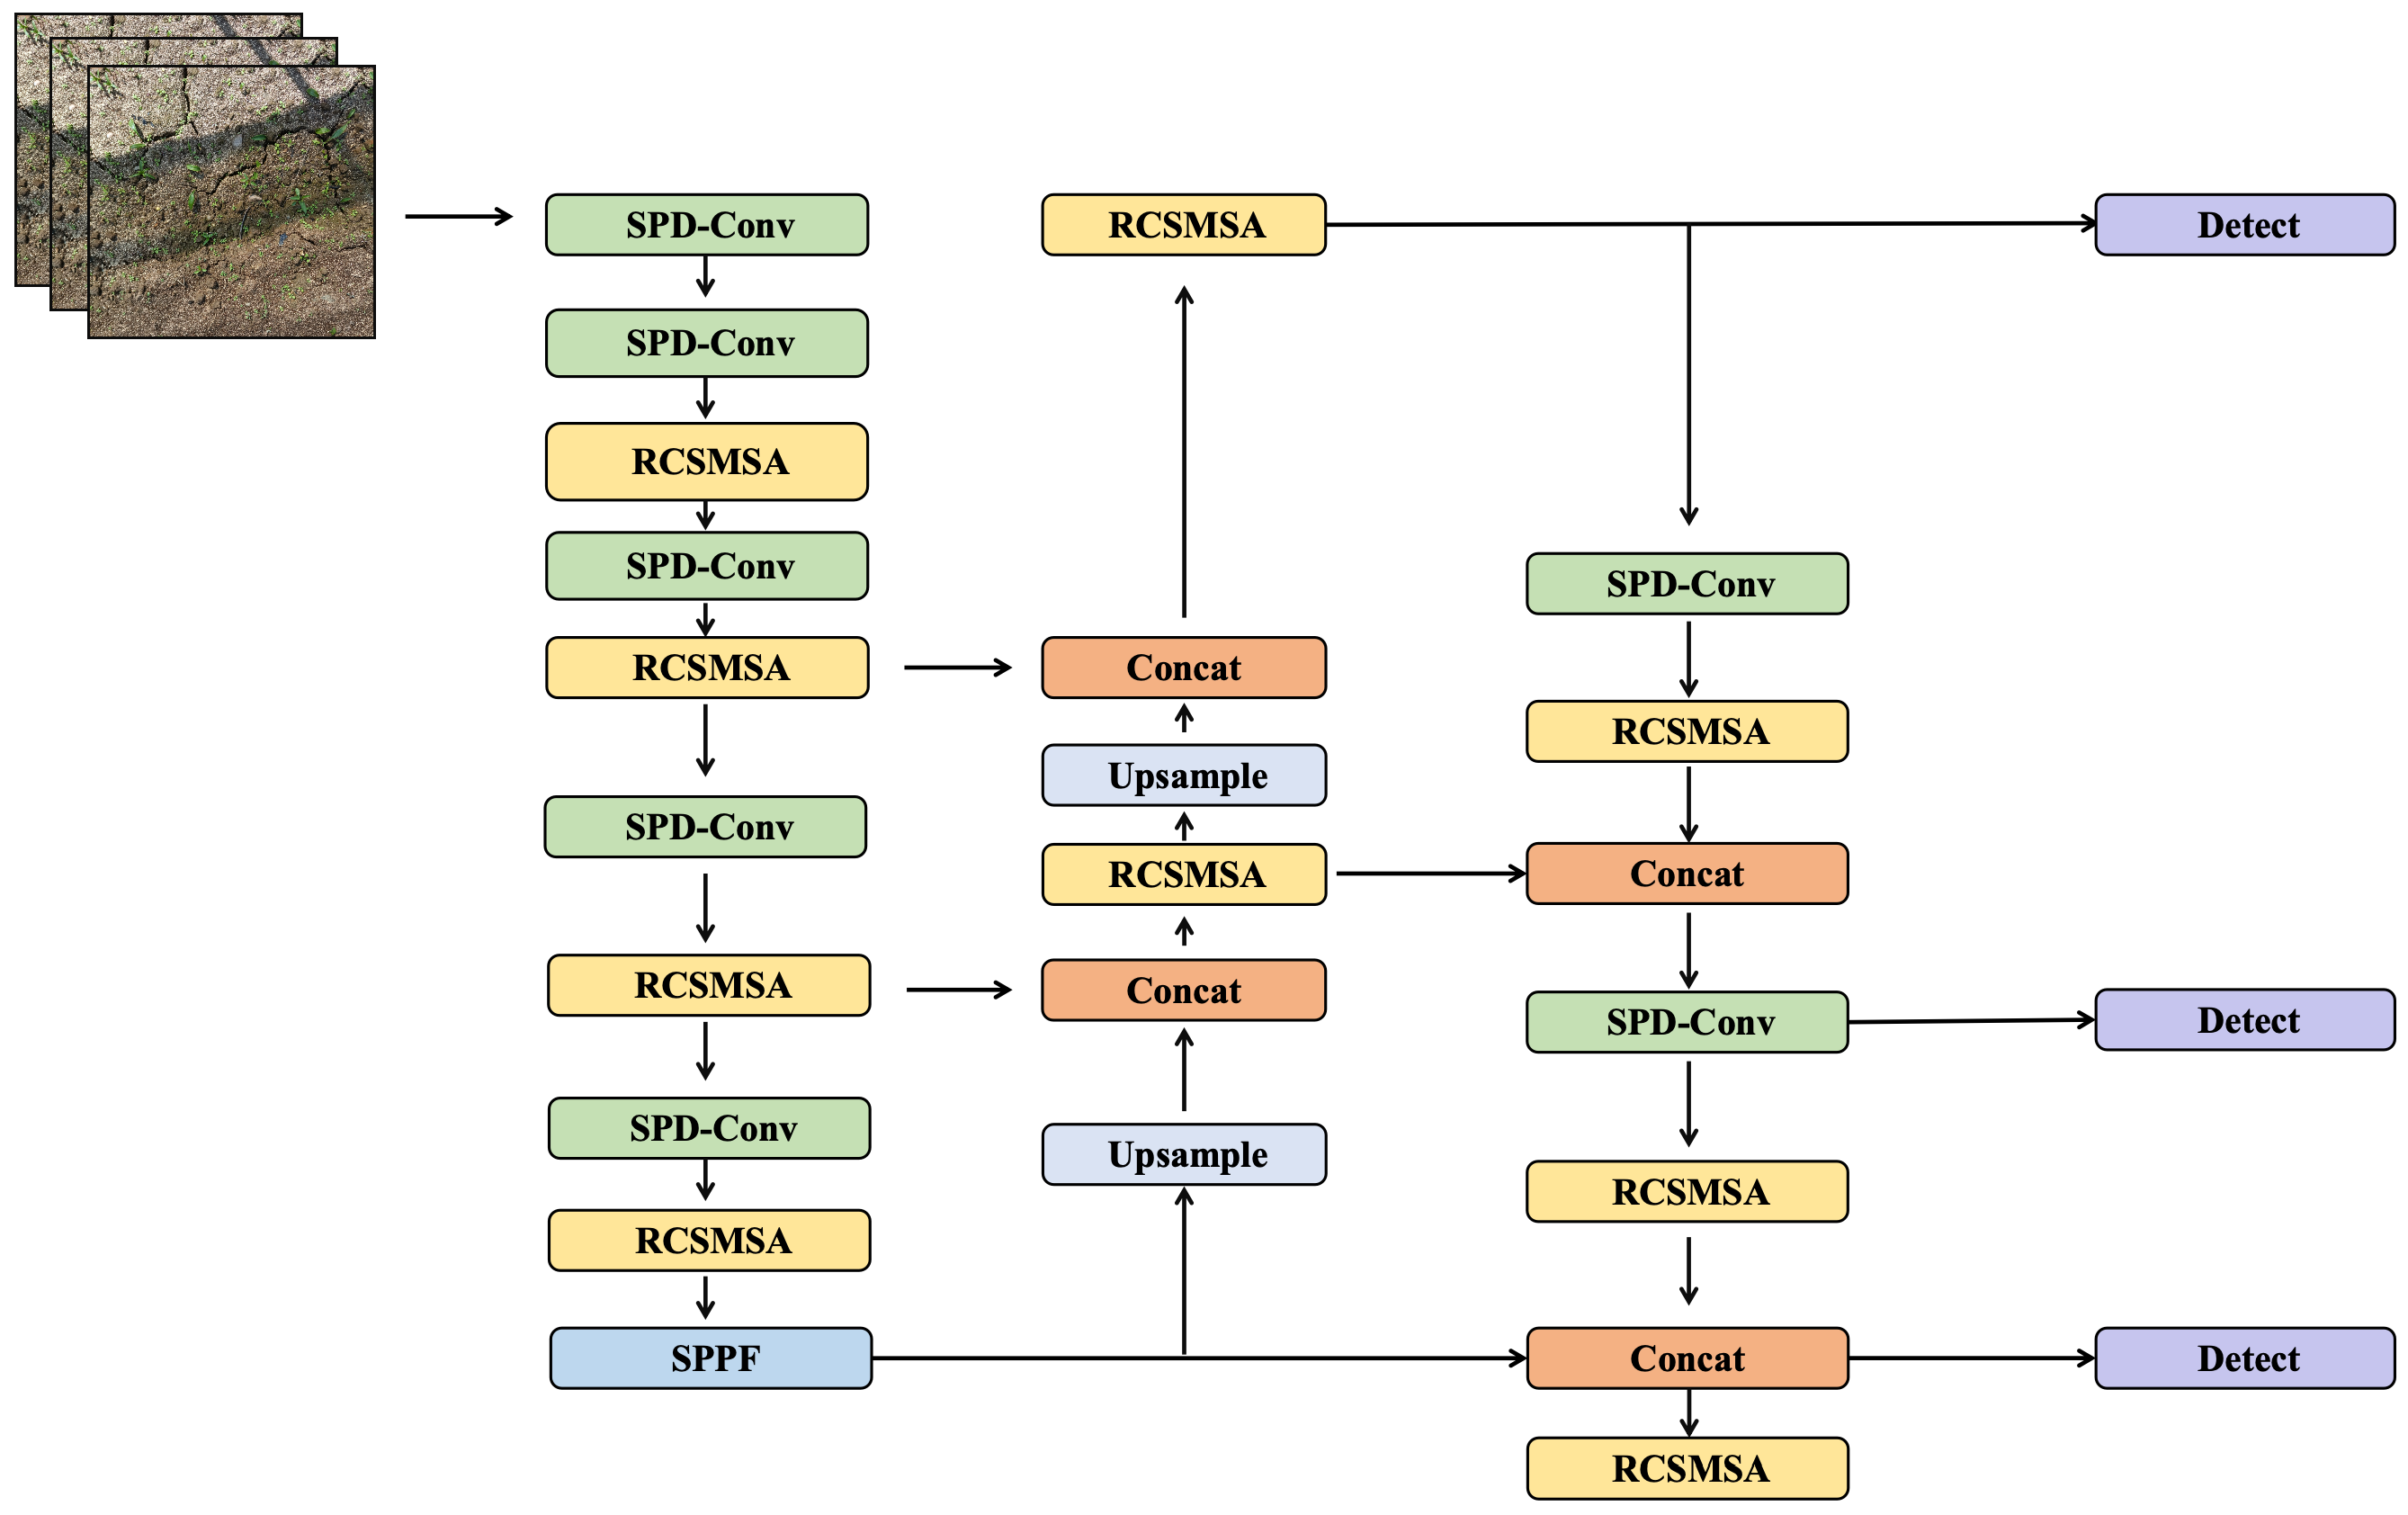
The seedlings of single-leaf stage lilies are relatively small and suffer from severe occlusion. The original YOLOv8 network exhibits low detection accuracy for these single-leaf stage seedlings. To address these issues, this study proposes an improved YOLOv8 detection network named YOLO-morse. The overall architecture of the model is shown in Figure 4. The specific improvements are as follows: (1) An improved RCS-MSA module is employed as the feature extraction component to enhance the fusion of multiscale information. (2) A cross-scale convolution module is introduced into the backbone network to improve the detection accuracy of small targets. (3) The ATFL loss function is utilized to balance the sample data between single-leaf and multileaf stages, mitigating the performance degradation caused by class imbalance. A detailed description of each improved module is presented in the following.

2.3.1. RCS-MSA Module

Lily field images are particularly challenging due to the wide range of target sizes, variations in orientation, and the presence of visually complex backgrounds. In particular, the substantial differences across various growth stages of lilies increase the difficulty of the detection task. Although the C2f module in the YOLOv8 backbone performs well in terms of lightweight design, it has the following limitations: Its information fusion mainly relies on shallow convolutions, lacking the capability to extract deep semantic information, which easily causes the single-leaf stage lily seedlings to be overlooked, thereby affecting recognition accuracy. Additionally, the C2f module has a single receptive field, making it difficult to simultaneously capture features of lilies at different growth stages. To address these issues, this study introduces the reparameterized convolution-based channel shuffle one-shot aggregation module (RCS-OSA) [22], and further incorporates a multi-scale fusion module (MSFM) based on it. The resulting RCS-MSA module replaces the C2f module in the YOLOv8 backbone, enhancing the backbone’s ability to model feature information and adapt to multi-scale targets. The structure of the proposed RCS-MSA module is illustrated in Figure 5.
The RCS-MSA module mainly consists of three parts: The first part processes the input through a lightweight RepVGG branch to achieve efficient reparameterized feature extraction; the second part passes through multiple stacked RCS modules, which utilize channel splitting and channel shuffle mechanisms for cross-channel feature reorganization, thereby enhancing the interactive expression capability between features; the third part introduces a multi-scale fusion branch that extracts global contextual information via pooling operations at different scales and integrates it into the backbone branch, effectively improving the network’s perception of multi-scale targets. The RCS module combines the advantages of the channel shuffle mechanism and reparameterized convolution (RepConv), enabling enhanced feature reconstruction capability while maintaining low computational cost. The OSA (One-Shot Aggregation) structure aggregates multi-level receptive field features in a single step, effectively reducing redundant computations among features. Through the organic fusion of these three branches, the proposed RCS-MSA module achieves efficient information integration across different scales and channel dimensions. At the output stage, 1 × 1 convolutions and attention mechanisms are employed for feature recompression, thereby enhancing the representation ability of key regions.

2.3.2. SPD-Conv Module

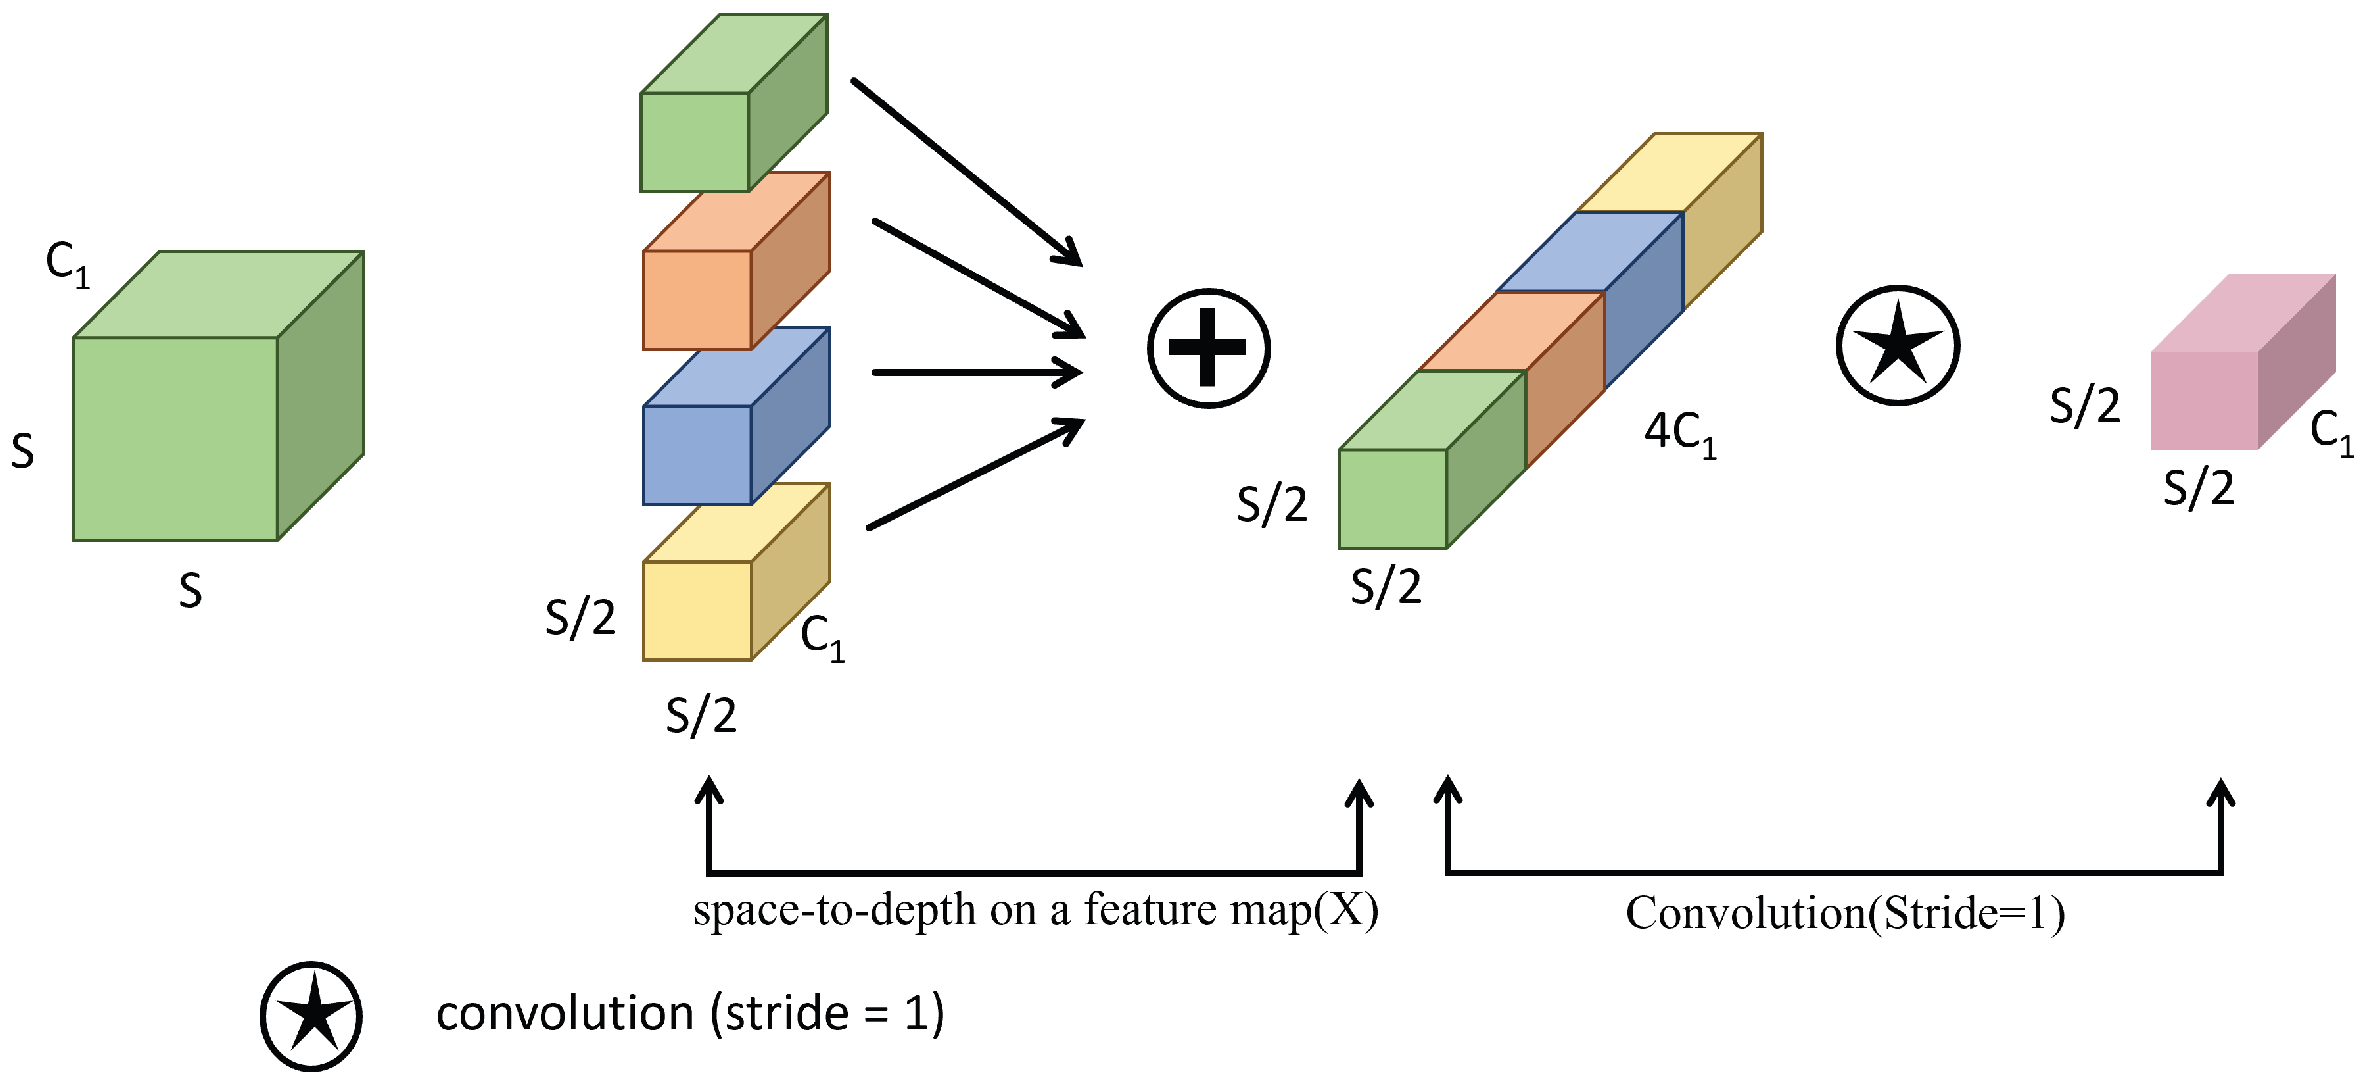
In practical lily plant detection tasks, the model’s ability to represent features of small target regions still requires improvement. During the deeper stages of the network and the downsampling process of feature maps, information about small targets is easily diluted or lost, which severely affects the detection performance for seedling-stage lilies. To address this issue, we introduce a Space-to-Depth Convolution (SPD-Conv) module [23] into the network architecture, replacing the original stride convolution. The core idea of SPD-Conv is to slice and rearrange the input feature map spatially and concatenate the slices along the channel dimension. This operation compresses the spatial dimensions while preserving all pixel information and correspondingly expands the channel dimension. Therefore, this structure achieves downsampling without increasing the convolution stride, effectively avoiding information loss. In lily images, small targets often resemble the background and have blurred boundaries, causing traditional stride convolutions to overlook critical edge pixels and resulting in missed detections. The SPD-Conv module, through its spatial rearrangement strategy, ensures that every pixel participates in convolution after downsampling, thereby enhancing the model’s representation capability of spatial details. Introducing the SPD-Conv module into the shallow or middle layers of the backbone effectively improves the recall of small targets, especially in densely distributed early-stage lily regions, significantly enhancing the model’s activation response. This effectively mitigates issues of semantic sparsity and structural loss commonly encountered in small target detection. The structure of the SPD-Conv module is shown in Figure 6.

2.3.3. ATFL Loss Function

To alleviate the class imbalance between multi-leaf and single-leaf stages, this study introduces an adaptive loss function based on the focal mechanism—Adaptive Tuning Focal Loss (ATFL) [24] —to enhance the model’s focus on hard-to-classify samples, thereby improving overall detection performance. Traditional Cross Entropy Loss treats all samples equally, which, in the presence of a large number of easily classified samples, can obscure the importance of a small number of critical but difficult samples. To address this, Focal Loss was proposed, formulated as follows:
L F L = α t ( 1 p t ) γ log ( p t )
Here, p t denotes the predicted probability of the model for the positive class, α t is the class balancing factor, and γ is the focusing parameter used to control the degree of suppression for easy-to-classify samples. When pt approaches 1, meaning the model is confident in the classification of the sample, the loss value is down-weighted, thereby emphasizing the hard samples.
Based on this, ATFL further introduces a dynamic adjustment mechanism that adaptively modifies the loss weight according to the current training state, taking into account the classification difficulty of samples and the model’s confidence. Its improved form is expressed as:
L A T F L = ω ( x ) · ( 1 p t ) ν log ( p t )
The weight term ω ( x ) is adjusted based on each sample’s confidence, adaptive gradient variation, and other characteristics, and is expressed as follows:
ω ( x ) = λ · 1 1 + e β ( σ μ )
Here, λ is the upper limit of the tuning factor, β controls the steepness of the adjustment curve, and μ is the mean threshold that determines when to start increasing attention to low-confidence samples. Through this mechanism, the model can automatically identify difficult-to-learn samples during training and assign them higher loss weights, thereby encouraging continuous improvement in predicting these challenging regions.

2.3.4. Weed Centroid Coordinate Extraction Method

In the first stage, the improved YOLOV8-Morse detection network was used to accurately localize the lily crops, achieving preliminary removal of crop targets. Based on these detection results, the subsequent stage requires further extraction and segmentation of the weed regions in the images. Traditional methods often employ a black mask to cover the detected crop regions in order to avoid interference with weed detection, followed by extraction of the remaining green regions for weed identification. However, this approach has obvious limitations: If the detection bounding box contains both crops and weeds, the weed parts within the box will be entirely occluded, leading to missed detections.To address this issue, this study proposes an improved method combining segmentation models. After detecting the lily targets, they are first normalized and cropped, then input into the segmentation network in multiple batches to extract the edge contour features of the lilies. The segmentation results are mapped back to the original image to accurately cover the lily regions, and morphological operations are applied to complete any incomplete edges. Subsequently, based on the HSV color space, suitable green region thresholds are experimentally determined to extract the remaining green areas in the image, generating the weed mask. Considering the high-density distribution of lilies in the images, dense lily areas are further masked and repaired to reduce false positives. After obtaining the binary mask, contour extraction and analysis are performed on each connected weed region. To enable automated laser targeting, the centroid of each region is used as the reference coordinate for targeting. The centroid coordinates ( x ¯ , y ¯ ) are calculated based on image moments. Given that the pixel values of a connected region in the mask image are f ( x , y ) , the centroid coordinates are computed as follows:
M p q = x y x p y q f ( x , y )
x ¯ = M 10 M 00 y ¯ = M 01 M 00
Here, M 00 represents the zeroth-order moment of the region (i.e., the pixel area), while M 10 and M 01 correspond to the first-order moments with respect to the x and y axes, respectively. These moments enable accurate localization of the geometric center of the weed regions, making them suitable as targeting points for the laser weed control system. To enhance system robustness, an area threshold is set to filter out small non-target regions within the connected components. Finally, the valid weed regions are visually presented with bounding rectangles, and the centroid coordinates are output as the target points for laser control.

3. Experiments

3.1. Experimental Setup

In this experiment, a computer equipped with an Intel® Core™ i7-14700KF @ 3.40 GHz CPU and 64 GB of RAM was used, along with an NVIDIA GeForce RTX 4090D GPU featuring 24 GB of memory. The operating system was Ubuntu 20.04, and PyCharm 2023 served as the code editor. The programming environment utilized Python 3.10 and PyTorch 2.0.1 as the deep learning framework. The input image size for the detection network was set to 640 × 640 pixels, while the segmentation network used an input size of 480 × 640 pixels. The batch size for both networks was 8. The detection network was trained for 200 epochs, requiring approximately 5 h, and the segmentation network was also trained for 200 epochs, requiring approximately 6 h.

3.2. Evaluation Metrics

In this study, commonly used performance metrics were selected to evaluate the detection model, including Precision (P), Recall (R), Average Precision (AP) for each class, and mean Average Precision (mAP). By comparing detection accuracy, real-time performance, training time, and model size, the model with the best detection performance was selected. The definitions of the evaluation metrics are as follows:
P = T P T P + F P
R = T P T P + F N
A P = 0 1 P ( γ ) d γ
M A P = 1 C i = 1 c A P i
where TP denotes the number of correctly detected targets, FP represents the number of incorrectly detected targets, and FN refers to the number of missed targets. AP stands for the Average Precision of a single class, while mAP is the mean of the AP values across all target classes. A higher mAP indicates better model recognition capability.

3.3. Result

3.3.1. Comparison of Different Convolutional Blocks for Small Object Detection

To evaluate the impact of different convolutional modules on YOLOv8 for small object detection, this study compares the performance of the original YOLOv8 and its variants incorporating SPD-Conv, CBAM, SPP, and FPN modules, as summarized in Table 1. From the experimental results, the original YOLOv8 achieves a mAP@0.5 of 82.8% with 12.9 M parameters, serving as a baseline with a balanced trade-off between detection accuracy and model complexity. Introducing the SPD-Conv module increases the mAP@0.5 to 84.3%, an improvement of 1.5 percentage points over the baseline, while the parameter count only slightly increases to 13.0 M. This indicates that SPD-Conv significantly enhances small object feature extraction, effectively improving detection accuracy while maintaining model lightweightness.
In contrast, the YOLOv8 model with the CBAM attention mechanism attains a mAP@0.5 of 81.5%, slightly lower than the baseline, with parameters reduced to 11.8 M. This suggests that although CBAM can emphasize important features, it may inadequately focus on small-sized targets, leading to a minor decrease in overall detection performance in small object scenarios. The introduction of the SPP module, which expands the receptive field, improves mAP@0.5 to 83.0%, but increases the parameter count significantly to 16.5 M, resulting in higher computational complexity. These results indicate that SPP provides some benefit for multi-scale feature fusion, but its performance gain in small object detection is limited, while adding to the model’s burden. Furthermore, the YOLOv8 model combined with FPN achieves the same mAP@0.5 as the baseline 82.8% without increasing the number of parameters. This indicates that FPN provides little improvement for small object detection, possibly because YOLOv8 already incorporates effective multi-scale feature fusion, and additional FPN does not substantially enhance detection performance.
In summary, for small object detection tasks, the SPD-Conv module effectively improves detection accuracy while keeping the model lightweight, making it a practical enhancement for deployment. In comparison, CBAM and FPN offer limited improvement, and although SPP can enhance multi-scale feature representation, it comes at the cost of increased model parameters. Overall, SPD-Conv achieves the best balance between detection accuracy and model complexity, providing a clear direction for subsequent model optimization.

3.3.2. Ablation Study Analysis

To further evaluate the effectiveness of the improved modules incorporated in the YOLO-Morse model, we conducted a series of ablation experiments. The investigated modules include the enhanced RCS-MSA module, the Spd-Conv module, and the ATFL loss function. All experiments were performed on the same datasets, training parameters, and base model architecture. To ensure the reliability of the results, each experiment was independently repeated three times, and the mean values along with standard deviations were reported (Table 2). When applied individually, each module contributed to consistent performance improvements. For example, the RCS-MSA module increased the mAP to 84.0 ± 0.2%, with Precision and Recall reaching 80.4 ± 0.3% and 78.6 ± 0.4%, respectively, representing improvements over the baseline and demonstrating its effectiveness in feature fusion and multi-scale representation. Similarly, the Spd-Conv module raised the mAP to 84.3 ± 0.2% and Recall to 79.0 ± 0.3%, enhancing small object perception and reducing missed detections. The ATFL loss function achieved an mAP of 82.9 ± 0.1%, with modest but stable gains in Precision and Recall, demonstrating its advantage in handling class-imbalanced scenarios.
The combination of multiple modules resulted in more significant and statistically robust performance gains. For instance, integrating RCS-MSA with Spd-Conv achieved an mAP of 84.5 ± 0.3%, with Precision and Recall of 80.0 ± 0.2% and 79.5 ± 0.2%. The integration of Spd-Conv and ATFL yielded an mAP of 85.2 ± 0.2%, with both Precision and Recall reaching 79.5 ± 0.3%. Incorporating all three modules simultaneously produced the best performance, with an mAP of 86.0 ± 0.3% and Precision and Recall of 80.4 ± 0.3% and 80.5 ± 0.2%, confirming the stability and statistical significance of their joint application.
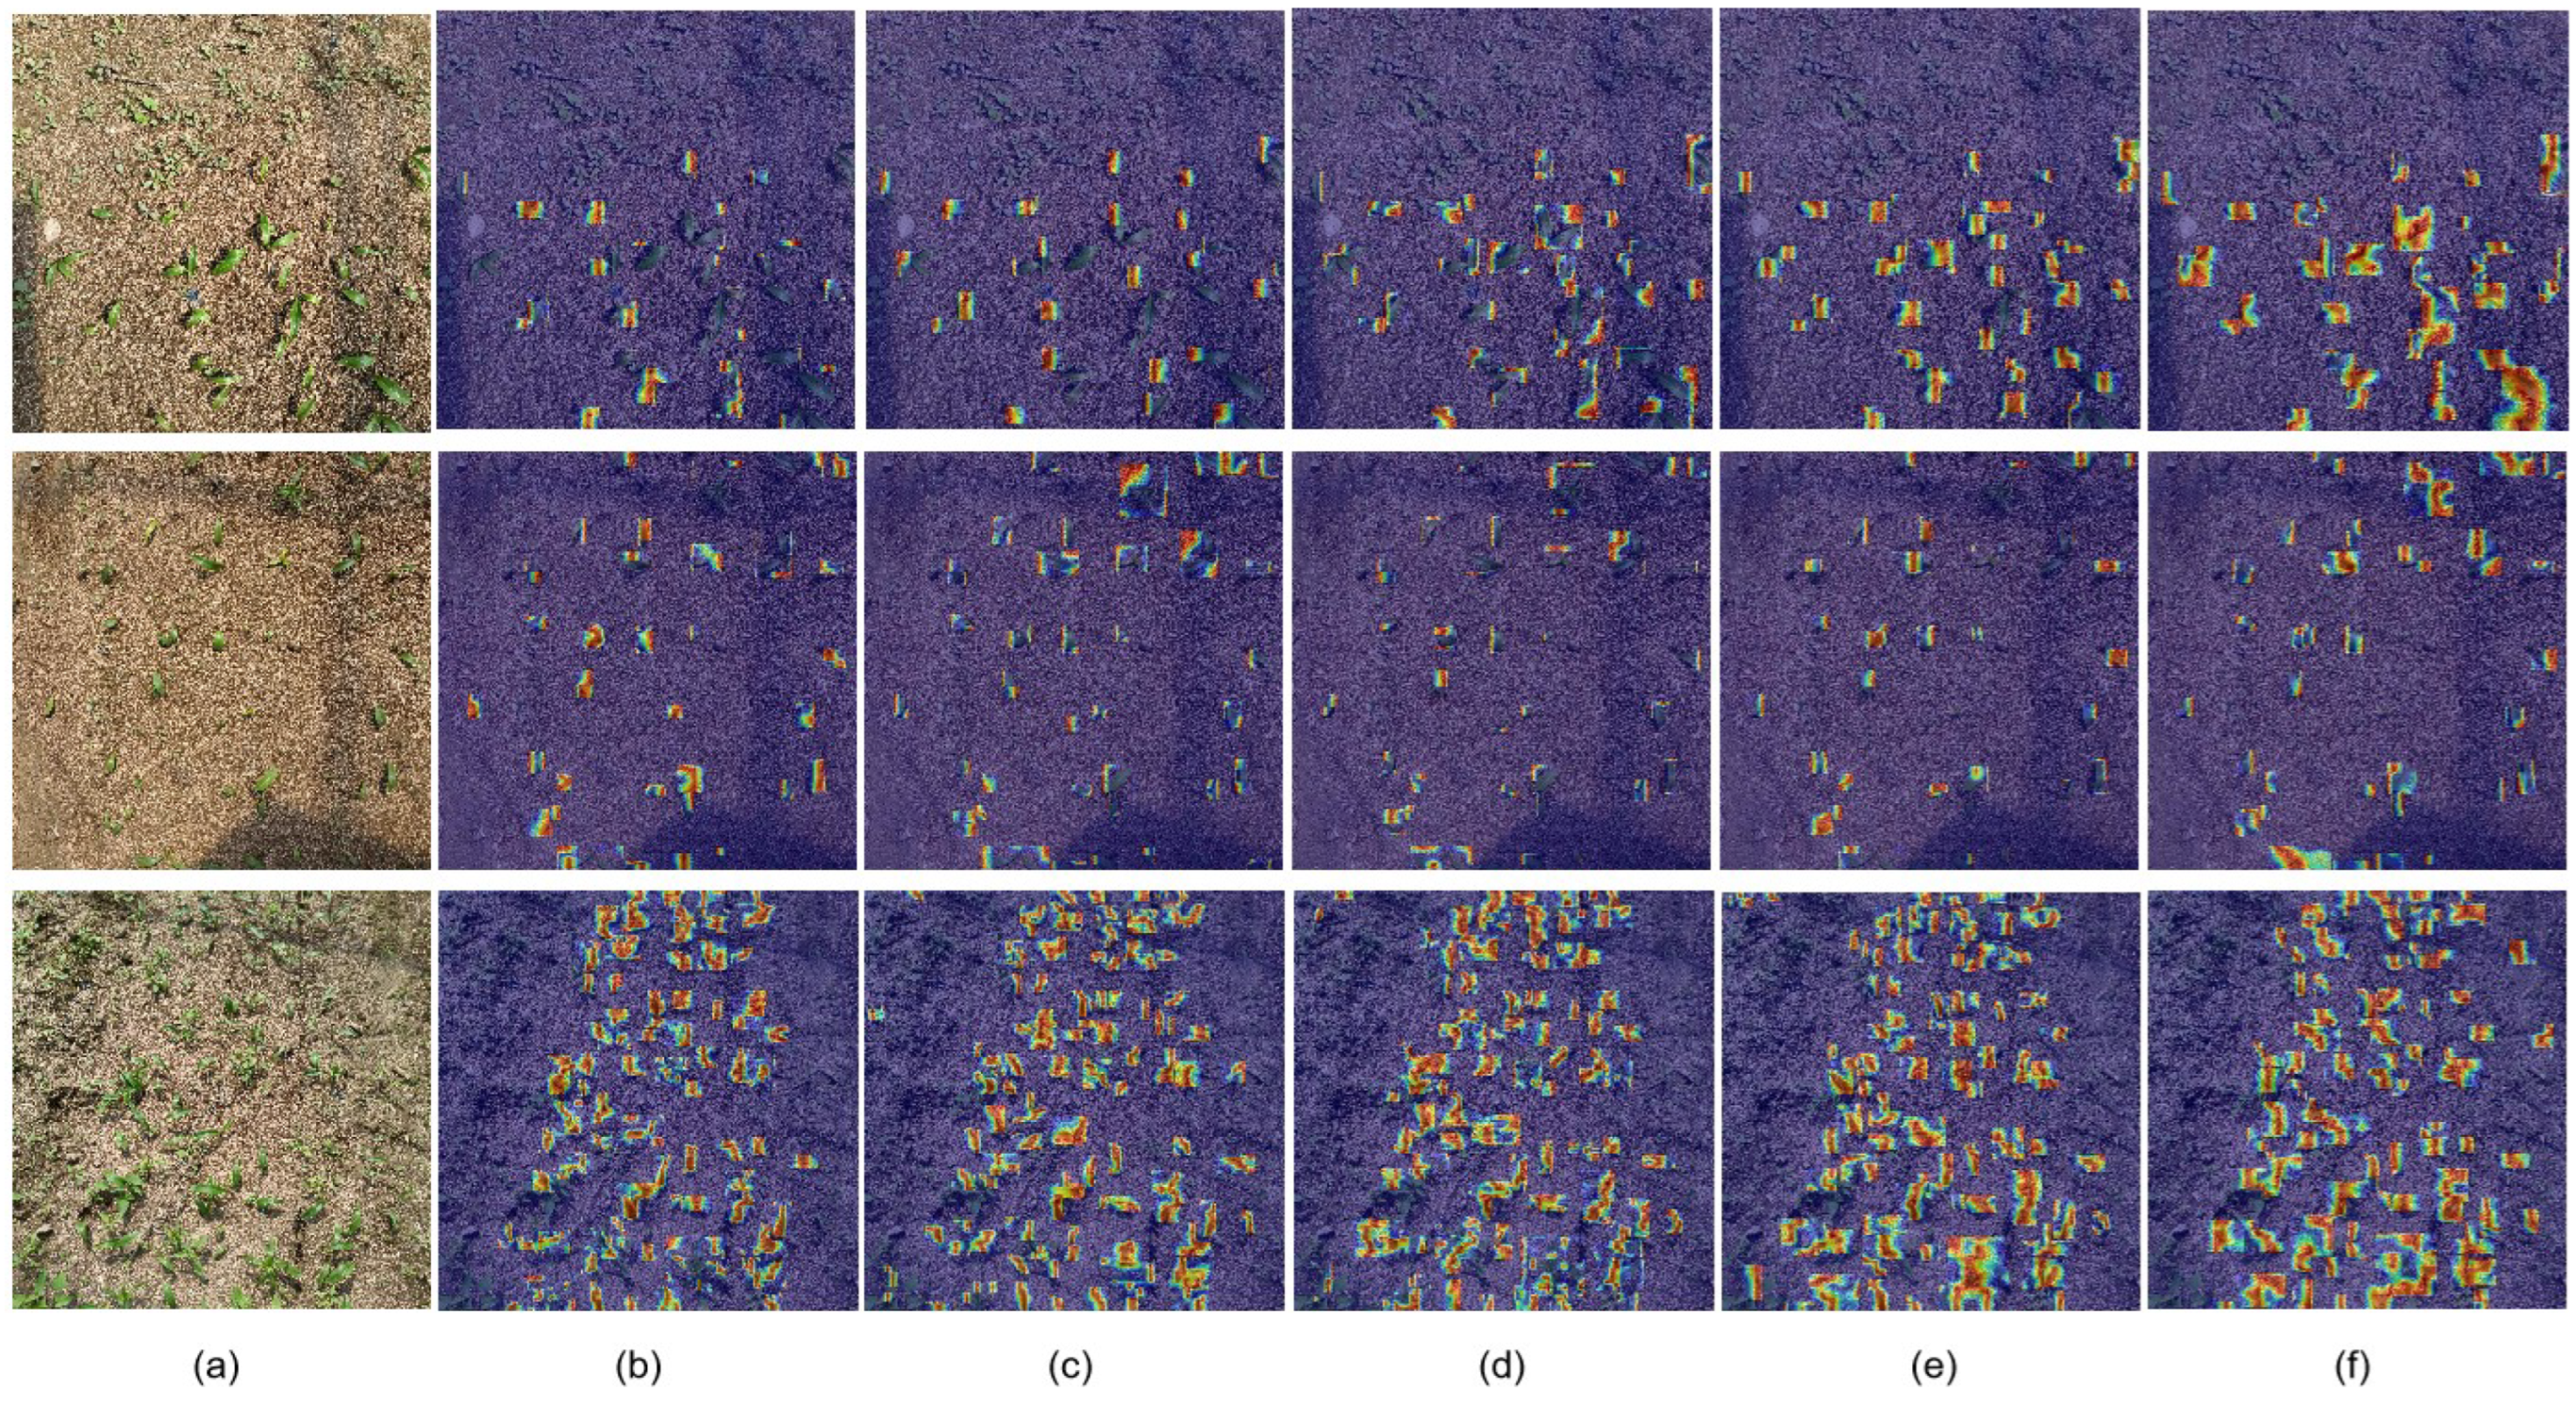
To further investigate the differences in feature representation among the modules, feature response heatmaps of the different models were analyzed, as shown in Figure 7. The baseline model exhibited dispersed responses and was susceptible to background interference. The ATFL loss function increased attention to plant regions but had limited effect on small leaf detection. The Spd-Conv module substantially improved small object perception, ensuring more complete detection in dense areas. The RCS-MSA module enhanced the discrimination of overlapping plants, maintaining clear boundaries under complex backgrounds. Joint use of multiple modules resulted in more concentrated and uniform response regions, effectively reducing noise, consistent with the ablation results.
Table 3 compares the computational complexity and inference speed for different module combinations. Introducing RCS-MSA increased FLOPs from 8.1 G to 11.9 G but reduced memory usage and improved inference speed from 46 ms to 40 ms. When all three modules were employed, FLOPs decreased to 10.1 G, memory usage was 11.2 M, and inference speed reached 36 ms, achieving both high accuracy and efficiency. This demonstrates that the proposed improvements provide a favorable balance between precision and efficiency, suitable for real-time field detection tasks.
In summary, the RCS-MSA, Spd-Conv, and ATFL modules contribute significant gains to YOLO-Morse from feature extraction, architectural design, and loss optimization perspectives. Individually, each module offers advantages, while their combination provides complementary and synergistic effects, substantially enhancing detection accuracy, stability, and real-time performance, providing a robust foundation for complex field crop detection applications.

3.3.3. Comparative Analysis of Multiple Model Performances

To validate the effectiveness of the proposed YOLO-Morse model in lily target detection tasks, several object detection models were selected for comparison: Faster R-CNN [25], YOLOv5, YOLOv8, YOLOv10 [26], YOLOv11 [27], YOLOV12 [28], and the proposed YOLO-Morse model. Faster R-CNN, as a classical two-stage detector, demonstrates stable performance in complex backgrounds and small object detection, often regarded as a benchmark for high-precision detection; thus, it was chosen as a baseline for comparison. YOLOv5, widely used in the YOLO series, strikes a good balance between detection speed and accuracy, offering strong practical engineering applicability. YOLOv8, a newly released single-stage detection model, features significant improvements in architecture design, feature extraction capabilities, and training stability, making it one of the mainstream high-performance detection frameworks. Furthermore, to further verify the improvements of YOLO-Morse over the latest models, YOLOv10, YOLOv11, and YOLOv12 were also included for comparison. These models maintain high detection accuracy while optimizing model architecture and inference efficiency, providing stronger deployment capabilities. By selecting these detection models from different architectures and development stages for horizontal comparison, a comprehensive evaluation of the YOLO-Morse model’s overall performance and applicability in lily target detection was conducted, considering metrics such as detection accuracy, model parameter size, and floating-point operations (FLOPs). All models were evaluated on the augmented dataset, with the main comparison metrics including mAP, model size, and FLOPs. The comparison results are summarized in Table 4. To ensure fairness, all models were tested under identical conditions using the same dataset.
As shown in the Table 4, The table shows that Faster-RCNN achieves an mAP of 70.1%. Although it is a classic two-stage detector, its complex structure results in a large model size of 120.3 M and 12.1 G FLOPs, leading to low inference efficiency and making it difficult to meet the real-time requirements of practical agricultural scenarios. The YOLO series, as a single-stage lightweight detection network, performs better in various aspects. YOLOv5 achieves an mAP of 80.3%, with 9.55 M parameters and 7.1 G FLOPs. YOLOv8, YOLOv10, YOLOv11, and YOLOv12 show similar performance, with mAPs of 82.9%, 81.9%, 82.0%, and 84.0%, corresponding to 11.47 M, 10.28 M, 9.88 M, and 9.0 M parameters, and 8.1 G, 8.2 G, 6.4 G, and 8.0 G FLOPs, respectively. Compared with YOLOv12, the proposed YOLO-Morse model slightly increases the number of parameters (13.0 M) and FLOPs (9.0 G), but its mAP rises to 86.0%, significantly outperforming the other models in accuracy. Overall, YOLO-Morse achieves a good balance between detection accuracy, model efficiency, and computational resource consumption, demonstrating stronger practical value, especially for agricultural object detection tasks with high real-time requirements.
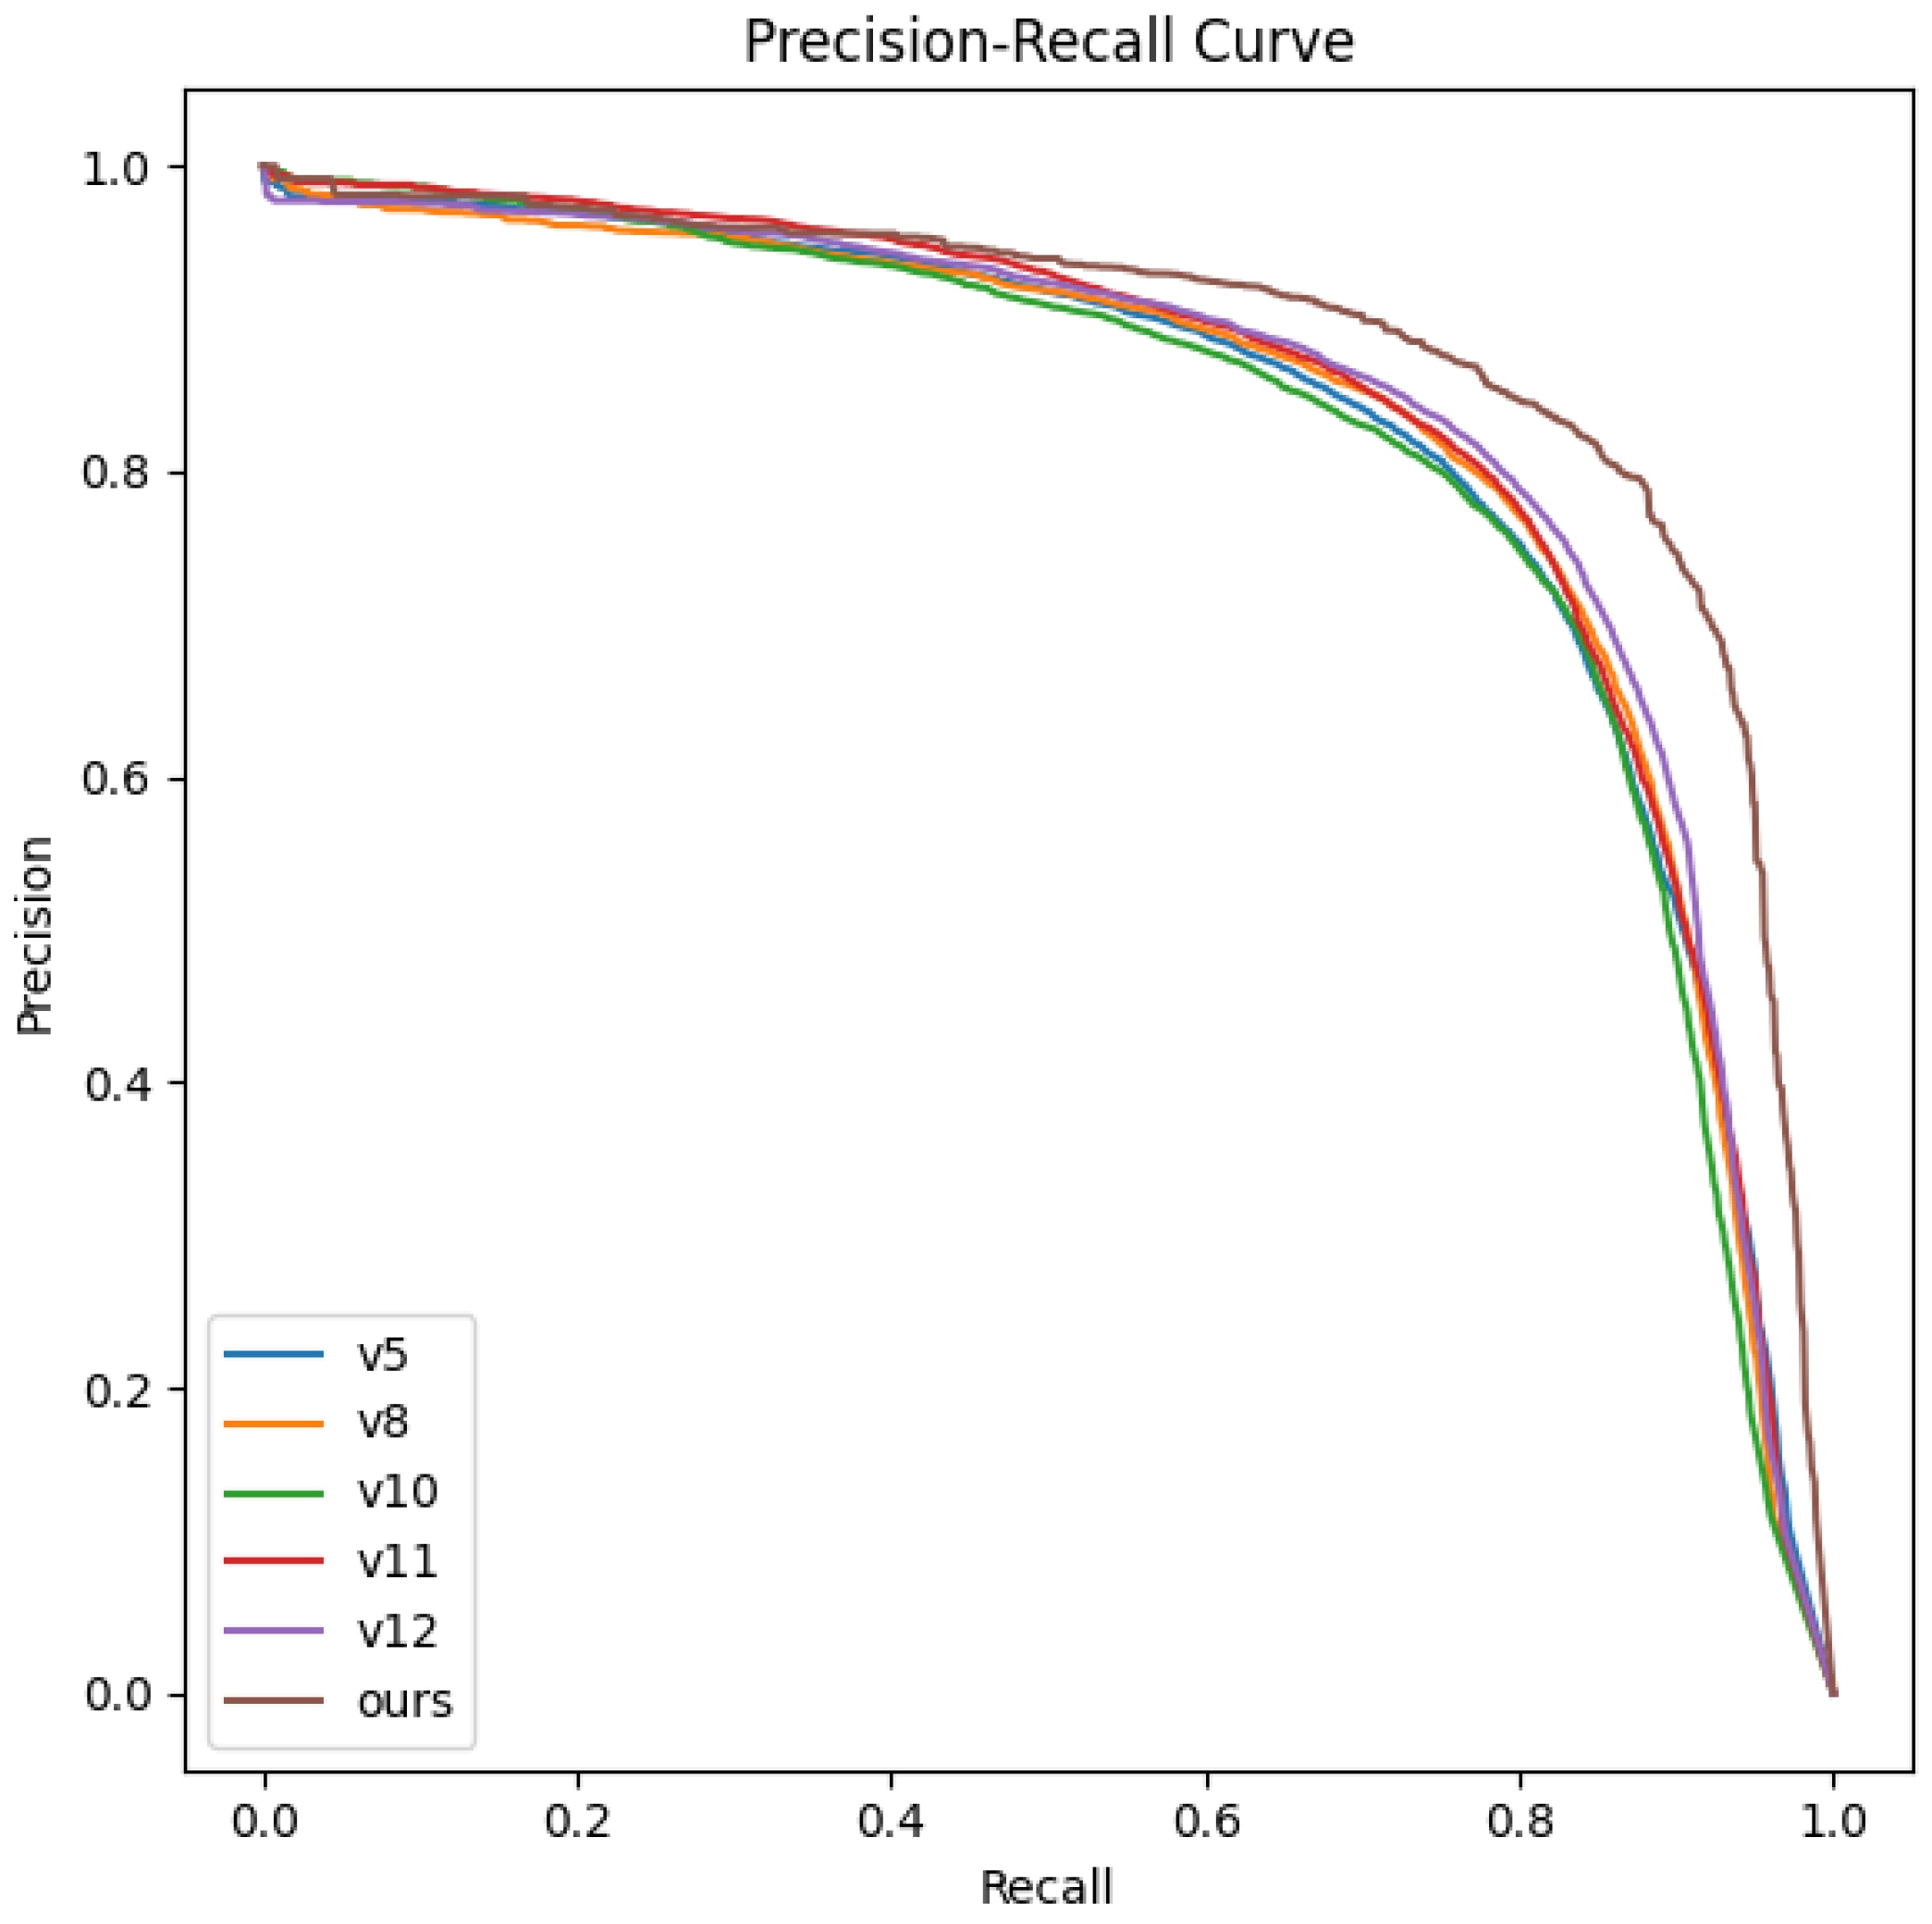
The PR curves of the different models shown in the Figure 8 indicate that YOLO-Morse achieves the best overall performance in lily target detection. Its curve dominates most areas of both precision and recall compared to other YOLO-based models, demonstrating that it can detect more targets while maintaining high precision, thereby reducing missed detections. Compared with YOLOv8, YOLOv10, YOLOv11, and YOLOv12, the PR curve of YOLO-Morse maintains relatively high precision even at high recall levels, reflecting its stronger robustness in complex backgrounds and small object scenarios. Considering both the PR curves and the tabulated metrics, YOLO-Morse achieves a well-balanced performance in detection accuracy, recall capability, and model efficiency, further validating its superiority in lily target detection tasks.

3.3.4. Visualization of Lily Detection Results

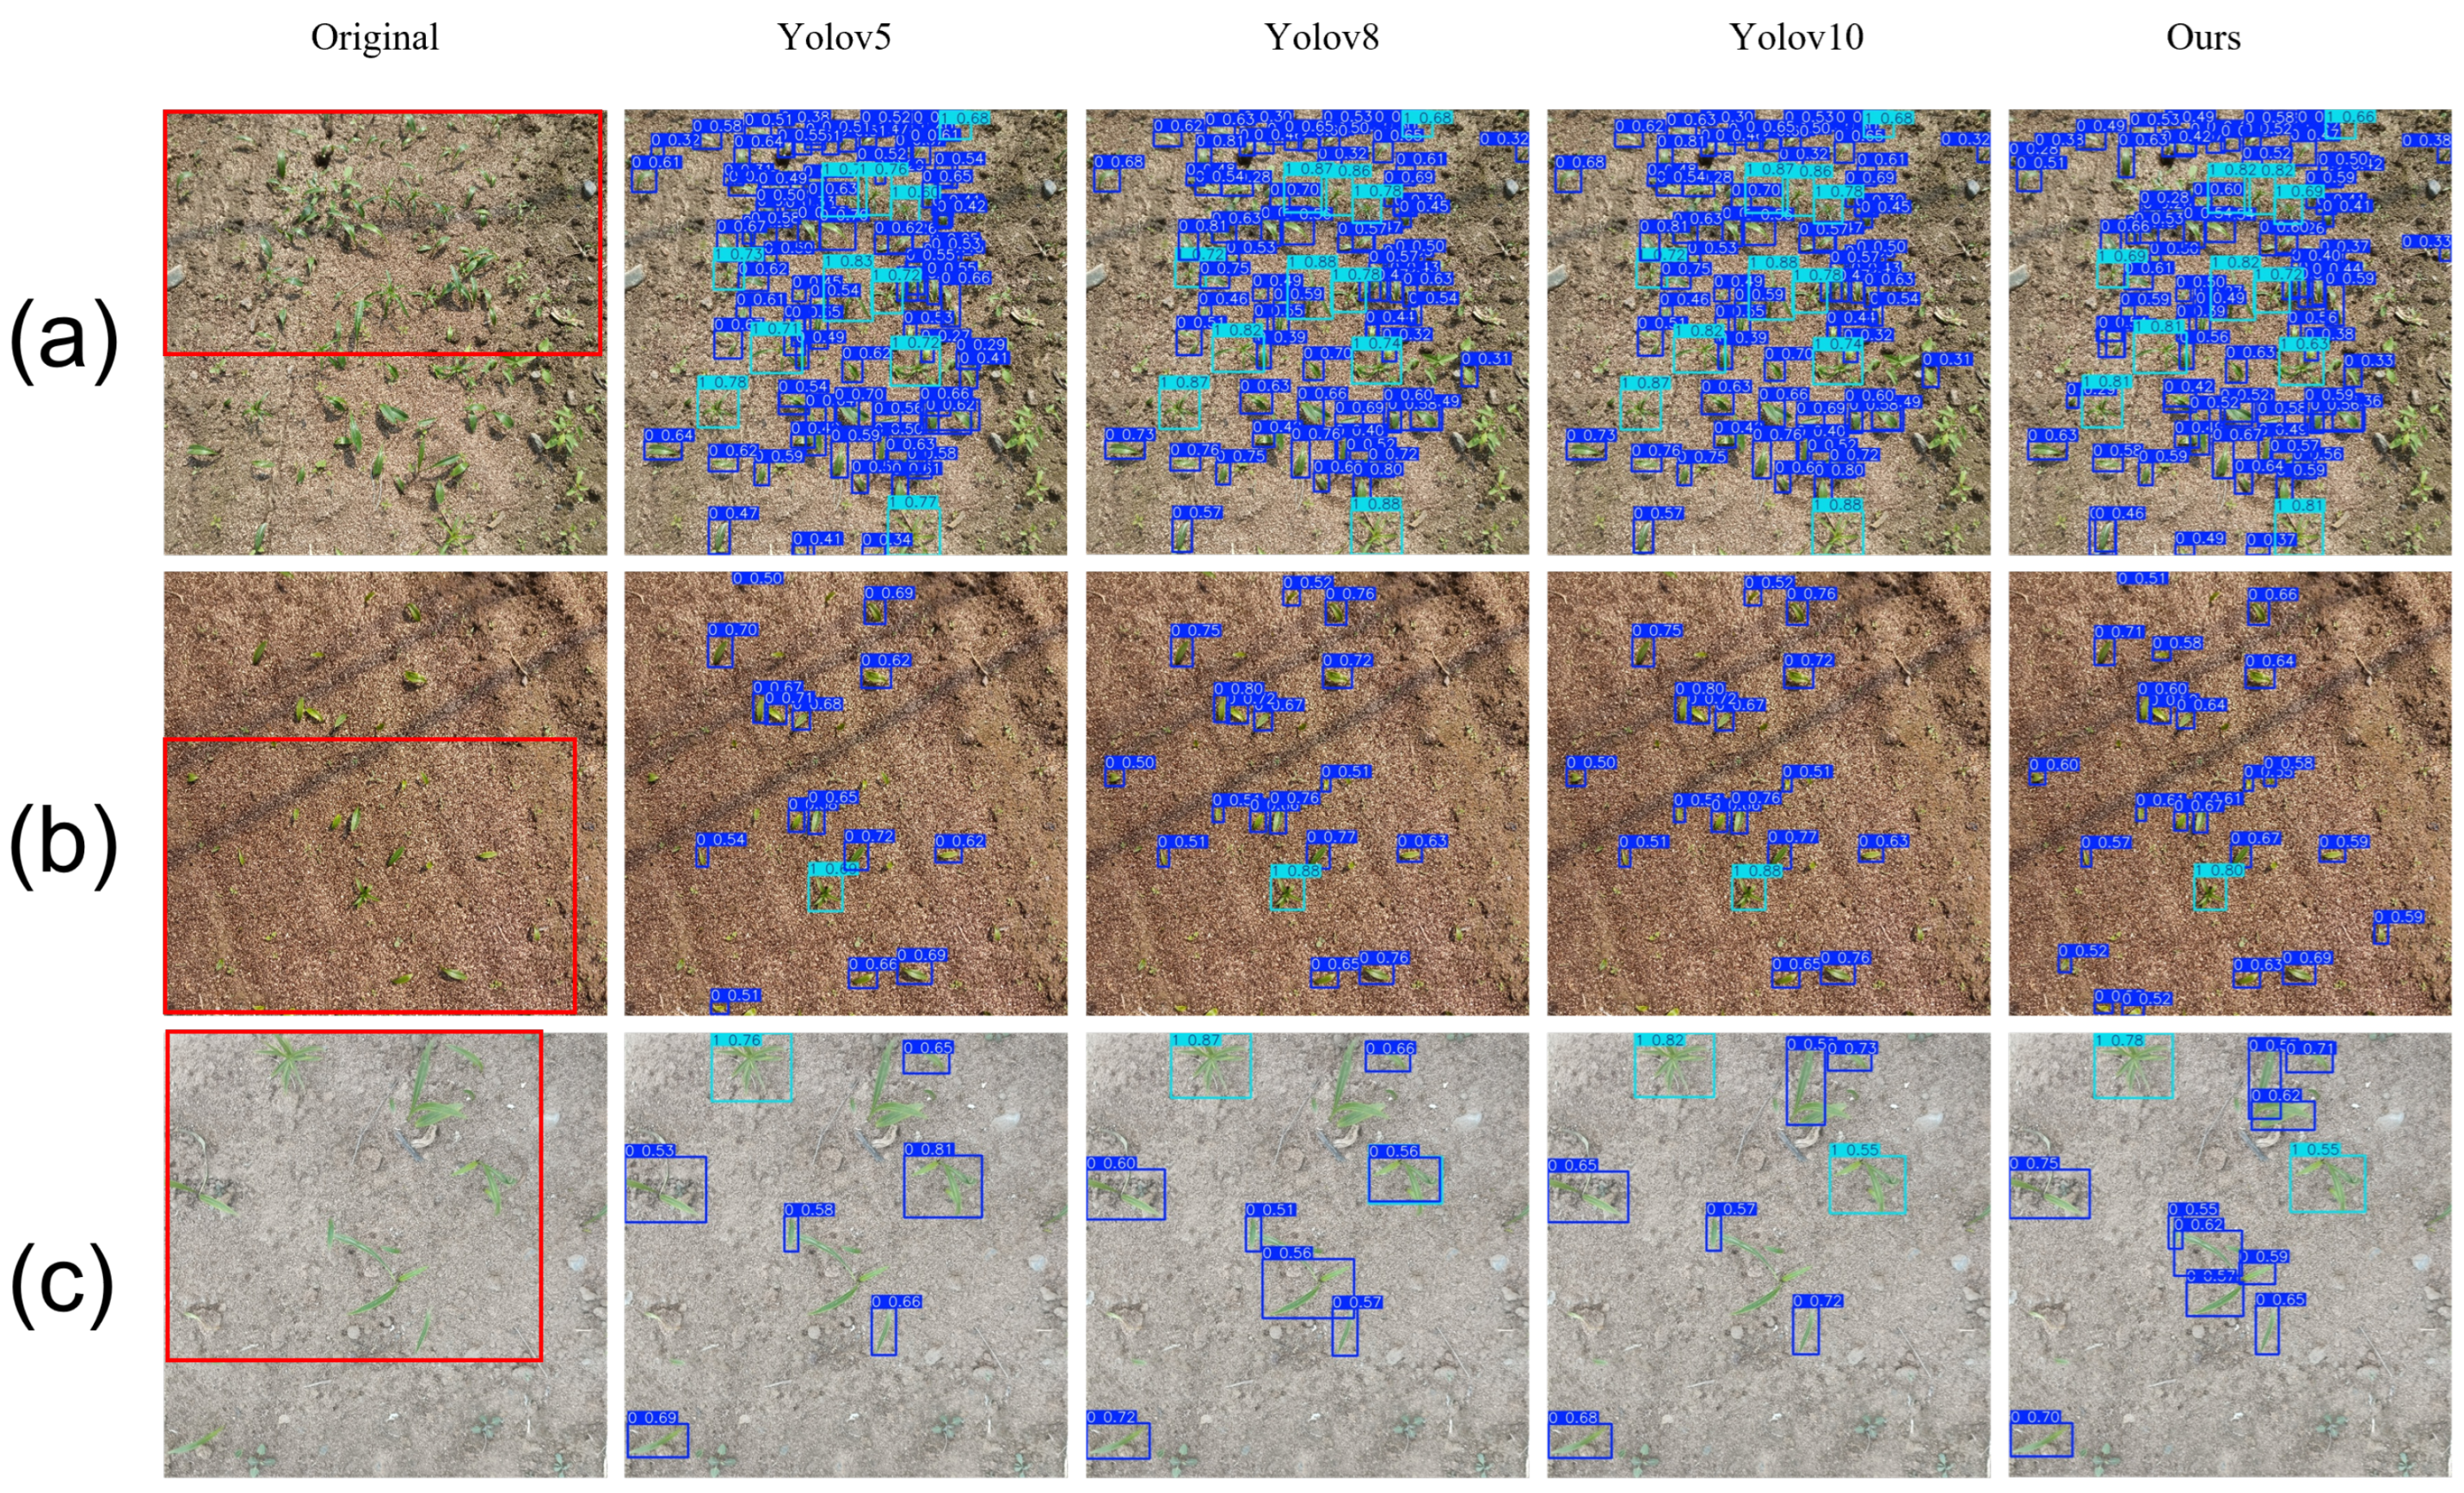
To validate the effectiveness of the proposed method in field crop detection tasks, three representative versions from the YOLO series—YOLOv5, YOLOv8, and YOLOv10—were selected for comparative analysis alongside our proposed method (Ours). The detection results are shown in Figure 9. Overall, noticeable differences exist among the methods in their target detection capabilities under various scenarios. YOLOv5, as an earlier version, exhibits relatively weaker overall target recognition ability. In particular, as shown in Figure 9a, it detects fewer bounding boxes for densely distributed, small crop targets, leading to many missed detections and positional offsets that hinder precise localization and recognition. YOLOv8, with improvements in architecture and feature extraction, demonstrates enhanced small object detection capabilities. The number of detected bounding boxes increases substantially with more comprehensive coverage; however, it is prone to generating overlapping boxes and false positives on complex backgrounds. For example, in the second set of images, some bare soil regions are mistakenly identified as targets, affecting the detection accuracy. YOLOv10 further optimizes the model’s fine-grained performance, especially showing better target separation in high-density areas and alleviating false detection issues. The tightness and rationality of the distribution of the bounding boxes are also improved. However, some redundancy remains, and certain targets are detected multiple times in the images. In contrast, our proposed method not only maintains accurate detection in dense and small-target scenarios but also minimizes background confusion, avoiding false positives in bare soil regions and ensuring more reliable recognition results.
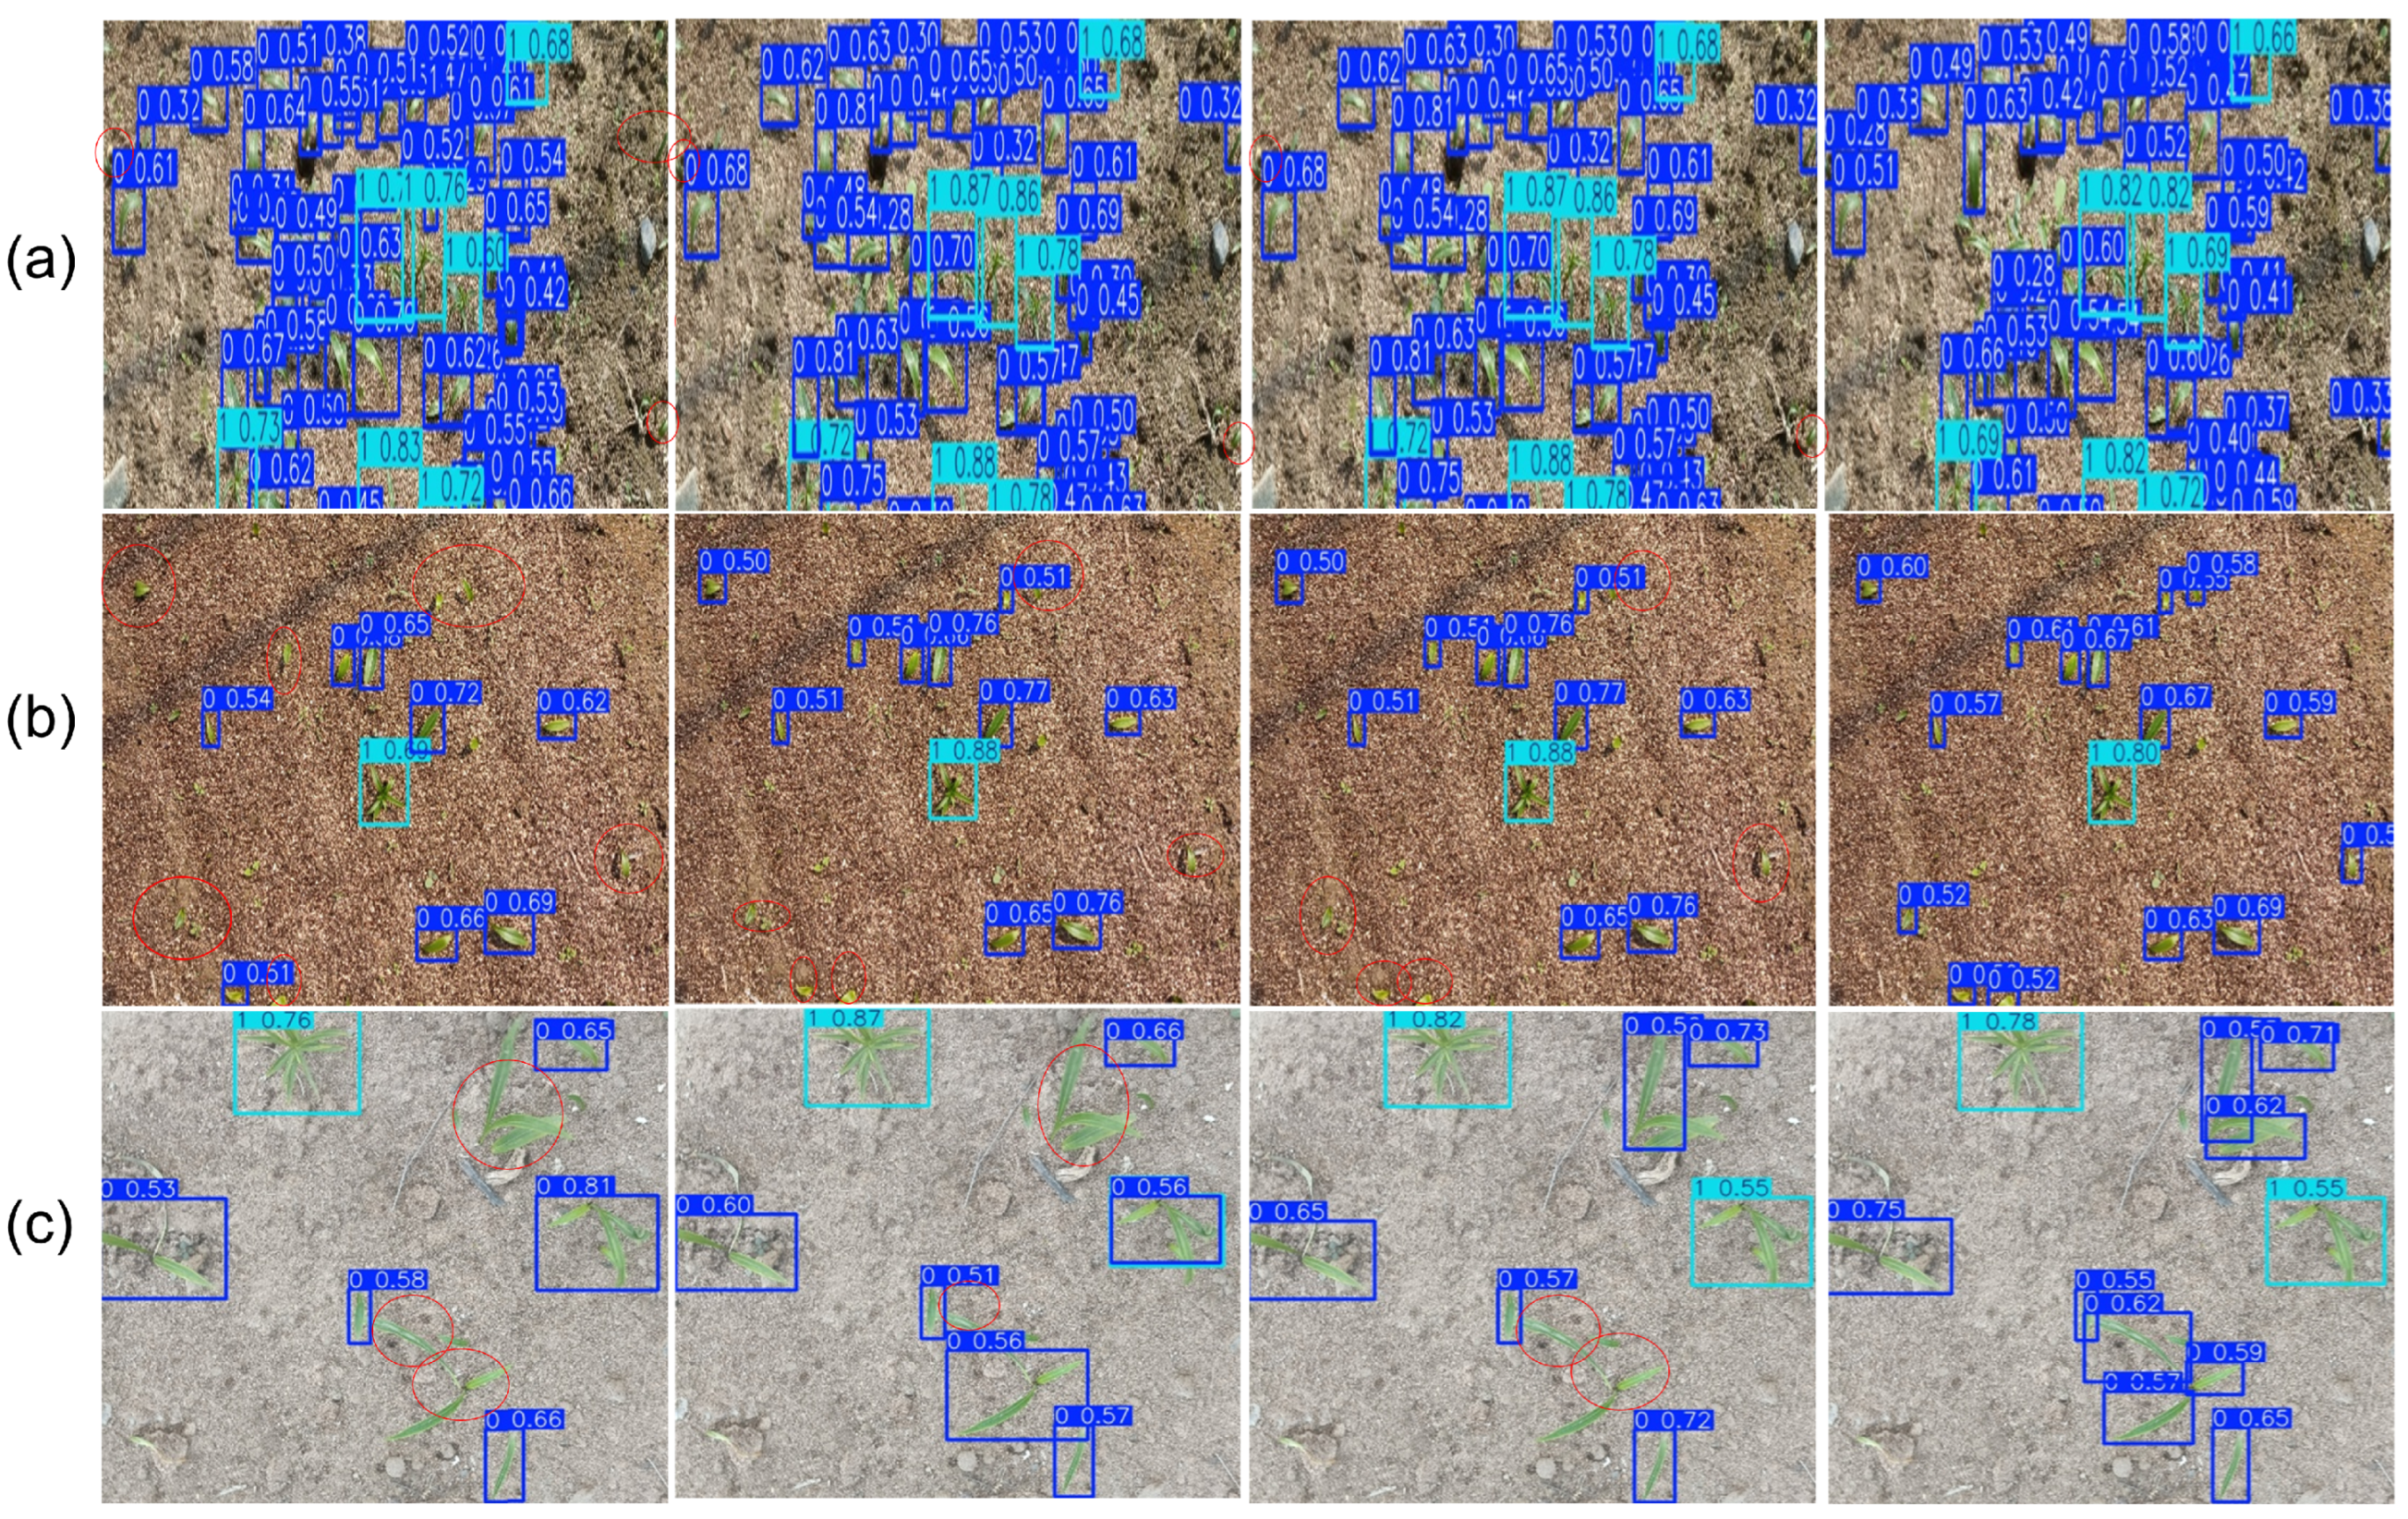
In contrast, the proposed method exhibits superior detection performance across the three representative scenarios, as illustrated in Figure 10. In densely populated target areas, the method successfully identifies the majority of objects, with bounding boxes distributed more evenly and showing less overlap, thereby reducing missed detections and duplicate detections. In images with complex backgrounds or varying lighting conditions, the proposed method maintains high recognition accuracy and stability, while achieving a lower false positive rate compared with the YOLO series models. Particularly under light gray background conditions (third row), other methods suffer from noticeable recognition confusion and bounding box displacement, whereas the proposed method generates more compact bounding boxes that align more closely with the object contours. The red circles highlight typical false detections and missed detections, further demonstrating the robustness of the proposed method. Overall, these comparative results indicate that the proposed method not only improves detection accuracy and stability but also provides a more reliable foundation for downstream agricultural tasks such as crop management and weed control.
Based on the statistics in Table 5, significant differences can be observed among the models in terms of false positive rate and duplicate detection rate. YOLOv5 exhibits a false positive rate of 15% and a duplicate detection rate of 10%, showing average performance, but with relatively high missed detections, indicating that some weeds are not recognized under complex field conditions, reducing overall detection coverage. Although YOLOv8 improves detection sensitivity, its false positive rate and duplicate detection rate are 13% and 12%, respectively, higher than those of YOLOv5, suggesting that redundant detection boxes are more likely to occur in complex field environments, potentially affecting weed count statistics and the accuracy of laser weeding points. YOLOv10 shows a slight improvement in false positive rate but its duplicate detection rate rises to 15%, indicating that the same target is detected multiple times. In contrast, the proposed method in this study outperforms the YOLO series models in both metrics, with a false positive rate and duplicate detection rate of 8%, consistent with the more compact and fewer erroneous detection boxes, shown in Figure 8, demonstrating a clear advantage in reducing both false and duplicate detections.

3.3.5. Comparison and Selection of Segmentation Networks

In this section, five mainstream semantic segmentation network models—ResNet18, ResNet34, ResNet50 [29], UNet [30], Segformer [31], LETNet [32], and DeepLabv3 [33]—were evaluated and compared. The experimental results are presented in Table 6. As shown, ResNet18 achieved a mean Intersection over Union (mIoU) of 87.76%. ResNet34 and ResNet50 obtained slightly higher mIoU scores of 88.0% and 90.0%, respectively, improving by 0.24 and 2.24 percentage points over ResNet18. However, these improvements came at the cost of increased computational complexity. The FLOPs for ResNet34 and ResNet50 were 188.55 G and 215.53 G, respectively, significantly higher than the 92.0 G of ResNet18, which demonstrates clear advantages in model complexity and inference time.In contrast, UNet and DeepLabv3 exhibited relatively weaker performance in this experiment. UNet achieved an mIoU of 82.5%, and DeepLabv3 reached 80.2%, both substantially lower than the ResNet series. Moreover, their computational demands and parameter counts were considerably higher than those of ResNet18, especially for DeepLabv3, with FLOPs reaching 276.44 G and parameters totaling 72.42 M, which severely impacted inference speed and resource consumption. This makes them less suitable for deployment on resource-constrained edge devices. Although the lightweight segmentation networks Segformer and LETNet outperform the ResNet18 network in terms of FLOPs and parameter count, their mIoU accuracies are only 82.3% and 83.5%, respectively, which is insufficient to meet the experiment’s requirements for precise delineation of crop edges. Considering multiple factors including mIoU, FLOPs, and model parameters, ResNet18 was ultimately selected as the backbone segmentation network for this study. This model offers a favorable balance between segmentation accuracy and computational efficiency, achieving faster inference speeds while maintaining high precision, which meets the real-time requirements of practical applications.

3.4. Overall Scheme Evaluation and Deployment

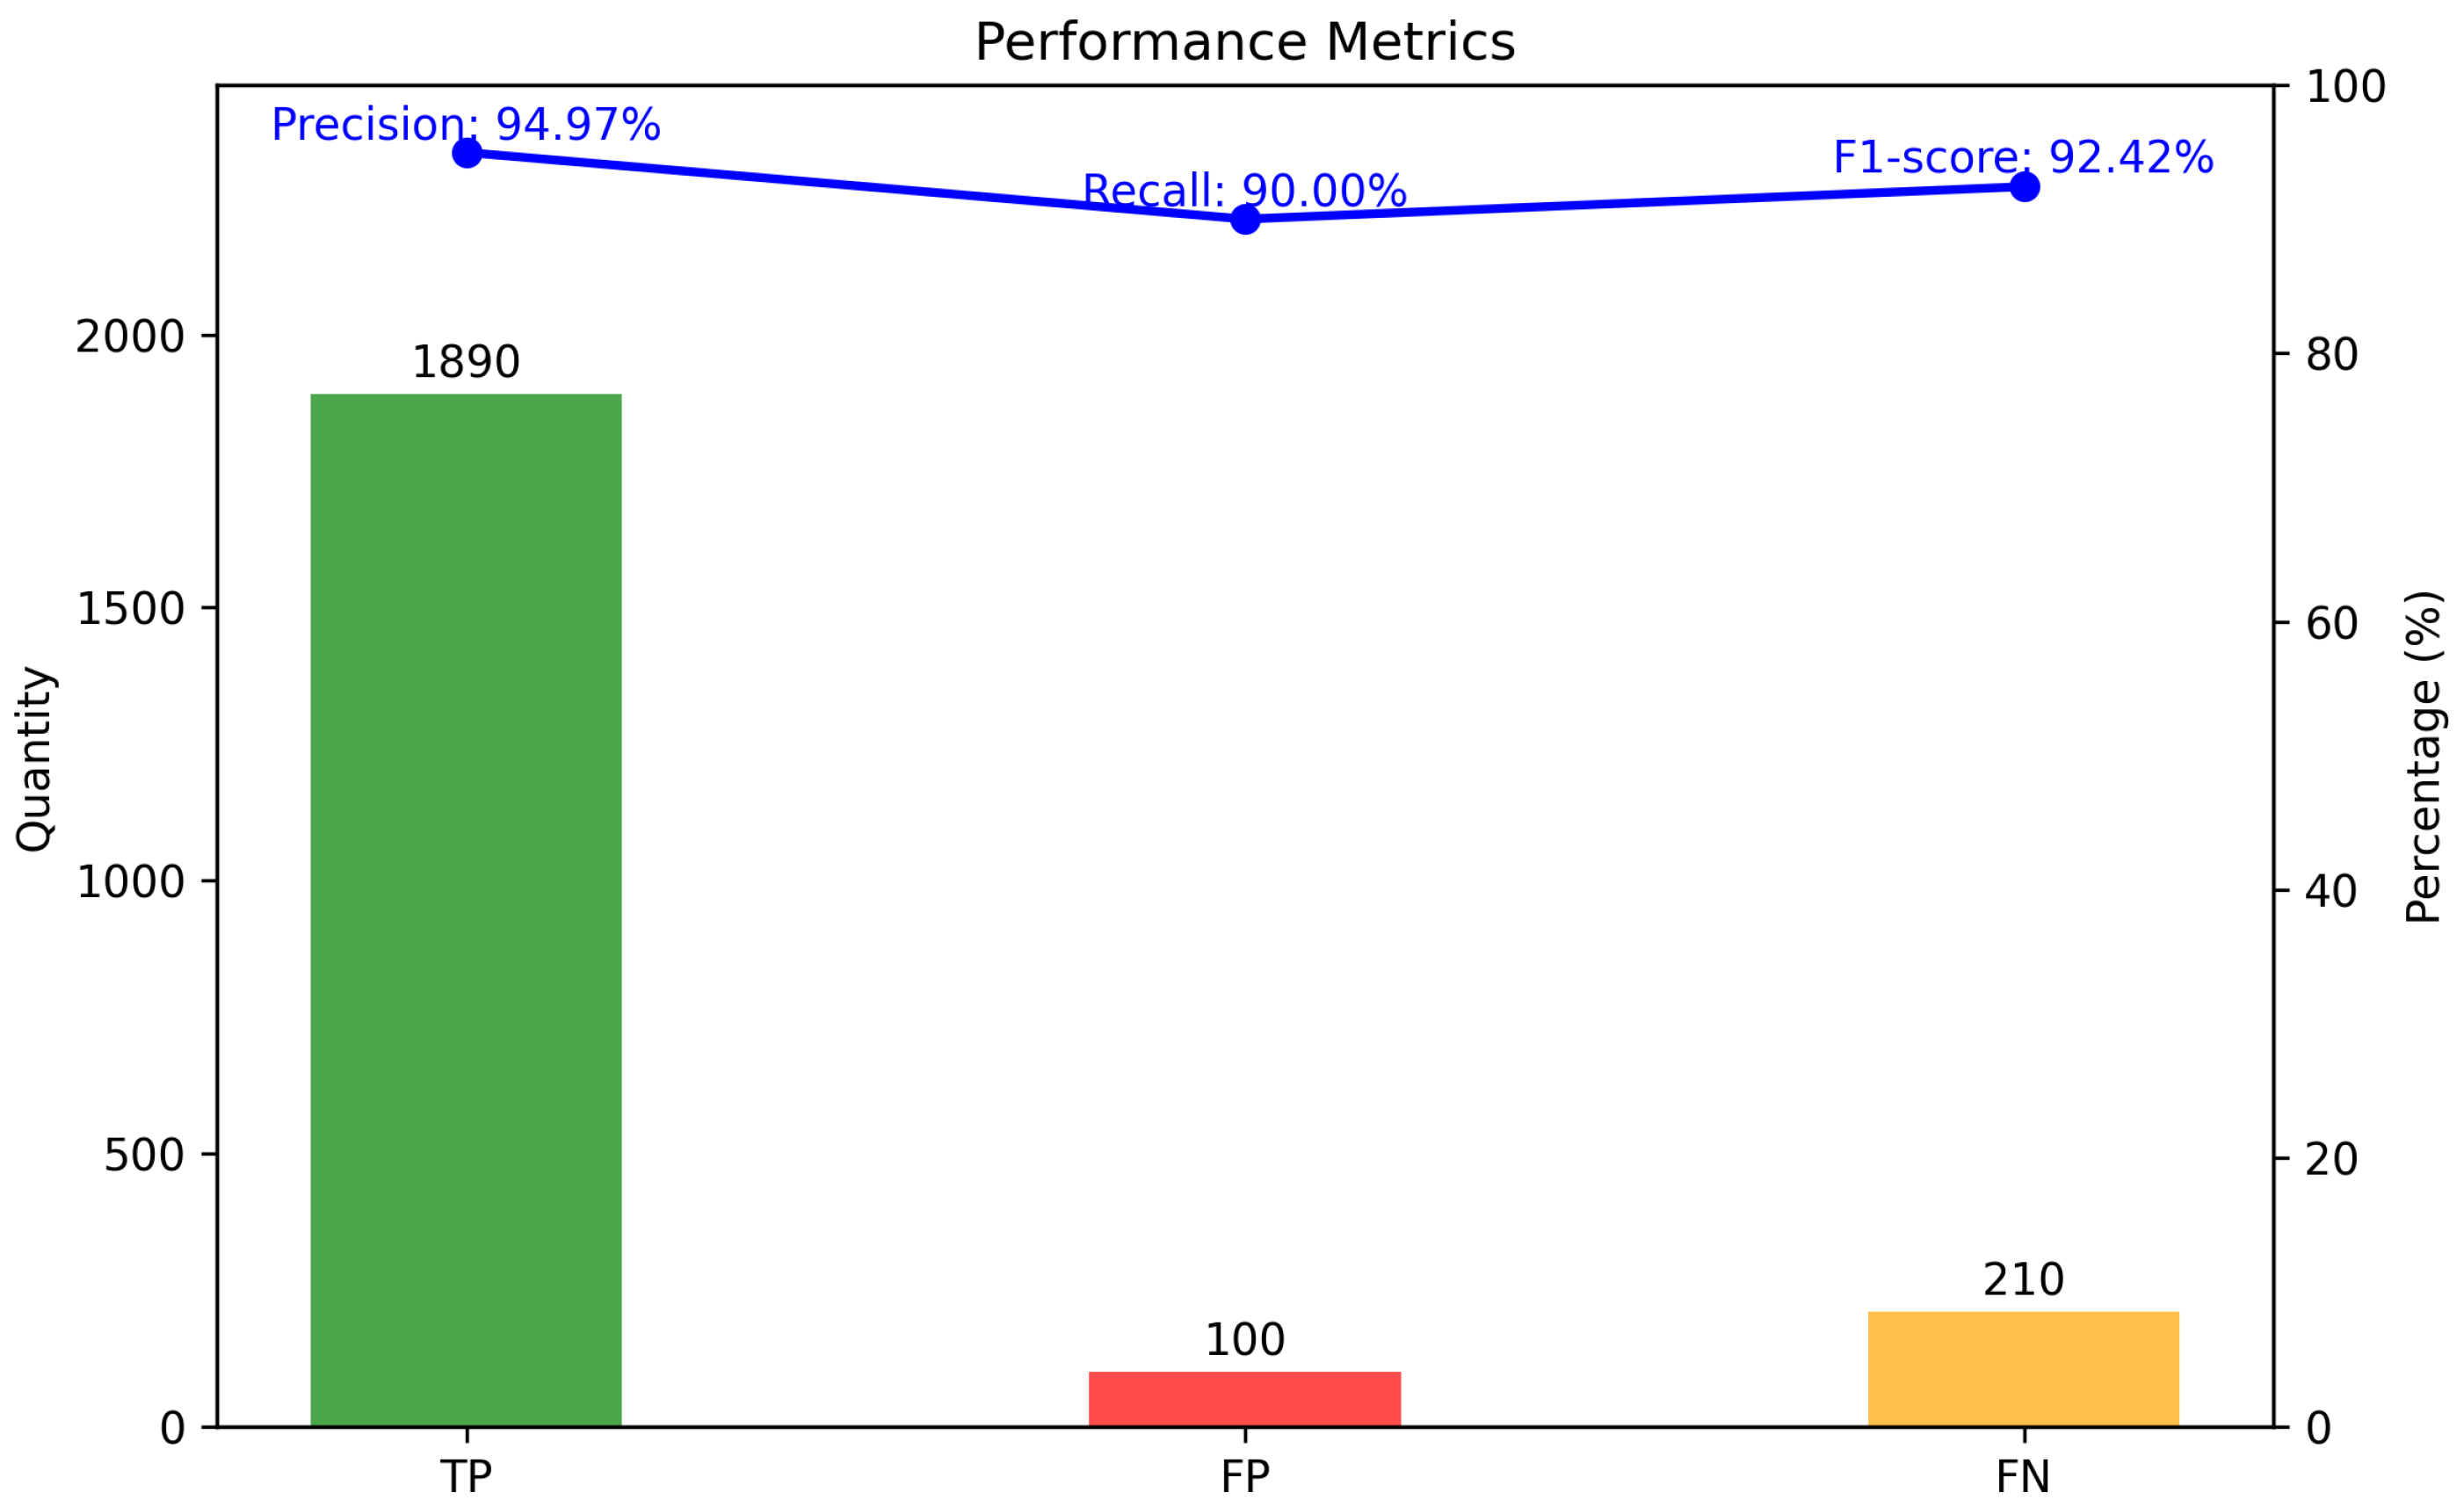
To evaluate the performance of the proposed weed detection method in actual field scenarios, a total of 120 test images (containing 2100 weed instances) were manually annotated to construct a ground-truth dataset. Detection results were matched one-to-one with the centroids of the annotated bounding boxes. A detected box correctly matched to an annotation was counted as a True Positive (TP); detections without a corresponding annotation were counted as False Positives (FP), and annotations not matched by any detection were counted as False Negatives (FN). The statistical results show TP = 1890, FP = 100, and FN = 210, as shown in Figure 11. Based on these values, the Precision, Recall, and F1-score were calculated as 94.97%, 90.00%, and 92.42%, respectively, with an approximate false detection rate of 5%.
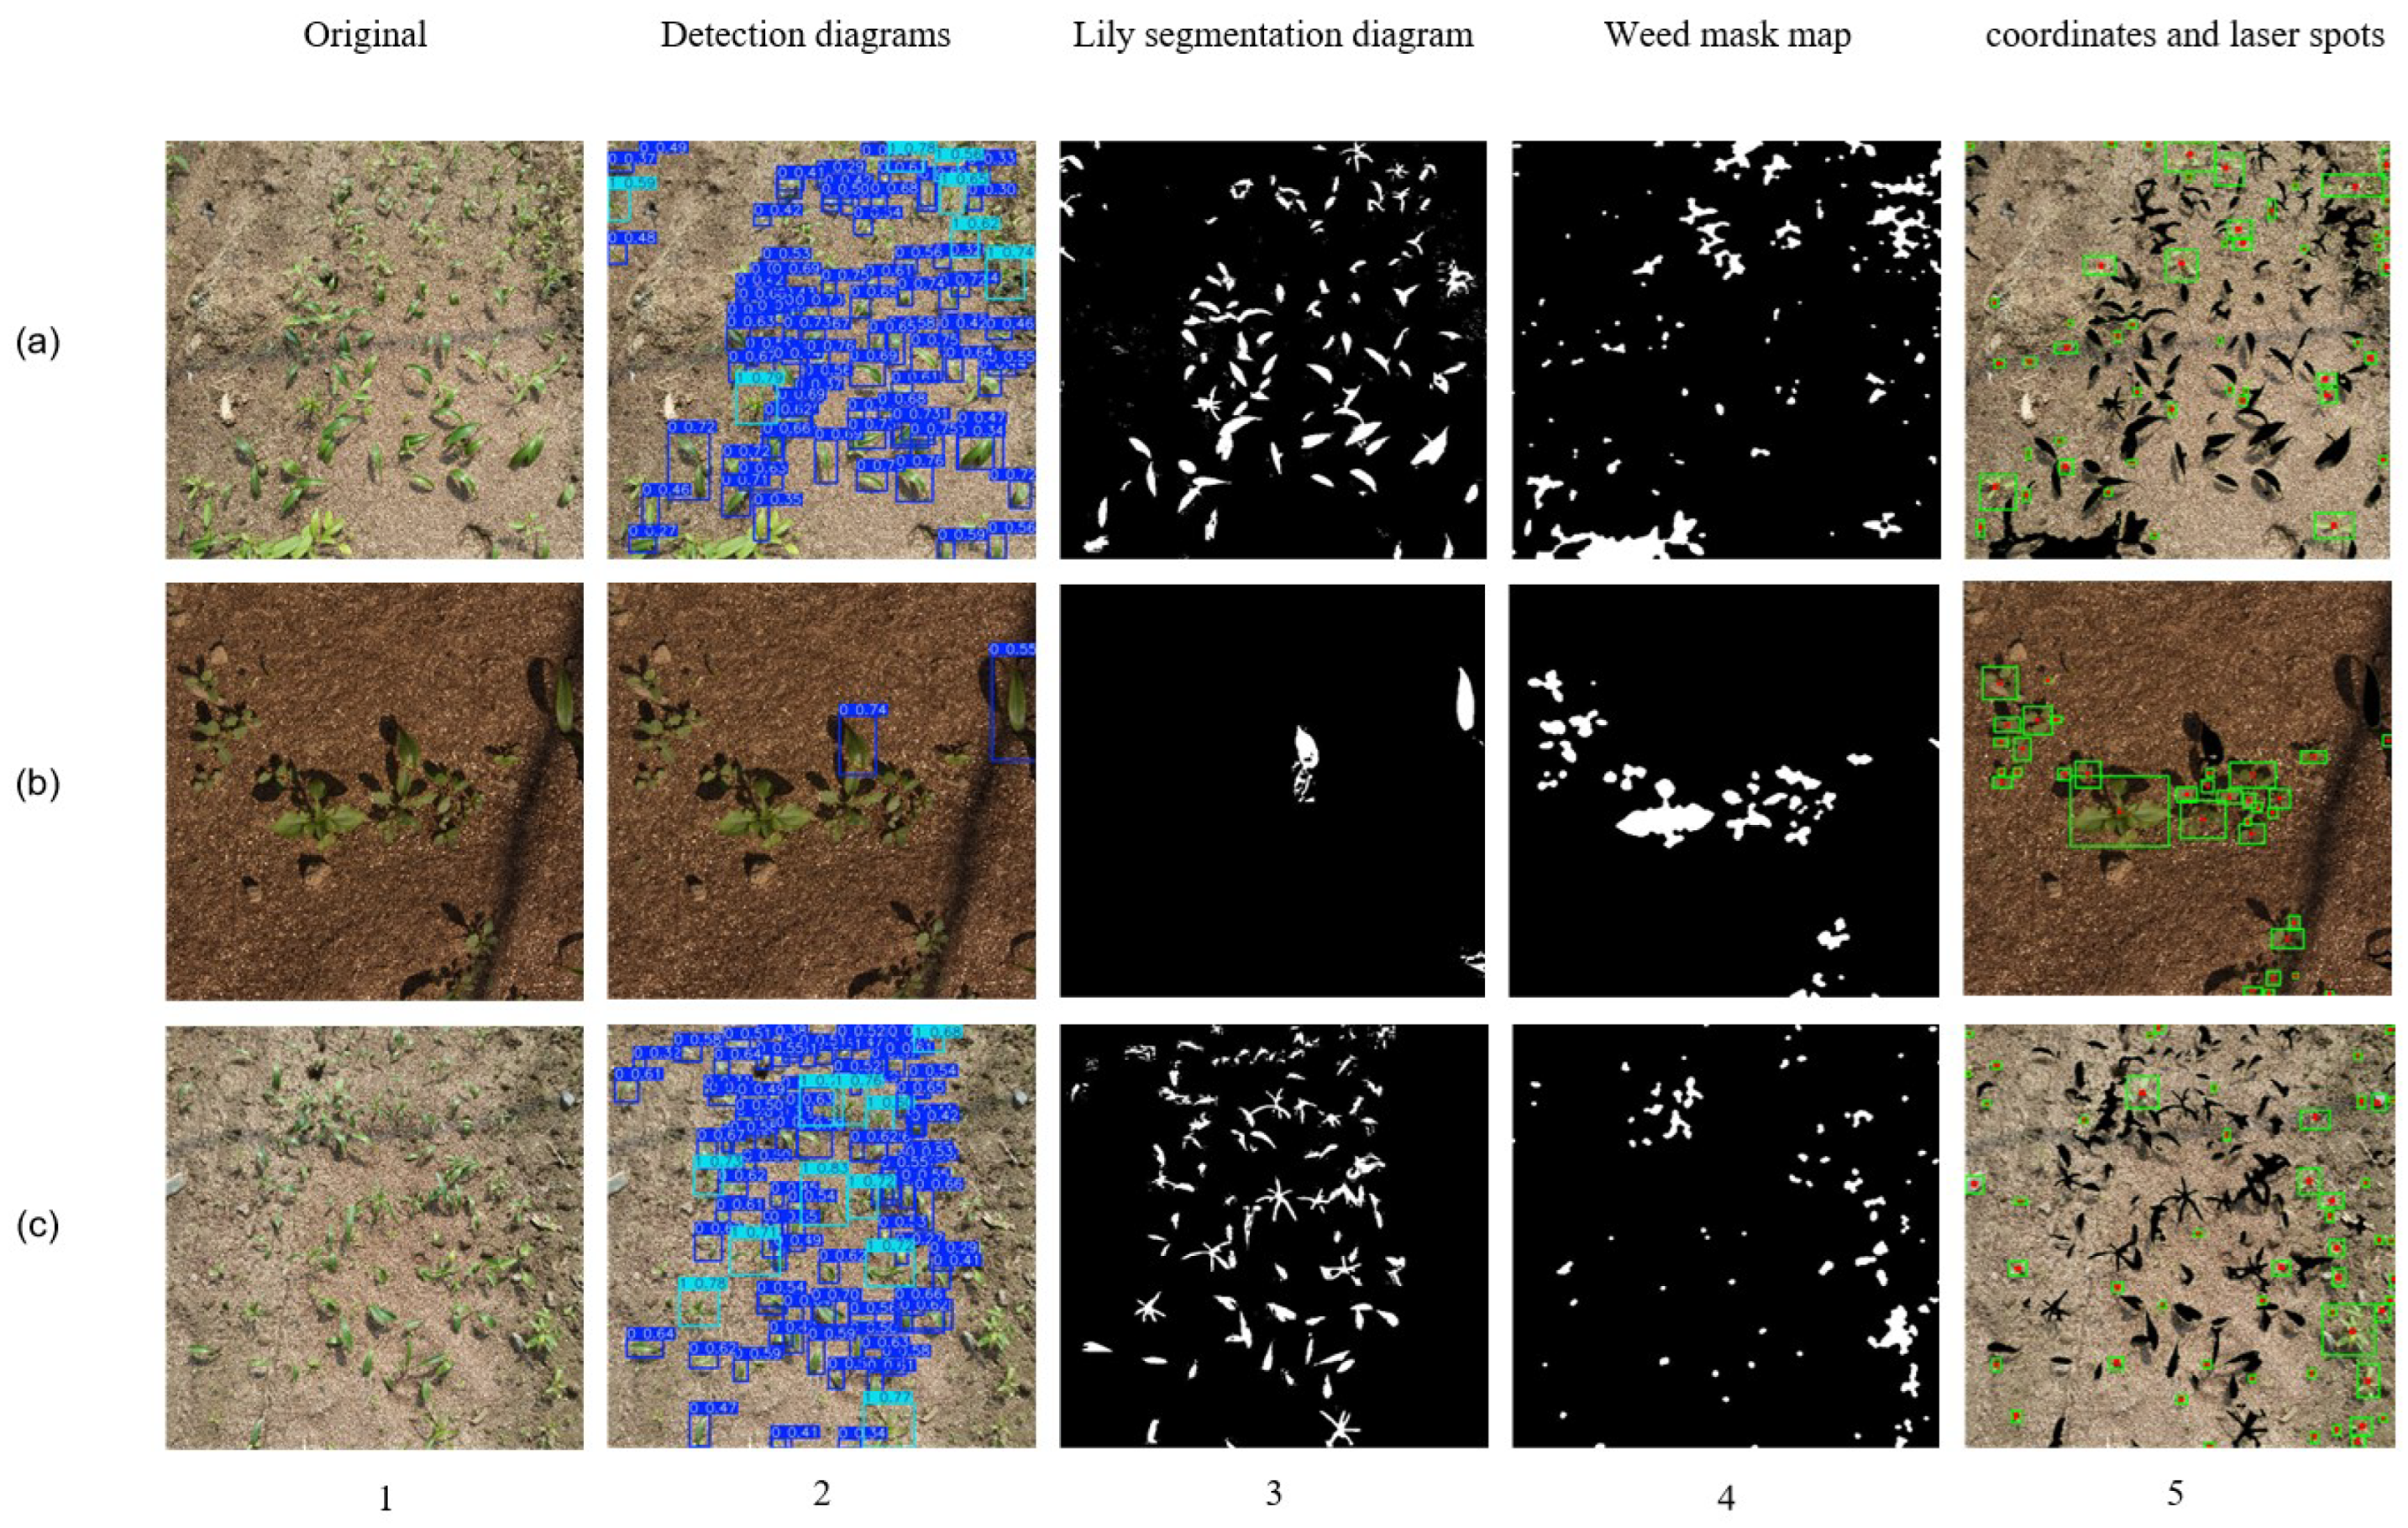
To further validate the superiority of our overall weed detection method, several test images were selected from the test set to visually demonstrate the performance of the two-stage weed detection on the PC platform, covering scenarios such as dense weed distribution, sparse distribution, and overcast conditions. Figure 12 illustrates the system’s processing workflow and detection results across three different field environments. Each row corresponds to a test sample representing different scenarios—Figure 12a, Figure 12b, and Figure 12c, respectively. From left to right, the images display the results of five sequential stages: the original image, lily target detection results by the YOLOv8-morse model, lily segmentation masks generated by ResNet18, weed masks after removing lilies, and finally, the extracted weed centroid coordinates along with the laser targeting positions.
Taking Figure 12a in Figure 12 as an example, under dense lily conditions, the system first accurately identifies the lily regions using the detection network (as shown in Figure 12a(2)) and then performs precise segmentation of the lilies based on the ResNet18 model (as shown in Figure 12a(3)). Subsequently, potential weed regions are extracted by applying appropriate dilation to the segmentation mask combined with HSV color space information (as shown in Figure 12a(4)). To avoid laser misfires on lilies, the system further automatically filters out weeds that are too close to the lily areas. Finally, the system extracts the centroid positions of the remaining weeds and generates a point map for laser targeting (as shown in Figure 12a(5)) to guide subsequent weeding operations. Experimental results demonstrate that the two-stage weed detection system can achieve high-precision identification and extraction of weed targets while ensuring the lily crop regions are not mistakenly harmed. Statistical analysis shows that the overall accuracy of the system in weed detection reaches 95%, with a false detection rate of 3%. The false detections mainly occur in some background areas mistakenly identified as weeds, such as stones. In general, the system effectively excludes lily crop areas while achieving high-precision extraction of weed targets, validating the practical feasibility and effectiveness of the proposed method for field weed detection tasks.
As shown in Figure 13e, the yellow boxes indicate weeds that were not successfully detected, i.e., missed detections. Further analysis reveals that these cases mostly occur in shaded regions. Due to the strong illumination differences and plant shadows present in the field environment, the edges and texture features of weeds are locally disturbed, reducing the contrast between weeds and the background. This indicates that shadows are the main factor leading to missed detections and reflects the limited robustness of the proposed method under conditions with extensive shading, which requires further optimization in future work.
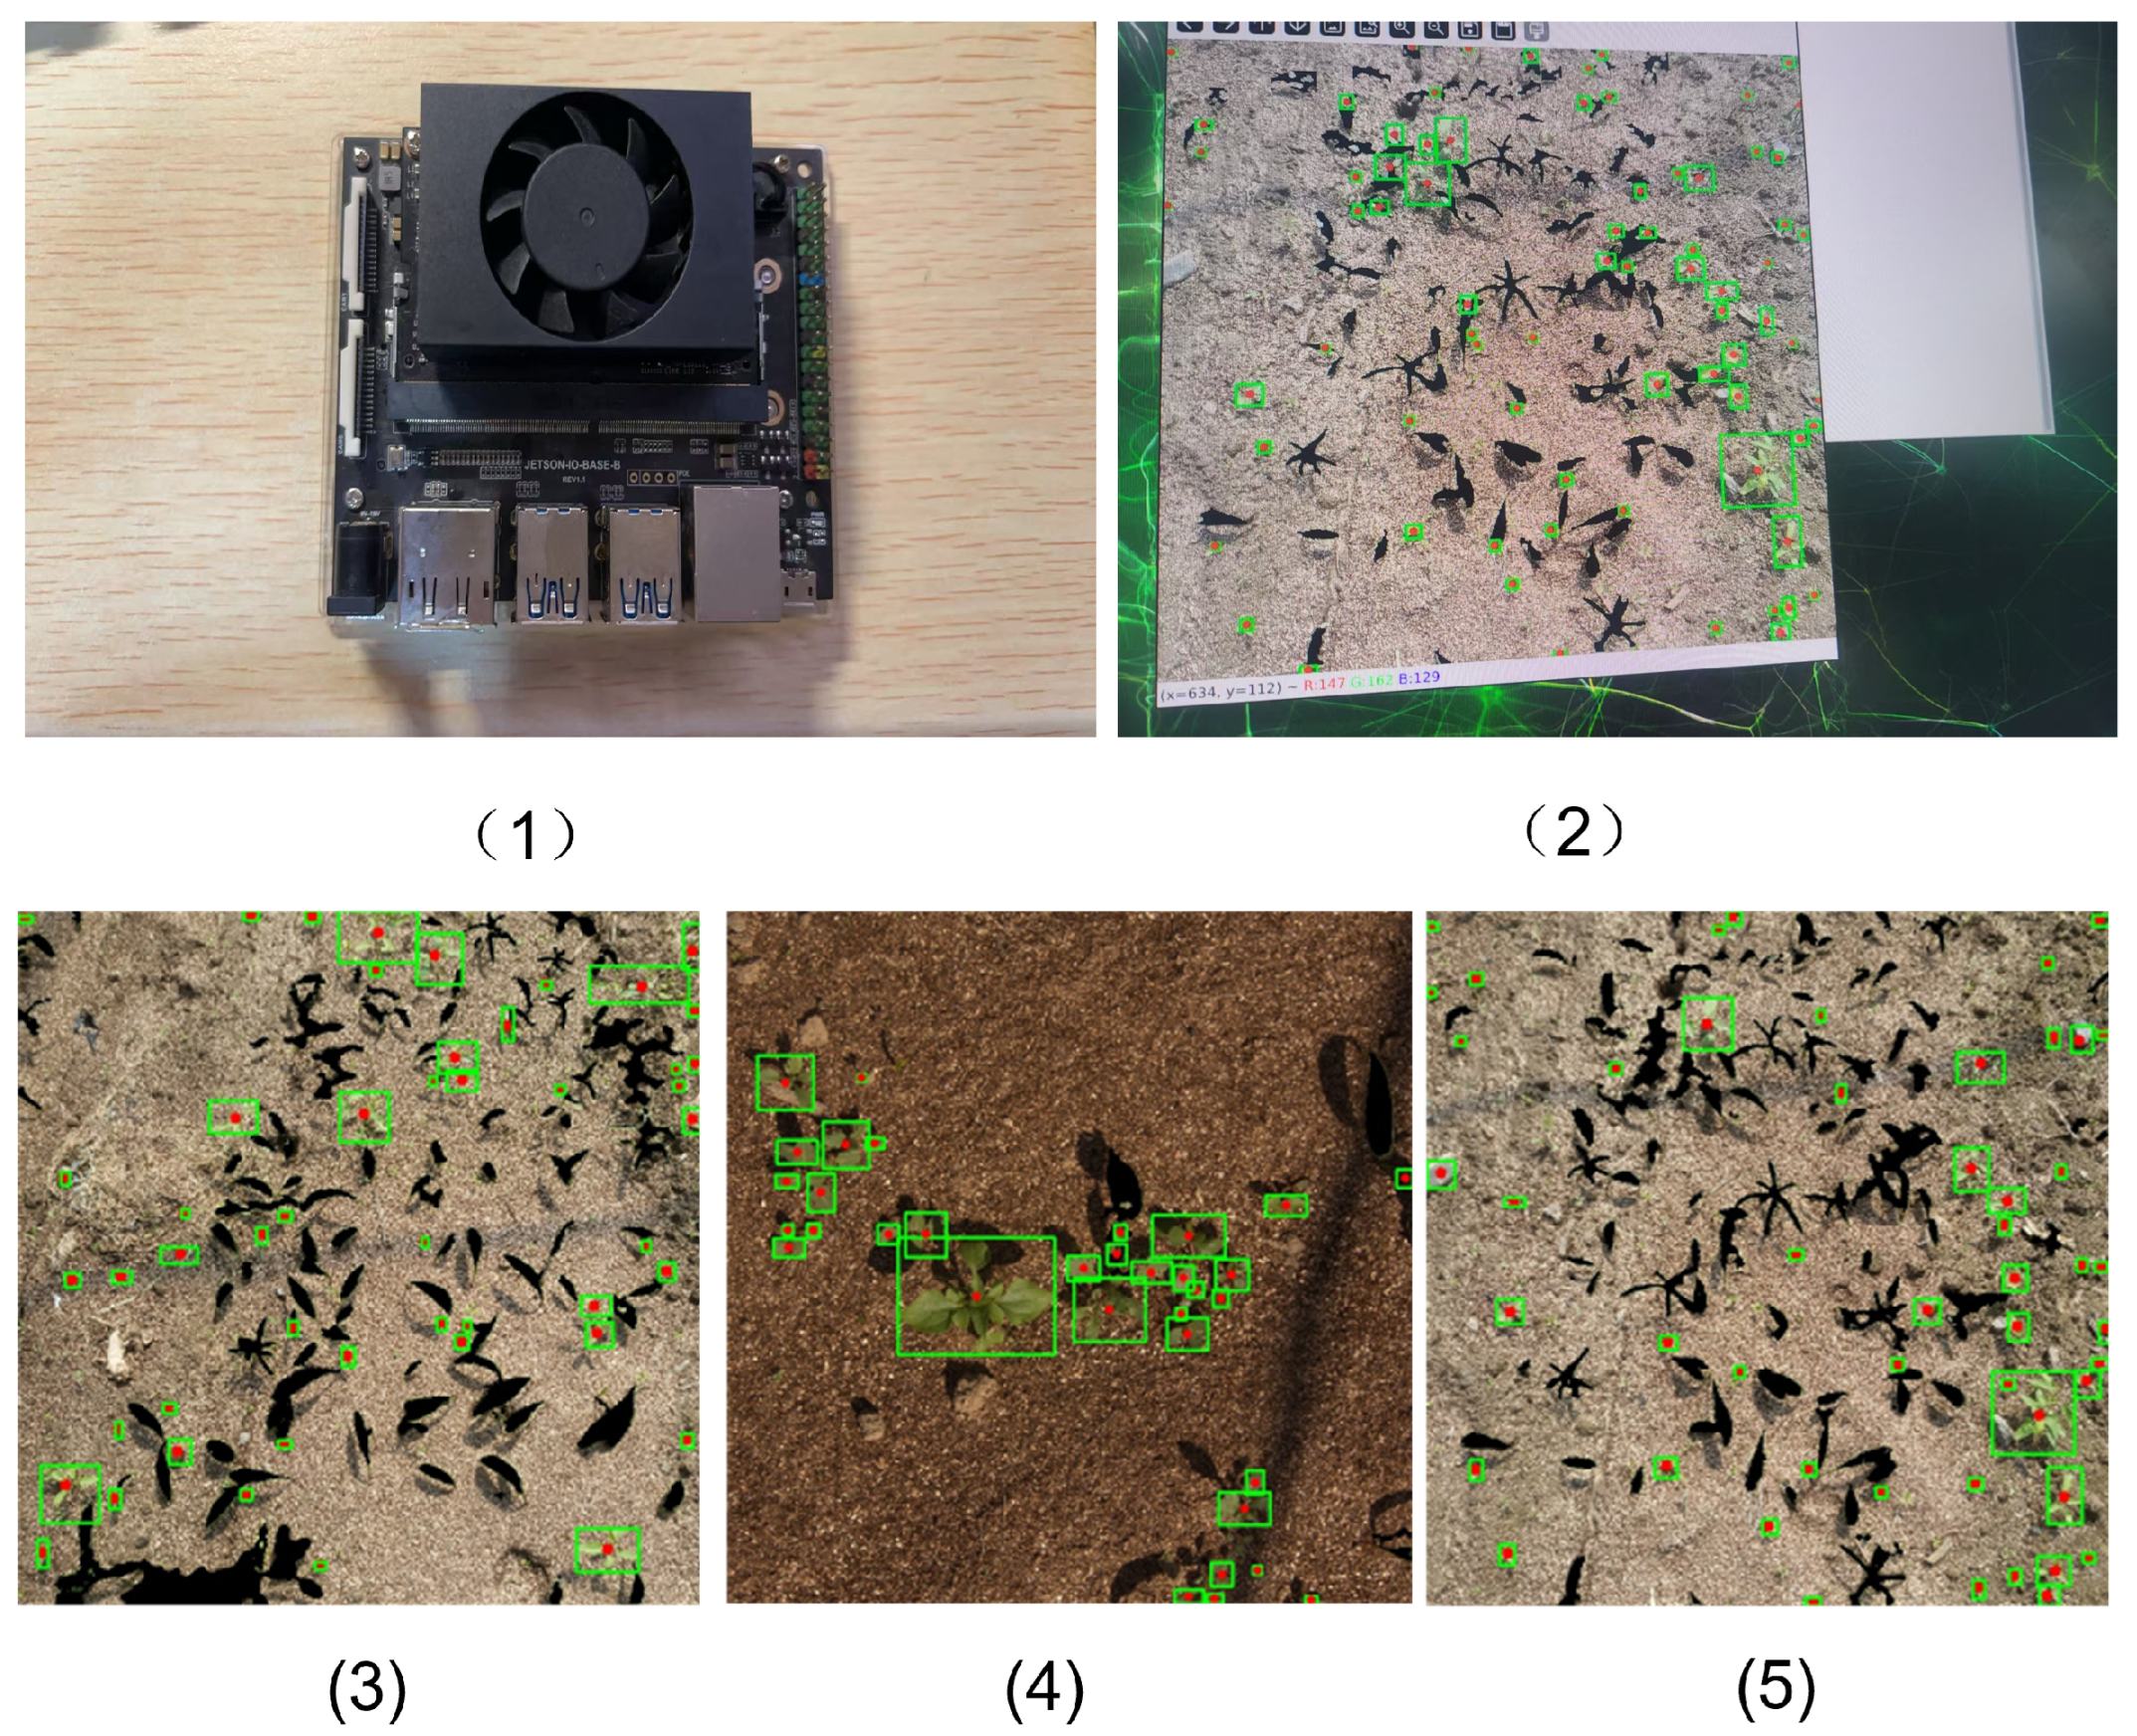
To further validate the effectiveness and feasibility of the proposed two-stage weed detection algorithm, the entire system was deployed and tested on the NVIDIA Jetson TX2 edge device (Nvidia Corporation, Santa Clara, CA, USA) (Figure 14(1)). The Jetson TX2 is a widely used embedded computing platform for deep learning inference, equipped with a 256-core Pascal GPU, 8 GB LPDDR4 memory, and an ARM Cortex-A57 CPU, with power consumption ranging from 7.5 W to 15 W. The software environment was configured with Ubuntu 20.04.5 LTS, Python 3.8, and PyTorch 1.8.0. As illustrated in Figure 14(2–5), the system was successfully deployed on the Jetson TX2, and the corresponding detection results under different field conditions were obtained. Experimental results show that the weed detection model deployed on the embedded platform experiences an approximate 2% decrease in mean detection accuracy compared with deployment on a high-performance desktop platform, which is primarily due to the limited computational resources of the embedded hardware. Nevertheless, the performance remains within an acceptable range. In practical field operation scenarios, maintaining smooth system operation and real-time performance is a more critical requirement, both of which are well satisfied by the Jetson TX2 deployment.

4. Discussion

This study proposed a two-stage weed detection and localization framework for complex lily field environments, integrating crop detection, segmentation, and weed region extraction. Field experiments demonstrated that the system achieved an overall detection accuracy of 92% on the embedded platform, with laser targeting accuracy exceeding 90%. These results suggest that the proposed method provides a feasible solution for the embedded deployment of intelligent laser weeding systems. However, several limitations were also observed in the experiments. First, shadowed conditions in the field still pose challenges, often leading to missed detections or incomplete boundaries, which can compromise laser targeting accuracy. Second, minor errors from the detection and segmentation stages may accumulate, reducing the integrity of the crop mask and weakening the robustness of HSV-based weed extraction. These issues indicate that further improvements are necessary to ensure stable performance in diverse and dynamic field environments.
Future research can be carried out in the following directions: (1) incorporating multiscale feature fusion and illumination-robust enhancement techniques to improve system performance under shadowed or uneven lighting conditions; (2) exploring model lightweighting and parallel computing strategies to further enhance real-time performance and reduce the computational burden on embedded devices; (3) strengthening the integration of the detection framework with laser weeding hardware to establish a more efficient closed-loop system of recognition–localization–execution; and (4) expanding datasets across regions, seasons, and crop types to enhance the generalization and adaptability of the model in practical agricultural applications.

5. Conclusions

This study proposed a two-stage detection and localization framework to address the challenge of weed detection in complex lily field environments. In the first stage, lily crops were detected using the YOLO-Morse model, and crop regions were segmented via ResNet18. In the second stage, weed regions were extracted by combining the HSV color space with morphological operations, thereby enabling high-precision weed localization and laser spot selection for weeding. Field experiments demonstrated that the system achieved an overall detection accuracy of 92% on the embedded platform, with laser targeting accuracy exceeding 90%, while maintaining satisfactory real-time performance. These results indicate that the proposed framework achieves an effective balance among detection accuracy, real-time responsiveness, and embedded deployment capability.
In conclusion, the developed system provides an intelligent, efficient, and low-cost solution for weed management in high-value crops such as lilies, and it lays a solid foundation for the broader application of intelligent laser weeding technology in precision agriculture.

Author Contributions

Conceptualization, Y.X. and C.L.; Methodology, Y.X. and C.L.; Validation, J.L. (Jiahao Liang); Writing—Original Draft Preparation, C.L.; Writing—Review and Editing, J.L. (Jian Li), C.L. and X.J.; Supervision, J.L. (Jian Li) and Y.X.; Funding Acquisition, Y.X. All authors have read and agreed to the published version of the manuscript.

Funding

This research was funded by Jilin Provincial Department of Science and Technology-Key Research and Development, grant number 20230202035NC.

Institutional Review Board Statement

Not applicable.

Data Availability Statement

The original contributions presented in the research are included in the article; further inquiries can be directed to the corresponding author.

Conflicts of Interest

The authors declare no conflicts of interest.

References

  1. Zhang, H.; Jin, L.; Zhang, J.-B.; Niu, T.; Guo, T.; Chang, J. Chemical constituents from the bulbs of Lilium davidii Var. unicolor Anti-Insomnia Effect. Fitoterapia 2022, 161, 105252. [Google Scholar]
  2. Yang, W.; Wang, P.; Zhang, W.; Xu, M.; Yan, L.; Yan, Z.; Du, W.; Ouyang, L.; Liu, B.; Wu, Z.; et al. Review on preservation techniques of edible lily bulbs in China. CyTA-J. Food 2022, 20, 172–182. [Google Scholar]
  3. Little, N.G.; DiTommaso, A.; Westbrook, A.S.; Ketterings, Q.M.; Mohler, C.L. Effects of fertility amendments on weed growth and weed–crop competition: A review. Weed Sci. 2021, 69, 132–146. [Google Scholar] [CrossRef]
  4. Wiafe, E.K.; Betitame, K.; Ram, B.G.; Sun, X. Technical study on the efficiency and models of weed control methods using unmanned ground vehicles: A review. Artif. Intell. Agric. 2025, 15, 622–641. [Google Scholar] [CrossRef]
  5. Aravind, R.; Daman, M.; Kariyappa, B.S. Design and development of automatic weed detection and smart herbicide sprayer robot. In Proceedings of the 2015 IEEE Recent Advances in Intelligent Computational Systems (RAICS), Kerala, India, 10–12 December 2015; pp. 257–261. [Google Scholar]
  6. Hamuda, E.; Mc Ginley, B.; Glavin, M.; Jones, E. Automatic crop detection under field conditions using the HSV colour space and morphological operations. Comput. Electron. Agric. 2017, 133, 97–107. [Google Scholar] [CrossRef]
  7. Zhang, S.; Guo, J.; Wang, Z. Combing K-means Clustering and Local Weighted Maximum Discriminant Projections for Weed Species Recognition. Front. Comput. Sci. 2019, 1, 4. [Google Scholar] [CrossRef]
  8. Wang, C.; Li, Z. Weed recognition using SVM model with fusion height and monocular image features. Trans. Chin. Soc. Agric. Eng. 2016, 32, 165–174. [Google Scholar]
  9. Ferro, M.V.; Sørensen, C.G.; Catania, P. Comparison of different computer vision methods for vineyard canopy detection using UAV multispectral images. Comput. Electron. Agric. 2024, 225, 109277. [Google Scholar] [CrossRef]
  10. Zoubek, T.; Bumbálek, R.; Ufitikirezi, J.D.M.; Strob, M.; Filip, M.; Špalek, F.; Heřmánek, A.; Bartoš, P. Advancing Precision Agriculture with Computer Vision: A Comparative Study of YOLO Models for Weed and Crop Recognition. Crop Prot. 2025, 190, 107076. [Google Scholar]
  11. Gao, X.; Wang, G.; Zhou, Z.; Li, J.; Song, K.; Qi, J. Performance and speed optimization of DLV3-CRSNet for semantic segmentation of Chinese cabbage (Brassica pekinensis Rupr.) and weeds. Crop Prot. 2025, 195, 107236. [Google Scholar] [CrossRef]
  12. Zhao, P.; Chen, J.; Li, J.; Ning, J.; Chang, Y.; Yang, S. Design and Testing of an Autonomous Laser Weeding Robot for Strawberry Fields Based on DIN-LW-YOLO. Comput. Electron. Agric. 2025, 229, 109808. [Google Scholar] [CrossRef]
  13. Su, W.; Yang, W.; Wang, J.; Ren, D.; Chen, D. MKD8: An Enhanced YOLOv8 Model for High-Precision Weed Detection. Agriculture 2025, 15, 807. [Google Scholar] [CrossRef]
  14. Lu, Z.; Zhang, C.; Lu, L.; Yan, Y.; Jun, W.; Wei, X.; Ke, X.; Jun, T. Star-YOLO: A Lightweight and Efficient Model for Weed Detection in Cotton Fields Using Advanced YOLOv8 Improvements. Comput. Electron. Agric. 2025, 235, 110306. [Google Scholar] [CrossRef]
  15. Ma, C.; Chi, G.; Ju, X.; Zhang, J.; Yan, C. YOLO-CWD: A Novel Model for Crop and Weed Detection Based on Improved YOLOv8. Crop Prot. 2025, 192, 107169. [Google Scholar] [CrossRef]
  16. Fan, X.; Sun, T.; Chai, X.; Zhou, J. YOLO-WDNet: A Lightweight and Accurate Model for Weeds Detection in Cotton Field. Comput. Electron. Agric. 2024, 225, 109317. [Google Scholar] [CrossRef]
  17. Montalvo, M.; Pajares, G.; Guerrero, J.M.; Romeo, J.; Guijarro, M.; Ribeiro, A.; Ruz, J.; Cruz, J. Automatic detection of crop rows in maize fields with high weeds pressure. Expert Syst. Appl. 2012, 39, 11889–11897. [Google Scholar] [CrossRef]
  18. Tao, T.; Wei, X. STBNA-YOLOv5: An Improved YOLOv5 Network for Weed Detection in Rapeseed Field. Agriculture 2024, 15, 22. [Google Scholar] [CrossRef]
  19. Rai, N.; Zhang, Y.; Villamil, M.; Howatt, K.; Ostlie, M.; Sun, X. Agricultural Weed Identification in Images and Videos by Integrating Optimized Deep Learning Architecture on an Edge Computing Technology. Comput. Electron. Agric. 2024, 216, 108442. [Google Scholar] [CrossRef]
  20. Calderara-Cea, F.; Torres-Torriti, M.; Cheein, F.A.; Delpiano, J. A two-stage deep learning strategy for weed identification in grassfields. Comput. Electron. Agric. 2024, 225, 109300. [Google Scholar] [CrossRef]
  21. Mamat, N.; Othman, M.F.; Abdulghafor, R.; Alwan, A.A.; Gulzar, Y. Enhancing image annotation technique of fruit classification using a deep learning approach. Sustainability 2023, 15, 901. [Google Scholar] [CrossRef]
  22. Kang, M.; Ting, C.M.; Ting, F.F.; Phan, R.C.-W. RCS-YOLO: A fast and high-accuracy object detector for brain tumor detection. In Proceedings of the International Conference on Medical Image Computing and Computer-Assisted Intervention, Vancouver, BC, Canada, 8–12 October 2023; Springer: Cham, Switzerland, 2023; pp. 600–610. [Google Scholar]
  23. Sunkara, R.; Luo, T. No more strided convolutions or pooling: A new CNN building block for low-resolution images and small objects. arXiv 2022, arXiv:2208.03641. [Google Scholar] [CrossRef]
  24. Yang, B.; Zhang, X.; Zhang, J.; Luo, J.; Zhou, M.; Pi, Y. EFLNet: Enhancing feature learning network for infrared small target detection. IEEE Trans. Geosci. Remote Sens. 2024, 62, 5906511. [Google Scholar]
  25. Ren, S.; He, K.; Girshick, R.; Sun, J. Faster R-CNN: Towards Real-Time Object Detection with Region Proposal Networks. Adv. Neural Inf. Process. Syst. 2015, 28, 91–99. [Google Scholar]
  26. Wang, A.; Chen, H.; Liu, L.; Wang, Y.; Lu, C. YOLOv10: Real-Time End-to-End Object Detection. Adv. Neural Inf. Process. Syst. 2024, 37, 107984–108011. [Google Scholar]
  27. Khanam, R.; Hussain, M. YOLOv11: An overview of the key architectural enhancements. arXiv 2024, arXiv:2410.17725. [Google Scholar] [CrossRef]
  28. Tian, Y.; Ye, Q.; Doermann, D. YOLOv12: Attention-centric real-time object detectors. arXiv 2025, arXiv:2502.12524. [Google Scholar]
  29. He, K.; Zhang, X.; Ren, S.; Sun, J. Deep Residual Learning for Image Recognition. In Proceedings of the IEEE Conference on Computer Vision and Pattern Recognition (CVPR), Las Vegas, NV, USA, 27–30 June 2016; pp. 770–778. [Google Scholar]
  30. Ronneberger, O.; Fischer, P.; Brox, T. U-Net: Convolutional Networks for Biomedical Image Segmentation. In Proceedings of the International Conference on Medical Image Computing and Computer-Assisted Intervention (MICCAI), Munich, Germany, 5–9 October 2015; Springer: Cham, Switzerland, 2015; pp. 234–241. [Google Scholar]
  31. Xie, E.; Wang, W.; Yu, Z.; Anandkumar, A.; Alvarez, J.M.; Lu, Y. SegFormer: Simple and efficient design for semantic segmentation with transformers. Adv. Neural Inf. Process. Syst. 2021, 34, 12077–12090. [Google Scholar]
  32. LeCun, Y.; Bottou, L.; Bengio, Y.; Haffner, P. Gradient-based learning applied to document recognition. Proc. IEEE 2002, 86, 2278–2324. [Google Scholar] [CrossRef]
  33. Chen, L.C.; Papandreou, G.; Schroff, F.; Adam, H. Rethinking Atrous Convolution for Semantic Image Segmentation. arXiv 2017, arXiv:1706.05587. [Google Scholar] [CrossRef]
Figure 1. Lily photos from different periods: (a) single-leaf stage, (b) two-leaf stage stage, and (c) leaf-expansion stage.
Agriculture 15 01967 g001
Figure 2. (a) Detection diagrams. (b) Single-leaf mask. (c) Multi-leaf mask diagram.
Agriculture 15 01967 g002
Figure 3. Overall framework diagram.
Agriculture 15 01967 g003
Figure 4. Framework of the YOLOV8-morse model.
Agriculture 15 01967 g004
Figure 5. Structure diagram of the improved RCS-MSA module.
Agriculture 15 01967 g005
Figure 6. SPD-Conv convolution module.
Agriculture 15 01967 g006
Figure 7. Heatmaps: (a) input, (b) YOLOv8 heatmap, (c) RCS-MSA heatmap, (d) Spd-Conv heatmap, (e) ATFL heatmap, and (f) combined heatmap.
Agriculture 15 01967 g007
Figure 8. Precision–recall curve comparison across different models.
Agriculture 15 01967 g008
Figure 9. Lily detection results of different models under various environments: (a) represents a dense scenario; (b) represents a sparse scenario; (c) represents an overcast scenario.
Agriculture 15 01967 g009
Figure 10. Enlarged views of the areas highlighted by red boxes: (a) represents an enlarged view of the dense scenario; (b) represents an enlarged view of the sparse scenario; (c) represents an enlarged view of the overcast scenario.
Agriculture 15 01967 g010
Figure 11. The figure compares Precision, Recall, and F1-score to comprehensively evaluate the detection performance of the model.
Agriculture 15 01967 g011
Figure 12. Overall weed detection and laser targeting.
Agriculture 15 01967 g012
Figure 13. Visualization of missed weed detections. (a) Original image; (b) detection diagrams; (c) lily segmentation diagram; (d) Weed mask image; (e) coordinates and laser spots.
Agriculture 15 01967 g013
Figure 14. Overall detection results on the development board. (1) Jetson TX2 device; (2) deployment interface; (3)–(5) detection results under different scenarios.
Agriculture 15 01967 g014
Table 1. Comparison of small object detection performance with different convolutional blocks.
MethodmAP@0.5 (%)Parameters (M)
YOLOv8 Original82.812.9
YOLOv8 + SPD-Conv84.313.0
YOLOv8 + CBAM81.511.8
YOLOv8 + SPP83.016.5
YOLOv8 + FPN82.812.9
Table 2. Ablation study results of the model (mean ± std over 3 runs).
ModelmAP (%)Accuracy (%)Precision (%)Recall (%)
RCS-MSA Spd-Conv ATFL Single More
×××82.8 ± 0.279.6 ± 0.378.0 ± 0.285.9 ± 0.378.8 ± 0.3
××84.0 ± 0.280.8 ± 0.378.6 ± 0.487.3 ± 0.380.4 ± 0.3
××84.3 ± 0.280.6 ± 0.379.0 ± 0.388.0 ± 0.378.8 ± 0.3
××82.9 ± 0.179.6 ± 0.278.4 ± 0.286.1 ± 0.278.4 ± 0.2
×84.5 ± 0.381.2 ± 0.279.5 ± 0.287.8 ± 0.380.0 ± 0.2
×84.0 ± 0.280.2 ± 0.379.1 ± 0.386.7 ± 0.279.5 ± 0.2
×85.2 ± 0.282.5 ± 0.379.5 ± 0.387.9 ± 0.379.5 ± 0.3
86.0 ± 0.383.1 ± 0.380.5 ± 0.288.9 ± 0.280.4 ± 0.3
Table 3. Computational complexity and inference speed under different module combinations.
RCS-MSASpd-ConvATFLFLOPs (G)Memory Usage (M)GPU Speed (ms)
×××8.112.946
××11.911.440
×11.611.639
10.111.236
Table 4. Performance comparison of different models.
ModelmAP (%)Memory Usage (M)FLOPs (G)
Faster-RCNN70.1120.312.1
YOLOv580.39.557.1
YOLOv882.911.478.1
YOLOv1081.910.288.2
YOLO1182.09.886.4
YOLOv1284.09.08.0
Ours86.013.09.0
Table 5. Comparison of different models in terms of false positive rate and duplicate detection rate.
ModelFalse Positive Rate (%)Duplicate Detection Rate (%)
YOLOv51510
YOLOv81312
YOLOv101415
Ours88
Table 6. Comparison of different segmentation models.
ModelmIoU (%)Flops (G)Params (M)
Resnet1887.7692.011.5
Unet82.5605.3929.02
Deeplabv380.2276.4472.42
Resnet3488.0188.5521.61
Resnet5090.0215.5331.42
Segformer82.37512.5 M
LETNet83.5528 M
Disclaimer/Publisher’s Note: The statements, opinions and data contained in all publications are solely those of the individual author(s) and contributor(s) and not of MDPI and/or the editor(s). MDPI and/or the editor(s) disclaim responsibility for any injury to people or property resulting from any ideas, methods, instructions or products referred to in the content.