Article

A Single-Cell Assessment of Intramuscular and Subcutaneous Adipose Tissue in Beef Cattle

by
Mollie M. Green
1,
Hunter R. Ford
1,
Alexandra P. Tegeler
1,
Oscar J. Benitez
1,2,
Bradley J. Johnson
3 and
Clarissa Strieder-Barboza
1,2,*
1
Department of Veterinary Sciences, Texas Tech University, Lubbock, TX 79409, USA
2
School of Veterinary Medicine, Texas Tech University, Amarillo, TX 79106, USA
3
Department of Animal and Food Sciences, Texas Tech University, Lubbock, TX 79409, USA
*
Author to whom correspondence should be addressed.
Agriculture 2025, 15(14), 1545; https://doi.org/10.3390/agriculture15141545
Submission received: 20 May 2025 / Revised: 20 June 2025 / Accepted: 24 June 2025 / Published: 18 July 2025

Abstract

Deposition of intramuscular fat (IM), also known as marbling, is the deciding factor of beef quality grade in the U.S. Defining molecular mechanisms underlying the differential deposition of adipose tissue in distinct anatomical areas in beef cattle is key to the development of strategies for marbling enhancement while limiting the accumulation of excessive subcutaneous adipose tissue (SAT). The objective of this exploratory study was to define the IM and SAT transcriptional heterogeneity at the whole tissue and single-nuclei levels in beef steers. Longissimus dorsi muscle samples (9–11th rib) were collected from two finished beef steers at harvest to dissect matched IM and adjacent SAT (backfat). Total RNA from IM and SAT was isolated and sequenced in an Illumina NovaSeq 6000. Nuclei from the same samples were isolated by dounce homogenization, libraries generated with 10× Genomics, and sequenced in an Illumina NovaSeq 6000, followed by analysis via Cell Ranger pipeline and Seurat in RStudio (v4.3.2) By the expression of signature marker genes, single-nuclei RNA sequencing (snRNAseq) analysis identified mature adipocytes (AD; ADIPOQ, LEP), adipose stromal and progenitor cells (ASPC; PDGFRA), endothelial cells (EC; VWF, PECAM1), smooth muscle cells (SMC; NOTCH3, MYL9) and immune cells (IMC; CD163, MRC1). We detected six cell clusters in SAT and nine in IM. Across IM and SAT, AD was the most abundant cell type, followed by ASPC, SMC, and IMC. In SAT, AD made up 50% of the cellular population, followed by ASPC (31%), EC (14%), IMC (1%), and SMC (4%). In IM depot, AD made up 23% of the cellular population, followed by ASPC at 19% of the population, EC at 28%, IMC at 7% and SMC at 12%. The abundance of ASPC and AD was lower in IM vs. SAT, while IMC was increased, suggesting a potential involvement of immune cells on IM deposition. Accordingly, both bulk RNAseq and snRNAseq analyses identified activated pathways of inflammation and metabolic function in IM. These results demonstrate distinct transcriptional cellular heterogeneity between SAT and IM depots in beef steers, which may underly the mechanisms by which fat deposits in each depot. The identification of depot-specific cell populations in IM and SAT via snRNAseq analysis has the potential to reveal target genes for the modulation of fat deposition in beef cattle.

1. Introduction

Intramuscular adipose tissue (IM; marbling) deposition is the primary determination of beef quality grade in the U.S [1]. While marbling deposition has improved, subcutaneous adipose tissue (SAT) accumulation has increased [2], generating excess fat for every percent increase in IM [3]. Improving marbling while decreasing surplus adiposity in finished beef steers can improve animal production efficiency and carcass value. However, there is limited understanding of the molecular and cellular mechanisms governing how adipose tissue deposits in distinct anatomical locations in mature beef cattle, thus hindering the development of targeted strategies that could improve marbling.
Adipose tissue grows through adipogenesis, which includes adipose stromal and progenitor cell (ASPC) hyperplasia [4] followed by lipid accumulation via hypertrophy [5]. Adipogenesis is regulated by transcriptional and cellular factors, such as cytokines, signaling molecules, and hormones [6], which induce the differentiation of ASPC into mature, lipid-filled adipocytes and support adequate tissue function [7,8]. Notably, recent single-cell RNA sequencing studies in mature beef cattle adipose tissue and skeletal muscle have revealed transcriptionally distinct PDGFRα+ fibro-adipogenic ASPC populations that can differentiate into either adipocytes or fibroblasts, implying that ASPC fate can be altered later in life [9]. In addition to adipocytes and ASPC, a variety of cells reside within adipose tissue and influence tissue growth, including immune cells (mostly macrophages) and vascular cells (endothelial cells, smooth muscle cells, and pericytes) [10]. Thus, proper cellular function and crosstalk within adipose tissue is key to supporting adipose tissue function and whole-body homeostasis, as adipose tissue is an endocrine organ [11].
Novel studies utilizing next-generation RNA sequencing at the single-cell level have revealed that anatomical location and breed affect adipose tissue cellular heterogeneity and growth in bovine. For example, through single cell-RNAseq analysis, Wang et al. [12] compared skeletal muscle samples of both Wagyu and Brahman cattle. Depot differences between perirenal and intramuscular adipocytes were reported for both breeds, with intramuscular cells more prolific. While higher marbling in Wagyu was linked to higher expression of pro-adipogenic genes in fibro-adipogenic progenitors’ population, Brahman cattle showed higher expression of pro-fibrogenic genes, associated with lower meat quality and less intramuscular fat [12]. Utilizing single-nucleus sequencing (snRNAseq) in abdominal SAT and omental visceral adipose tissue of dairy cattle, our group has reported a more pro-adipogenic and angiogenic capacity of SAT compared to visceral fat, with an increased abundance of adipocytes, ASPC and endothelial cells, while visceral adipose tissue cells had a more pro-inflammatory profile mediated by an increased number of macrophages, and NK and T-cells [13]. Similarly, macrophage infiltration in visceral adipose tissue of Wagyu was higher than that in SAT and IM, and included crown-like structures, suggesting that visceral fat of fattening Wagyu is in a state of inflammation [14], similar to what is widely reported in humans with obesity and metabolic disorders [15]. However, depot-specific adipose tissue transcriptional cellular heterogeneity in beef cattle, particularly cells involved in marbling deposition, remains little understood.
The objective of this study was to define IM and SAT transcriptional profiles and cellular heterogeneity via bulk and single-nuclei RNA sequencing analyses in beef steers. This discovery study is a step towards the identification of molecular and cellular mechanisms involved in depot-specific adipose tissue deposition in beef cattle that can aid the development of targeted approaches to enhance marbling while limiting excessive fatness in beef cattle. Key findings from this study demonstrate that fat deposition in IM involves immune cells, particularly macrophages, and gene networks linked to inflammatory pathways, while SAT has an enhanced pro-adipogenic transcriptional profile combined with a higher abundance of adipocytes and ASPCs.

2. Materials and Methods

2.1. Animals and Tissue Collection

Two ‘A-maturity’ crossbred black Angus beef steers with hot carcass weight of 392 Kg and 429 Kg were selected during harvest at the Texas Tech University Meat Laboratory (Lubbock, TX, USA). Tissue samples were collected immediately after exsanguination and hide removal. Animal history, exact age and background were not recorded. All animals were appraised before slaughter, and no sign of distress or illness was detected when they entered the facility. A section of the Longissimus dorsi (LD) muscle (±0.5 Kg) was excised from the 9–11th rib section and placed into a stainless-steel tray on ice for performing the dissection of paired IM and SAT samples from each animal using tweezers and a scalpel. Collected samples were placed into Krebs Ringer Buffer (KRB) [1 L DDH2O, 7.88 g of NaCL, 0.070 g KH2HPO4, 0.246 g MgSO4-7H2O, 0.373 g KCl, 0.991 g glucose, 10 mL Antibiotic/antimycotic (Corning, Cat. No. 30-004CL), 20 mL 1M HEPES] with gentamycin (50 ug/mL) and rinsed twice. Tissue subsamples of approximately 1 g each were flash-frozen in liquid nitrogen for RNA sequencing analyses.

2.2. Adipose Tissue Total RNA Extraction and Bulk Sequencing

Total RNA from adipose tissue was extracted using the RNeasy Lipid Tissue Mini kit (Qiagen, Cat. No. 74804) and RNA quality was determined using RNA Screen Tape (Agilent). Samples with RNA integrity number (RIN) greater than 7 were used in the subsequent steps. Messenger RNA purification, RNA fragmentation, double-stranded cDNA, and adaptor ligation were generated using Illumina Stranded mRNA Prep kit according to the manufacture’s protocol (Illumina, Cat. No. 20040534). PCR-enriched libraries were quantified using the Quant-iT PicoGreen™ dsDNA Assay Kit (Invitrogen, Cat. No. P11496) and equimolar indexed libraries were pooled. Pooled libraries were checked using the Agilent Tapestation 2200 and quantified by qPCR. The libraries were then diluted to 250 picomolar and spiked with 1% phiX libraries (Illumina control). The transcriptome sequencing was performed on the barcoded stranded RNA-Seq libraries using Illumina NovaSeq 6000 flow cell, paired-end reads (2 × 50 bp) targeting at least 30 million reads per sample. FASTQ reads were trimmed for quality and adapters with TrimGalore 0.4.3 and mapped to bovine genome ARS-UCD1.2 with STAR-2.7.2a [16]. Annotation was performed using Ensembl v106. Data analysis was adapted from previous protocols in Green et al. [17] and Michelotti et al. [13]. Differentially expressed genes (DEGs) in IM and SAT samples were identified by a robust Benjamini–Hochberg corrected false discovery rate (FDR; adjusted p value < 0.05; JMP 14 Pro (San Francisco, CA, USA)) normalized through DESeq package in Rstudio (v4.3.2, Boston, MA, USA). A log2 fold change (log2FC) threshold of >|0.25| was applied to define biologically meaningful differences in gene expression between IM and SAT samples. Kyoto Encyclopedia of Genes and Genomes (KEGG) pathway analysis was performed via Rstudio to interpret the functional roles of genes using an adjusted p value < 0.05. A Cnet (Cytoscape Network) plot analysis was generated in Rstudio (v4.3.2) by mapping genes with an adjusted p value of <0.05 to their corresponding biological pathways based on the results from GO (Gene Ontolgy) pathway analysis. Genes connected to specific GO terms were then evaluated for potential trends.

2.3. Adipose Tissue Nuclei Isolation and Single-Nuclei RNA Sequencing

Nuclei-isolation from IM and SAT samples was performed as described by our lab [13], excluding flow cytometry purification of nuclei. Briefly, 500 mg of each cryopreserved IM or SAT sample was washed with sterile RNase-free cold 1× PBS, then minced with a scalpel using a Petri dish on ice. Samples were homogenized in a precooled 15 mL glass dounce homogenizer with 1.5 mL of homogenization buffer including RNase inhibitor (Sigma Protector, Cat. No.03335399001). Samples were then strained, centrifuged, and supernatant was pipetted off. A subsample of nuclei was used to assess the overall quality of the nuclei by staining with trypan blue and visualized by phase-contrast light microscopy (EVOS XL Core Phase contrast Digital Microscope, Life Technologies) for quality inspection. After nuclei-isolation, single nuclei suspensions were subjected to final nuclei counting on an automated cell counter and adjusted to a 700–1000 nuclei/µL concentration. 3′ single nuclei libraries were generated via 10× Genomics Chromium Next GEM Single Cell 3′ Reagent Kits v3.1 (Dual Index). The pooled nuclei libraries were run via paired-end sequencing for 150-base-pair read fragments and were subsequently performed on an Illumina NovaSeq 6000 analyzer. Bcl2fastq2 Conversion Software (Illumina) was used to generate de-multiplexed Fastq files, and the CellRanger Pipeline (10× Genomics) was used to align reads and generate count matrices. Data analysis was performed using the scRNA-Seq package Seurat v5.1.0 [18] in RStudio (v4.3.2) following the previous data analysis protocol from Michelotti et al. [13]. Using the “FindVariableFeatures” function in Seurat, we identified 8000 highly variable genes. The scaled and normalized expression data of respective genes served as input for a principal component analysis (PCA), and the top 30 dimensions were used to plot the variability between cells in a two-dimensional diagram by means of the Uniform Manifold Approximation and Projection (UMAP) procedure to reduce the dimensionality of the data. Cells were clustered into subpopulations according to the same dimensions using the “FindClusters” function with a 0.6 resolution, which is a graph-based clustering approach. The top genes in each cluster were identified in comparison with all the other clusters using the “FindMarkers” function while keeping a cutoff of Log2FoldChange > 0.5 and Adjusted p value < 0.05, calculated based on Bonferroni correction using all genes in the dataset. Cell types were assigned manually to each cluster based on known expressions of signature genes, as Loft et al. [19]. The contrast between identified cell clusters were analyzed for KEGG (Kyoto Encyclopedia for Genes and Genomes) pathways following the same specifications described above. To investigate adipose stem and progenitor cell (ASPC) and adipocyte cell states, we performed pseudotime trajectory analysis using the Monocle3 package (v1.3.1) in RStudio (v4.3.2). Nuclei annotated as adipose stem and progenitor cells (ASPC) and mature adipocyte (AD) were subset from the integrated Seurat object containing SAT and IM snRNAseq data. Data were reprocessed using standard Monocle workflows: dimensionality reduction was conducted with UMAP, followed by cell ordering along pseudotime based on the most variable genes across the subset. The root node was manually assigned to the singular ASPC cluster to model differentiation toward mature adipocyte states. Pseudotime trajectories were visualized alongside cluster identities to assess gene expression dynamics and lineage progression from ASPC to adipocytes.

3. Results

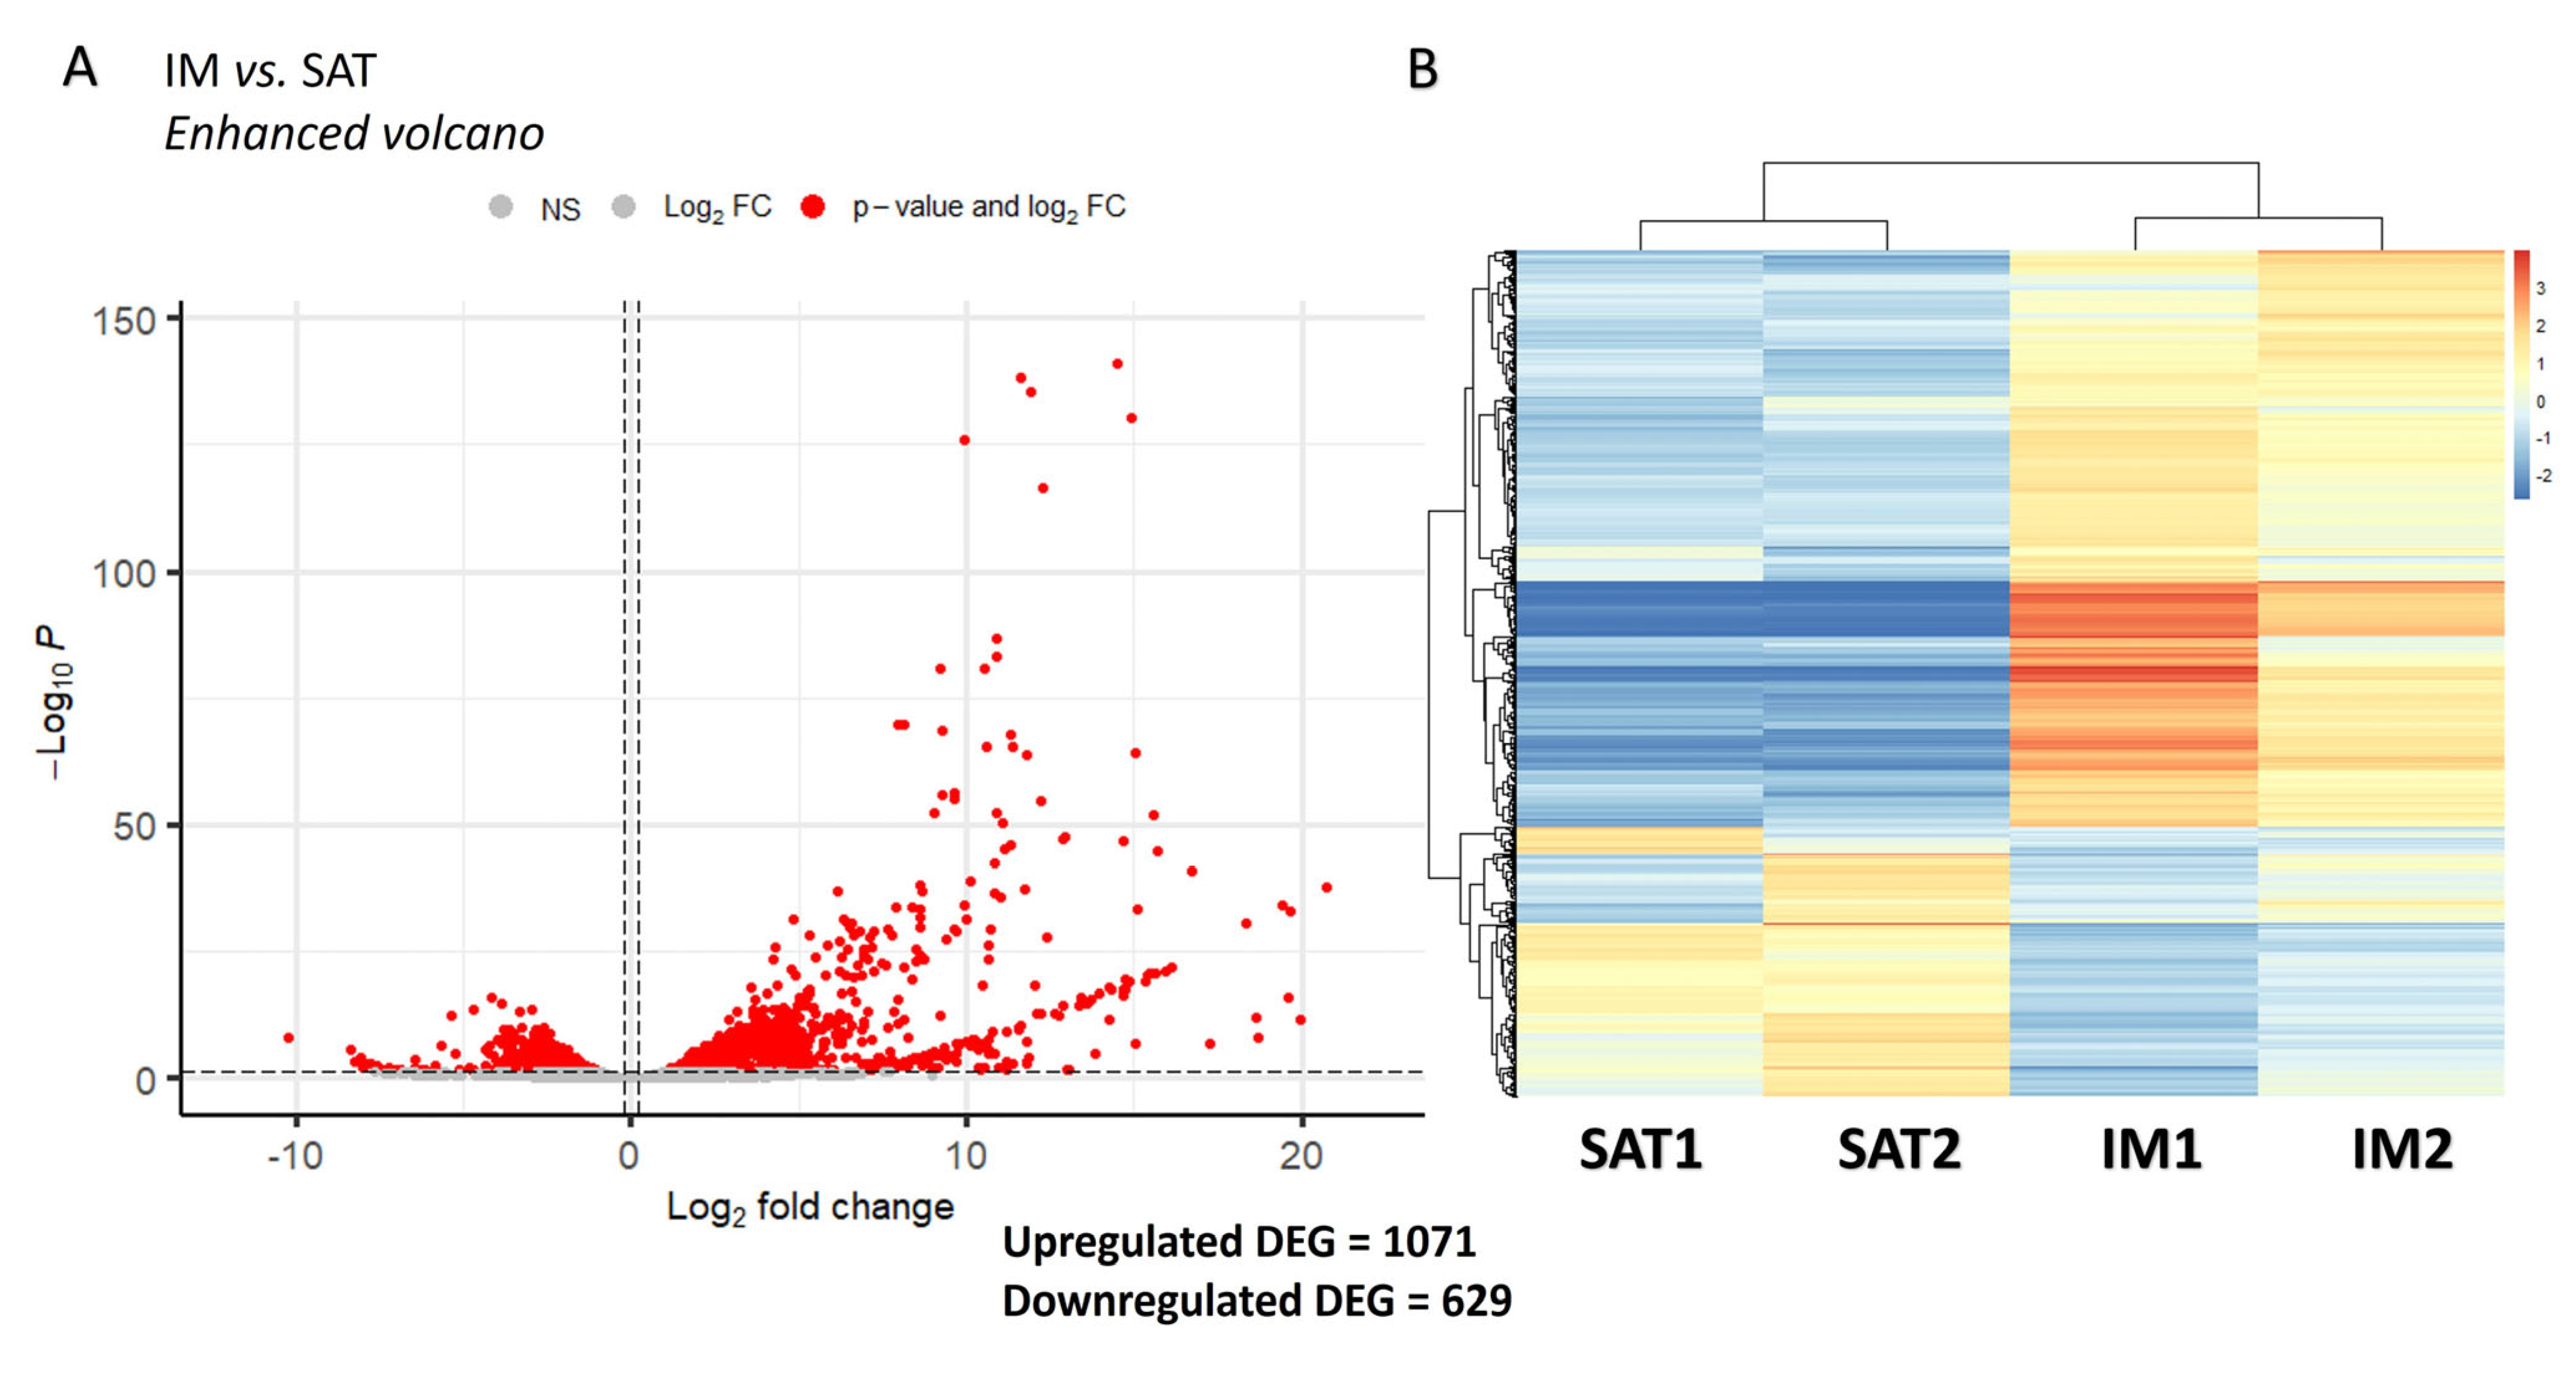
3.1. Bulk RNA Sequencing Analysis Suggests Depot-Specificities Between IM and SAT Gene Profiles in Beef Steers

Differential gene expression analysis yielded 1700 genes between IM and SAT, 1071 of those DEGs being upregulated, while 629 were downregulated in IM vs. SAT (Figure 1A). A complete list of DEGs between IM and SAT can be found in Supplementary Table S1. Further evaluation of the top 1000 DEG between depots via heatmap clustering sustained the distinction of gene expression patterns between IM and SAT, displaying clear transcriptomic differences between the distinct anatomical locations (Figure 1B). The top ten most significant upregulated genes in IM vs. SAT encoded proteins associated with myogenesis and muscle contraction, including TNNC2, ATP2A1, TNNI2, CKM, MYBPC2, MB, ACTN3, MYOZ1, HSPB7 and CASQ1 (Supplementary Table S1). In contrast, the top ten downregulated genes in IM vs. SAT were primarily associated with lipid metabolism and insulin signaling pathways, including LEP, SDSL, PLIN4, THRSP, DMRT2, TSKS, TRARG1, TMEM254, RBP4 and CIDEA (Supplementary Table S1). Other genes included among the top 50 downregulated genes in IM vs. SAT involved key rate-limiting lipogenic enzymes (AGPAT2, FABP5), lipases and lipid droplet associated proteins (LPL, LIPE, PLIN1), and insulin response mediators (INSIG1, ADIPOR2, ADIPOQ), evidencing potential mechanisms associated with lipid deposition in beef muscle.

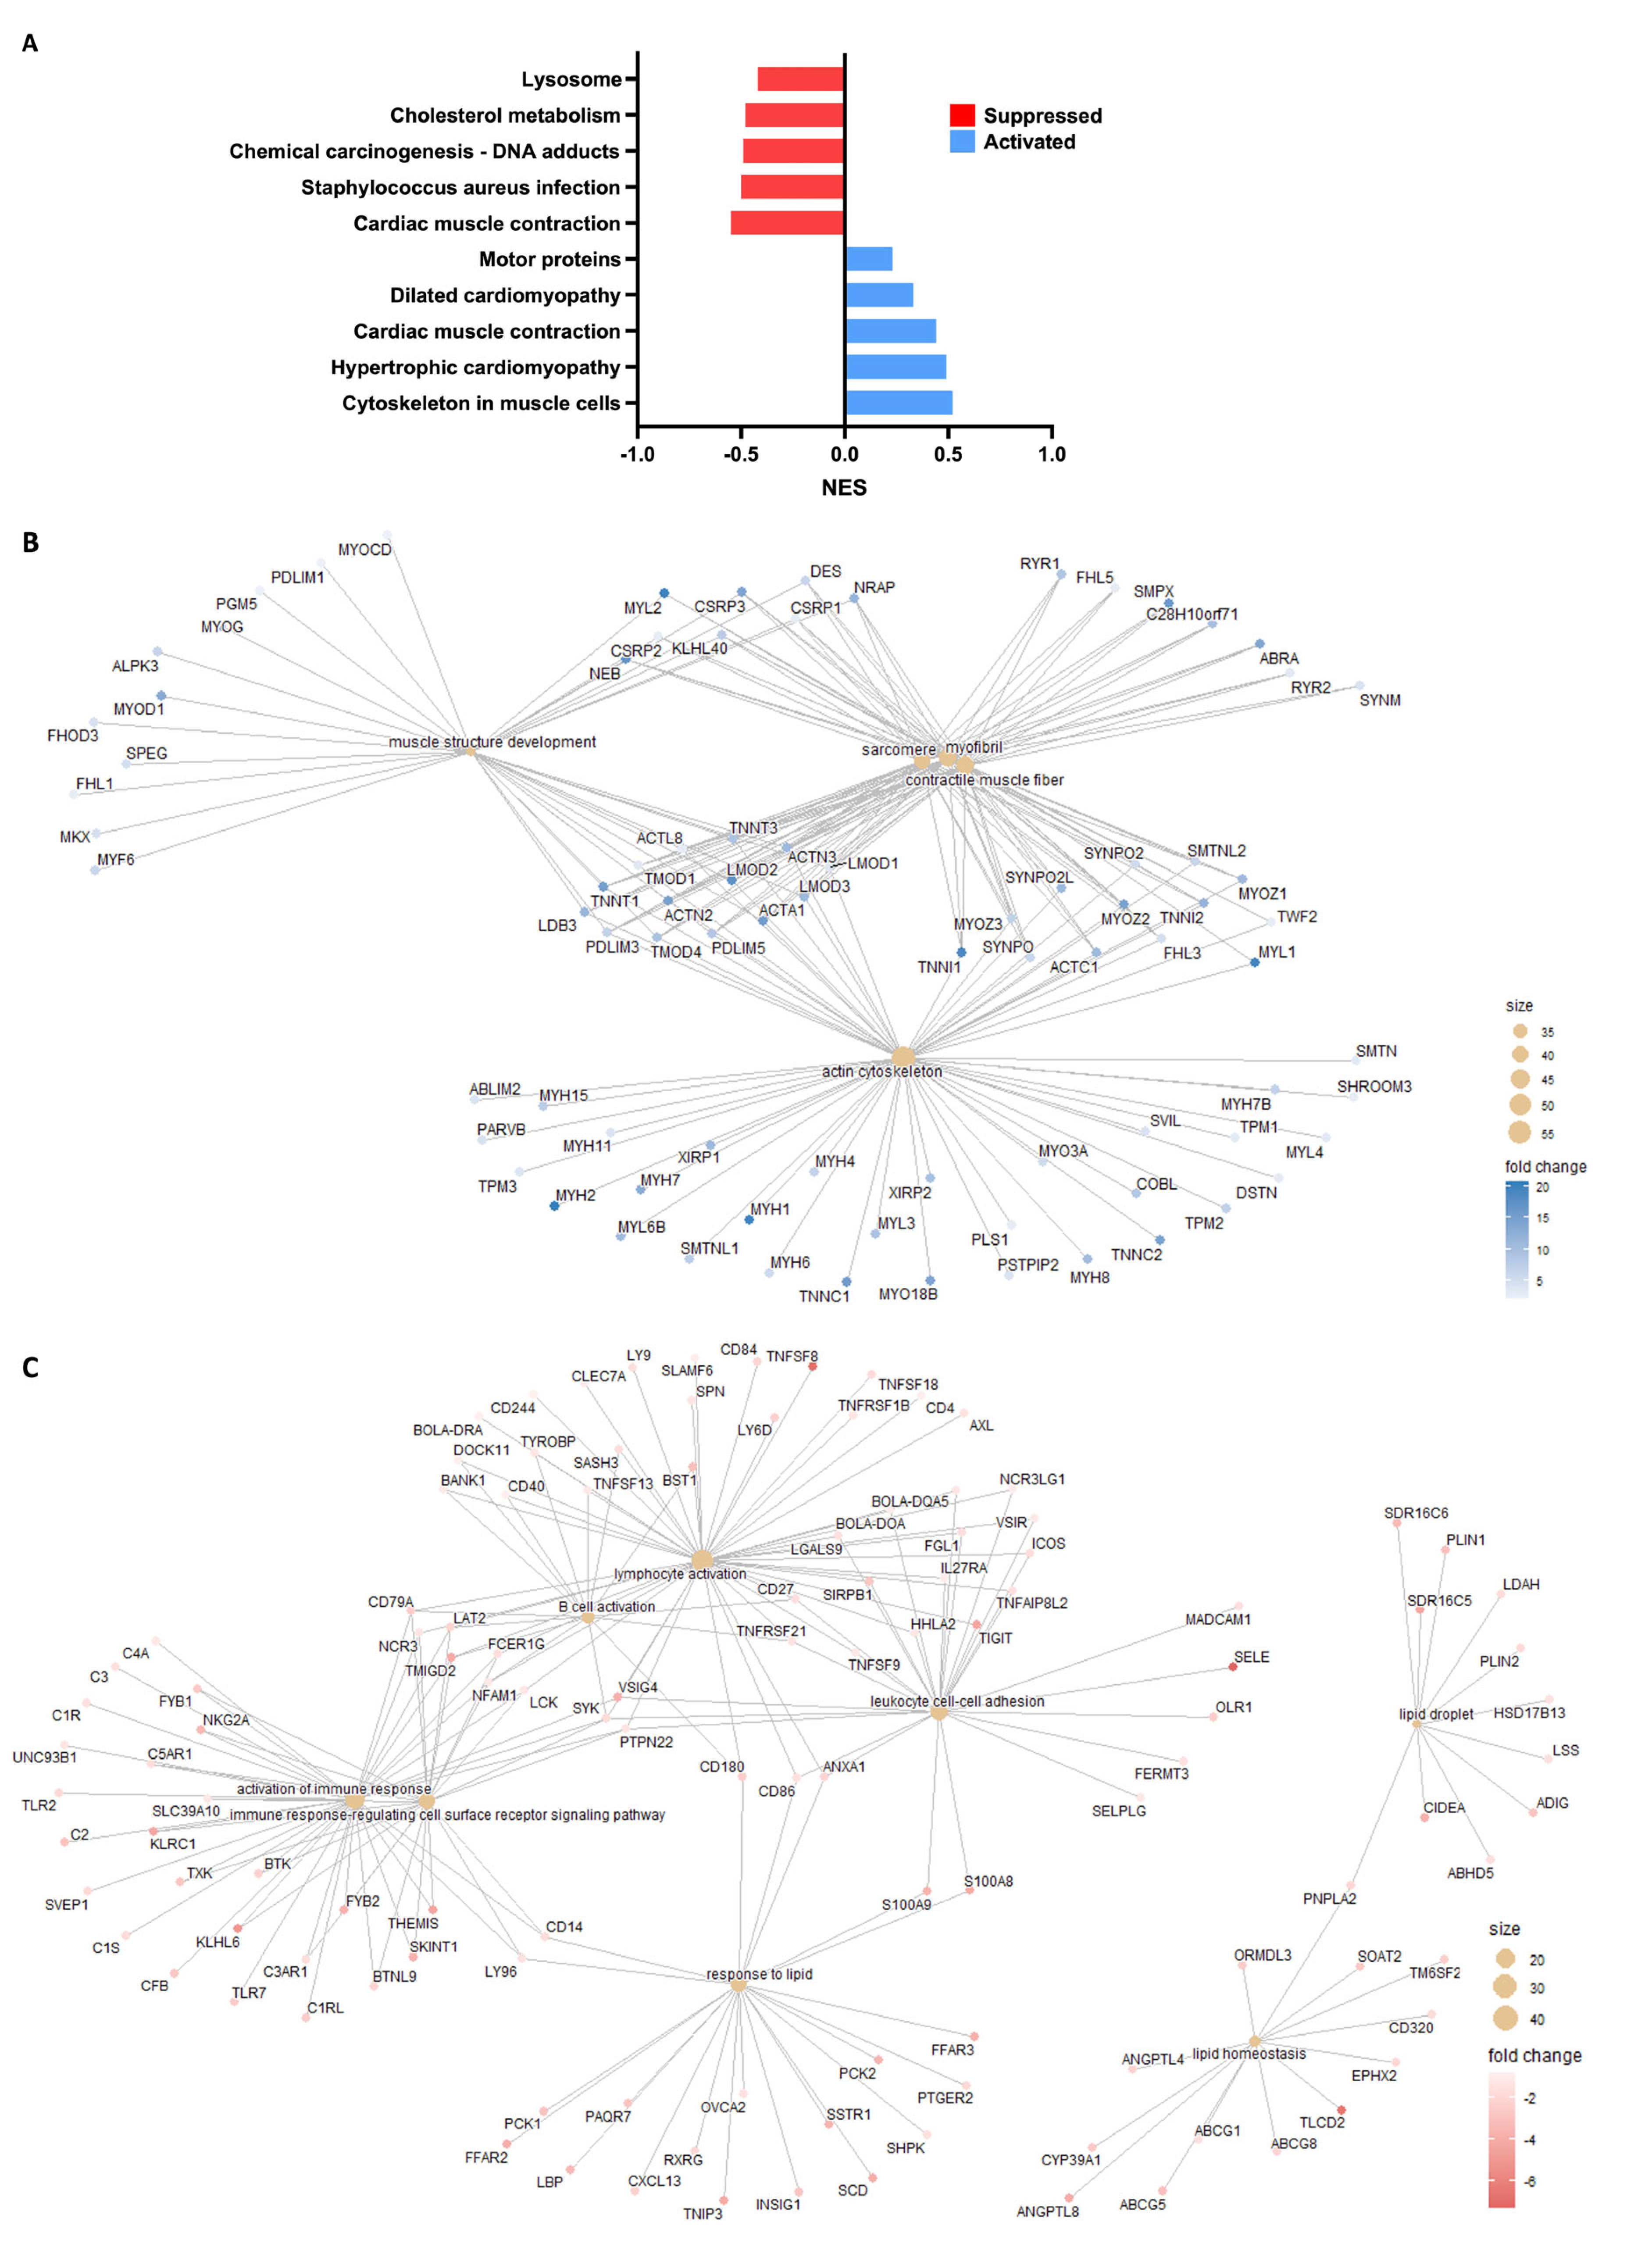
3.2. Functional Analysis Indicates Activation of Lipid Synthesis and Metabolism Pathways in SAT

Functional analysis of IM vs. SAT transcriptome was performed via KEGG pathway analysis (Supplementary Table S2). The top 5 activated and suppressed KEGG pathways in IM vs. SAT are depicted in Figure 2A. There was a suppression of major pathways associated with lipid and energy metabolism (e.g., cholesterol metabolism, PPAR signaling pathway, fatty acid metabolism, steroid hormone biosynthesis), immune responses (e.g., Staphylococcus aureus infection, complement and coagulation cascades, asthma, and hematopoietic cell lineage), signal transduction (e.g., phototransduction, Fc epsilon RI signaling pathway), and cellular structure and organelle function (e.g., lysosome, peroxisome, glycosaminoglycan degradation) in IM vs. SAT. In contrast, IM vs. SAT comparison revealed the activation of neuro-related signaling pathways (e.g., amyotrophic lateral sclerosis, Alzheimer, Parkinson, prion disease, axon guidance, cAMP signaling, MAPK signaling, Wnt signaling), and cardiac and muscle function pathways (e.g., cardiac muscle contraction, vascular smooth muscle contraction, adrenergic signaling in cardiomyocytes, calcium signaling pathway, cytoskeleton in muscle cells, motor proteins and dilated/hypertrophic/arrhythmogenic cardiomyopathy), likely representing the oxidative stress, mitochondrial function, calcium handling, and co-expression of muscle genes in IM (Supplemental Table S2). These results are in line with the analysis of genes connected to specific GO terms in IM vs. SAT (Figure 2B,C; Supplementary Table S3), highlighting the link between IM gene profile and pathways of muscle structure development and actin cytoskeleton, which include similar key genes upregulated in KEGG pathways of muscle function, such as MYOD1, PRKG1, and ATP2A1, and their targets, including ACTA1 and TNNI1. Interestingly, there were numerous hormonal and metabolic signaling pathways activated in IM vs. SAT, including, e.g., insulin secretion, glucagon signaling, thyroid hormone signaling, apelin signaling pathway and oxytocin signaling pathway (Supplemental Table S2), suggesting tight metabolic regulation and energy homeostasis in IM.
The top suppressed GO biological processes in IM vs. SAT include lipid droplet and lipid homeostasis, with PNPLA2 expression, the gene encoding adipose triglyceride lipase, being the interconnector between these pathways (Figure 2C; Supplemental Table S3). Of note, ‘Response to lipid’ GO term was connected to immune-related biological processes (e.g., activation of immune response, immune response-regulating cell surface receptor signaling pathway, B cell activation, lymphocyte activation, and leukocyte cell–cell adhesion) through key genes associated with innate immunity and inflammation, including CD14, LY96, CD86, CD180, ANXA1, S100A8, and S100A9. These results align with KEGG pathways showing a coordinated link between lipid metabolism and immune activation in SAT, especially involving monocytes/macrophages, TLR4-LPS pathways, and inflammatory regulation. Nevertheless, the presence of both pro-inflammatory (S100s, CD14) and regulatory (ANXA1, CD180) markers implies active but controlled immune surveillance (Supplemental Table S3).

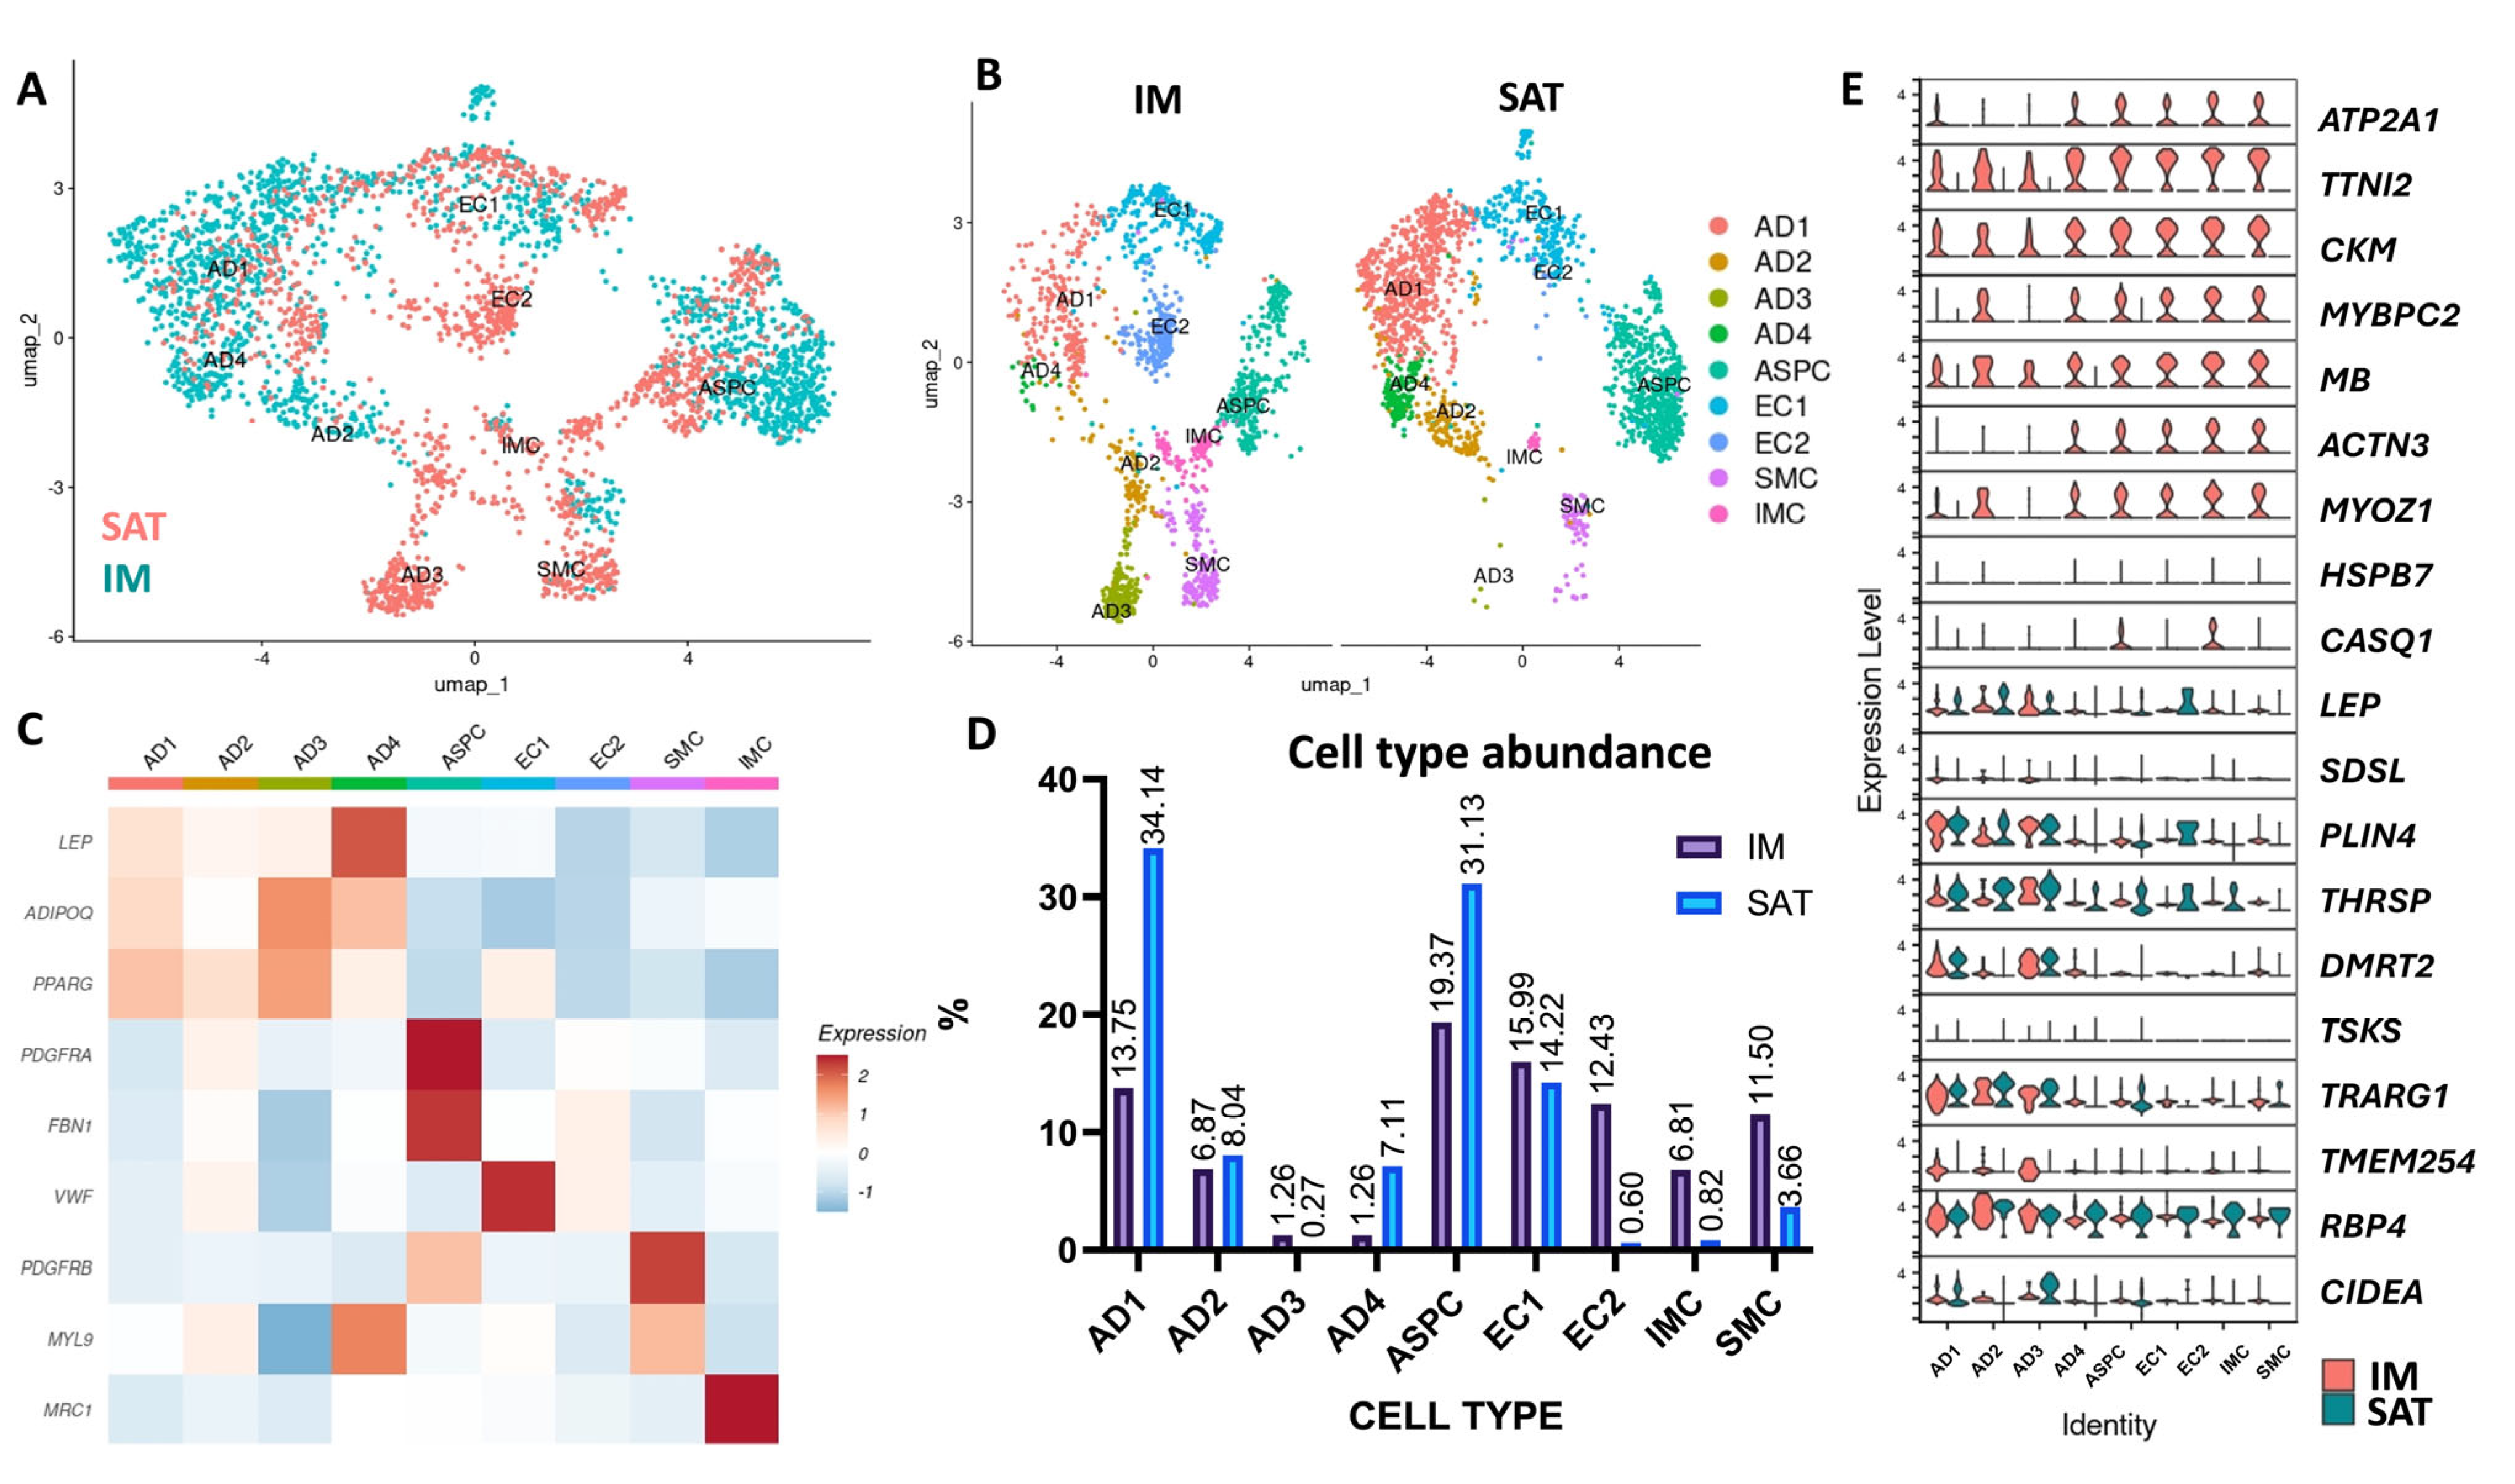
3.3. Single-Nuclei RNA Sequencing Analysis Revealed IM and SAT Cellular Diversity

Single-nuclei RNA sequencing (snRNA-seq) analysis of matched IM and SAT samples revealed transcriptional and cellular heterogeneity across depots (Figure 3A–D). From 5613 nuclei captured, unsupervised clustering identified eight major cell populations. Annotation based on marker gene expression revealed distinct populations of mature adipocytes (AD), adipose stem/progenitor cells (ASPCs), endothelial cells (EC), smooth muscle cells (SMC), and immune cells (IMC) (Figure 3B,C; Supplemental Table S4). Notably, ADs were the most abundant cell type in both IM and SAT, followed by ASPCs. SAT was predominantly composed of AD (50%) and ASPC (31%), with lesser representation of ECs (14%), SMCs (4%), and IMCs (1%). In contrast, IM fat had a lower proportion of ADs (23%), but a higher relative abundance of ECs (28%), followed by ASPCs (19%), SMCs (12%), and IMCs (7%) (Figure 3D).

3.4. Trajectory Analysis Suggests the Presence of Adipocytes in Distinct Differentiation States in IM and SAT

Our data identified AD populations that were transcriptionally diverse, with four major subtypes (AD1–AD4) identified across IM and SAT depots. AD1, AD2, and AD4 exhibited canonical adipocyte markers including ADIPOQ and LEP, indicating mature, lipid-filled states. AD3 was distinguished by unique expression of genes such as LPIN1 and GPAM and was exclusively found in SAT, suggesting depot-specific functions or developmental cues. AD1 emerged as the predominant subtype across both depots, while AD3 was the least frequent (Figure 3C; Supplemental Tables S5 and S6). ASPCs in SAT showed higher expression of early adipogenic regulators, suggesting a depot with more robust adipogenic potential compared to IM (Figure 3C).
To further investigate the progression of adipocyte differentiation, we performed pseudotime trajectory analysis using monocle3 on the combined adipose cell populations from both SAT and IM depots (Figure 4A–C). ASPCs were designated as the root node, and the inferred trajectory delineated a developmental progression from progenitor states toward distinct mature adipocyte fates. The trajectory followed a logical path from ASPCs to the least mature adipocytes (AD3), through intermediate states (AD2), culminating in terminally differentiated AD1 and AD4 clusters. Dynamically regulated genes across pseudotime revealed differentiation of ASPCs into mature adipocytes in a distinct expression pattern (Supplemental Table S7). Independent of depot, heatmap of AD gene profile analyzed via snRNAseq shows AD3 and AD2’s enrichment for genes associated with early adipogenesis and metabolic priming (e.g., GPAM, LIPE, FASN), while AD1 and AD4 displayed higher expression of mature adipocyte markers (e.g., PPARG, ADIPOQ, THRSP, LEP; Figure 3C; Supplemental Table S8). AD4 was notable for strong expression of ADIPOQ and FASN, implying a metabolically active adipocyte state, whereas AD1 showed enrichment for PPARG and LIPE, suggesting an insulin-sensitive phenotype (Supplemental Table S8). These results indicate that adipocyte differentiation follows a conserved progression across both depots, but the relative abundance and gene expression profiles of mature adipocyte subtypes may differ by depot, potentially influencing depot-specific contributions to marbling and energy metabolism in beef cattle.

3.5. Endothelial and Smooth Muscle Cell Diversity Reflects Depot-Specific Vascular Architecture

We identified two populations of EC and one population of SMC across IM and SAT (Figure 3B,C). EC1 was defined by high expression of vascular endothelial markers VWF, PECAM1, and TEK, characteristic of blood vessel-associated endothelium (Supplemental Tables S5 and S6). EC2, almost exclusive to IM (Figure 3D), showed elevated expression of lymphatic endothelial markers PROX1 and MMRN1 (Supplemental Tables S5 and S6). SMCs were defined by high expression of PDGFRB and MYL9, which were more abundant in IM (12%) than in SAT (4%) (Figure 3C,D; Supplemental Tables S5 and S6).

3.6. Immune Cell Enrichment and Macrophage Identity in Intramuscular Fat

Immune cells (IMCs) were a relatively small population, which may be associated with our small sample size. IMC comprised 7% of all IM cells compared to 1% in SAT (Figure 3D). IMCs expressed classical macrophage markers CD163 and MRC1 (Figure 3C; Supplemental Tables S5 and S6), indicating the predominance of macrophages among all IMC. These cells may contribute to depot-specific immune surveillance and inflammatory regulation. The higher immune cell abundance expressed in IM fat may support this hypothesis.

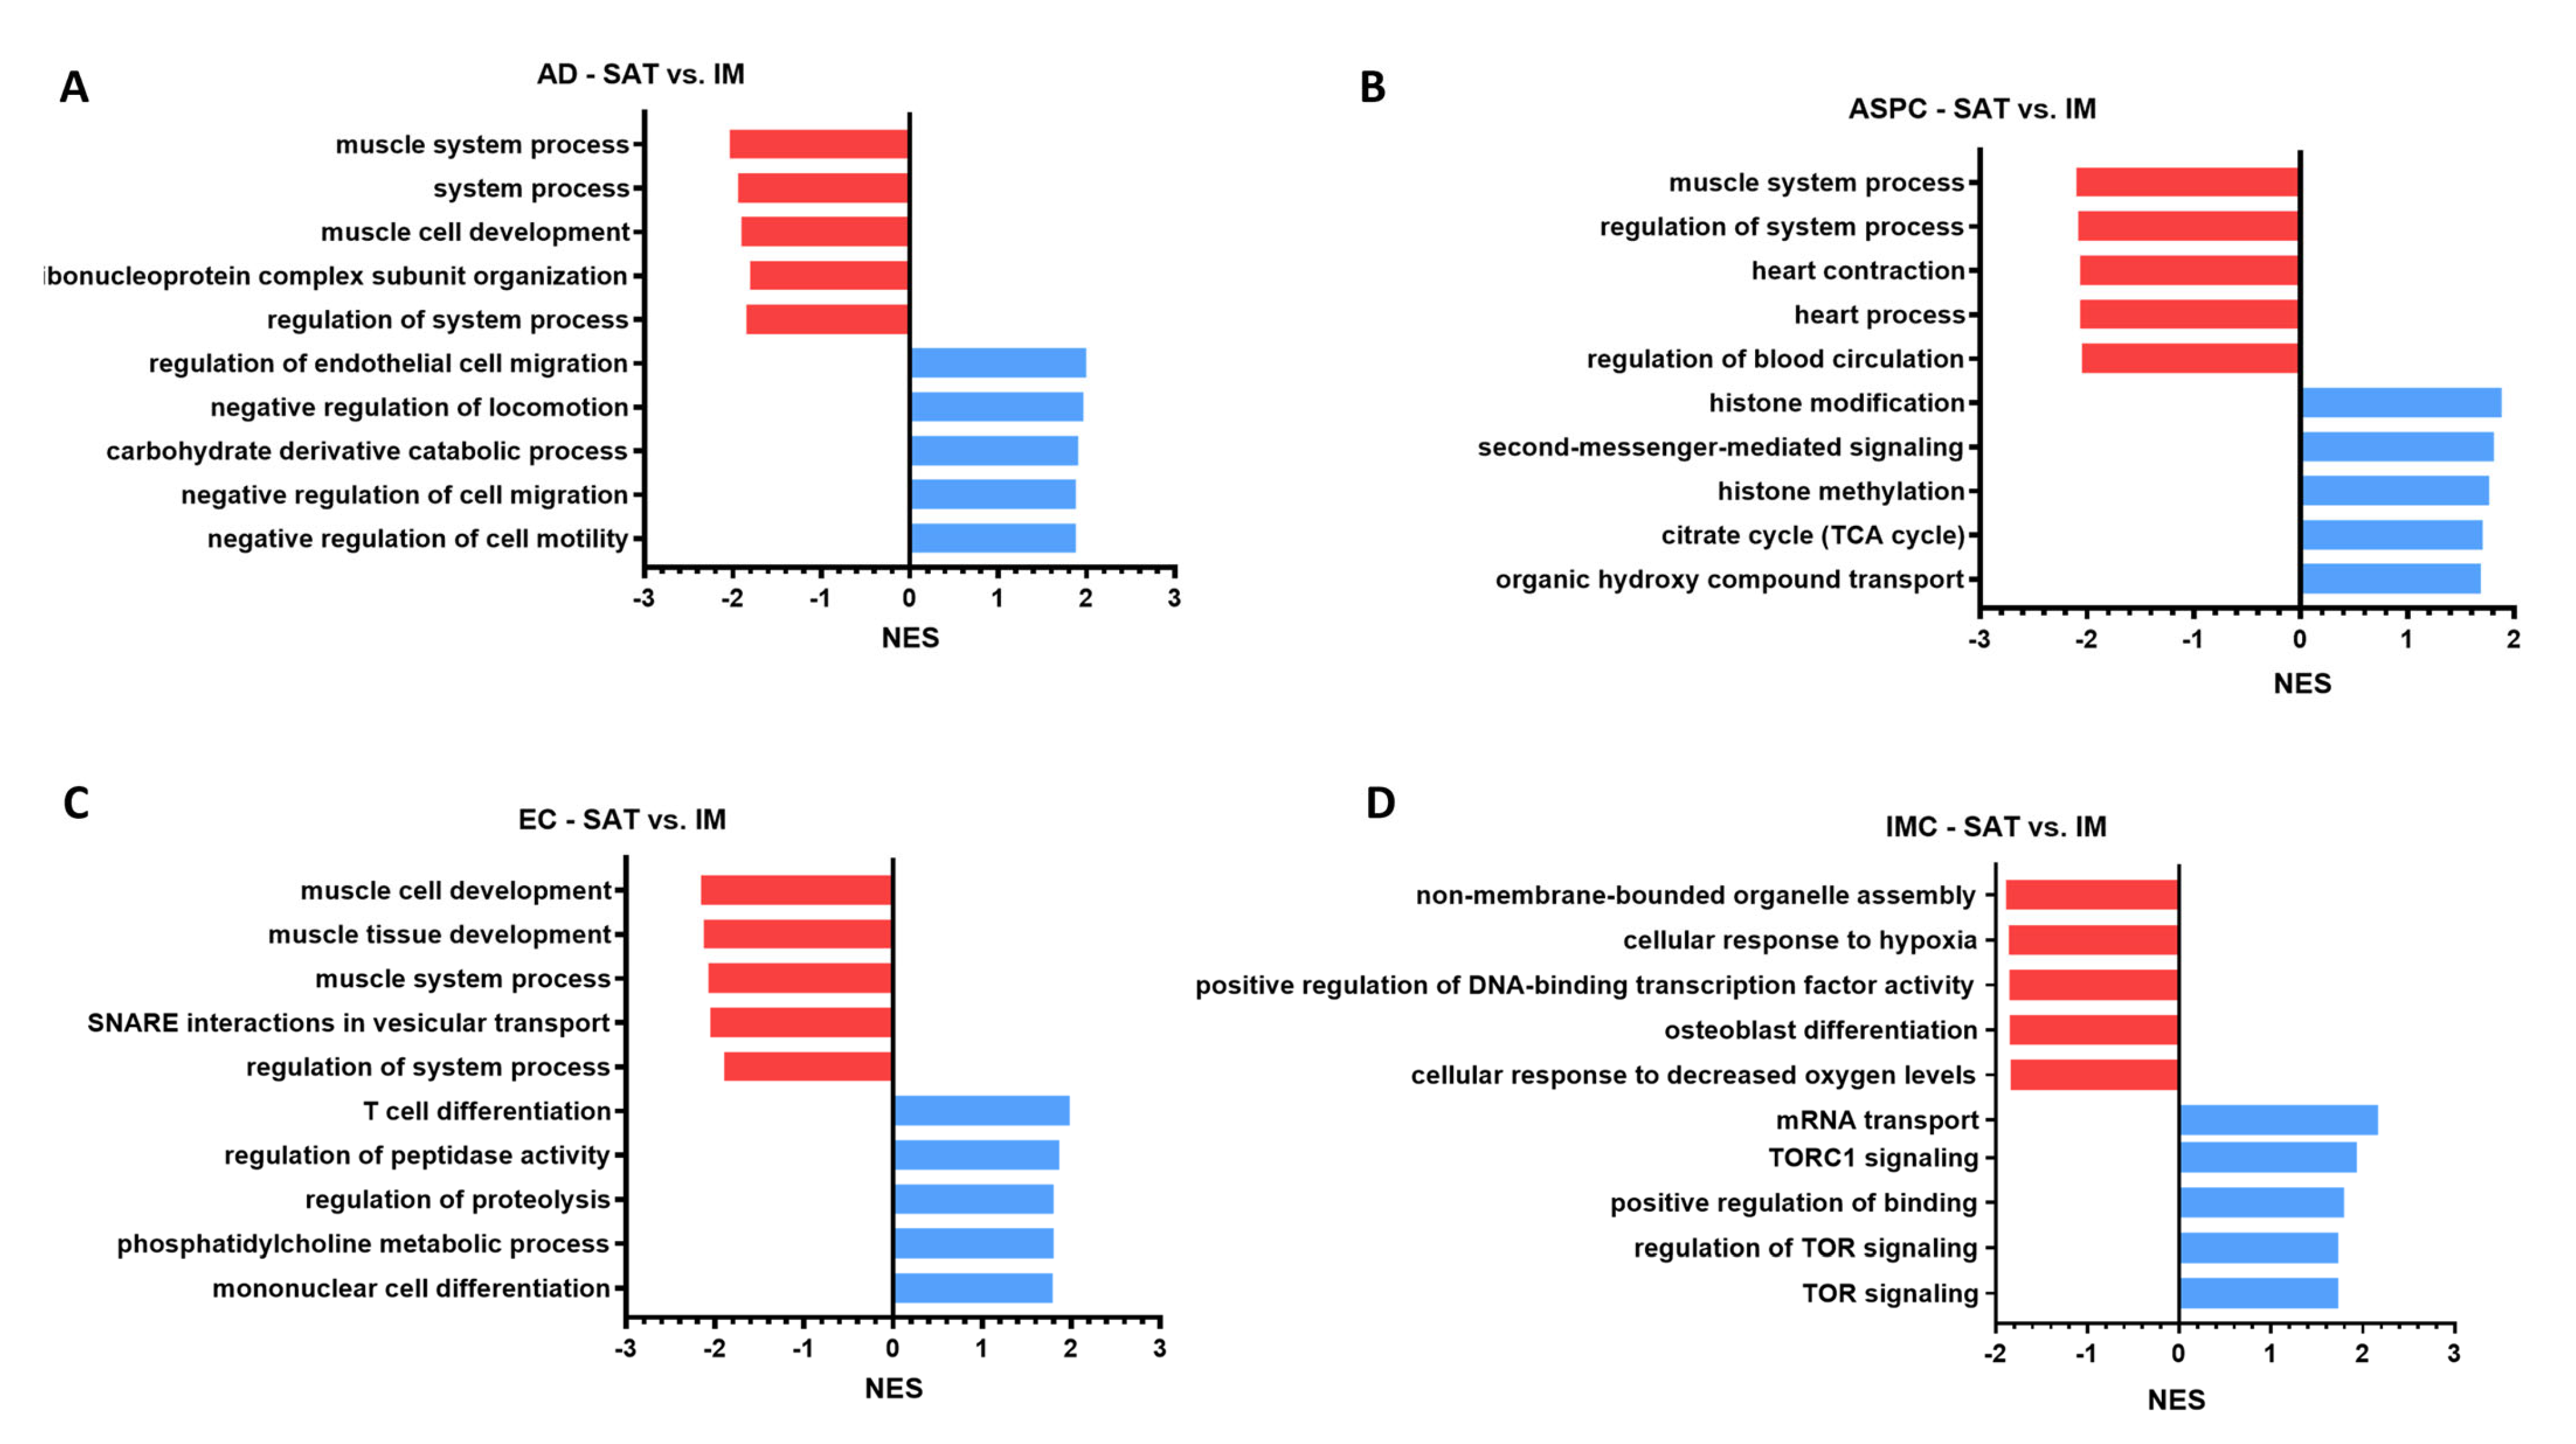
3.7. Single-Cell Functional Analysis Suggests Depot-Specificities Between IM and SAT Gene Profiles in Beef Cattle

To assess the functionality of the identified cellular transcriptional profiles, we performed a comprehensive analysis using GO terms database (Figure 5; Full list: Supplemental Table S9) contrasting SAT vs. IM adipocytes (AD), adipose stromal precursor cells (ASPC), endothelial cells (EC), and immune cells (IMC). Our snRNAseq analysis revealed that SAT ADs are enriched in GO terms associated with regulation of endothelial cell migration, negative regulation of locomotion, carbohydrate derivative catabolic process, negative regulation of cell migration, and negative regulation of cell motility, suggesting that SAT ADs are related with cellular movement, vascular remodeling, and metabolic processes. Some genes contributing to these GO terms included FGF1 and FGF2, which are known to be pro-angiogenic growth factors, suggesting SAT ADs support vascular development. Along with vascular genes, ADIPOQ was upregulated in the top 5 GO terms, implying SAT ADs as a highly metabolically active cell type. In contrast, GO terms upregulated in IM ADs, show terms for ribonucleoprotein complex subunit organization, regulation of system process, muscle cell development, system process, and muscle system process, suggesting that IM Ads function are muscle-influenced. Accordingly, genes involved in calcium signaling and muscle contraction and differentiation, including TNNT3 and CAMK2D were enriched in these GO terms. While these results suggest the presence of muscle in our IM samples, they also provide unique insights into the IM-specific microenvironment intervening in lipid accumulation in IM ADs (Figure 5A, Supplemental Table S9).
Functional analysis of SAT ASPC transcriptome showed biological processes associated with histone modification, second messenger-mediated signaling, histone methylation, citrate cycle (TCA cycle), and organic hydroxy compound transport (Figure 5; Full list: Supplemental Table S9). Enriched terms in SAT ASPCs including histone modification, histone methylation, histone acetylation, histone ubiquitination, highlighted transcriptional control of epigenetic regulation and plasticity, suggesting ASPCs are responsive to local SAT and metabolic cues. There was an activation of pathways of energy and lipid metabolism in SAT ASPCs, including, e.g., citrate cycle (TCA cycle), neutral lipid metabolic process, acylglycerol metabolic process, cholesterol efflux, glycerophospholipid catabolic process, and glycerolipid catabolic process, implying high mitochondrial and lipid catabolic activity, likely in preparation for lipid turnover. We also observed the enrichment of cell signaling and immune interaction GO terms (e.g., T cell receptor signaling pathway, proteoglycans in cancer), suggesting ASPC-immune crosstalk in SAT. Collectively, these results indicate that SAT ASPCs are metabolically active, not fully differentiated, and responsive to local and metabolic cues, thus maintaining the flexibility to either self-renew or differentiate according to distinct signals. In IM ASPCs, we identified an enrichment for GO terms like regulation of blood circulation, heart process, heart contraction, regulation of system process, and muscle system process, suggesting these cells are either derived from, closely interacting with or primed to respond to muscle-like signals. Enriched genes in top activated GO terms included CXADR, ADRA1A, and SNTA1 (Supplemental Table S9). Overall, GO terms enriched in IM ASPCs indicate metabolic versatility (lipid, amino acid, and alcohol metabolism), involved in vascular regulation, autophagy and membrane remodeling (e.g., autophagy, transmembrane transporter binding terms), and sympathetic signaling, consistent with ADRA1A expression. These transcriptional differences between depots support the notion that ASPCs can vary by the environment they accumulate, with SAT progenitors showing remodeling and metabolic activation, and IM reflects a more myogenic state (Figure 5B, Supplemental Table S9).
In SAT ECs, upregulated GO terms included T cell differentiation, regulation of peptidase activity, regulation of proteolysis, phosphatidylcholine metabolic process, and mononuclear cell differentiation, suggesting that ECs are involved in immune cell interaction and lipid metabolic signaling in SAT (Figure 5C). Genes like XBP1, IL18 and MYC contributed to immune-related GO terms, indicating the possible role in immune cell recruitment or activation. Other GO terms enriched in SAT ECs and related to EC-immune cell crosstalk included lymphocyte differentiation, leukocyte differentiation, positive regulation of T cell activation, regulation of immune effector process, and phagocytosis (Supplemental Table S9). We also observed an enrichment of lipid-related GO terms in SAT ECs including triglyceride homeostasis, acylglycerol homeostasis, and regulation of fatty acid biosynthetic process genes, as well as the enrichment of key genes, such as LEP, PEMT and PLA2G7 in the phosphatidylcholine metabolic process, suggesting increased lipid handling capacity of SAT ECs. In contrast to SAT, GO terms enriched in IM ECs reflected a more specialized type of EC for supporting muscle physiology, mitochondrial metabolism, and vascular integrity. For instance, there was an enrichment in terms associated with mitochondrial activity and energy metabolism (e.g., oxidative phosphorylation, ATP synthesis coupled electron transport, mitochondrial respirasome, respiratory chain complex, oxidoreductase complex; Figure 5C), indicating IM ECs are metabolically active and likely supporting oxygen and nutrient delivery to the adjacent muscle fibers. Accordingly, there was an enrichment of muscle-related terms, including muscle tissue development, muscle adaptation, and striated muscle contraction, suggesting a tight interdependence between the IM vasculature and muscle fibers. Together, these depot differences highlight the lower inflammatory profile and increased mitochondrial metabolic role of IM EC, which contrasts with the immune-active, lipid-buffering role of SAT EC (Figure 5C, Supplemental Table S9).
In SAT IMC, GO terms analysis revealed the activation of mRNA transport, TORC1 signaling, positive regulation of binding, regulation of TOR signaling, and TOR signaling (Figure 5D), with increased MLST8, SESN2, and CASTOR1 across TOR-related terms. Several terms associated with immune activation and cytotoxicity were enriched in SAT IMCs, including leukocyte-mediated immunity, cytotoxicity, cell killing, and regulation of NK cell activation, pointing to an immune-active environment (Supplemental Table S9). The enrichment of LEP and ENDOG in TOR signaling pathways and the activation of the positive regulation of binding and regulation of lipolysis may point to IMC-AD crosstalk in regulating immune activation and lipid mobilization in SAT. In IM IMCs, the top 5 enriched GO terms included cellular response to decreased oxygen levels, osteoblast differentiation, positive regulation of DNA-binding transcription factor activity, cellular response to hypoxia, and non-membrane-bounded organelle assembly (Figure 5D). The enrichment of MYC, VEGFA, and CITED2 associated with hypoxia suggests a response of IMC to a hypoxic environment within IM. Uniquely, IM IMCs were enriched for GO terms of tissue remodeling and cell differentiation (e.g., osteoblast differentiation, myelination, Schwann cell development, organ morphogenesis and branching structures), suggesting a pro-regenerative immune phenotype in IM associated with muscle proximity. Overall, SAT and IM IMCs’ transcriptional profile are unique as in SAT, IMC functional analysis suggests enhanced metabolic sensing and inflammatory signaling, while in IM, IMCs may be more influenced by local muscle structure and cellularity (Figure 5D, Supplemental Table S9).

4. Discussion

Due to the growth and development characteristics of beef cattle, the deposition of IM occurs after visceral and subcutaneous fat deposition during the fattening period [20], which increases the likelihood of finished animals to have excessive adiposity and limited marbling. However, modulating excess fat deposition other than IM fat is a challenge. In the present investigation, we defined IM and SAT transcriptional heterogeneity at the bulk and single-nuclei levels in beef cattle and revealed depot-specific differences that may underly mechanisms of depot-specific adipose tissue deposition, including the highly desirable marbling. Our findings reveal key depot-specific differences that may help in the understanding of mechanisms regulating IM and SAT deposition in beef steers. While breed-specific differences in intramuscular fat deposition exist, our study focused on depot-specific transcriptional and cellular differences within a single breed context to define baseline characteristics of IM and SAT adipose tissue.
Consistent within our bulk and snRNASeq results was the notion of an increased adipogenic transcriptional potential in SAT compared to IM, supported by enhanced expression of adipogenic and lipogenic genes, as well as a greater abundance of both AD and ASPC. While our study presents a novel comparison of SAT and IM at the single-nuclei level, prior investigations utilizing bulk RNASeq have reported similar findings [20,21,22]. Notably, in their comparison of subcutaneous and intramuscular fat transcriptomes of Japanese Black cattle, Ueda et al. [22] reported the enrichment of many lipid metabolic pathways in subcutaneous fat while pathways associated with extracellular matrix and cell–cell interactions were enriched in intramuscular fat. Similar results have also been reported in pigs, with Zhang et al. [23] demonstrating an upregulation of genes involved in lipid metabolism and storage in subcutaneous fat compared to intramuscular fat. These depot-specific differences in adipogenic potential were also evident in our data at the single-nuclei level. Within AD, those from SAT exhibited a more pro-adipogenic profile with higher expression of ADIPOQ and LEP, and enrichment of the insulin signaling pathway, compared AD from IM. Similarly, ASPC from SAT had higher expression of pro-adipogenic mediators like PPARG, FASN and ELOVL6, with enrichment of many pathways associated with lipid metabolism, compared to ASPC from IM. Adipose progenitor cells are critical for maintaining adipocyte turnover and enabling de novo adipogenesis. Thus, differences in ASPC transcriptional profile and abundance between depots may contribute to the differential capacity for adipose tissue expansion and remodeling [9]. These depot-specific differences in the ability of ASPC to differentiate into adipocytes have also been observed in vitro, with Zhang et al. [24] reporting an increased adipogenic capacity in subcutaneous adipocytes compared to intramuscular adipocytes from pigs, and Wan et al. [25] reporting an increased proliferative capacity of bovine subcutaneous preadipocytes compared to intramuscular preadipocytes. In addition to the less adipogenic transcriptional profile of IM, we observed a higher expression of muscle-related genes and activation of hormonal and metabolic signaling pathways in IM vs. SAT, suggestive of the strong crosstalk between IM and muscle, as marbling is physically embedded within this tissue. Overall, our findings and prior studies suggest SAT as the primary lipid storage depot in cattle with notable potential for lipid processing, hormone synthesis, and fatty acid catabolism, playing a major role in systemic metabolic regulation [21], while IM may be more responsive to endocrine signaling relevant to muscle energy demand and adjust glucose and lipid flux for marbling and local fuel storage.
The differential representation of AD subtypes in our study implied functional heterogeneity and depot-specific adipocyte specialization. To further understand whether distinct AD populations were likely functionally different AD subtypes, as previously observed in human and mice models [26], or whether these AD populations were in distinct stages of adipogenesis, we evaluated IM and SAT ASPC and AD dynamics through trajectory analysis. By integrating ASPCs and AD1–AD4 clusters from both depots, we captured a shared trajectory that revealed a conserved pathway of adipogenesis and revealed two types of mature adipocytes; though, further studies are necessary to elucidate whether these adipocytes subtypes are indeed functionally distinct. Of note, the pseudotime path confirmed the expected developmental progression from ASPC to more differentiated adipocyte states, validating the utility of these clusters for modeling adipocyte development.
Another important finding in this study was the enhanced immune profile of the SAT transcriptome compared to the IM transcriptome, despite a greater abundance of IMC in IM. Both, bulk RNAseq and snRNAseq analyses revealed the activation of many pathways associated with immune function in SAT compared to IM. Driving the activation of many of these pathways was the increased expression of BOLA-DMA, encoding the class II major histocompatibility complex (MHCII), particularly in the SAT IMCs. Prior work in mice has shown that MHCII expression by adipose tissue macrophages contributes to adipose tissue inflammation and insulin resistance, and that deletion of MHCII can protect against diet-induced obesity and restore glucose tolerance [27]. Our findings somewhat contrast with what was expected given the noted pro-inflammatory profile of intramuscular fat in humans [28]; however, our results also highlight the complexity of immune activity within different adipose tissue depots in beef cattle and the limited characterization of the inflammatory profile of the bovine intramuscular fat. Notably, as reviewed by Yamada et al. [29], a heightened inflammatory state in other adipose tissue depots in cattle, namely visceral adipose tissue, promotes increased infiltration of macrophages [14] and may lead to ectopic lipid accumulation within muscle via inhibiting adipogenesis in typical adipose tissue depots. Similarly, Wetzels et al. [27] found that macrophage subsets play a pivotal role in tissue remodeling, which could also be relevant for IM macrophages, contributing to the unique immune profile observed in this study. These insights suggest that adipose tissue immune cells play a role in adipogenesis and tissue responses to metabolic changes. The heightened immune profile in SAT could reflect a more complex interaction between lipid metabolism and immune cells in this depot [30] and how IM expands in areas where it was unwanted and becomes increased under the metabolic pressure of intensive feeding regimens in feedlot systems [31]. In summary, although the transcriptional findings presented in our investigation indicate a potentially increased immune and inflammatory profile in SAT compared to IM, increased macrophage abundance was observed in IM. Further depot-specificities related to immune and inflammatory responses in adipose and intramuscular lipid accumulation should include a comparison with visceral adipose tissue.
Our study identified a distinct endothelial cell (EC) subtype enriched IM, suggesting a greater presence of vascular structures in this depot that may contribute to local immune and metabolic functions. This finding suggests that endothelial cells in IM fat may play a role in modulating inflammatory responses and immune cell recruitment, contributing to the complex interplay between adipose tissue, vasculature, and immune cells in this depot [29,32]. Endothelial cells have been associated with adipose tissue inflammation and metabolic dysfunction in obesity [29], supporting the idea that endothelial cells in IM fat contribute to immune modulation in this depot.
Our results underscored the transcriptional differences in adipogenic potential and immune responses between SAT and IM fat depots, which highlight the challenge of enhancing marbling in beef cattle without also promoting excessive fat accumulation in less desirable depots, such as SAT. However, our study also had several limitations, which must be acknowledged. First, the small sample size (n = 2 animals, 4 samples) restricts the generalization of our findings and limits the statistical power to robustly identify depot-specific transcriptional differences in adipose tissue. Increasing the number of biological replicates in future studies will enhance the ability to detect differentially expressed genes, cell type-specific signatures and the determination of cell trajectory at the single-nuclei level. Second, the influence of other biological variables—such as breed, marbling score, and nutritional status—on transcriptional cellular heterogeneity was not assessed in this study and warrants further investigation. Third, the anatomical localization of intramuscular fat between the muscle fibers presents a significant technical challenge in isolating IM without muscle contamination. Although this reflects the physiological crosstalk between muscle and fat, it complicates the interpretation of adipose tissue-specific gene expression. To mitigate this, we manually filtered muscle-associated genes in the bulk dataset and applied computational strategies using RStudio to refine single-nuclei analyses. Nevertheless, complete exclusion of muscle contamination was not feasible, and results should be interpreted with caution. Future studies would benefit from improved tissue dissection and handling protocols to minimize cross-contamination and enhance the specificity of IM transcriptomic profiling.

5. Conclusions

This study provides novel insights into the transcriptional mechanisms and cellular heterogeneity between SAT and IM in beef cattle at the bulk tissue and single-nuclei levels. Our findings suggest that SAT has a more marked pro-adipogenic transcriptome than IM, characterized by greater expression of adipogenic and lipogenic genes, lipid metabolism pathways, and a higher abundance of adipocytes and progenitor cells. Concomitantly, The SAT profile is remarkedly enriched for genes and pathways of inflammatory and immune responses. IM’s transcriptome analysis suggests a limited adipogenic potential compared to SAT, alongside an increased abundance of immune cells and an evident metabolic crosstalk with muscle tissue, which may partially explain the inability to enhance marbling without undesirable fat deposition in other depots. While specific mechanisms limiting fat accumulation in IM tissue remain unclear, they likely involve depot-specific progenitor traits and intercellular crosstalk among adipose and muscle cells. Additionally, given that IM is dispersed within metabolically active muscle fibers, its deposition may be highly modulated by local energy demands and signaling from surrounding muscle. Further investigations are needed to elucidate mechanisms involved in IM and muscle crosstalk and to identify candidate genes and depot-specific cell types that may serve as nutritional and molecular targets for improving marbling while minimizing excess fat in beef cattle.

Supplementary Materials

The following supporting information can be downloaded at: https://www.mdpi.com/article/10.3390/agriculture15141545/s1. Supplemental Table S1: IM vs. SAT Differentially Expressed Genes List generated by bulk RNA sequencing analysis. Supplemental Table S2: IM vs. SAT Kyoto Encyclopedia of Genes and Genomes Enrichment Pathways. Supplemental Table S3: IM vs. SAT Gene Ontology Term Pathways. Supplemental Table S4: Differentially Expressed Genes of distinct cell types revealed by snRNAseq analysis. Supplemental Table S5: Differentially Expressed Genes of each cell type in SAT. Supplemental Table S6: Differentially Expressed Genes of each cell type in IM. Supplemental Table S7: Differentially Expressed Genes of trajectory analysis between ASPC and AD populations. Supplemental Table S8: Differentially Expressed Genes in mature adipocytes analyzed by snRNAseq, independent of depot. Supplemental Table S9: GO Terms enriched in SAT vs. IM cell types identified by snRNAseq analysis.

Author Contributions

Conceptualization, C.S.-B.; methodology, C.S.-B.; formal analysis, M.M.G. and H.R.F.; investigation, M.M.G., H.R.F. and C.S.-B.; writing—original draft preparation, M.M.G., H.R.F. and C.S.-B.; writing—review and editing, M.M.G., H.R.F., A.P.T., O.J.B., B.J.J. and C.S.-B.; visualization, M.M.G., H.R.F., A.P.T., O.J.B., B.J.J. and C.S.-B.; funding acquisition, C.S.-B. and B.J.J. All authors have read and agreed to the published version of the manuscript.

Funding

This manuscript was supported in part by the Agriculture and Food Research Initiative Competitive Grant no. 2023-67015-39336 from the USDA-NIFA (U.S. Department of Agriculture National Institute of Food and Agriculture). The findings and conclusions in this publication have not been formally disseminated by the U.S. Department of Agriculture and should not be construed to represent any agency determination or policy. Merck Animal Health USA provided funding for single-cell analysis as a research gift.

Institutional Review Board Statement

The study involved the use of animals after harvest at Texas Tech Meat Science Lab. Thus, the Institutional Animal Care and Use Committee (IACUC) approval is not required.

Data Availability Statement

The original contributions presented in the study are included in the article/Supplementary Materials. The Raw sequencing data presented in the study are openly available in NCBI with GEO accession ID GSE302935. The files will be publicly available on 31 July.

Acknowledgments

Thank you to the Texas Tech Meat Science Lab for allowing us to obtain adipose tissue samples for this project.

Conflicts of Interest

The authors declare no conflicts of interest. The funders had no role in the design of the study; in the collection, analyses, or interpretation of data; in the writing of the manuscript; or in the decision to publish the results.

Abbreviations

ADMature adipocytes
ASPCAdipose stromal and progenitor cells
ECEndothelial cells
IMIntramuscular fat
IMCImmune cells
RNAseqRNA sequencing
SATSubcutaneous adipose tissue
SMCSmooth muscle cells
snRNAseqSingle-nuclei RNA sequencing

References

  1. BQA. National Beef Quality Audits; National Beef Packing Company, LLC: Kansas City, MO, USA, 2022. [Google Scholar]
  2. Mwangi, F.W.; Charmley, E.; Gardiner, C.P.; Malau-Aduli, B.S.; Kinobe, R.T.; Malau-Aduli, A.E. Diet and genetics influence beef cattle performance and meat quality characteristics. Foods 2019, 8, 648. [Google Scholar] [CrossRef]
  3. Gotoh, T.; Albrecht, E.; Teuscher, F.; Kawabata, K.; Sakashita, K.; Iwamoto, H.; Wegner, J. Differences in muscle and fat accretion in Japanese Black and European cattle. Meat Sci. 2009, 82, 300–308. [Google Scholar] [CrossRef] [PubMed]
  4. Harvey, I.; Boudreau, A.; Stephens, J.M. Adipose tissue in health and disease. Open Biol. 2020, 10, 200291. [Google Scholar] [CrossRef] [PubMed]
  5. Horwitz, A.; Birk, R. Adipose tissue hyperplasia and hypertrophy in common and syndromic obesity—The case of BBS obesity. Nutrients 2023, 15, 3445. [Google Scholar] [CrossRef] [PubMed]
  6. Jiang, N.; Li, Y.; Shu, T.; Wang, J. Cytokines and inflammation in adipogenesis: An updated review. Front. Med. 2019, 13, 314–329. [Google Scholar] [CrossRef]
  7. Ambele, M.A.; Dhanraj, P.; Giles, R.; Pepper, M.S. Adipogenesis: A complex interplay of multiple molecular determinants and pathways. Int. J. Mol. Sci. 2020, 21, 4283. [Google Scholar] [CrossRef]
  8. Weidemüller, P.; Kholmatov, M.; Petsalaki, E.; Zaugg, J.B. Transcription factors: Bridge between cell signaling and gene regulation. Proteomics 2021, 21, 2000034. [Google Scholar] [CrossRef]
  9. Liao, X.; Zhou, H.; Deng, T. The composition, function, and regulation of adipose stem and progenitor cells. J. Genet. Genom. 2022, 49, 308–315. [Google Scholar] [CrossRef]
  10. Ford, H.; Liu, Q.; Fu, X.; Strieder-Barboza, C. White Adipose Tissue Heterogeneity in the Single-Cell Era: From Mice and Humans to Cattle. Biology 2023, 12, 1289. [Google Scholar] [CrossRef]
  11. Richard, A.J.; White, U.; Elks, C.M.; Stephens, J.M. Adipose Tissue: Physiology to Metabolic Dysfunction; Endotext [Internet]; MDText.com, Inc.: South Dartmouth, MA, USA, 2020. [Google Scholar]
  12. Wang, X.; Liang, C.; Li, A.; Cheng, G.; Long, F.; Khan, R.; Wang, J.; Zhang, Y.; Wu, S.; Wang, Y. RNA-Seq and lipidomics reveal different adipogenic processes between bovine perirenal and intramuscular adipocytes. Adipocyte 2022, 11, 448–462. [Google Scholar] [CrossRef]
  13. Michelotti, T.C.; Kisby, B.R.; Flores, L.S.; Tegeler, A.P.; Fokar, M.; Crasto, C.; Menarim, B.C.; Loux, S.C.; Strieder-Barboza, C. Single-nuclei analysis reveals depot-specific transcriptional heterogeneity and depot-specific cell types in adipose tissue of dairy cows. Front. Cell Dev. Biol. 2022, 10, 1025240. [Google Scholar] [CrossRef]
  14. Yamada, T.; Kamiya, M.; Higuchi, M.; Nakanishi, N. Fat depot-specific differences of macrophage infiltration and cellular senescence in obese bovine adipose tissues. J. Vet. Med. Sci. 2018, 80, 1495–1503. [Google Scholar] [CrossRef]
  15. Cinkajzlová, A.; Mráz, M.; Haluzík, M. Adipose tissue immune cells in obesity, type 2 diabetes mellitus and cardiovascular diseases. J. Endocrinol. 2022, 252, R1–R22. [Google Scholar] [CrossRef]
  16. Dobin, A.; Davis, C.A.; Schlesinger, F.; Drenkow, J.; Zaleski, C.; Jha, S.; Batut, P.; Chaisson, M.; Gingeras, T.R. STAR: Ultrafast universal RNA-seq aligner. Bioinformatics 2013, 29, 15–21. [Google Scholar] [CrossRef] [PubMed]
  17. Green, M.M.; Woolums, A.R.; Karisch, B.B.; Harvey, K.M.; Capik, S.F.; Scott, M.A. Influence of the At-Arrival Host Transcriptome on Bovine Respiratory Disease Incidence during Backgrounding. Vet. Sci. 2023, 10, 211. [Google Scholar] [CrossRef] [PubMed]
  18. Stuart, T.; Butler, A.; Hoffman, P.; Hafemeister, C.; Papalexi, E.; Mauck, W.M.; Hao, Y.; Stoeckius, M.; Smibert, P.; Satija, R. Comprehensive integration of single-cell data. Cell 2019, 177, 1888–1902.e21. [Google Scholar] [CrossRef]
  19. Loft, A.; Emont, M.P.; Weinstock, A.; Divoux, A.; Ghosh, A.; Wagner, A.; Hertzel, A.V.; Maniyadath, B.; Deplancke, B.; Liu, B.; et al. Towards a consensus atlas of human and mouse adipose tissue at single-cell resolution. Nat. Metab. 2025, 7, 875–894. [Google Scholar] [CrossRef]
  20. Tan, Z.; Jiang, H. Molecular and Cellular Mechanisms of Intramuscular Fat Development and Growth in Cattle. Int. J. Mol. Sci. 2024, 25, 2520. [Google Scholar] [CrossRef]
  21. Sheng, X.; Ni, H.; Liu, Y.; Li, J.; Zhang, L.; Guo, Y. RNA-seq analysis of bovine intramuscular, subcutaneous and perirenal adipose tissues. Mol. Biol. Rep. 2014, 41, 1631–1637. [Google Scholar] [CrossRef]
  22. Ueda, S.; Hosoda, M.; Yoshino, K.-I.; Yamanoue, M.; Shirai, Y. Gene expression analysis provides new insights into the mechanism of intramuscular fat formation in Japanese Black Cattle. Genes 2021, 12, 1107. [Google Scholar] [CrossRef]
  23. Zhang, Y.; Sun, Y.; Wu, Z.; Xiong, X.; Zhang, J.; Ma, J.; Xiao, S.; Huang, L.; Yang, B. Subcutaneous and intramuscular fat transcriptomes show large differences in network organization and associations with adipose traits in pigs. Sci. China Life Sci. 2021, 64, 1732–1746. [Google Scholar] [CrossRef] [PubMed]
  24. Zhang, G.H.; Lu, J.X.; Chen, Y.; Zhao, Y.Q.; Guo, P.H.; Yang, J.T.; Zang, R.X. Comparison of the adipogenesis in intramuscular and subcutaneous adipocytes from Bamei and Landrace pigs. Biochem. Cell Biol. 2014, 92, 259–267. [Google Scholar] [CrossRef] [PubMed]
  25. Wan, R.; Du, J.; Ren, L.; Meng, Q. Selective adipogenic effects of propionate on bovine intramuscular and subcutaneous preadipocytes. Meat Sci. 2009, 82, 372–378. [Google Scholar] [CrossRef]
  26. Emont, M.P.; Jacobs, C.; Essene, A.L.; Pant, D.; Tenen, D.; Colleluori, G.; Di Vincenzo, A.; Jørgensen, A.M.; Dashti, H.; Stefek, A. A single-cell atlas of human and mouse white adipose tissue. Nature 2022, 603, 926–933. [Google Scholar] [CrossRef]
  27. Wetzels, S.; Bijnen, M.; Wijnands, E.; van de Gaar, J.; Tan, A.; Coort, S.; Biessen, E.A.; Schalkwijk, C.G.; Wouters, K. CD11c− MHC2low Macrophages Are a New Inflammatory and Dynamic Subset in Murine Adipose Tissue. Immunometabolism 2020, 2, e200015. [Google Scholar] [CrossRef]
  28. Chasapi, A.; Balampanis, K.; Kourea, E.; Kalfarentzos, F.; Lambadiari, V.; Lambrou, G.I.; Melachrinou, M.; Sotiropoulou-Bonikou, G. Can obesity-induced inflammation in skeletal muscle and intramuscular adipose tissue accurately detect liver fibrosis? J. Musculoskelet. Neuronal Interact. 2018, 18, 509. [Google Scholar]
  29. Yamada, T. Intramuscular adipogenesis in cattle: Effects of body fat distribution and macrophage infiltration. Anim. Sci. J. 2022, 93, e13785. [Google Scholar] [CrossRef]
  30. Kawai, T.; Autieri, M.V.; Scalia, R. Adipose tissue inflammation and metabolic dysfunction in obesity. Am. J. Physiol. Cell Physiol. 2021, 320, C375–C391. [Google Scholar] [CrossRef]
  31. Dykier, K.C.; Oltjen, J.W.; Robinson, P.H.; Sainz, R.D. Effects of finishing diet sorting and digestibility on performance and feed efficiency in beef steers. Animal 2020, 14, 59–65. [Google Scholar] [CrossRef]
  32. Li, M.; Qian, M.; Kyler, K.; Xu, J. Adipose Tissue-Endothelial Cell Interactions in Obesity-Induced Endothelial Dysfunction. Front. Cardiovasc. Med. 2021, 8, 681581. [Google Scholar] [CrossRef]
Figure 1. (A) Enhanced Volcano Plot of a total of 15,200 variables in the dataset. A total of 1700 genes (red dots) were differentially expressed (DEG) between IM and SAT based on adjusted p value < 0.05 (dotted horizontal line) and log2FC. Red dots in the left side of the vertical gray dotted line represent downregulated genes and dots on the right represent upregulated genes in IM vs. SAT. Axis x represents the unstandardized signal (e.g., log2 fold change) and axis y represents the noise-adjusted/standardized signal (p value) from the t-test. Gray dots represent non-significant genes. (B) Heatmap of top 1000 DEGs between depots via heatmap clustering sustained the distinction of gene expression patterns between IM and SAT, identifying differences between depositions.
Agriculture 15 01545 g001
Figure 2. (A) Kyoto Encyclopedia of Genes and Genomes (KEGG) Pathways enriched for intramuscular vs. subcutaneous samples in the bulk transcriptome. KEGG Pathways were elected and showed multiple pathways being activated and suppressed via expression of the whole transcriptome. Color depends on up or downregulated genes with the p value and overall relative expression of each pathway. (B,C) A Cnet plot derived from GO terms (p value < 0.05) was selected for further analysis. The fold change in gene expression was calculated by comparing expression levels between depots. (B) Genes with a fold change greater than 2 were considered significantly upregulated in IM vs. SAT (B), and genes with a fold change less than 0.5 were considered significantly downregulated in IM vs. SAT (C). The yellow points represent the GO categories; the color and size of dots represent expression level and fold change in terms and genes.
Agriculture 15 01545 g002
Figure 3. Single-nuclei RNA sequencing (snRNA-seq) analysis of intramuscular (IM) and subcutaneous (SAT) adipose tissue samples from two beef steers. (A) UMAP plot of cell population differences between IM and SAT. (B) UMAP of cell populations identified in IM and SAT, including mature adipocytes (AD), adipose steam and progenitor cells (ASPC), endothelial cells (EC), smooth muscle cells (SMC), and immune cells (IMC). (C) Heatmap of marker genes in cell subtypes identified by snRNA-seq. Color differences encode the scaled average expression level across those cells (red: high expression; blue: downregulation). (D) Percentages of nuclei per cell type across IM and SAT. (E) Violin plots displaying the combined expression of the top 10 upregulated and top 10 downregulated genes revealed by bulk RNA and single-nuclei RNA sequencing data of IM vs. SAT depots.
Agriculture 15 01545 g003
Figure 4. Pseudotime trajectory analysis of adipocyte differentiation from progenitor to mature states. (A) UMAP plot showing the clustering of adipose stem and progenitor cells (ASPCs) and mature adipocyte subtypes (AD1–AD4) from combined SAT and IM nuclei. (B) Pseudotime trajectory inferred using Monocle 3, with ASPCs designated as the root node and differentiation proceeding toward AD clusters. Cells are colored by pseudotime, illustrating the progression from progenitor (ASPC) to less mature (AD3) and more mature (AD1 and AD4) adipocyte states. (C) Heatmap displaying the top 100 genes dynamically regulated across pseudotime, highlighting stage-specific gene expression patterns associated with adipocyte maturation.
Agriculture 15 01545 g004
Figure 5. (AD) SAT vs. IM enriched terms (GO) selected based on top five up and downregulated normalized enrichment scores (NES) that were significant (p value < 0.05) in (A) mature AD, (B) ASPC, (C) EC, and (D) IMC. Red: Suppressed pathways in SAT vs. IM; Blue: activated pathways SAT vs. IM.
Agriculture 15 01545 g005
Disclaimer/Publisher’s Note: The statements, opinions and data contained in all publications are solely those of the individual author(s) and contributor(s) and not of MDPI and/or the editor(s). MDPI and/or the editor(s) disclaim responsibility for any injury to people or property resulting from any ideas, methods, instructions or products referred to in the content.

