Article

Estimation of Available Phosphorus Under Phosphorus Fertilization in Paddy Fields of a Cold Region Using Several Extraction Methods: A Case Study from Yamagata, Japan

1
Graduate School of Agricultural Sciences, Yamagata University, Tsuruoka 997-8555, Japan
2
Faculty of Agriculture, Yamagata University, Tsuruoka 997-8555, Japan
3
Graduate School of Agricultural Science, Tohoku University, Sendai 980-8572, Japan
*
Authors to whom correspondence should be addressed.
Agriculture 2025, 15(13), 1453; https://doi.org/10.3390/agriculture15131453
Submission received: 21 May 2025 / Revised: 26 June 2025 / Accepted: 2 July 2025 / Published: 5 July 2025
(This article belongs to the Special Issue Innovative Conservation Cropping Systems and Practices—2nd Edition)

Abstract

Assessing available phosphorus (P) in paddy fields is challenging due to waterlogging-induced reducing conditions. This study tested the applicability of the Truog, Bray 2, and Mehlich 3 extraction methods in both air-dried and incubated soils, as well as the ascorbic-acid-reduced Bray 2 (AR Bray 2), which simulates reducing conditions, for evaluating rice growth under P fertilization. In addition, to investigate the chemical characteristics of the extraction methods, active Al and Fe and P sequential extractions were measured. Soil samples from four representative regions in Yamagata Prefecture were used. Pot cultivation tests using ‘Haenuki’ and ‘Tsuyahime’ cultivars were conducted with varying P fertilizer levels. Variations in P availability across soil types were influenced by levels of active Al and Fe. Sequential extractions identified NaHCO3-P and NaOH-P fractions as important for P availability. Bray 2 in both soils and AR Bray 2 were the most effective methods, showing a strong saturating exponential correlation with rice growth and P uptake, whereas Mehlich 3 and Truog showed weaker correlations. Bray 2 and AR Bray 2 show potential but require further evaluation for practical application due to the small number of soils. Future efforts should prioritize developing methods that account for P dynamics under reducing conditions, thereby improving P management strategies and supporting sustainable rice production.

1. Introduction

In cold-climate regions, declining temperatures can inhibit rice growth, making early development critical for ensuring stable yields. Phosphorus (P) plays a vital role in early growth, but low temperatures often impair P uptake, resulting in delayed development [1]. The importance of efficient P fertilization in cold regions lies in elevating extractable P to critical thresholds and improving grain yield [2]. Consequently, large quantities of P fertilizer are frequently applied in northern Japan such as the Tohoku region. Rice fields account for approximately 30% of the total P fertilizer consumption in Japan [3,4]; however, excessive P accumulation has become a growing concern. A nationwide survey revealed that 80% of rice fields exceeded the diagnostic threshold for plant-available P using the Truog method in air-dried soils (44 mg P kg−1) [5]. Similarly, in Hokkaido, Bray-2-extractable P in field-moist soils exceeded recommended values in most fields [6]. P accumulation is also suspected in Yamagata Prefecture [7]. To reduce fertilizer usage while maintaining yield, it is essential to estimate the amount of available P that rice can actually utilize.
Several extraction methods have been developed to estimate available P, each targeting different chemical forms. The Truog method, widely used in Japan, extracts P bound to calcium and magnesium under acidic conditions [8]. Bray 2 extracts P associated with calcium, aluminum, and partially iron [9], while Mehlich 3, commonly used in North America and Europe, targets Ca-, Al-, and Fe-bound P using a mixture of acids and chelating agents [10,11,12]. These methods are not directly comparable due to differences in the extracted P fractions. The absence of standardized diagnostic approaches makes it difficult to establish clear fertilization guidelines.
Assessing available P in paddy soils is particularly challenging due to the reducing conditions caused by waterlogging. In flooded soils, P exists primarily as complexes or precipitates with Ca-, Fe-, and Al-bearing minerals. The biogeochemical behavior of P is largely influenced by changes in redox potential and pH [13,14]. Methods simulating reduced conditions, such as prolonged submergence incubation or chemical reduction using ascorbic acid, have been developed to better estimate Fe-P solubility [15,16]. However, the extent to which these methods correlate with rice growth remains poorly understood.
Iron redox cycling plays a key role in P solubilization and uptake under flooded conditions [17]. Sequential extraction methods, such as the Hedley fractionation, are widely used to identify different P pools, including both inorganic and organic forms [18]. Among these, NaHCO3-extractable P—typically representing around 10% of total P—and NaOH-extractable P, which is associated with Al and Fe oxides, are considered important indicators of available P in submerged rice systems [19,20,21,22]. These fractions are particularly relevant under reduced conditions where Fe-P becomes more soluble.
This study aims to identify a more reliable method for evaluating available P in paddy fields of a cold region. We hypothesize that P solubility and availability are closely related to specific P fractions extracted through sequential fractionation and simulated reduction techniques. Therefore, we assessed the effectiveness of extraction methods including Truog, Bray 2, and Mehlich 3, as well as their relationships with rice growth parameters, particularly in cold-climate soils from Yamagata, northern Japan.

2. Materials and Methods

2.1. Soil Sampling and Analysis

Soil samples were collected from four major rice-producing regions in Yamagata Prefecture, Japan: Shonai (Field Science Center, Yamagata University; 38°42′ N, 139°49′ E), Mogami (Shinjo City; 38°50′ N, 140°19′ E), Murayama (Tendo City; 38°20′ N, 140°21′ E), and Okitama (Yonezawa City; 37°56′ N, 140°06′ E). According to climatic data from the Japan Meteorological Agency, the average annual temperatures at these sites are 12.9 °C, 11.0 °C, 11.4 °C, and 11.4 °C, respectively, with corresponding annual precipitation levels of 2191, 2006, 1088, and 1445 mm [23]. Soil sampling was conducted in tilled paddy fields during March and April 2022. Surface soils (0–15 cm) were collected from five points arranged along diagonal transects in each field, including the center. All fields were under conventional management, following standard fertilization and irrigation practices. Based on the Japanese soil classification system, the sampled soils were classified as Gray Lowland (Shonai), Wet Andosol (Mogami), Gley Lowland (Murayama), and Brown Forest (Okitama) [24]. According to the World Reference Base for Soil Resources, these correspond to Fluvisols for Shonai and Luvisols for the other three regions.
All samples were air-dried and passed through a 2 mm sieve before analysis. Standard physical and chemical properties were determined as follows (Table 1). Soil pH (in a 1:2.5 soil-to-water suspension) and electrical conductivity (EC; in a 1:5 suspension) were measured using glass electrodes(D-210PC-S, HORIBA, Ltd., Kyoto, Japan). Cation exchange capacity (CEC) was determined using the ammonium acetate method (1 M, pH 7.0), followed by displacement with potassium chloride [25]. Exchangeable Ca, Mg, and K were extracted with 1 M ammonium acetate and quantified using atomic absorption spectrophotometry (AAS; Z-2300, Hitachi, Ltd., Tokyo, Japan). Available nitrogen (N) was estimated by incubating soil samples at 30 °C for four weeks, extracting with 2 M KCl, and analyzing the extract colorimetrically [26].
To investigate the relationship with the phosphorus extraction method, active aluminum (Al) and iron (Fe) were extracted using three methods: acid ammonium oxalate, sodium pyrophosphate, and dithionite–citrate–bicarbonate (DCB) [27,28]. Extracted Al and Fe concentrations were measured by AAS. Soil texture was analyzed using the pipette method [28].

2.2. Soil Analysis for Comparison of Available Phosphorus Analysis Methods

Available P was analyzed using four extraction methods: Truog, Bray 2, Mehlich 3, and ascorbic-acid-reduced Bray 2 (AR Bray 2). Previous studies suggested that AR Bray 2 had the potential to better estimate available P in flooded conditions [15,16]. For the Truog method, 0.001 M H2SO4 was added to air-dried soil at a 1:200 soil-to-extractant ratio, allowed to infiltrate for 30 min, and then filtered [8]. For Bray 2, 0.1 M HCl and 0.03 M NH4F were added at a 1:20 ratio, followed by 1 min of shaking and filtration [25]. Mehlich 3 extraction involved the addition of a mixed solution containing 0.2 M CH3COOH, 0.25 M NH4NO3, 0.015 M NH4F, 0.013 M HNO3, and 0.001 M EDTA at a 1:10 ratio, shaken for 5 min, and then filtered [10]. For AR Bray 2, 10 mL of 0.057 M ascorbic acid was added to 1 g of air-dried soil and shaken for 16 h. Subsequently, 10 mL of Bray 2 extractant at double strength was added, shaken for 1 min, and filtered [16]. All filtrates were analyzed using the molybdenum blue method with a spectrophotometer (UV-2550, SHIMADZU CORPORATION, Kyoto, Japan).
Soil incubation to simulate reduced soil conditions was conducted following the vacuum pouch incubation method [29]. Approximately 10 g of air-dried soil was placed in an aluminum-vapor-deposited pouch (LAMIZIP AL-11, 202 mm × 110 mm, SEISANNIPPONSHA Ltd., Tokyo, Japan) with 100 mL of deionized water. The pouch was vacuum-sealed and incubated at 30 °C for four weeks. After incubation, available P was determined using the Truog, Bray 2, and Mehlich 3 methods.
Total P was extracted from 5 g of air-dried, finely ground soil by sequential acid digestion using 1 mL of concentrated H2SO4, 5 mL of HNO3, and 20 mL of HClO4. After digestion, 30 mL of 1 M HCl and 50 mL of hot water were added, and the mixture was heated to just below boiling. The supernatant was filtered using quantitative filter paper (ADVANTEC No. 6, ADVANTEC TOYO KAISHA, Ltd., Tokyo, Japan), and P concentrations were determined colorimetrically [25].
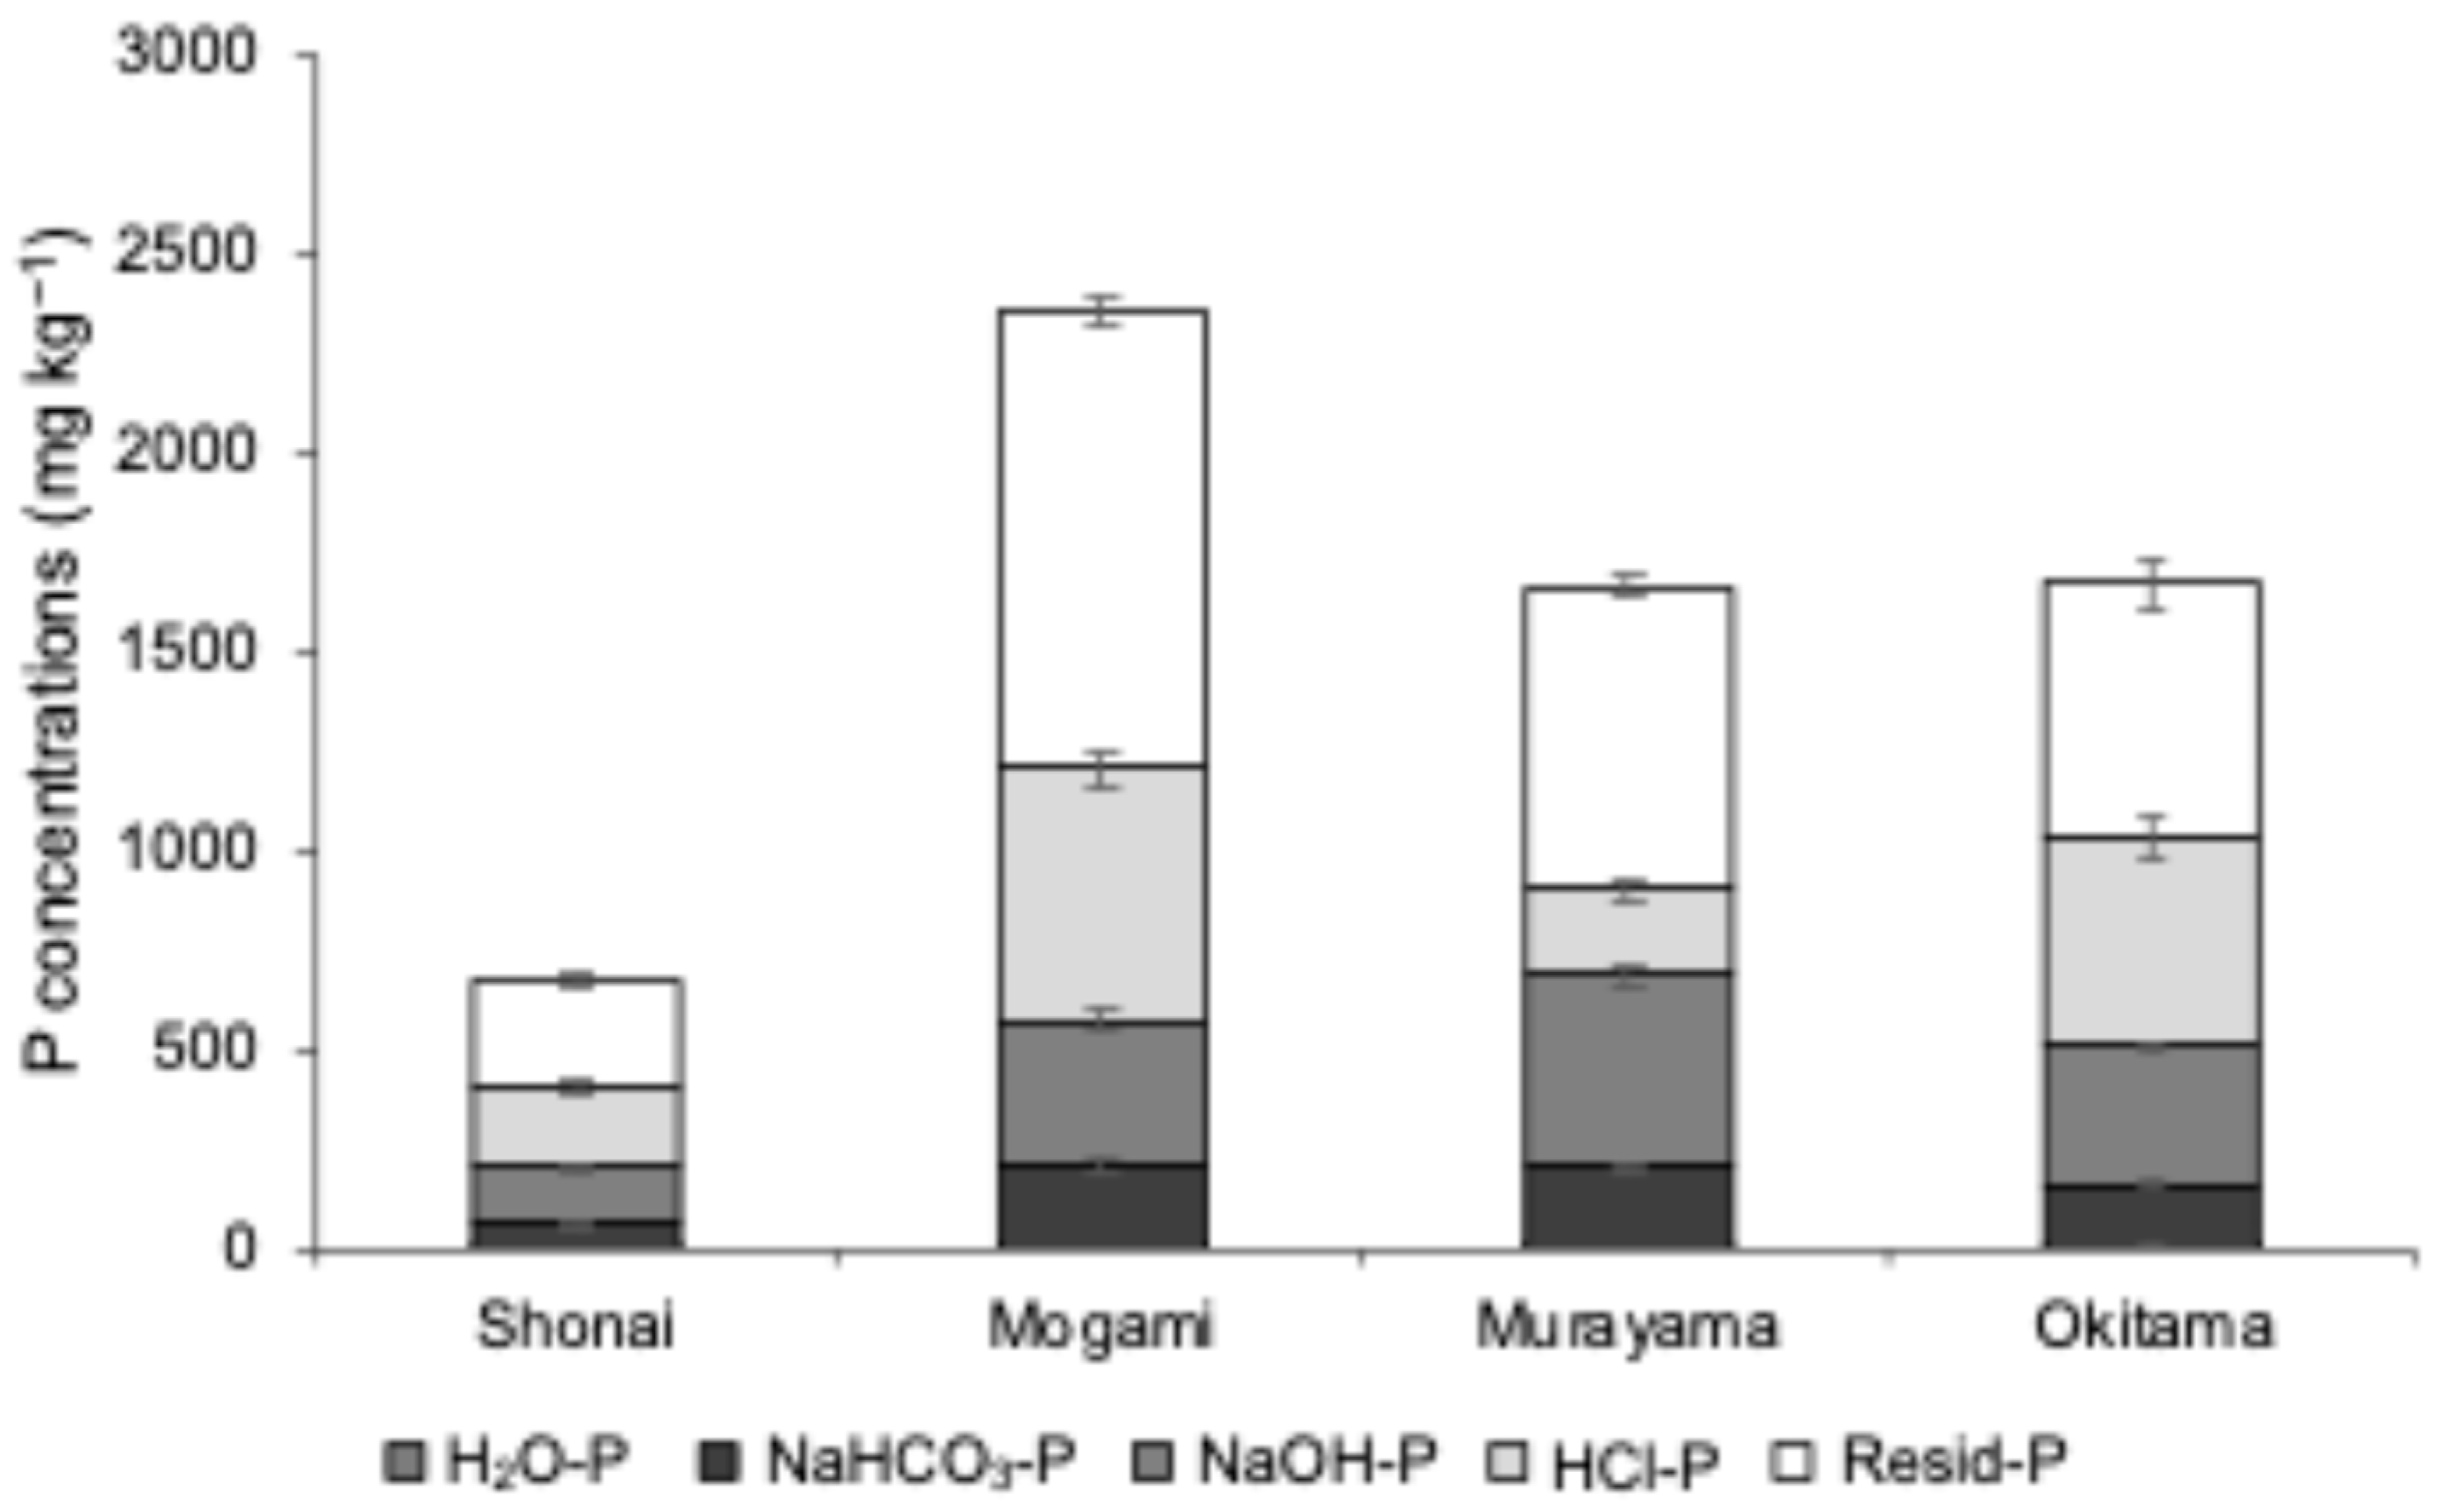
P fractions were characterized using a modified Hedley sequential extraction method [18]. Soil was sequentially extracted with distilled water (1:30 w/v), 0.5 M NaHCO3 (pH 8.5), 0.1 M NaOH, and 1 M HCl, with each extraction performed under continuous shaking for 16 h at 25 °C. The supernatant P concentrations were measured colorimetrically. Water-extractable P (H2O-P) represents the most readily available fraction, while NaHCO3-extractable P (NaHCO3-P) is moderately available. NaOH- and HCl-extractable P represent more strongly bound forms with lower solubility [30]. The sum of these four fractions was considered the total inorganic P, and the difference between total and inorganic P was defined as residual P (Resid-P). All analyses were conducted three times for each of the four soils and we thus indicated the standard errors in the figures and tables.

2.3. Pot Experiment to Assess the Effects of Accumulated Phosphorus

A pot experiment was conducted in the experimental field of the Faculty of Agriculture, Yamagata University, using soils collected from four regions (Shonai, Mogami, Murayama, and Okitama). Air-dried soil (2.5 kg) from each site was placed into Wagner pots (Wagner’s pot 1/5000a, FUJIWARA SCIENTIFIC CO., Ltd., Tokyo, Japan). Two rice cultivars were used: ‘Haenuki’, a widely grown variety in Yamagata Prefecture, and ‘Tsuyahime’, a high-quality variety that has expanded in cultivation area in recent years and is subject to reduced- or no-fertilizer cultivation under the Yamagata Prefecture certification system [31]. Fertilization treatments were designed in accordance with regional guidelines [32]. Based on these guidelines, the recommended fertilization rates differ between the two rice cultivars. The recommended rates for Haenuki and Tsuyahime are 60:60:60 and 30:30:30 kg ha−1 for N:P:K, respectively. Three P application rates were tested across all soils: P0 (no P), P1/2 (half of the standard rate), and P1 (the standard rate). The standard rate, P1, for each variety was aligned with the recommended fertilizer rate. For Haenuki, the P0, P1, and P2 treatments were set at 0, 60, and 120 mg P2O5 pot−1, respectively, while for Tsuyahime, the rates were set at 0, 30, and 60 mg P2O5 pot−1. To better evaluate crop response in low-P conditions, two additional fertilizer rates were applied exclusively to the Shonai soil: P4/3 (160 mg P2O5 pot−1) and P2 (240 mg P2O5 pot−1) for Haenuki and P4/3 (80 mg P2O5 pot−1) and P2 (120 mg P2O5 pot−1) for Tsuyahime. Nitrogen and potassium were applied at fixed rates: 120 mg N and 120 mg K2O pot−1 for Haenuki and 60 mg N and 60 mg K2O pot−1 for Tsuyahime. Ammonium sulfate, superphosphate, and potassium chloride were used as sources of nitrogen, P, and potassium, respectively. Fertilizers were mixed into the air-dried soil, which was then fully saturated with water and homogenized. Each treatment was replicated three times.
Seedlings were transplanted on 20 May 2022, and the experiment was continued until the heading stage on 10 August 2022. The average temperature during the growing period was 25.1 °C, with a total sunshine duration of 196.4 h. Pots were kept under continuously flooded conditions, and weed and pest control were managed according to standard practices. Because P uptake intensifies after root establishment and peaks during the heading and flowering stages, sampling was conducted at heading to evaluate the effect of P status on total P uptake by the whole plant. At this stage, aboveground biomass was harvested, oven-dried at 75 °C for 48 h, and weighed to determine shoot dry weight (SDW). To assess P uptake, approximately 500 mg of dried, finely ground plant tissue was digested. One milliliter of deionized water and 4 mL of concentrated sulfuric acid were added to a Pyrex test tube containing the sample, which was mixed using a touch mixer (VMX-3000V, AS ONE CORPORATION, Osaka, Japan). The tube was then heated at 250 °C in an aluminum block for 30 min. Hydrogen peroxide was added until the digest became clear, and the final volume was adjusted to 100 mL [33]. The P concentration in the digest was determined using the molybdenum blue method with a spectrophotometer.

2.4. Statistical Analysis

Analysis of variance (ANOVA) was used to evaluate the effects of P fertilization on SDW, P concentration, and P uptake (PU). Before ANOVA, normality and homogeneity of variance were tested using Shapiro–Wilk and Levene tests, respectively. Relationships between available P and SDW or PU were modeled using exponential saturation functions:
S D W = a × 1 exp b   ×   Ext - P
P U = a × 1 exp b   ×   Ext - P
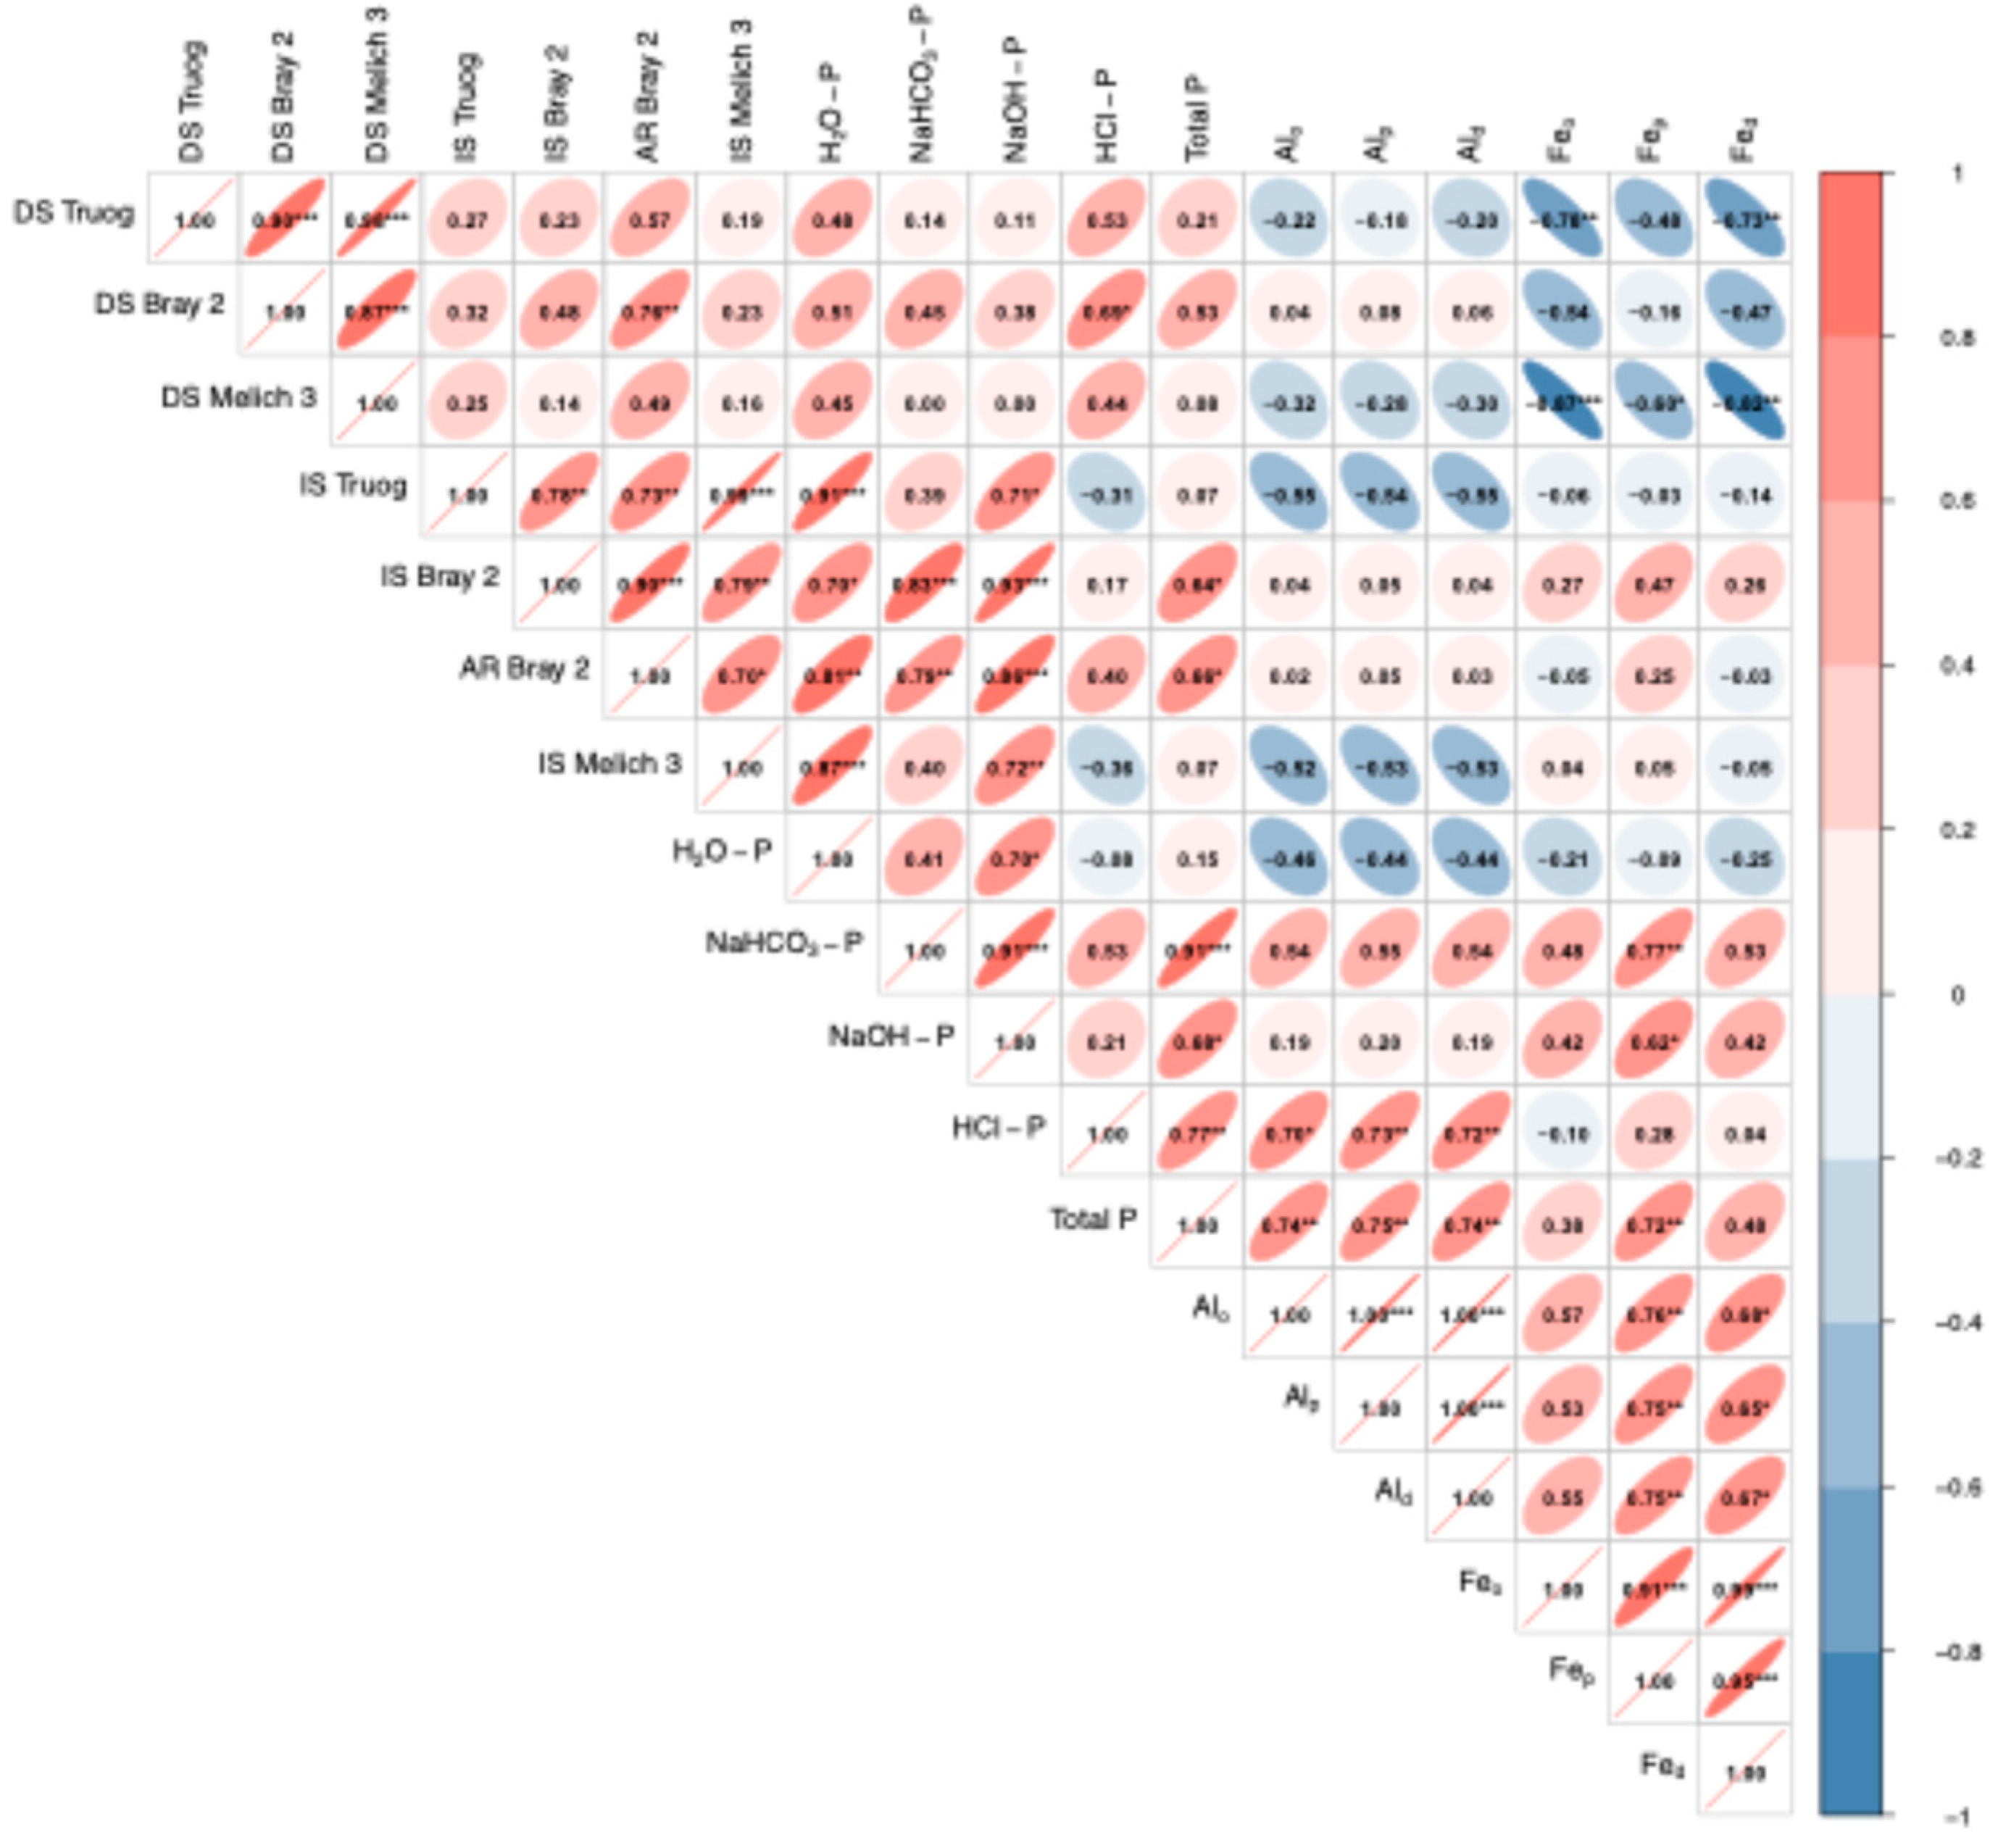
where a represents the maximum value of SDW or P uptake and b determines the rate at which SDW or P uptake responds to increasing Ext-P. In both models, Ext-P represents the available P concentration determined from air-dried soils prior to P fertilization, as shown in Figure 1. Pearson’s correlation coefficients were calculated to assess the relationships among P extraction methods, sequential extraction fractions, and soil Fe and Al. Statistical analyses were performed using R software version 3.3.3 [34].

3. Results

3.1. Comparison of Available Phosphorus Analysis Methods

The results of available P extractions from both air-dried and incubated soils are presented in Figure 1. Across all extraction methods and soil types, incubated soils consistently yielded higher P concentrations than air-dried soils. Truog-extractable P showed particularly large increases in Murayama and Shonai soils under incubation, with 13.2-fold and 5.3-fold rises, respectively. In contrast, increases in Mogami and Okitama soils were more moderate, approximately twofold. For Bray 2, increases were comparatively smaller, with 3.5-fold in Murayama, 1.8-fold in Shonai and Mogami, and 1.2-fold in Okitama. Mehlich 3 showed the most substantial change in Murayama, exhibiting a 20.8-fold increase under reduced conditions. The AR Bray 2 method, which incorporates ascorbic acid as a reducing agent, produced results that closely aligned with those of incubated Bray 2, supporting its validity as an alternative for estimating available P under reduced soil conditions in paddy fields. As shown in Figure 1, the available P concentrations prior to fertilization were used to assess the relationship between initial soil P status and plant response variables such as dry matter production, P concentration, and P uptake.
Figure 2 summarizes the results of the sequential P extraction. Total P concentrations varied considerably among soils, ranging from 677 mg P kg−1 in Shonai, the lowest, to between 1668 and 2359 mg P kg−1 in the other three soils. The proportion of inorganic P (H2O-P, NaHCO3-P, NaOH-P, and HCl-P) accounted for 51.2% to 61.5% of total P. H2O-P was negligible in all samples (<0.2%), while NaHCO3-P consistently comprised 8.8–11.8% of total P. NaOH-P was most abundant in Murayama (29.2%) and least in Mogami (15.6%). In contrast, HCl-P was lowest in Murayama (13.1%), indicating variation in the distribution of P fractions across soil types.
Active aluminum and iron contents (Table 2) showed distinct regional differences. Mogami soil exhibited the highest concentrations of oxalate-extractable, pyrophosphate-extractable, and dithionite–citrate aluminum (Alo: 18.0 g kg−1, Alp: 16.1 g kg−1, Ald: 14.2 g kg−1) and iron (Feo: 11.0 g kg−1, Fep: 9.7 g kg−1, Fed: 19.5 g kg−1). Murayama soil also showed high levels of active Fe (Feo: 11.1 g kg−1), whereas Shonai and Okitama had comparatively lower values across all fractions (Feo: 3.2–7.1 g kg−1; Alo: 2.5–2.6 g kg−1).
Correlation analysis (Figure 3) showed strong relationships among extraction methods in air-dried soils. DS Truog and DS Mehlich 3 were nearly perfectly correlated (r = 0.99), and DS Bray 2 also showed a strong correlation with DS Truog (r = 0.94). In contrast, negative correlations were observed between Fe-related parameters (Feo, Fep, Fed) and extractable p values, particularly for DS Truog and DS Mehlich 3, suggesting reduced extractability in Fe-rich soils under oxidized conditions. In incubated soils, correlations among extraction methods remained high but were slightly attenuated, likely due to redox-induced shifts in P availability. IS Truog and IS Mehlich 3 were also strongly correlated (r = 0.99), while IS Bray 2 showed a weaker relationship with IS Truog (r = 0.81). Notably, IS Bray 2 was highly correlated with NaOH-extractable P (r = 0.98), which estimates moderately bound Fe- and Al-associated P.

3.2. Effect of Phosphorus Fertilization on Rice Growth and Development

As summarized in Table 3, SDW, P concentration, and PU at the heading stage were unaffected by P fertilization in all soils, indicating that available P levels were almost sufficient for rice growth. Among the four soil types, Shonai soil consistently produced the lowest SDW: 42.9 g pot−1 for Haenuki and 38.3 g pot−1 for Tsuyahime, representing reductions of approximately 20–52% compared to the other soils. PU was strongly proportional to SDW, further confirming the lack of a clear P response under sufficient P availability conditions. Furthermore, no statistically significant interactions were detected with P application (Treatment), indicating that neither rice variety nor soil type significantly altered the overall response pattern to P fertilization. Although P concentration was statistically affected by P treatment (p < 0.05), the differences were relatively small and did not translate into notable changes in plant growth or P uptake.
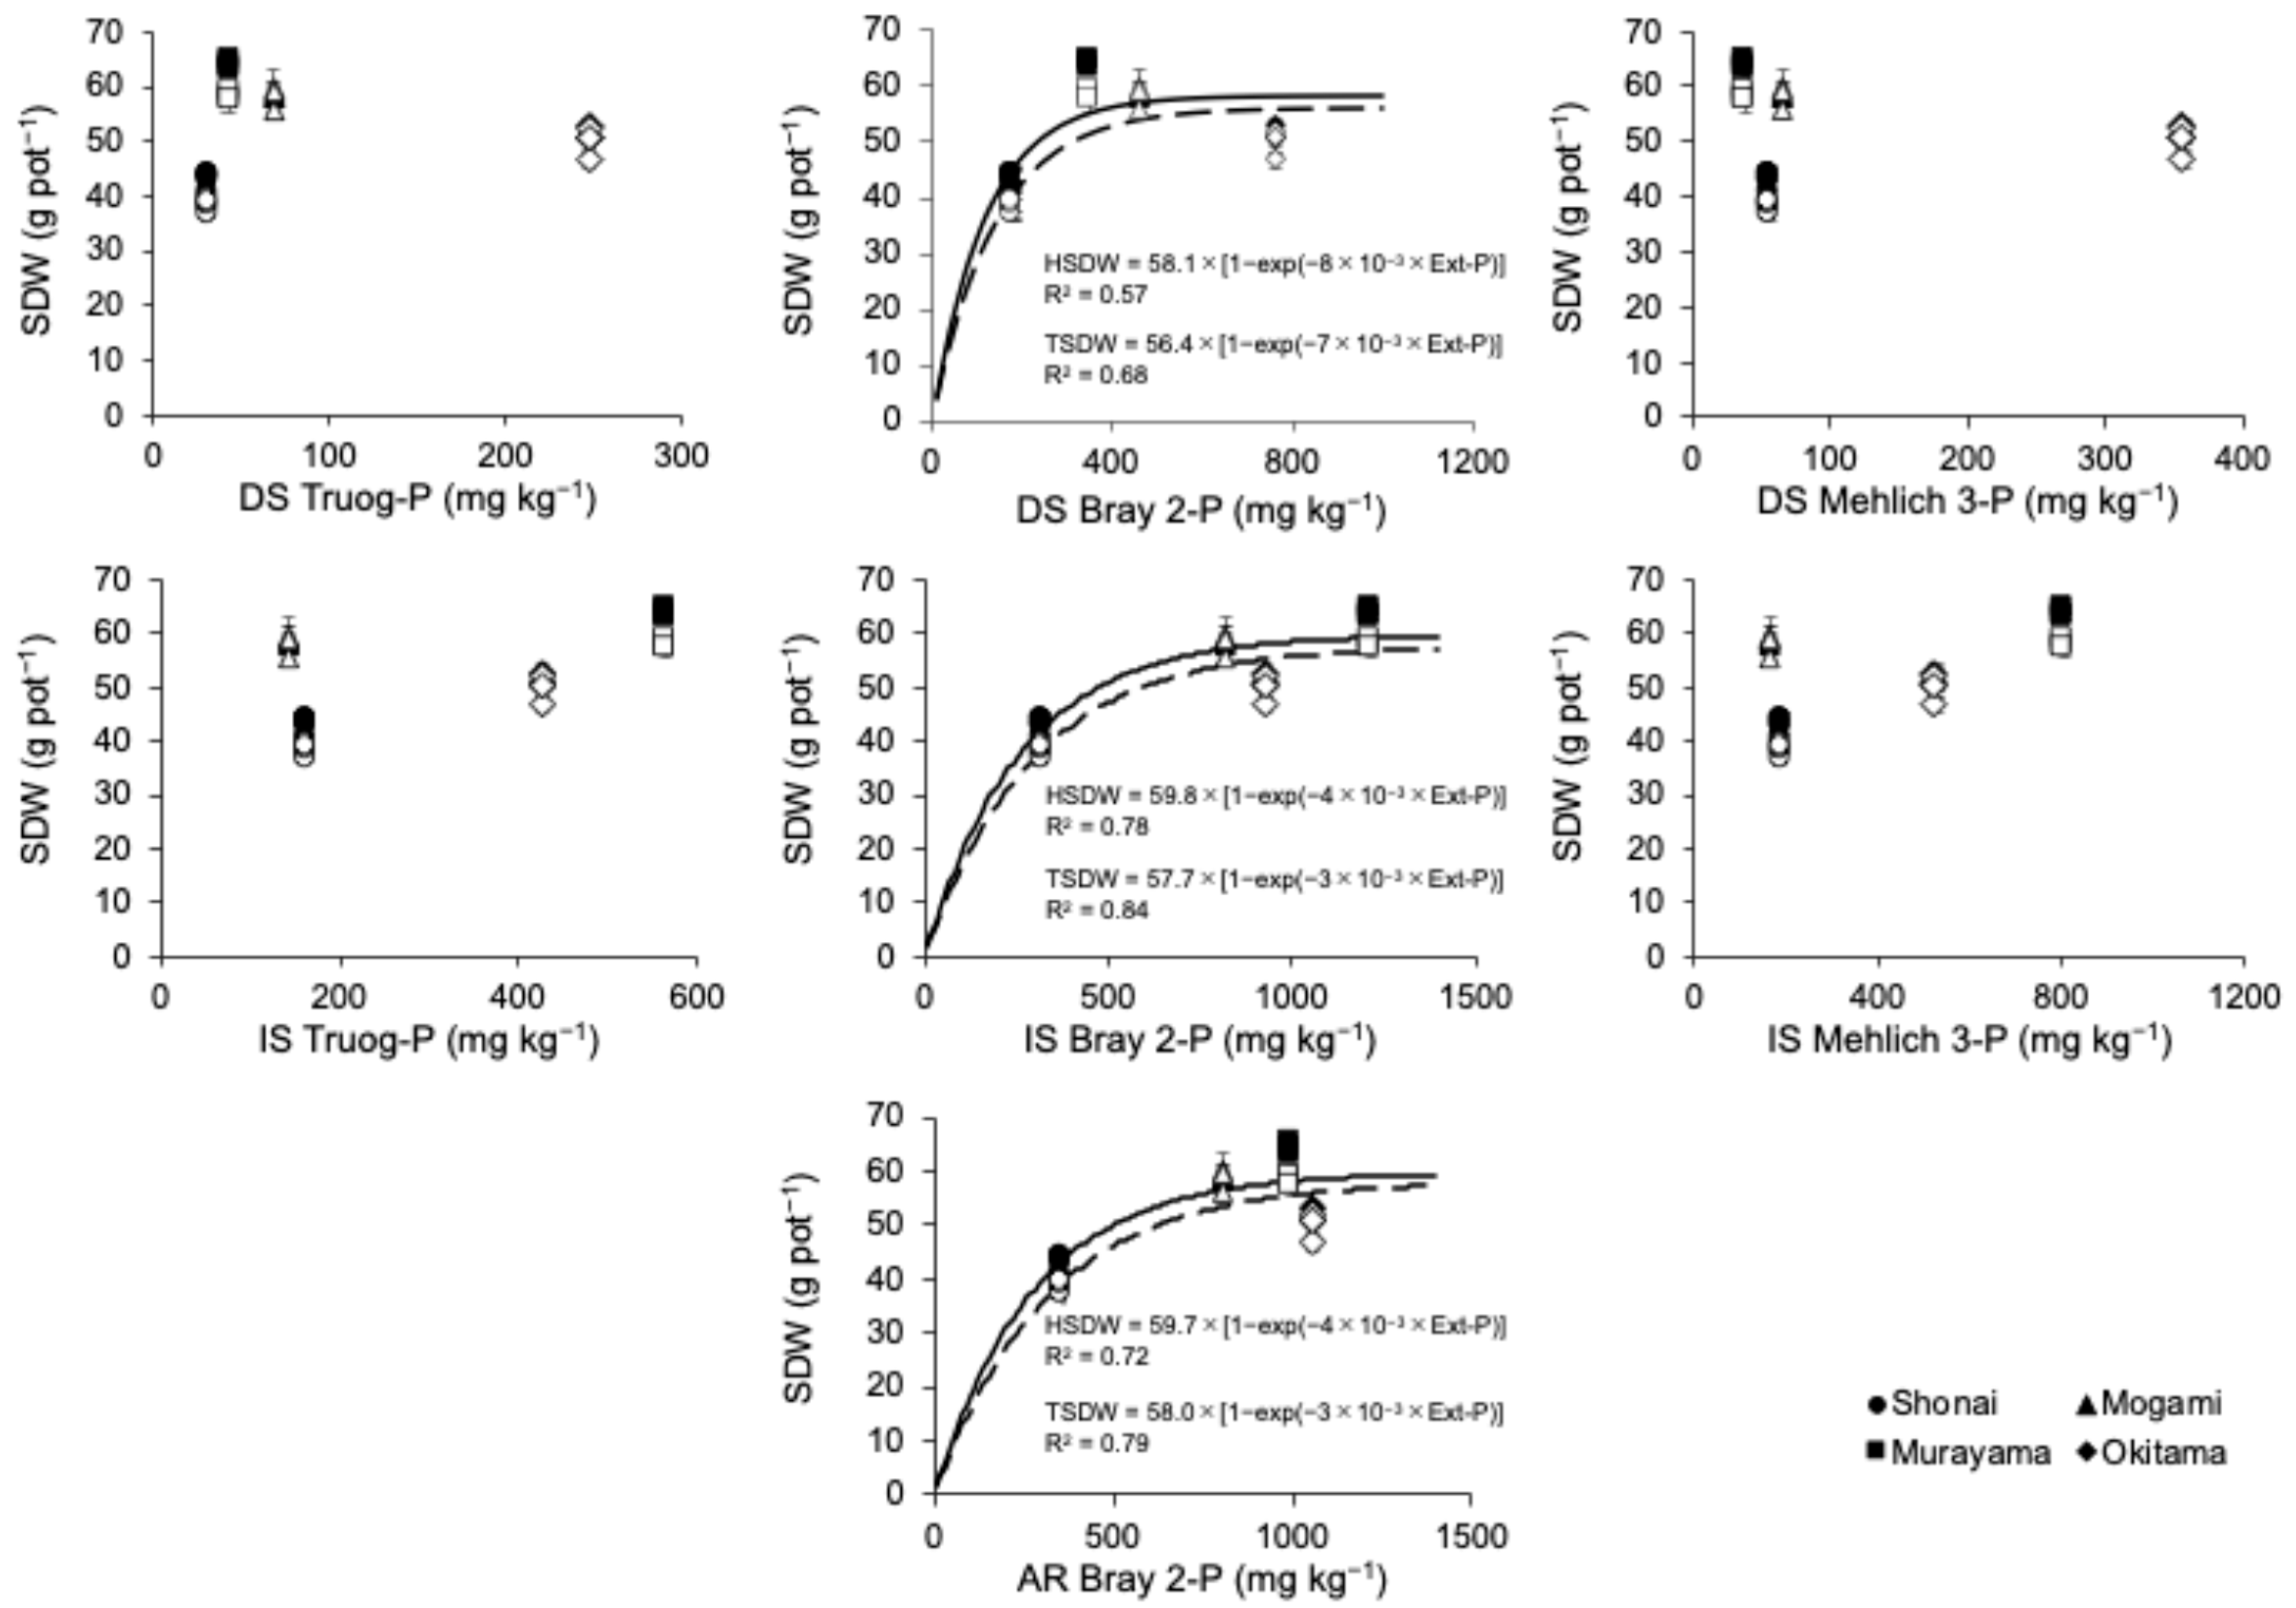
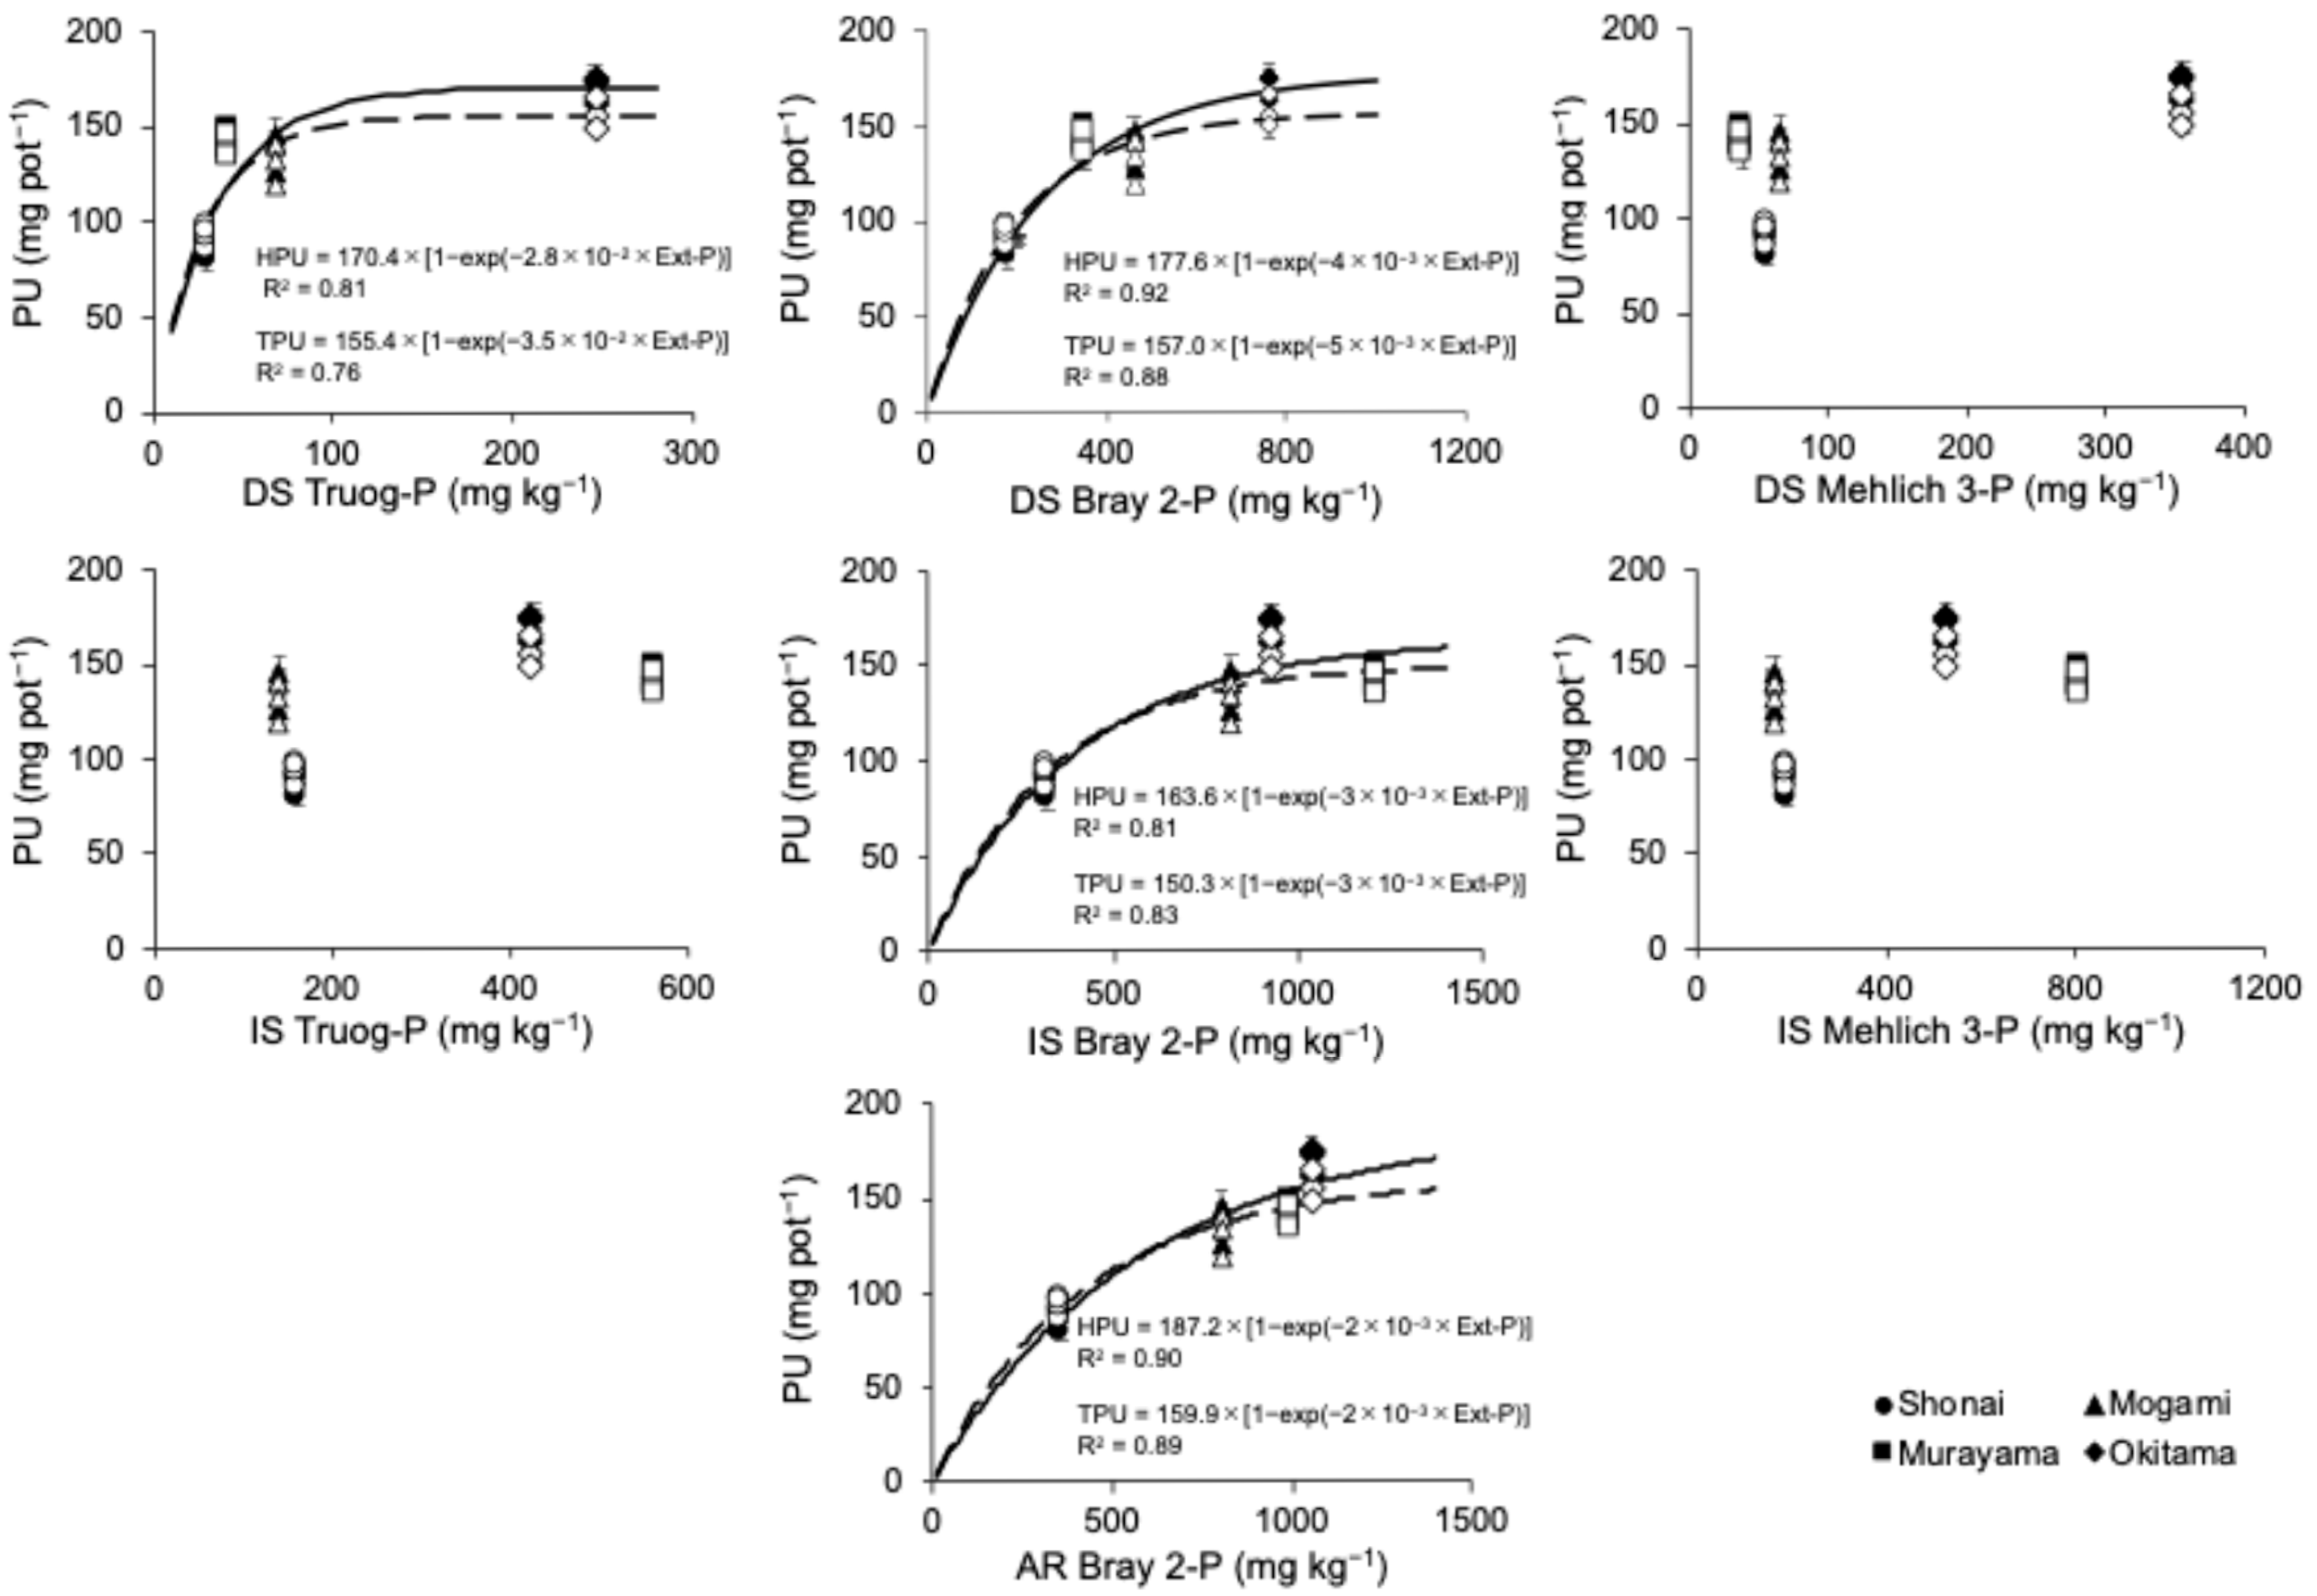
Exponential saturation models were used to assess the relationship between available P and both SDW and PU (Figure 4 and Figure 5), using soil P concentrations measured before P fertilization (as shown in Figure 1). No marked differences were observed between the two rice varieties; however, Tsuyahime appeared to reach a growth plateau at lower P concentrations, suggesting more efficient P utilization.
In DS Truog, IS Truog, DS Mehlich 3, and IS Mehlich 3, model fits were poor, with low R2 values making curve estimation infeasible for SDW. In air-dried soils, only DS Bray 2 produced model fits with marginal usability. Similar limitations were observed for PU, particularly in DS Mehlich 3, IS Mehlich 3, and IS Truog. Both IS Bray 2 and AR Bray 2 exhibited high R2 values in their relationships with SDW and PU, outperforming the other methods. These results indicate that IS Bray 2 and AR Bray 2 are better suited for evaluating plant-available P under reduced soil conditions.

4. Discussion

4.1. Correlation of Extraction Methods for Available P

All three extraction methods (Truog, Bray 2, and Mehlich 3) showed significantly higher available P concentrations in incubated soils compared to air-dried soils (Figure 1). This increase was particularly pronounced for the Truog and Mehlich 3 methods. The Truog method primarily extracts Ca-bound P, while Mehlich 3 is known to extract both Ca-P and Al-P [11,12,35]. Bray 2 targets Ca-P, Al-P, and partially Fe-P [9]. Under reducing conditions, Fe-P is solubilized, whereas Ca- and Al-bound P tends to remain insoluble [36,37]. Therefore, the marked increase in Truog- and Mehlich-3-extractable P under incubation suggests that these methods also accessed solubilized Fe-P under reducing conditions. In contrast, Bray 2 may have been less affected by redox changes due to its inherent ability to extract some Fe-P even in air-dried soils.
The AR Bray 2 method is a simplified technique to simulate reduced soil conditions using ascorbic acid [36]. AR Bray 2 has demonstrated strong agreement with long-term incubation results [38]. In our study, AR Bray 2 was highly correlated with IS Bray 2 (r = 0.92; Figure 3), confirming its potential for estimating P availability under reduced conditions using air-dried samples. Previous studies also suggest that available P measured in moist soils correlates more strongly with plant uptake than P extracted from air-dried samples [39].
Sequential P fractionation revealed clear differences among soils (Figure 2). H2O-P accounted for less than 0.2% of total P, consistent with previous findings [12,40,41]. NaHCO3-P represented approximately 10% of total P across all soils, aligning with earlier reports [19,20,21]. Notably, NaOH-P, associated with Fe oxides, was highest in Murayama soil (30%) and lowest in Mogami soil (16%). The strong correlation between NaOH-P and IS Bray 2 (r = 0.98) indicates that IS Bray 2 effectively captures moderately labile Fe-P fractions under reducing conditions, indicating greater sensitivity to P fractions that are mobilized under such conditions. NaOH-P has previously been identified as a key source of plant-available P in paddy soils [42]. A single extraction with alkaline reagents such as NaHCO3 or NaOH can thus serve as a useful indicator of P availability in submerged rice fields [43].
The solubility of P in flooded soils is strongly influenced by the presence of active Al and Fe [44,45]. Although Mogami soil contained high total P, available P was low, and the extraction efficiency of Truog and Mehlich 3 was poor (Table 1; Figure 1), suggesting that the presence of active Al may have suppressed P solubility. Under reducing conditions, Al- and Fe-associated P becomes more available, but this availability is also influenced by Fe crystallinity. A moderate positive correlation was also observed between IS Bray 2 and Fep (r = 0.48), suggesting possible interactions with organic Fe complexes (Figure 3). The ratio (Alo + Feo)/2 is known to be related to soil P retention capacity, and ammonium oxalate-extractable Al and Fe are considered major determinants of P forms in paddy soils [37,46,47]. Organic matter can form stable complexes with Fe and Al, inhibiting their crystallization and enhancing P sorption due to increased non-crystalline Al and Fe levels [48,49]. The high levels of active Al in Mogami soil may have promoted the formation of such amorphous Al complexes, limiting P desorption. The relative contributions of Al and Fe to P retention vary with soil type—Fe tends to dominate in Gley and Gray Lowland soils, while Al is often more influential in Andosols [36]. These differences in mineralogy significantly affect P extractability and availability [30,47,48]. Therefore, assessing P availability in paddy soils requires consideration of soil-specific properties, particularly active Al and Fe levels, and their interactions with extraction methods. Our findings highlight the utility of NaHCO3-P and NaOH-P as indicators of available P in Fe- and Al-rich paddy soils under reduced conditions.

4.2. Effects of P Treatment on Rice Growth

P fertilization had no significant effect on SDW, P concentration, or PU in either Haenuki or Tsuyahime (Table 3). P application is typically associated with increased biomass production, particularly under P-deficient conditions. However, when soil P is sufficient, the effects of additional P are negligible. Previous studies have shown that nitrogen has a stronger influence on rice phenology than P or K and that rice generally has a low sensitivity to P once a threshold level is reached [50].
In our study, all four soils appeared to contain sufficient P, and no consistent increase in tissue P concentration was observed with increasing P application. This plateau effect is consistent with a proposed feedback mechanism by which rice maintains stable internal P concentrations once they reach levels sufficient for physiological functioning [51]. When available P exceeds the crop requirement, further P input does not translate into increased growth or uptake [52]. Among the four soils, Shonai exhibited lower SDW compared to the others, although it is unclear whether this was due to P availability or other soil factors. Regression analysis of available P versus SDW and PU showed that Tsuyahime achieved maximum PU at lower P concentrations than Haenuki, suggesting greater P uptake efficiency.
Previous studies have demonstrated that SDW and PU are often related to available P through saturation-type functions [53,54,55,56]. In our analysis, IS Bray 2 and AR Bray 2 showed the strongest correlations with both SDW and PU (Figure 4 and Figure 5), underscoring the importance of evaluating P availability under reduced conditions. Reduced soils provide a more accurate reflection of P availability for rice compared to air-dried soils [15]. In particular, IS Bray 2, which targets moderately labile Fe- and Al-P, showed high predictive power for rice growth, consistent with previous findings [53]. Although incubated soil P analysis is effective, its four-week incubation period limits its practical application. As a simpler alternative, AR Bray 2 has shown strong correlations with both rice growth and with incubated P values in this study. However, further validation across diverse soil types is needed to establish AR Bray 2 as a reliable diagnostic method.
Truog and Mehlich 3 results showed considerable variability between air-dried and incubated soils. Truog and Mehlich 3 methods, although widely used, showed greater variability and lower reliability, especially under oxidized conditions in this study. These findings emphasize the importance of using extraction methods that reflect reduced conditions in paddy soils to better assess bioavailable P and its contribution to rice growth. Interestingly, Truog had higher R2 values for PU in air-dried soils than in incubated soils (Figure 4 and Figure 5). Many Japanese studies have explored the relationship between Truog-P and rice performance. For example, Truog-P levels at the maximum tillering stage were correlated with plant P status [55]. Mehlich 3, widely used globally, has been reported as accurate and reproducible when standardized [57]. The distinct characteristics of P extracted by different methods further emphasize the need for method selection based on soil properties.

5. Conclusions

This study highlights the importance of considering reduced conditions and soil-specific factors when evaluating available P in paddy soils. We demonstrated that different extraction methods—including incubation, chemical extraction (Truog, Bray 2, Mehlich 3, AR Bray 2), and sequential fractionation—each provide distinct insights into the forms of available P. Among the P fractions analyzed, NaHCO3-P and NaOH-P were particularly important for assessing P availability under reduced conditions, where Fe- and Al-bound P are more readily mobilized. The strong variability observed among the four soil types indicates that no single extraction method can universally assess P availability. Our findings underscore the necessity of a multifactorial approach that integrates both chemical extraction data and soil-specific properties such as active Al and Fe content. These insights can support the refinement of soil diagnostic tools and inform site-specific P management strategies in rice production systems. However, further research is needed to validate these findings across a broader range of soil types and environmental conditions. By accounting for the complex interplay between redox conditions, mineralogy, and P dynamics, future studies can contribute to more efficient P use and promote sustainable rice cultivation in diverse agroecosystems.

Author Contributions

Conceptualization, R.T.; methodology, R.T.; software, H.N. and R.T.; validation, S.T., H.N. and R.T.; formal analysis, S.T. and H.N.; investigation, S.T. and H.N.; resources, H.N.; data curation, S.T. and H.N.; writing—original draft preparation, S.T. and H.N.; writing—review and editing, H.N. and R.T.; visualization, H.N.; supervision, R.T.; project administration, R.T.; funding acquisition, H.N. All authors have read and agreed to the published version of the manuscript.

Funding

This work was supported by JSPS KAKENHI Grant Number 20K22575.

Institutional Review Board Statement

Not applicable.

Data Availability Statement

Dataset available on request from the authors.

Acknowledgments

We are especially grateful to the farmers who kindly provided soil samples for this research. We also sincerely acknowledge the members of the Laboratory of Crop Science, Faculty of Agriculture, Yamagata University, for their invaluable support in this study.

Conflicts of Interest

The authors declare no conflicts of interest.

References

  1. Grant, C.A.; Flaten, D.N.; Tomasiewicz, D.J.; Sheppard, S.C. The Importance of Early Season Phosphorus Nutrition. Can. J. Plant Sci. 2001, 81, 211–224. [Google Scholar] [CrossRef]
  2. Shiga, H. Efficient Level of Phosphorus Fertility in Paddy Soils. Agric. Food Sci. 1981, 15, 227–241. [Google Scholar]
  3. Nishio, M. Recent Trend of Chemical Fertilizer Consumption in Japan. Jpn. J. Soil Sci. Plant Nutr. 2002, 73, 219–225. [Google Scholar]
  4. Mishima, S.-i.; Itahashi, S.; Kimura, R.; Inoue, T. Trends of Phosphate Fertilizer Demand and Phosphate Balance in Farmland Soils in Japan. Soil Sci. Plant Nutr. 2003, 49, 39–45. [Google Scholar] [CrossRef]
  5. Obara, H.; Nakai, M. Available Phosphate of Arable Lands in Japan. Changes of Soil Characteristics in Japanese Arable Lands (II). Jpn. J. Soil Sci. Plant Nutr. 2004, 75, 59–67. [Google Scholar]
  6. Goto, E.; Shu, M.; Michiko, N.; Osamu, I. The Present Condition of Chemical Properties of Paddy Soils in Hokkaido. Jpn. J. Soil Sci. Plant Nutr. 2003, 74, 475–483. [Google Scholar]
  7. Tohkairin, S. Fractionation and Availabilization of Phosphorus Accumulated in Paddy Soils with Application of Phosphatic Fertilizer in YAMAGATA Prefecture. Spec. Bull. Yamagata Prefect. Agric. Exp. Stn. 1992, 21, 1–48. [Google Scholar]
  8. Truog, E. The Determination of the Readily Available Phosphorus of Soils 1. Agron. J. 1930, 22, 874–882. [Google Scholar] [CrossRef]
  9. Bray, R.H.; Kurtz, L.T. Determination of Total, Organic, and Available Forms of Phosphorus in Soils. Soil Sci. 1945, 59, 39–45. [Google Scholar] [CrossRef]
  10. Mehlich, A. Mehlich 3 Soil Test Extractant: A Modification of Mehlich 2 Extractant. Commun. Soil Sci. Plant Anal. 1984, 15, 1409–1416. [Google Scholar] [CrossRef]
  11. Shahandeh, H.; Hons, F.M.; Provin, T.L.; Pitt, J.L.; Waskom, J.S. Factors Affecting Mehlich III Soil Test Methodology for Extractable P. Commun. Soil Sci. Plant Anal. 2017, 48, 423–438. [Google Scholar] [CrossRef]
  12. Wuenscher, R.; Unterfrauner, H.; Peticzka, R.; Zehetner, F. A Comparison of 14 Soil Phosphorus Extraction Methods Applied to 50 Agricultural Soils from Central Europe. Plant Soil Environ. 2015, 61, 86–96. [Google Scholar] [CrossRef]
  13. Reddy, K.R.; Patrick, W.H. A Method for Sectioning Saturated Soil Cores. Soil Sci. Soc. Am. J. 1976, 40, 611–612. [Google Scholar] [CrossRef]
  14. Upreti, K.; Joshi, S.R.; McGrath, J.; Jaisi, D.P. Factors Controlling Phosphorus Mobilization in a Coastal Plain Tributary to the Chesapeake Bay. Soil Sci. Soc. Am. J. 2015, 79, 826–837. [Google Scholar] [CrossRef]
  15. Uwasawa, M.; Uchida, Y. Soil Testing on Available Soil Phosphorus for Paddy Field in Cool Region of Japan. Bull. Tohoku Natl. Agric. Exp. Stn. 2011, 67, 77–95. [Google Scholar]
  16. Nanzyo, M.; Takahashi, T.; Shoji, S. Rapid Method to Determine Available Phosphorus Content of Paddy Soils under Reducing Conditions Using Ascorbic Acid. Jpn. J. Soil Sci. Plant Nutr. 1996, 67, 73–77. [Google Scholar] [CrossRef]
  17. Wang, Y.; Yuan, J.H.; Chen, H.; Zhao, X.; Wang, D.; Wang, S.Q.; Ding, S.M. Small-Scale Interaction of Iron and Phosphorus in Flooded Soils with Rice Growth. Sci. Total Environ. 2019, 669, 911–919. [Google Scholar] [CrossRef]
  18. Hedley, M.J.; Stewart, J.W.B.; Chauhan, B.S. Changes in Inorganic and Organic Soil Phosphorus Fractions Induced by Cultivation Practices and by Laboratory Incubations. Soil Sci. Soc. Am. J. 1982, 46, 970–976. [Google Scholar] [CrossRef]
  19. Kulhánek, M.; Balík, J.; Černý, J.; Vaněk, V. Evaluation of Phosphorus Mobility in Soil Using Different Extraction Methods. Plant Soil Environ. 2009, 55, 267–272. [Google Scholar] [CrossRef]
  20. van Rotterdam, A.M.D.; Bussink, D.W.; Temminghoff, E.J.M.; van Riemsdijk, W.H. Predicting the Potential of Soils to Supply Phosphorus by Integrating Soil Chemical Processes and Standard Soil Tests. Geoderma 2012, 189–190, 617–626. [Google Scholar] [CrossRef]
  21. Nawara, S.; Van Dael, T.; Merckx, R.; Amery, F.; Elsen, A.; Odeurs, W.; Vandendriessche, H.; Mcgrath, S.; Roisin, C.; Jouany, C.; et al. A Comparison of Soil Tests for Available Phosphorus in Long-Term Field Experiments in Europe. Eur. J. Soil Sci. 2017, 68, 873–885. [Google Scholar] [CrossRef]
  22. Nanzyo, M.; Kanno, H.; Obara, S. Effect of Reducing Conditions on P Sorption of Soils. Soil Sci. Plant Nutr. 2004, 50, 1023–1028. [Google Scholar] [CrossRef]
  23. Japan Meteorological Agency Database. Available online: http://www.data.jma.go.jp/obd/stats/etrn/index.php (accessed on 12 September 2024).
  24. Japan Soil Inventory, Soil Map. Available online: https://soil-inventory.rad.naro.go.jp/ (accessed on 12 September 2024).
  25. Corey, R.B. A Textbook of Soil Chemical Analysis; Chemical Publishing Company: Revere, MA, USA, 1973; Volume 37. [Google Scholar]
  26. Nishikawa, T.; Li, K.; Inamura, T.; Nishikawa, T.; Li, K.; Nishikawa, T. Nitrogen Uptake by the Rice Plant and Changes in the Soil Chemical Properties in the Paddy Rice Field during Yearly Application of Anaerobically-Digested Manure for Seven Years. Plant Prod. Sci. 2014, 17, 237–244. [Google Scholar] [CrossRef]
  27. Parfitt, R.L.; Childs, C.W. Estimation of Forms of Fe and Al: A Review, and Analysis of Contrasting Soils by Dissolution and Moessbauer Methods. Aust. J. Soil Res. 1988, 26, 121–144. [Google Scholar] [CrossRef]
  28. Gee, G.W.; Or, D. Particle-Size Analysis. In Methods of Soil Analysis, Part 4: Physical Methods; John Wiley and Sons: Hoboken, NJ, USA, 2018; pp. 255–293. ISBN 9780891188933. [Google Scholar]
  29. Ishioka, G. Measurement of Nitrogen Release from Soil and Organic Materials under Flooded Conditions Using Aluminum-Deposited Bags. Jpn. J. Soil Sci. Plant Nutr. 2023, 94, 115–120. [Google Scholar]
  30. Frossard, E.; Morel, J.L.; Fardeau, J.C.; Brossard, M. Soil Isotopically Exchangeable Phosphorus: A Comparison between E and L Values. Soil Sci. Soc. Am. J. 1994, 58, 846–851. [Google Scholar] [CrossRef]
  31. Chuba, M. Breeding of a Rice Cultivar ‘Tsuyahime’ with Wide Adaptability and Superior Eating Quality, Using a New Appearance Evaluation Method of Cooked Rice. Breed. Res. 2022, 24, 52–58. [Google Scholar] [CrossRef]
  32. Fertilization Standards in Yamagata Prefecture. Available online: https://agrin.jp/documents/859/image1_file0119051020334431045.pdf (accessed on 12 September 2024).
  33. Kashiwagura, M.; Sato, Y.; Uno, T.; Tajima, R.; Ito, T.; Saito, M. Microscale Digestion of Plant Samples with Sulicacid and Oxygen Peroxide. Bull. Integr. Field Sci. Cent. 2015, 30, 1–2. [Google Scholar] [CrossRef]
  34. R Core Team. R Core Team 2023 R: A Language and Environment for Statistical Computing. R Foundation for Statistical Computing: Vienna, Austria, 2023. Available online: https://www.R-project.org/ (accessed on 5 December 2023).
  35. Ando, K.; Yamaguchi, N.; Nakamura, Y.; Kasuya, M.; Taki, K. Speciation of Phosphorus Accumulated in Fertilized Cropland of Aichi Prefecture in Japan with Different Soil Properties by Sequential Chemical Extraction and P K-Edge XANES. Soil Sci. Plant Nutr. 2021, 67, 150–161. [Google Scholar] [CrossRef]
  36. Nanzyo, M. Progress and Prospect of the Research on Paddy Soil Management under Various Rice Growing System. 1. Progress in Nutrient Behavior and Management Research on Paddy Soil (2) Phosphorus. Jpn. J. Soil Sci. Plant Nutr. 1996, 67, 317–321. [Google Scholar]
  37. Yan, X.; Wei, Z.; Wang, D.; Zhang, G.; Wang, J. Phosphorus Status and Its Sorption-Associated Soil Properties in a Paddy Soil as Affected by Organic Amendments. J. Soils Sediments 2015, 15, 1882–1888. [Google Scholar] [CrossRef]
  38. Nishida, M.; Yoshida, K.; Takahashi, T. Estimation of Changes in Available Soil Phosphate under Submerged Conditions Associated with Temperature during the Tillering Stage of Rice Plant in the Cool Climate Region of Japan. Commun. Soil Sci. Plant Anal. 2018, 49, 1695–1706. [Google Scholar] [CrossRef]
  39. Shiga, H. Effect of Phosphorus Fertility of Soils and Phosphate Application on Rice Culture in Cool Region. Part 1 Measurement of Phosphorus Supplying Ability of Paddy Soils. Res. Bull. Hokkaido Natl. Agric. Exp. Stn. 1973, 105, 31–49. [Google Scholar]
  40. Golterman, H.L. Fractionation of Sediment Phosphate with Chelating Compounds: A Simplification, and Comparison with Other Methods. Hydrobiologia 1996, 335, 87–95. [Google Scholar] [CrossRef]
  41. Marschner, H. Functions of Mineral Nutrients: Micronutrients. In Marschner’s Mineral Nutrition of Higher Plants; Academic Press: Cambridge, MA, USA, 2002; pp. 313–404. [Google Scholar]
  42. Yan, X.; Wei, Z.; Hong, Q.; Lu, Z.; Wu, J. Phosphorus Fractions and Sorption Characteristics in a Subtropical Paddy Soil as Influenced by Fertilizer Sources. Geoderma 2017, 295, 80–85. [Google Scholar] [CrossRef]
  43. Zhang, Q.; Wang, G.H.; Feng, Y.K.; Sun, Q.Z.; Witt, C.; Dobermann, A. Changes in Soil Phosphorus Fractions in a Calcareous Paddy Soil under Intensive Rice Cropping. Plant Soil 2006, 288, 141–154. [Google Scholar] [CrossRef]
  44. Nishigaki, T.; Sugihara, S.; Kobayashi, K.; Hashimoto, Y.; Kilasara, M.; Tanaka, H.; Watanabe, T.; Funakawa, S. Fractionation of Phosphorus in Soils with Different Geological and Soil Physicochemical Properties in Southern Tanzania. Soil Sci. Plant Nutr. 2018, 64, 291–299. [Google Scholar] [CrossRef]
  45. Darke, A.K.; Walbridge, M.R. Al and Fe Biogeochemistry in a Floodplain Forest: Implications for P Retention. Biogeochemistry 2000, 51, 1–32. [Google Scholar] [CrossRef]
  46. Nanzyo, M.; Yamasaki, S. Phosphorus-Bearing Mineral in Fresh, Andesite and Rhyolite Tephras in Northern Part of Japan. Phosphorus Res. Bull. 1998, 8, 95–100. [Google Scholar] [CrossRef]
  47. Yan, X.; Wang, D.; Zhang, H.; Zhang, G.; Wei, Z. Organic Amendments Affect Phosphorus Sorption Characteristics in a Paddy Soil. Agric. Ecosyst. Environ. 2013, 175, 47–53. [Google Scholar] [CrossRef]
  48. Borggaard, O.K.; Jdrgensen, S.S.; Moberg, J.P.; Raben-lange, B. Influence of Organic Matter on Phosphate Adsorption by Aluminium and Iron Oxides in Sandy Soils. J. Soil Sci. 1990, 41, 443–449. [Google Scholar] [CrossRef]
  49. Kang, J.; Hesterberg, D.; Osmond, D.L. Soil Organic Matter Effects on Phosphorus Sorption: A Path Analysis. Soil Sci. Soc. Am. J. 2009, 73, 360–366. [Google Scholar] [CrossRef]
  50. Ye, T.; Li, Y.; Zhang, J.; Hou, W.; Zhou, W.; Lu, J.; Xing, Y.; Li, X. Nitrogen, Phosphorus, and Potassium Fertilization Affects the Flowering Time of Rice (Oryza Sativa L.). Glob. Ecol. Conserv. 2019, 20, e00753. [Google Scholar] [CrossRef]
  51. Guo, H.S.; Xie, Q.; Fei, J.F.; Chua, N.H. MicroRNA Directs MRNA Cleavage of the Transcription Factor NAC1 to Downregulate Auxin Signals for Arabidopsis Lateral Root Development. Plant Cell 2005, 17, 1376–1386. [Google Scholar] [CrossRef]
  52. Panten, K.; Godlinski, F.; Schroetter, S.; Hofmeier, M. Variability of P Uptake by Plants. In Phosphorus in Agriculture: 100% Zero; Springer: Dordrecht, The Netherlands, 2016; pp. 155–178. ISBN 9789401776127. [Google Scholar]
  53. Shiga, H.; Yamaguchi, Y.; Awazaki, H. Effect of Phosphorus Fertility of Soil and Phosphate Application on Rice Culture in Cool Region. Part 2 Response of Rice Plant Growth to the Amounts of Extractable Phosphorus in Flooded Soils under Field Conditions. Res. Bull. Hokkaido Natl. Agric. Exp. Stn. 1976, 113, 95–107. [Google Scholar]
  54. Ito, T.; Kikawa, N.; Saigusa, M. Phosphorus Sorption and Bioavailability in Allophanic and Non AllophanicAndosol. Pedologist 2011, 55, 84–88. [Google Scholar]
  55. Tanikawa, N. Effect of Available Phosphorus or Phosphorus Fractions on Paddy Rice Growth in Tillering Stage. Tohoku Agric. Res. 2016, 69, 11–12. [Google Scholar]
  56. Nasukawa, H.; Tajima, R.; Muacha, B.I.J.; Filomena Pereira, M.C.; Naruo, K.; Nakamura, S.; Fukuda, M.; Ito, T.; Homma, K. Analyzing Soil-Available Phosphorus by the Mehlich-3 Extraction Method to Recommend a Phosphorus Fertilizer Application Rate for Maize Production in Northern Mozambique. Plant Prod. Sci. 2019, 22, 211–214. [Google Scholar] [CrossRef]
  57. Zhang, H.; Kariuki, S.; Schroder, J.L.; Payton, M.E.; Focht, C. Interlaboratory Validation of the Mehlich 3 Method for Extraction of Plant-Available Phosphorus. J. AOAC Int. 2009, 92, 91–102. [Google Scholar] [CrossRef]
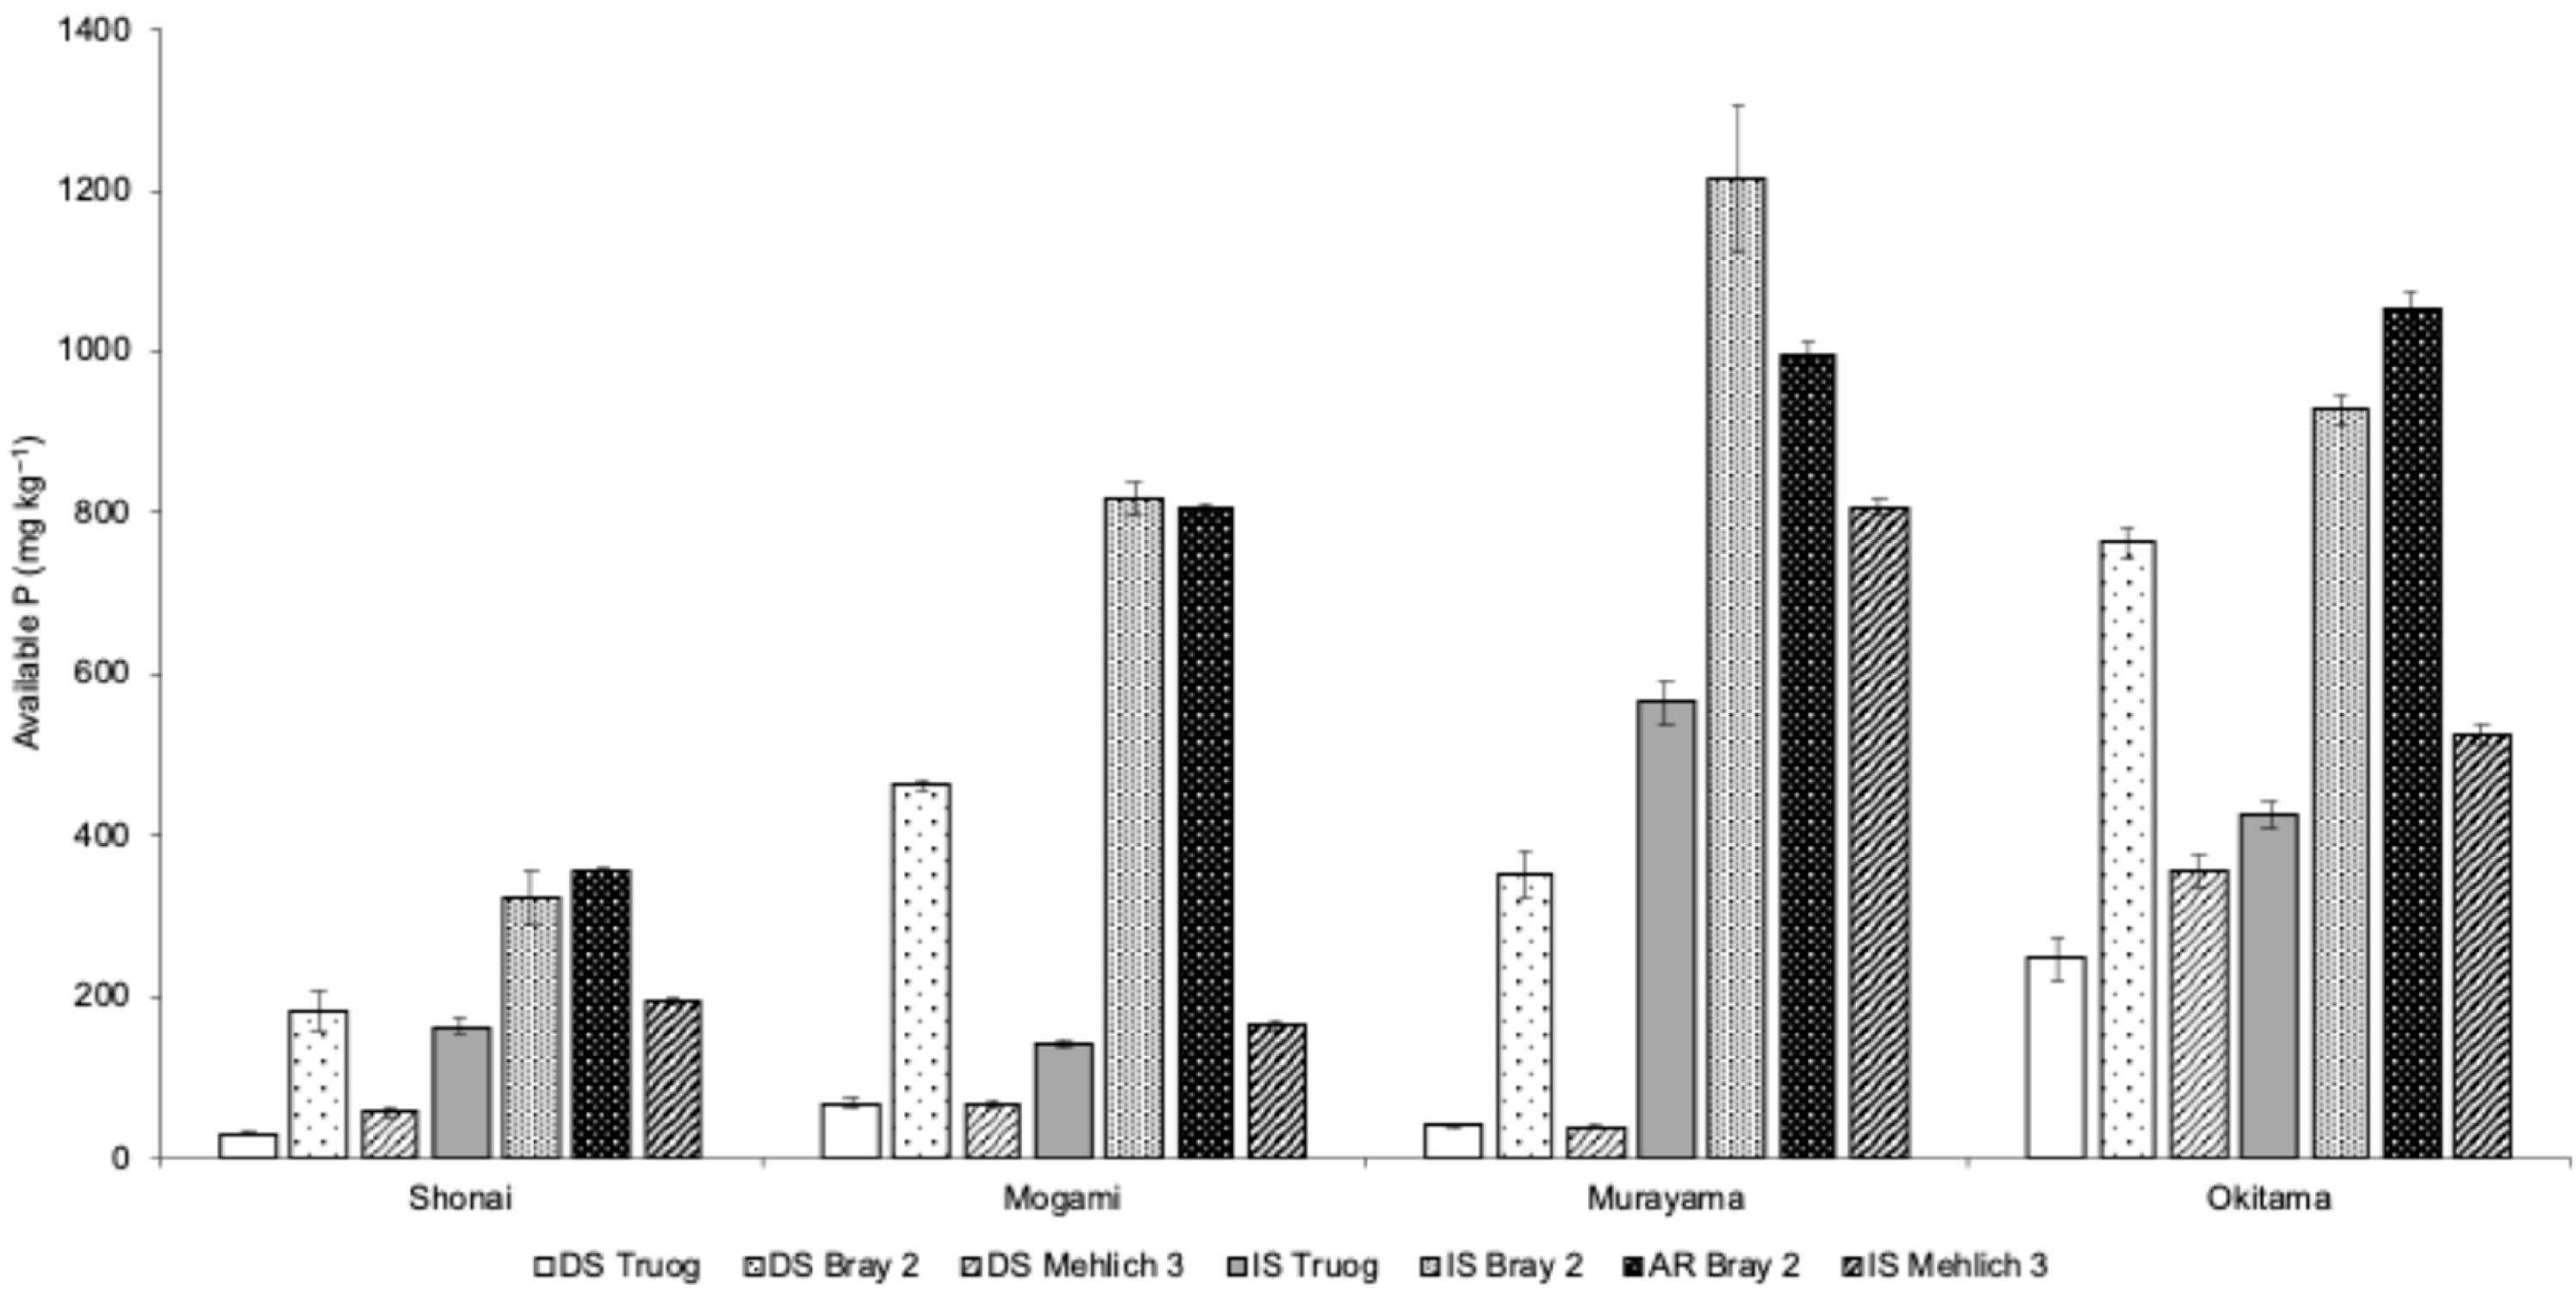
Figure 1. Comparison of available phosphorus concentrations measured by the Truog, Bray 2, and Mehlich 3 methods under different soil conditions. Truog, Bray 2, and Mehlich 3 were applied to air-dried soil (DS), incubated soil (IS). AR Bray 2 measured in air-dried soil reduced with ascorbic acid prior to extraction. Results are shown for four regions: Shonai, Mogami, Murayama, and Okitama. Error bars represent standard error (n = 3).
Agriculture 15 01453 g001
Figure 2. Results of sequential phosphorus (P) extraction for soils from Shonai, Mogami, Murayama, and Okitama. Total P concentrations (mg kg−1) are divided into five fractions: H2O-P, NaHCO3-P, NaOH-P, HCl-P, and Residual-P. Error bars represent standard error (n = 3).
Agriculture 15 01453 g002
Figure 3. Heatmap showing Pearson correlation coefficients among phosphorus (P) extraction methods, sequentially extracted P fractions, and active aluminum (Al) and iron (Fe) contents in soil samples. Extraction methods include Truog, Bray 2, Mehlich 3 (measured in DS: air-dried soil and IS: incubated soil), and AR Bray 2 (Bray 2 following ascorbic acid reduction). Sequentially extracted P fractions include H2O-P, NaHCO3-P, NaOH-P, HCl-P, and total P. Soil chemical properties include Alo: oxalate-extractable Al; Alp: pyrophosphate-extractable Al; Ald: dithionite–citrate–bicarbonate-extractable Al; Feo: oxalate-extractable Fe; Fep: pyrophosphate-extractable Fe; and Fed: dithionite–citrate–bicarbonate-extractable Fe. Shading intensity corresponds to the strength of the correlation. Asterisks indicate significance levels: * p < 0.05, ** p < 0.01, *** p < 0.001.
Agriculture 15 01453 g003
Figure 4. Relationship between available phosphorus and shoot dry weight (SDW) in Haenuki and Tsuyahime. Black-filled symbols represent Haenuki, and white-filled symbols indicate Tsuyahime. Solid and dashed lines represent regression curves for Haenuki and Tsuyahime, respectively. HSDW and TSDW represent the shoot dry weight of Haenuki and Tsuyahime, respectively. Regression analysis was conducted using exponential saturation models with SDW as the response variable. Points represent soil-specific data (Shonai, Mogami, Murayama, Okitama), while regression curves represent overall fitted trends. Error bars indicate standard error (n = 3).
Agriculture 15 01453 g004
Figure 5. Relationship between available phosphorus and phosphorus uptake (PU) in Haenuki and Tsuyahime. Black-filled symbols represent Haenuki, and white-filled symbols indicate Tsuyahime. Solid and dashed lines represent regression curves for Haenuki and Tsuyahime, respectively. HPU and TPU represent the phosphorus uptake of Haenuki and Tsuyahime, respectively. Regression analysis was conducted using exponential saturation models with PU as the response variable. Data points represent different soil types, and regression curves represent overall trends. Error bars indicate standard error (n = 3).
Agriculture 15 01453 g005
Table 1. Physical and chemical properties of soils collected from four regions in Yamagata Prefecture.
LocationpHECTotalCECExchangeable CationAvailable NParticle Size Distribution
CNCaMgKClaySiltSand
(μS cm−1)(%)(cmolc kg−1)(cmolc kg−1)(mg kg−1)(%)
Shonai5.9126.42.00.112.37.41.60.650.37.618.873.6
Mogami5.835.27.20.527.75.91.20.679.626.048.525.6
Murayama5.628.04.20.324.58.72.20.995.326.146.127.7
Okitama5.725.53.00.315.09.11.90.477.513.029.957.1
Table 2. Contents of active aluminum (Alo, Alp, Ald) and active iron (Feo, Fep, Fed) in soils from four regions in Yamagata Prefecture.
LocationActive AlActive Fe
AloAlpAldFeoFepFed
(g kg−1)(g kg−1)
Shonai2.62±0.060.93±0.022.56±0.027.07±0.092.88±0.0113.38±0.07
Mogami17.99±0.1916.15±0.2114.18±0.0711.04±0.039.74±0.0319.45±0.05
Murayama3.58±0.051.81±0.263.24±0.0911.13±0.038.04±0.1717.99±0.19
Okitama2.45±0.021.46±0.032.68±0.043.19±0.022.43±0.019.35±0.18
Alo: oxalate-extractable Al; Alp: pyrophosphate-extractable Al; Ald: dithionite–citrate-extractable Al; Feo: oxalate-extractable Fe; Fep: pyrophosphate-extractable Fe; Fed: dithionite–citrate-extractable Fe. Values are means ± standard error (n = 3).
Table 3. Shoot dry weight (SDW), phosphorus concentration (P concentration), and P uptake (PU) of Haenuki and Tsuyahime at the heading stage.
VarietyLocationTreatmentSDWP ConcentrationPU
(g pot−1)(%)(mg pot−1)
HaenukiShonaiP040.4±2.70.20±0.00480.5±2.7
P1/243.2±1.90.21±0.01092.1±1.9
P144.1±1.40.20±0.00588.5±1.4
P4/344.1±1.10.21±0.00491.7±1.1
P242.7±0.10.21±0.01190.2±0.1
MogamiP058.2±2.90.24±0.011141.3±2.9
P1/258.3±1.50.25±0.008146.7±1.5
P158.8±2.20.22±0.007126.2±2.2
MurayamaP062.9±0.70.22±0.004139.4±0.7
P1/264.9±1.50.23±0.007149.7±1.5
P163.9±1.20.21±0.003137.7±1.2
OkitamaP050.6±2.50.34±0.020175.2±2.5
P1/250.7±1.20.34±0.003174.1±1.2
P153.0±0.60.31±0.020162.3±0.6
TsuyahimeShonaiP038.0±1.20.26±0.01197.0±2.0
P1/239.2±0.60.25±0.01298.2±4.3
P136.7±1.50.23±0.00385.9±4.4
P4/338.5±1.00.24±0.00893.0±5.4
P239.0±0.40.25±0.00396.0±2.1
MogamiP055.8±1.60.21±0.002119.5±4.5
P1/259.8±3.50.24±0.018141.0±1.9
P159.2±1.10.23±0.003133.7±4.2
MurayamaP058.2±1.40.24±0.003137.8±4.7
P1/259.0±2.00.25±0.010145.9±1.9
P157.3±1.80.23±0.008134.4±7.8
OkitamaP052.2±2.00.30±0.006155.3±3.0
P1/246.7±1.60.32±0.005149.7±5.7
P150.6±1.20.33±0.016165.6±4.7
Variety******ns
Soil*********
Treatmentns*ns
Variety × Soil*******
Variety × Treatmentnsnsns
Soil × Treatmentnsnsns
Variety × Soil × Treatmentnsnsns
Values are presented as means ± standard errors (n = 3). No significant effects of P fertilization were observed on SDW, P concentration, or PU. ns: not significant; * p < 0.05; ** p < 0.01; *** p < 0.001.
Disclaimer/Publisher’s Note: The statements, opinions and data contained in all publications are solely those of the individual author(s) and contributor(s) and not of MDPI and/or the editor(s). MDPI and/or the editor(s) disclaim responsibility for any injury to people or property resulting from any ideas, methods, instructions or products referred to in the content.