Abstract
Nitrogen (N) fertilizer is essential for agricultural production as it is the main nutrient driving crop growth. However, in China, only one-third of applied N fertilizer is effectively absorbed by crops, while the rest leads to significant environmental impacts. In this study, we introduced a nitrogen threshold boundary (NTB) approach to establish different thresholds for N use efficiency (NUE) and N surplus without affecting crop yield. We also developed an integrated assessment framework to systematically evaluate the potential for improving N utilization and reducing environmental impacts in the production of grain crops (rice, wheat, maize, and soybeans) and cash crops (tea, fruits, and vegetables) at the county level in Fujian Province. Three N management strategies were evaluated: a scenario with reduced N surplus (S1), a scenario with increased NUE (S2), and a combined scenario that simultaneously reduces N surplus and increases NUE (S3). The predictions indicate that, under the aforementioned scenarios, there will be a decrease of 66%, 58%, and 71% in N application without affecting crop yields, respectively. Correspondingly, N surplus will decrease by 65%, 56%, and 67%, while greenhouse gas (GHG) emissions will decrease by 54%, 48%, and 57%. In addition, NUE will increase by 23%, 17% and 25%, respectively. It is notable that scenario S3 demonstrated the greatest potential for improvement. For cash crops, N application will decrease by 65–78%, NUE will increase by 13–21%, N surplus will decrease by 63–74%, and GHG emissions will reduce by 66–78%. In contrast, for grain crops, N application will decrease by 27–38%, NUE will increase by 9–13%, N surplus will decrease by 26–37%, and GHG emissions will reduce by 24–28%. Overall, the potential for improvement is greater for cash crops compared to grain crops. The application of the assessment framework in this study demonstrates its effectiveness as a valuable tool for promoting green and sustainable development in conventional agricultural regions.
1. Introduction
Nitrogen (N) fertilizer plays a crucial role in crop production systems and significantly enhances food security in China [1,2]. Since the 1980s, N application has significantly increased in China due to the pursuit of higher yields. However, this increase has been accompanied by a decline in N use efficiency (NUE) [3,4]. In 2021, China used an estimated 18 million tons of N fertilizer, accounting for 34% of total fertilizer applications, with NUE around 33%. The overuse of N fertilizer not only fails to enhance yields but also causes environmental issues such as greenhouse gas (GHG) emissions, soil and water pollution, and biodiversity loss [5,6]. The Chinese government is actively addressing these concerns by promoting policies, such as ‘Agriculture with High Quality and High Added Value’ (this model emphasizes high yield, high efficiency, and high added value, aiming to achieve sustainable agricultural development and increased farmer incomes by enhancing the quality and market competitiveness of agricultural products), to reduce unnecessary N application while maintaining optimal yields [3,7]. A comprehensive assessment is now needed to explore the potential for improving N utilization, specifically about N rate (N application per unit area in kg/ha) and NUE. This should be performed alongside an evaluation of the related environmental impacts.
Various methods have been used to assess N utilization and its environmental impacts on crops, including questionnaire surveys [8], model simulations [9], field experiments [10], and scenario analyses. Questionnaire surveys, for example, provide insights into crucial crop management practices such as crop type, planting density, sowing dates, fertilizer application, and harvest dates by directly engaging farmers [11]. Nevertheless, they often demonstrate low response rates and limited effectiveness. Model simulations, such as the Decision Support System for Agrotechnology Transfer (DSSAT) and Denitrification–Decomposition (DNDC) models, along with field experiments, provide valuable tools for optimizing N rates and exploring potential improvements in grain crop applications [9,12]. However, these methods are often constrained by input requirements and may be challenging to implement due to time commitments. The popularity of scenario analysis methods for large-scale studies can be attributed to their operational simplicity. However, current research primarily focuses on evaluating the environmental impacts of individual or cereal crops at national or provincial levels, often overlooking the environmental impacts of cash crops such as fruit, vegetable, and tea production [5,13,14]. Cash crops have a greater environmental impact than grain crops. For example, Chinese vegetable production alone accounts for 7.8% of global fertilizer usage and contributes 6.6% to global GHG emissions [15]. Therefore, the potential for improving N utilization and its environmental impacts for various crops at a finer scale remains unclear. Detailed studies can facilitate the implementation of targeted mitigation measures. In this study, we evaluated N utilization and its environmental impacts for seven crops, including both grains and cash crops, at the county level, and quantified the potential for improvement.
In this study, we developed an integrated assessment framework using the nitrogen threshold boundary (NTB) approach based on NUE and N surplus thresholds. This study was conducted in Fujian Province and focused on seven crops: wheat, maize, rice, soybean, tea, vegetables, and fruits. This study aims to (i) assess the spatial variability of N utilization and its environmental impacts across different scenarios for these crops in various counties and (ii) evaluate the potential for improvement of N utilization and its environmental impacts under different scenarios in various counties.
2. Materials and Methods
2.1. Study Area
Fujian Province is located in southeastern China (24°29′–30°04′ N, 113°34′–118°28′ E) and covers an area of 18.6 × 10⁷ ha (Figure 1). Its terrain is predominantly mountainous and hilly, with major mountain ranges in the western and central regions shaping its landscape. The province features a dense network of 24 river systems. Under the influence of the monsoon, Fujian has a warm and humid subtropical marine monsoon climate. The frost-free period ranges from 250 to 336 days annually, with most areas experiencing over 300 days, which supports a triple cropping system. Fujian’s average annual temperature is between 17 and 21 °C, and it receives 1400 to 2000 mm of rainfall per year, making it one of China’s most water-abundant provinces [16]. In terms of cultivated areas, rice, wheat, maize, soybeans, tea, fruits, and vegetables account for 33%, 0.1%, 2%, 3%, 10%, 23%, and 31% of the total cultivated area, respectively.
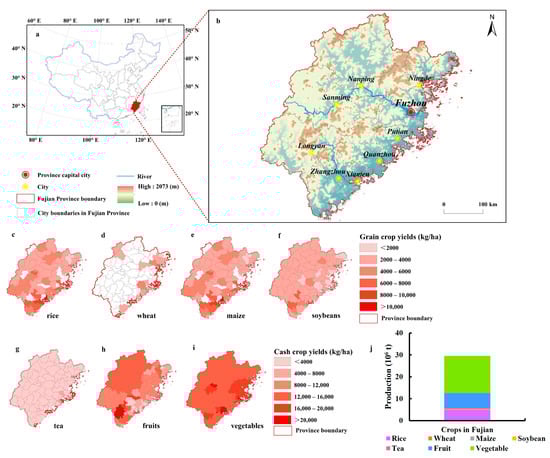
Figure 1.
Location of Fujian Province in China and yields of seven crops (a–g). (a) Location of Fujian Province in China. (b) Topography of Fujian Province. (c–i) The yields of rice, wheat, maize, soybeans, tea, fruits, and vegetables, respectively. (j) The production of seven crops in Fujian Province.
2.2. Data Collection
This study focuses on seven crops: grain crops (wheat, maize, rice, soybean) and cash crops (tea, vegetables, and fruits). Crops’ harvested area, total stock of livestock, and crop yield were obtained from the Fujian Statistical Yearbook 2015 and the National Statistical Yearbook 2015, respectively [17,18]. The N rates for these crops were obtained from previous studies and the National Compilation of Cost and Benefit Information on Agricultural Products 2015 [19,20,21]. Atmospheric N deposition data for China in 2015, at a spatial resolution of 1 km, were obtained from Jia et al. [22]. The N fixation rates and N contents (where N content refers to the proportion of N per unit mass of the crop at harvest) in crops were obtained from previous studies [23,24,25]. Crop irrigation N data were obtained from Yin et al. [26].
2.3. Calculation of N Utilization
The N utilization includes the N rate and NUE.
The N rate was obtained from previous studies and statistical yearbooks, and N application was calculated by multiplying the N rate by the area of the corresponding crop.
NUE is calculated by dividing N output from crop harvest by total agricultural N input, which includes inorganic and organic fertilizer N inputs, N fixation, atmospheric N deposition, and irrigation N. The calculation methods refer to the study by Xing et al. [27].
where represents the NUE of crop a; represents the N output of crop a at harvest time (kg/ha); represents the N rate of crop a (kg/ha); represents the organic fertilizer N input of crop a (kg/ha) [19,28]; represents the N fixation of crop a (kg/ha) [23,24]; represents the atmospheric N deposition of crop a (kg/ha); represents the irrigation N of crop a (kg/ha); represents the yield of crop a (kg/ha); and represents the proportion of N per unit mass of crop a at harvest time (%) [25].
Detailed calculations for manure N (organic fertilizer N input) can be found in Supplementary Method Section S1 in the Supplementary Material.
2.4. Calculation of Environmental Impacts
Environmental impacts include both N surplus and GHG emissions. GHG emissions include CH4, N2O, NH3, N leaching, N runoff, and NOx.
The calculation of N surplus is referenced by Zhang et al. [29].
where represents the excess N input of crop a (kg/ha); represents the N rate of crop a (kg/ha); represents the organic fertilizer N input of crop a (kg/ha); represents the N fixation of crop a (kg/ha); represents the atmospheric N deposition of crop a (kg/ha); represents the irrigation N of crop a (kg/ha); represents straw return N of crop a (kg/ha) [26]; and represents the N content of crop a at the time of harvest (kg/ha).
Detailed calculations for straw return N can be found in Supplementary Method Section S2 in the Supplementary Material.
The GHG emissions consist of CH4 and N2O. The calculation of GHG emissions is derived from Zuo et al. [19]. The CH4 emissions were calculated according to the Intergovernmental Panel on Climate Change (IPCC) Guidelines for National Greenhouse Gas Inventories [30]. The total N2O emissions from each crop come from both direct N2O emissions and indirect N2O emissions generated by NOx, NH3, N leaching, and N runoff emissions, and the calculation was based on previous research [19,30,31,32,33,34,35,36,37]. Finally, we convert the CH4 and N2O to CO2 equivalents using a 100-year global warming potential.
where represents the GHG emissions of crop a (kg CO2 eq/ha); represents the N2O emission of crop a (kg N2O N/ha); is the molecular conversion factor from N2 to N2O; represents the CH4 emissions from rice fields (kg CH4 C/ha); and 28 and 265 are the global warming potential (GWP).
Detailed calculations for GHG emissions can be found in Supplementary Method Section S3 in the Supplementary Material.
2.5. Scenario Analysis
We evaluated potential improvements using the NTB approach, applying a comprehensive assessment framework based on three scenarios, all without affecting crop yields (Figure 2). The NTB approach draws primarily from the European Union N Expert Panel (EUNEP) report, which sets thresholds for both NUE and N surplus. We assumed that N content at harvest, organic fertilizer N input, N fixation, atmospheric N deposition, irrigation N, and straw return N remain unchanged. Using the NUE and N surplus thresholds as optimal levels and referring to Equations (1) and (3), we calculated the N rates at these levels and then recalculated the corresponding NUE, N surplus, and GHG emissions using Equations (1), (3) and (4). This approach aims to optimize N rates to reduce environmental pollution while maintaining crop yields. This study explores three scenarios: a scenario with a reduced N surplus (S1), a scenario with an increased NUE (S2), and a combined scenario that simultaneously reduces N surplus and increases NUE (S3). Specifically, S1 aims to keep the N surplus under 80 kg/ha in each county, which ensures meeting minimum food requirements. This scenario is relatively easy to implement, as it only requires farmers to reduce N fertilizer application to lower the N surplus. S2 assumes an improved NUE reaching 50% for grain crops [38], 15% for tea [39], 7.5% for fruits, and 40% for vegetables [29]. To achieve this scenario, several measures are necessary, including the use of enhanced fertilizers, the application of soil amendments, the adoption of improved crop varieties, the implementation of sprinkler or drip irrigation for fertilization, and the practice of no-tillage farming. It is crucial that farmers follow the 4R nutrient stewardship principles: using the right type of fertilizer, in the right amount, at the right location, and at the right time. S3 combines aspects of S1 and S2, aiming to maintain an N surplus below 80 kg/ha while increasing crops’ NUE. Achieving this scenario would require implementing measures from both S1 and S2. S3 targets situations where S1 counties do not meet NUE requirements and S2 counties fail to reduce N surplus sufficiently. This combined approach ensures compliance with both the NUE and N surplus thresholds. Counties that already meet the NUE and N surplus thresholds will remain unchanged.
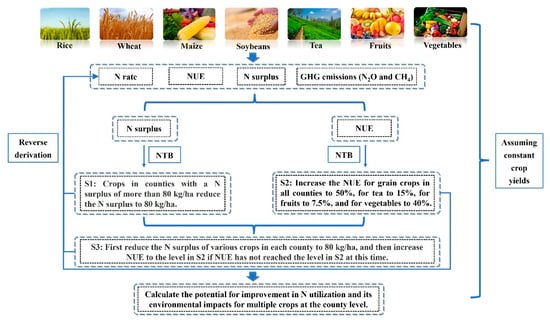
Figure 2.
An assessment framework for N utilization and its environmental impacts on multi-crop production.
In this study, we referred to the thresholds for N surplus and NUE based on guidelines from the EUNEP. These thresholds are designed to ensure that grain crop yields meet the minimum requirements for food, feed, and biofuels. The EUNEP took into account the demands of various stakeholders, including farmers and national and regional administrators, along with competitiveness requirements. As a result, the recommended thresholds are 50% for NUE and 80 kg/ha for N surplus in grain crops. Following EUNEP’s recommendations, we also applied the 80 kg/ha N surplus threshold to cash crops. The NUE thresholds for different cash crops were determined based on multi-year average NUE data from developed countries. These thresholds provide farmers with guidelines to effectively manage N inputs, aiming to reduce excessive N losses to the environment while maintaining agricultural productivity.
3. Results
3.1. Assessment of Crops’ N Utilization and Associated Environmental Impacts in Fujian Province
Fujian Province generally exhibits distinct characteristics, with a lower NUE and higher environmental impacts from N application in crops. Specifically, the NUE was 20%, and the amounts of N application, N surplus, and GHG emissions were 4.7 × 10⁵ t, 5.2 × 10⁵ t, and 8.2 × 10⁶ t CO2 eq, respectively (Figure 3h,p and Figure 4h,p). Notably, fruits showed the highest N application and total amount of N surplus, reaching 2 × 10⁵ t and 2.3 × 10⁵ t, respectively (Figure 3h and Figure 4h). Rice had the highest total amount of GHG emissions, followed by fruits with 3.4 × 10⁶ t CO2 eq and 2.5 × 10⁶ t CO2 eq, respectively (Figure 4p). Wheat had the lowest N application, total amount of N surplus, and GHG emissions at 1.9 × 10² t, 2 × 10² t, and 1.3 × 10³ t CO2 eq, respectively (Figure 3h and Figure 4h,p). Fruits had the highest N rate and N surplus with 367 kg/ha and 424 kg/ha, respectively, followed by tea with 286 kg/ha and 318 kg/ha (Figure 3f and Figure 4f). Similarly, fruits and tea exhibited lower NUE values, with 2% and 7%, respectively (Figure 3p). Fruit had the highest GHG emissions at 4595 kg CO2 eq/ha, mainly due to its low N uptake and high N rate (Figure 4n). In contrast, soybeans demonstrated the lowest N rate (26 kg/ha), N surplus (60 kg/ha), and GHG emissions (110 kg CO2 eq/ha), along with the highest NUE (72.08%) among all crops (Figure 3d,l and Figure 4d,l). Overall, cash crops exhibited higher levels of N rates, N surplus, and GHG emissions compared to grain crops. Conversely, NUE showed an opposite trend.
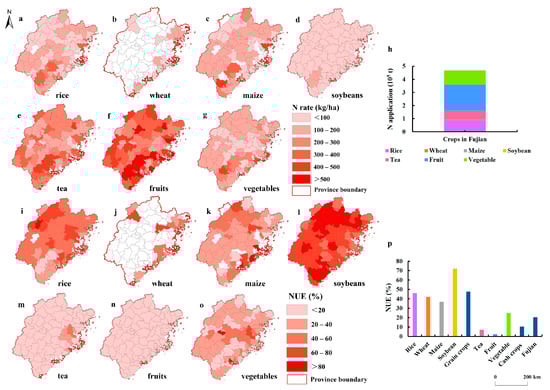
Figure 3.
Current situation of the N rate for seven crops in the county. (a–g) The N rate of rice, wheat, maize, soybeans, tea, fruits, and vegetables, respectively, and total N application for seven crops in Fujian Province (h). Current situation of NUE for seven crops in the county. (i–o) NUE of rice, wheat, maize, soybeans, tea, fruits, and vegetables, respectively, and NUE for seven crops in Fujian Province (p).
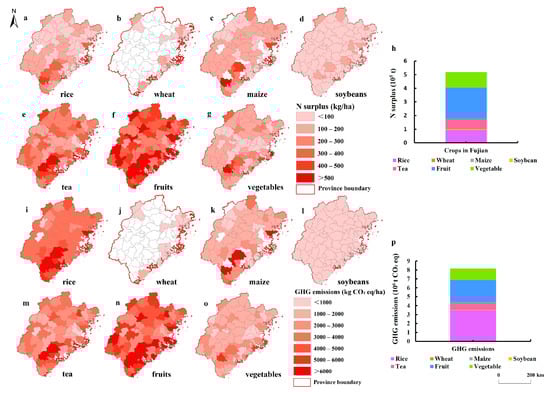
Figure 4.
Current situation of the N surplus for seven crops in the county. (a–g) The N surplus of rice, wheat, maize, soybeans, tea, fruits, and vegetables, respectively, and the total N surplus for seven crops in Fujian Province (h). Current situation of GHG emissions for seven crops in the county (i–o). The GHG emissions of rice, wheat, maize, soybeans, tea, fruits, and vegetables, respectively, and GHG emissions for seven crops in Fujian Province (p).
There are significant spatial variations in N utilization and its environmental impacts among crops across counties within Fujian Province. The southern and southeastern coastal areas, including Huaan County, Nanjing County, and Pingtan County, exhibit higher N rates, N surplus, and GHG emissions (Figure 3 and Figure 4). In contrast, regions with higher NUE are mainly situated in the northern and central parts of the province, such as Dehua County, Jianou City, and Shaowu County. It is noteworthy that the environmental impacts of cash crops generally exceed those of grain crops across all counties.
3.2. Improvement Potentials for Crop N Utilization and Its Environmental Impacts by Reducing the N Surplus
Reducing the N surplus can effectively mitigate GHG emissions resulting from N inputs. Compared to the current situation, the implementation of strategy S1 would significantly reduce N application, total amount of N surplus, and total amount of GHG emissions by 3.1 × 10⁵ t (66%), 3.4 × 10⁵ t (65%), and 4.4 × 10⁶ t CO2 eq (53%), respectively (Figure 5b). This adjustment would also increase the NUE in Fujian Province from 20% to 43% (Figure 5a). In particular, the N rate for all crops would be reduced to less than 80 kg/ha. The reduction in N application would be more than 50% for cash crops and less than 50% for grain crops. Specifically, there would be notable reductions of 82% for fruits and 79% for tea. In contrast, the reductions for wheat and soybeans would only be 23% and 21%, respectively (Figure 5c and Figure 6b,d–f). NUE for cash crops would increase significantly by 19%, surpassing the 13% increase observed for grain crops (Figure 5d). Among the different crops, maize and tea show significant increases in NUE. The NUE of maize would increase from 37% to 53% and that of tea from 7% to 23% (Figure 5a and Figure 6j,l). The N surplus for all crops would be less than 80 kg/ha, and GHG emissions would be reduced to less than 1000 kg CO2 eq/ha for all crops, except rice and maize. The reductions in both the N surplus and GHG emissions were more pronounced for cash crops than for grain crops. The most significant improvements were observed for fruits, which saw an 81% reduction in the total amount of N surplus and an 82% decrease in the total amount of GHG emissions (Figure 5e,f and Figure 7f,m). In contrast, soybeans showed the least potential for improvement, with only 11% and 21% reductions in the total amount of N surplus and GHG emissions, respectively (Figure 5e,f and Figure 7d,k).
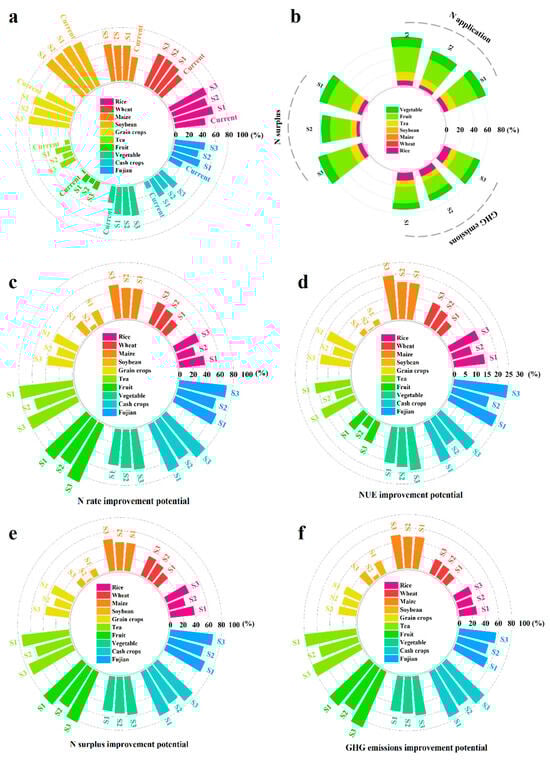
Figure 5.
NUE of various crops under current and three scenarios (a) and the potential for improvement in N application, N surplus, and GHG emissions in Fujian Province under the three optimization scenarios (b). N rate (c), NUE (d), N surplus (e), and GHG emissions (f) improvement potentials of various crops under the three scenarios compared with the current situation.
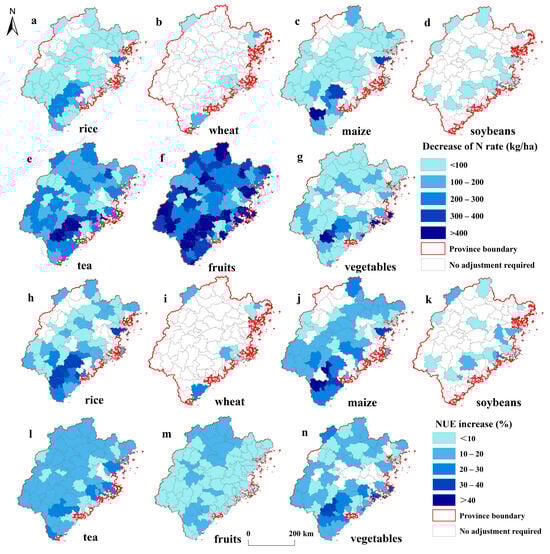
Figure 6.
Potential for reducing the N rate. (a–g) The N rate of rice, wheat, maize, soybeans, tea, fruits, and vegetables, respectively, and increasing NUE (h–n) represents the NUE of rice, wheat, maize, soybeans, tea, fruits, and vegetables, respectively at the county scale in S1.
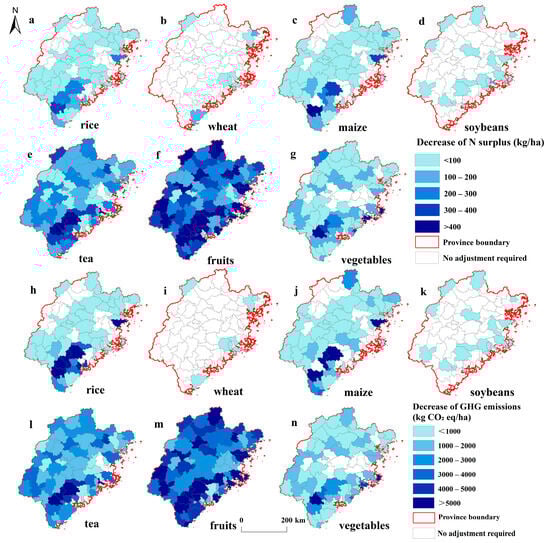
Figure 7.
Potential for reducing the N surplus. (a–g) The N surplus of rice, wheat, maize, soybeans, tea, fruits, and vegetables, respectively, and GHG emissions. (h–n) The GHG emissions of rice, wheat, maize, soybeans, tea, fruits, and vegetables, respectively, at the county scale in S1.
In S1, there is considerable regional variability in the potential for improving N utilization and mitigating its environmental impacts. Southeastern counties have a high potential for enhancing both N utilization and environmental impacts in cash crops and grain crops. However, reductions in the N rate, N surplus, and GHG emissions were more pronounced for cash crops compared to grain crops, with less notable improvements in NUE for cash crops relative to grain crops (Figure 6 and Figure 7). It is noteworthy that northern counties exhibit potential for improvement in fruit and tea production. In contrast, soybeans and wheat show lower potential across all counties. Rice, wheat, and vegetables show notable potential for improvement, especially in the southeastern counties.
3.3. Improvement Potentials for Crop N Utilization and Its Environmental Impacts by Improving NUE
In S2, N application would be reduced by 2.7 × 10⁵ t (58%), the total amount of N surplus would be reduced by 2.9 × 10⁵ t (56%), and the total amount of GHG emissions would be reduced by 3.9 × 10⁶ t CO2 eq (48%) (Figure 5b). The NUE in Fujian Province is expected to increase to 37%, marking a 17% improvement from the current situation (Figure 5a,d). After optimization, the N rate for seven crops is reduced to less than 110 kg/ha (Figure 8). However, it is noteworthy that the N rate for cash crops remains higher than that for grain crops. A comparison of S2 with S1 shows lower N rates for wheat (58 kg/ha), maize (71 kg/ha), and vegetables (68 kg/ha) in S2 (Figure 8). The NUE of grain crops has significantly improved, reaching 57% with a 9% increase. Similarly, the NUE of cash crops in the same region has also improved, reaching 24% with a 14% increase. It is noteworthy that the observed increments in NUE are lower than those observed in S1 (Figure 5a,d). In terms of environmental impacts, most crops have reduced their N surplus to less than 80 kg/ha, with the exception of fruit and tea. The GHG emissions from rice cultivation exceed 3000 kg CO2 eq/ha, while emissions from other crops remain below 1400 kg CO2 eq/ha (Figure 9). It is evident that cash crops have the potential for significant improvement. Specifically, fruits have demonstrated the most substantial reductions in both the total amount of the N surplus and the total amount of GHG emissions, with decreases of 69% and 73%, respectively (Figure 5e,f and Figure 9f,m). The potential for improvement in the N surplus and GHG emissions is greater for wheat, maize, and vegetables compared to S1, while the opposite is observed for other crops.
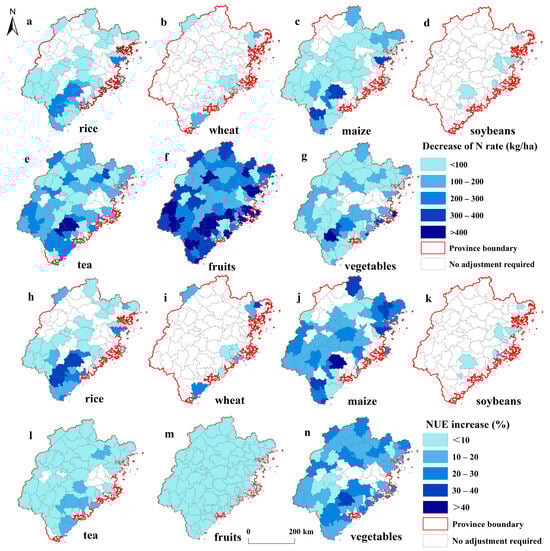
Figure 8.
Potential for reducing the N rate. (a–g) The N rate of rice, wheat, maize, soybeans, tea, fruits, and vegetables, respectively, and increasing NUE. (h–n) The NUE of rice, wheat, maize, soybeans, tea, fruits, and vegetables, respectively, at the county scale in S2.
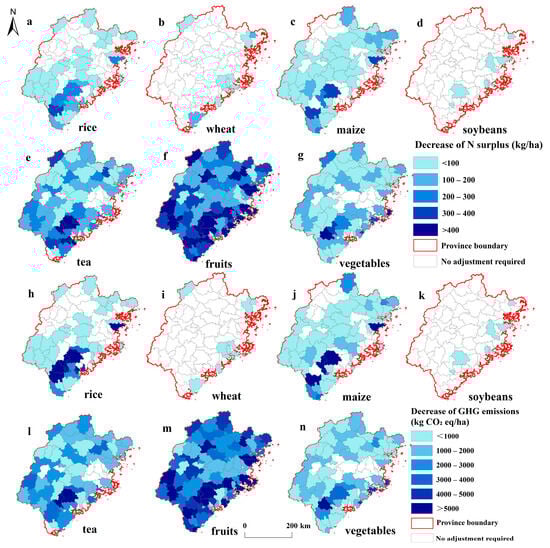
Figure 9.
Potential for reducing the N surplus. (a–g) The N surplus of rice, wheat, maize, soybeans, tea, fruits, and vegetables, respectively, and GHG emissions. (h–n) The GHG emissions of rice, wheat, maize, soybeans, tea, fruits, and vegetables, respectively, at the county scale in S2.
The spatial distribution of indicators follows the trends seen in S1, with notable changes concentrated in the southern counties (Figure 8 and Figure 9). Specifically, certain counties in northern Fujian Province show significant potential for improvement in the N rate, NUE, N surplus, and GHG emissions, especially for cash crops. Conversely, regions with greater potential for improving grain crops are primarily found in the southern and southeastern coastal counties. In the central counties, the NUE for tea and vegetables has already reached satisfactory levels and does not require further adjustments. Additionally, the NUE for rice, wheat, and soybeans meets the standards in most counties, except for a few in the southeast. Compared to S1, fewer counties in S2 need adjustments for various crops.
3.4. Improvement Potentials for Crop N Utilization and Its Environmental Impacts by Reducing N Surplus and Improving NUE
In all three scenarios, S3 shows a greater potential for improvement in both N utilization and environmental impacts compared to S1 and S2. Compared to the current situation, there are significant reductions in N application, total amount of N surplus, and total amount of GHG emissions by 3.3 × 10⁵ t (70%), 3.5 × 10⁵ t (67%), and 4.6 × 10⁶ t CO2 eq (56%), respectively. In addition, the NUE increases from 20% to 45% (Figure 5a,b). In S3, the N rate ranges from 20 kg/ha to 70 kg/ha for all crops. Among the crops, rice has the highest N rate at 68 kg/ha, while soybean has the lowest N rate at 21 kg/ha (Figure 10a,d). It is noteworthy that fruit showed the greatest reduction in N application, with a 90% reduction compared to the current situation (Figure 5c and Figure 10f). With the exception of soybeans, NUE for other crops increased by more than 10% compared to the current situation. In particular, maize and vegetables showed notable improvements, with NUE increasing from 36% to 56% and from 25% to 44%, respectively (Figure 5a). Compared to grain crops, cash crops show a more noticeable increase in NUE. In terms of environmental impacts, the county’s N surplus ranges from 53 kg/ha to 80 kg/ha for all crops, while GHG emissions have been reduced to below 800 kg CO2 eq/ha after optimization, except for rice and maize. In particular, fruits showed the greatest potential for improvement in the total amount of N surplus and the total amount of GHG emissions, with reductions of 82% and 89%, respectively (Figure 5e,f and Figure 11f,m).
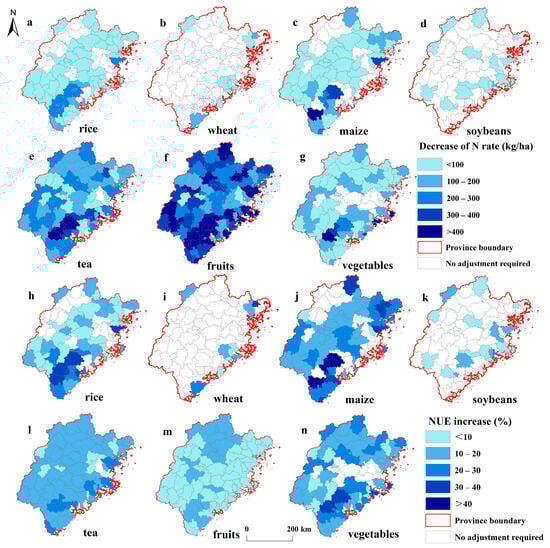
Figure 10.
Potential for reducing the N rate. (a–g) The N rate of rice, wheat, maize, soybeans, tea, fruits, and vegetables, respectively, and increasing NUE. (h–n) The NUE of rice, wheat, maize, soybeans, tea, fruits, and vegetables, respectively, at the county scale in S3.
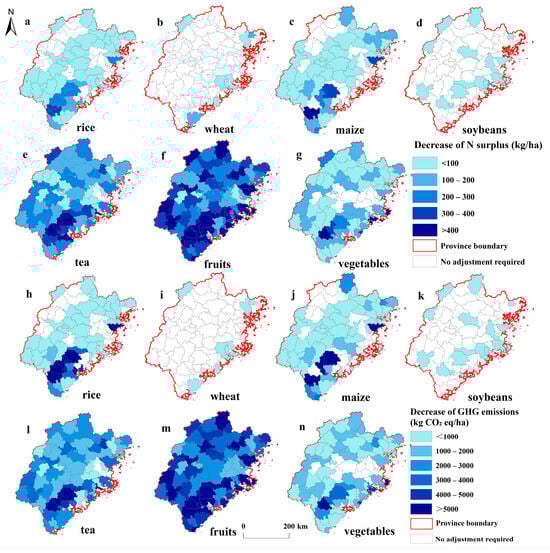
Figure 11.
Potential for reducing the N surplus. (a–g) The N surplus of rice, wheat, maize, soybeans, tea, fruits, and vegetables, respectively, and GHG emissions. (h–n) The GHG emissions of rice, wheat, maize, soybeans, tea, fruits, and vegetables, respectively, at the county scale in S3.
The southeastern counties showed notable decreases in the N rate, N surplus, and GHG emissions, consistent with the patterns observed under the S1 and S2 scenarios. Furthermore, both the southeastern and northern regions of Fujian Province demonstrate a notable enhancement in NUE (Figure 10 and Figure 11). Conversely, the central counties demonstrate a lower potential for improvement across all crops, especially grain crops. Notably, the northern counties demonstrate considerable potential for improvement in maize, tea, fruits, and vegetables. In comparison to S1 and S2, S3 identifies a greater number of counties that require adjustments.
4. Discussion
4.1. N Utilization and Its Environmental Impacts in Multiple Crops
Over the past four decades, China has experienced a remarkable 75% increase in grain production, accompanied by a threefold increase in fertilizer use, especially synthetic N fertilizers [2]. However, China’s over-reliance on synthetic N fertilizers has led to several environmental challenges. These include increased GHG emissions, reduced NUE, and increased risks of soil and water pollution and soil acidification [40]. It is noteworthy that the current application rate of synthetic N fertilizer in China is estimated to be approximately 2–3 times higher than that in developed countries, despite having comparable or even lower crop yields [41]. This highlights the critical need to reduce N rates to improve NUE, particularly for cash crops. Our study also supports this conclusion, with predicted results indicating that the reduction in N application for cash crops will exceed 60% in all three scenarios, significantly exceeding the 20–40% reduction expected for grain crops. Previous studies in southeast China achieved a 20% reduction in rice N application using controlled-release urea (CRU) instead of conventional split applications of urea [42]. However, the present study predicts a notable 38% reduction in N application to rice through effective management of both NUE and N surplus, which is higher than previous studies. This indicates the potential for further improvements in optimizing N utilization in agriculture.
Compared to previous studies in the field, our study identifies a greater potential for improvement. For example, Zhang et al. conducted 4500 field experiments and used the soil surface balance method to establish a benchmark N surplus value of 147 kg/ha for rice cultivation in southeast China [43]. In contrast, our study utilized the recommended N surplus values provided by the EUNEP, resulting in a significantly lower value of 72 kg/ha. Wu et al. noted the extensive use of chemical fertilizers in fruit crop production in China, which contributes to significant GHG emissions [44]. Our results support this observation, revealing substantial room for improvement in N application, N surplus, and GHG emissions in fruit production, accounting for more than half of the total improvement potential. Liang et al. conducted a comprehensive study of GHG emissions from tea production in several provinces in China, including Hubei, Yunnan, Guizhou, Sichuan, and Fujian [20]. They implemented the best-recommended fertilizer management practices and used biomass as an energy source during tea processing, achieving a 58% reduction in GHG emissions compared to conventional practices. In our study, we further explored the potential for optimizing N surplus and NUE in tea production. We predict a notable 79% reduction in GHG emissions in Fujian Province by controlling the N surplus and improving NUE. Notably, this optimization approach proved more effective than the best fertilization management strategies reported in the literature.
4.2. Fruits Have Great Potential for Improvement
Fruits exhibited the highest N application among all crops, thereby demonstrating the greatest potential for improvement [45]. This study further confirms that fruits have the highest improvement potential among various crops. Specifically, N application will be reduced by more than 70%, NUE will be increased by about 10%, N surplus will be reduced by more than 69%, and GHG emissions will be reduced by more than 70%. These improvements can be attributed to three main factors. Firstly, this is linked to the historical Chinese agricultural practice of predominantly cultivating grain crops since the late 20th century, driven by the need for food security. This practice has led to a reduction in soil organic matter content. In orchard construction, substantial N fertilizer application is essential for enhancing fruit yield [46]. Consequently, maintaining soil quality and ensuring adequate N input have become increasingly crucial. Secondly, driven by economic incentives, local farmers have applied excessive fertilizers to boost fruit yields, often surpassing the optimal application levels for their area [46,47]. Finally, cash crops generally exhibit lower root density and nutrient uptake capacity compared to grain crops, requiring higher fertilizer inputs to meet their N needs. Consequently, the effective reduction in N surplus is critically important for crop production systems [15].
4.3. Feasible Suggestions for N Management
The potential for improvement, as indicated by the assessment, can be realized through the implementation of various mitigation measures. Firstly, at the governmental level, effective execution of the land transfer policy is essential to promote land consolidation and encourage the formation of large-scale farming systems. This approach, as proposed by Duan et al., has the potential to reduce N fertilizer use while increasing NUE and minimizing pollution [8]. By consolidating land and adopting efficient farming practices, such as precision nutrient management, farmers can optimize fertilizer use and minimize excess nutrient leaching or emissions. Furthermore, the implementation of a Nitrogen Credit System (NCS) can serve to further incentivize farmers to adopt optimal fertilizer application and management practices. This system, which involves the collaboration of local agricultural scientists, farmers, businesses, and government agencies, can generate a list of recommended measures. Those farmers who adopt these measures may be eligible for subsidies, as proposed by Gu et al. [48]. The NCS can serve as a conduit for knowledge transfer and motivate farmers to adopt sustainable practices, thereby reducing GHG emissions and improving environmental quality. In addition, substantial government financial subsidies can play a key role in supporting farmers’ transition to more efficient and sustainable agricultural practices. To illustrate, the provision of fertilizer subsidies can help smallholder farmers afford new and more efficient fertilizers, thereby encouraging a transition from traditional practices to those that promote improved nutrient management and reduced environmental impacts [49]. Such subsidies can serve as incentives for farmers to adopt innovative technologies and practices that increase the efficiency of fertilizer use and minimize GHG emissions. These measures should be prioritized for implementation in the hotspots of Fujian Province with high improvement potential, especially in the southern and southeastern coastal regions. Secondly, at the individual farmer level, reducing N fertilizer application is the simplest, most direct, and most effective approach to mitigating environmental pollution and promoting sustainable agricultural development [50]. However, it is crucial that farmers adhere to the principles of 4R nutrient stewardship [51]. Therefore, it is imperative for both governments and farmers to collaborate to achieve the goals of reducing environmental pollution and advancing sustainable agricultural practices.
The assessment of spatial heterogeneity between counties facilitates the targeted implementation of mitigation measures across different regions. Firstly, in southern counties with high N rates for tea and fruit cultivation, it is advisable to promote the use of commercial organic fertilizers and organic–inorganic compound fertilizers. For tea and fruit-growing counties in the western mountainous areas, it is recommended that investment be made in infrastructure improvements such as sprinkler and drip irrigation systems, water–fertilizer integration, drainage and water storage systems, and mountain-specific transport machines. Secondly, for counties with high GHG emissions, such as those in southern and southeastern coastal regions, it is recommended to promote mitigation measures, such as green manure cultivation, straw return to fields, commercial organic fertilizers, and digestate application, in conjunction with the use of nitrification inhibitors. Finally, in vegetable production areas with high N fertilizer residues, it is advisable to employ innovative facility equipment and vegetable cultivation techniques. For example, the promotion of commercial organic fertilizers is recommended in the primary production areas of open-field vegetables, located south of the mouth of the Minjiang River and in hilly inland areas. Furthermore, the implementation of soilless cultivation technology should be encouraged in the dominant production areas of greenhouse vegetables, which are located in the southeast coastal and inland northwest regions.
4.4. Limitations and Uncertainties
The scenario analysis conducted in this study demonstrated that reducing N surplus and improving NUE can effectively enhance crop N utilization and mitigate environmental impacts. However, it is important to acknowledge that this method has inherent limitations. Firstly, due to the lack of specific N surplus thresholds for cash crops, we adopted a uniform N surplus threshold of 80 kg/ha for all crops. Secondly, some calculations utilized non-local parameters; for example, the N2O fluxes used for vegetables were based on data from the Yangtze River Delta, a traditional vegetable-growing region [34]. In the absence of local parameters, we selected values from regions with similar climatic and geographical conditions. Thirdly, the analysis does not account for carbon emissions or sequestration associated with changes in agricultural land use. Fourth, field validation is essential for future work, as factors such as climate, topography, crop varieties, variations in agricultural practices, and government policies may influence the accuracy of the assessment in actual agricultural conditions. Although our results require further validation under actual agricultural conditions, we present an integrated assessment framework that can serve as a valuable reference for regions with similar conditions. Finally, this study did not consider the effects of excessive reductions in N application on the soil environment. It has been demonstrated that excessive reductions in N application can result in soil N depletion and reduced soil fertility [50]. Therefore, field experiments are necessary to determine more accurate thresholds for crop N surplus and NUE, as well as the associated GHG emissions parameters. Concurrently, identifying the optimal N rate for crops is essential for promoting sustainable agricultural development. In addition, the comprehensive assessment framework proposed in this study is currently used primarily to assess overall averages at the county level to reflect differences between counties. In the future, we will conduct studies at a finer scale to assess differences between individual fields.
5. Conclusions
The NTB approach provides a framework for assessing the potential for improving resource use efficiency and reducing environmental impacts by controlling N surplus and NUE. The simultaneous reduction in N surplus and the improvement of NUE can result in a reduction in N application, N surplus, and GHG emissions in Fujian Province by 3.3 × 10⁵ t (70%), 3.5 × 10⁵ t (67%), and 4.6 × 10⁵ t CO2 eq (56%), respectively. Furthermore, NUE can be improved by 25%. It is noteworthy that substantial spatial heterogeneity exists among counties, with the southeastern regions showing the greatest potential for enhancing N utilization and reducing environmental impacts. The potential for improvement is more pronounced for cash crops than for grain crops. Among various crops, soybeans show the least potential for improvement, whereas fruits demonstrate the greatest potential, accounting for over half of the total improvement potential. Therefore, we recommend that governments and farmers focus on addressing resource waste and environmental impacts associated with cash crops. At the same time, measures should be implemented that contribute significantly to sustainable agricultural development.
The proposed comprehensive assessment framework, based on the NTB approach, is designed to evaluate county-level N utilization and its environmental impacts for multiple crops and determine the potential for improvement. The findings of this study provide a valuable reference for enhancing N utilization and mitigating environmental impacts of various crops at the county level in agricultural regions.
Supplementary Materials
The following supporting information can be downloaded at https://www.mdpi.com/article/10.3390/agriculture14091639/s1, Supplementary Method Section S1: Manure N; Supplementary Method Section S2: Crop return N from straw; Supplementary Method Section S3: GHG emissions.
Author Contributions
Conceptualization, J.L., M.W. and W.S.; methodology, J.L., M.W. and W.S.; software, J.L. and M.W.; formal analysis, J.L. and M.W.; investigation, X.S.; data curation, J.L. and M.W.; writing—original draft preparation, J.L.; writing—review and editing, M.W., X.S. and W.S.; visualization, J.L. and M.W.; supervision, W.S.; funding acquisition, W.S. All authors have read and agreed to the published version of the manuscript.
Funding
This research was funded by the National Key Research and Development Program of China (2022YFB3903504), the Science Fund for Creative Research Groups of the National Natural Science Foundation of China (72221002), the Scientific Research Foundation for the Returned Overseas Chinese Scholars of Hebei Province (C20230347), the Major Research Project of Humanities and Social Sciences Research of Hebei Education Department (ZD202412), and the Funding Project for Cultivating Innovative Abilities of Graduate Students of Hebei Normal University (XCXZZSS202439).
Institutional Review Board Statement
Not applicable.
Data Availability Statement
The data presented in this study are available upon request from the corresponding author.
Conflicts of Interest
The authors declare no conflicts of interest.
References
- Yan, X.; Xia, L.; Ti, C. Temporal and spatial variations in nitrogen use efficiency of crop production in China. Environ. Pollut. 2022, 293, 118496. [Google Scholar] [CrossRef] [PubMed]
- Guo, Y.X.; Chen, Y.F.; Searchinger, T.D.; Zhou, M.; Pan, D.; Yang, J.N.; Wu, L.; Cui, Z.L.; Zhang, W.F.; Zhang, F.S.; et al. Air quality, nitrogen use efficiency and food security in China are improved by cost-effective agricultural nitrogen management. Nat. Food 2020, 1, 648–658. [Google Scholar] [CrossRef] [PubMed]
- Liu, Y.X.; Heuvelink, G.B.M.; Bai, Z.G.; He, P.; Xu, X.P.; Ma, J.C.; Masiliunas, D. Space-time statistical analysis and modelling of nitrogen use efficiency indicators at provincial scale in China. Eur. J. Agron. 2020, 115, 126032. [Google Scholar] [CrossRef]
- Ren, C.C.; Zhang, X.M.; Reis, S.; Gu, B.J. Socioeconomic barriers of nitrogen management for agricultural and environmental sustainability. Agric. Ecosyst. Environ. 2022, 333, 107950. [Google Scholar] [CrossRef]
- Sun, C.; Chen, L.; Zhai, L.; Liu, H.; Wang, K.; Jiao, C.; Shen, Z. National assessment of nitrogen fertilizers fate and related environmental impacts of multiple pathways in China. J. Clean. Prod. 2020, 277, 123519. [Google Scholar] [CrossRef]
- Pramanick, B.; Kumar, M.; Naik, B.M.; Singh, S.K.; Kumar, M.; Singh, S.V. Soil carbon-nutrient cycling, energetics, and carbon footprint in calcareous soils with adoption of long-term conservation tillage practices and cropping systems diversification. Sci. Total Environ. 2024, 912, 169421. [Google Scholar] [CrossRef]
- Cai, S.Y.; Zhao, X.; Pittelkow, C.M.; Fan, M.S.; Zhang, X.; Yan, X.Y. Optimal nitrogen rate strategy for sustainable rice production in China. Nature 2023, 615, 73–79. [Google Scholar] [CrossRef]
- Duan, J.K.; Ren, C.C.; Wang, S.T.; Zhang, X.M.; Reis, S.F.; Xu, J.M.; Gu, B.J. Consolidation of agricultural land can contribute to agricultural sustainability in China. Nat. Food 2021, 2, 1014–1022. [Google Scholar] [CrossRef]
- Jiang, R.; He, W.T.; Zhou, W.; Hou, Y.P.; Yang, J.Y.; He, P. Exploring management strategies to improve maize yield and nitrogen use efficiency in northeast China using the DNDC and DSSAT models. Comput. Electron. Agric. 2019, 166, 104988. [Google Scholar] [CrossRef]
- Wang, H.Y.; Zhang, Y.T.; Chen, A.Q.; Liu, H.B.; Zhai, L.M.; Lei, B.K.; Ren, T.Z. An optimal regional nitrogen application threshold for wheat in the North China Plain considering yield and environmental effects. Field Crops Res. 2017, 207, 52–61. [Google Scholar] [CrossRef]
- Cui, Z.L.; Zhang, H.Y.; Chen, X.P.; Zhang, C.C.; Ma, W.Q.; Huang, C.D.; Zhang, W.F.; Mi, G.H.; Miao, Y.X.; Li, X.L.; et al. Pursuing sustainable productivity with millions of smallholder farmers. Nature 2018, 555, 363–366. [Google Scholar] [CrossRef] [PubMed]
- Peng, Z.; Liu, Y.; Li, Y.; Abawi, Y.; Wang, Y.; Men, M.; Duc-Anh, A.-V. Responses of Nitrogen Utilization and Apparent Nitrogen Loss to Different Control Measures in the Wheat and Maize Rotation System. Front. Plant Sci. 2017, 8, 160. [Google Scholar] [CrossRef] [PubMed]
- Ma, W.; Li, J.; Ma, L.; Wang, F.; Sisak, I.; Cushman, G.; Zhang, F. Nitrogen flow and use efficiency in production and utilization of wheat, rice, and maize in China. Agric. Syst. 2009, 99, 53–63. [Google Scholar] [CrossRef]
- Zhang, F.; Liu, F.; Ma, X.; Guo, G.; Liu, B.; Cheng, T.; Liang, T.; Tao, W.; Chen, X.; Wang, X. Greenhouse gas emissions from vegetables production in China. J. Clean. Prod. 2021, 317, 128449. [Google Scholar] [CrossRef]
- Wang, X.; Dou, Z.; Shi, X.; Zou, C.; Liu, D.; Wang, Z.; Guan, X.; Sun, Y.; Wu, G.; Zhang, B.; et al. Innovative management programme reduces environmental impacts in Chinese vegetable production. Nat. Food 2020, 2, 47–53. [Google Scholar] [CrossRef]
- Fujian Provincial People’s Government Portal. 2022. Available online: https://www.fujian.gov.cn/ (accessed on 15 May 2023).
- Fujian Provincial Bureau of Statistics. 2015. Available online: http://tjj.fujian.gov.cn/ (accessed on 20 December 2022).
- National Bureau of Statistics. 2015. Available online: http://www.stats.gov.cn/ (accessed on 20 December 2022).
- Zuo, L.; Zhang, Z.; Carlson, K.M.; MacDonald, G.K.; Brauman, K.A.; Liu, Y.; Zhang, W.; Zhang, H.; Wu, W.; Zhao, X.; et al. Progress towards sustainable intensification in China challenged by land-use change. Nat. Sustain. 2018, 1, 304–313. [Google Scholar] [CrossRef]
- Liang, L.; Ridoutt, B.G.; Wang, L.Y.; Xie, B.; Li, M.H.; Li, Z.B. China’s Tea Industry: Net Greenhouse Gas Emissions and Mitigation Potential. Agriculture 2021, 11, 363. [Google Scholar] [CrossRef]
- National Development and Reform Commission Price Department. National Compilation of Agricultural Cost-Benefit Information; China Statistics Press: Beijing, China, 2015. [Google Scholar]
- Jia, Y.; Wang, Q.; Zhu, J.; Chen, Z.; He, N.; Yu, G. A spatial and temporal dataset of atmospheric inorganic nitrogen wet deposition in China (1996–2015). China Sci. Data 2018, 4, 1–10. [Google Scholar] [CrossRef]
- Li, S.; Jin, J. Characteristics of Nutrient Input/Output and Nutrient Balance in Different Regions of China. Sci. Agric. Sin. 2011, 44, 4207–4229. [Google Scholar]
- Smil, V. Nitrogen in crop production: An account of global flows. Glob. Biogeochem. Cycles 1999, 13, 647–662. [Google Scholar] [CrossRef]
- Nielson, R.; Mays, M.; Goss, D. Agricultural Waste Management Field Handbook; USDA: Washington, DC, USA, 1996.
- Yin, Y.; Zhao, R.; Yang, Y.; Meng, Q.; Ying, H.; Cassman, K.G.; Cong, W.; Tian, X.; He, K.; Wang, Y.; et al. A steady-state N balance approach for sustainable smallholder farming. Proc. Natl. Acad. Sci. USA 2021, 118, e2106576118. [Google Scholar] [CrossRef] [PubMed]
- Xing, J.L.; Shi, W.J.; Deng, X.Z.; Lu, C.H.; Zuo, L.J.; Wang, S.Q.; Wang, M.L.; Wang, X.Q.; Yan, B.J. Improvement of resource use efficiency versus mitigation of environmental impacts in rice production of Fujian Province, China. J. Clean Prod. 2022, 368, 133154. [Google Scholar] [CrossRef]
- Bouwman, A.F.; Lee, D.S.; Asman, W.A.H.; Dentener, F.J.; VanderHoek, K.W.; Olivier, J.G.J. A global high-resolution emission inventory for ammonia. Glob. Biogeochem. Cycles 1997, 11, 561–587. [Google Scholar] [CrossRef]
- Zhang, X.; Davidson, E.A.; Mauzerall, D.L.; Searchinger, T.D.; Dumas, P.; Shen, Y. Managing nitrogen for sustainable development. Nature 2015, 528, 51–59. [Google Scholar] [CrossRef] [PubMed]
- IPCC. IPCC Guidelines for National Greenhouse Gas Inventories. 2006. Available online: https://www.ipcc-nggip.iges.or.jp/public/2006gl/chinese/index.html (accessed on 20 December 2022).
- Chen, X.P.; Cui, Z.L.; Fan, M.S.; Vitousek, P.; Zhao, M.; Ma, W.Q.; Wang, Z.L.; Zhang, W.J.; Yan, X.Y.; Yang, J.C.; et al. Producing more grain with lower environmental costs. Nature 2014, 514, 486–489. [Google Scholar] [CrossRef]
- Gerber, J.S.; Carlson, K.M.; Makowski, D.; Mueller, N.D.; de Cortazar-Atauri, I.G.; Havlik, P.; Herrero, M.; Launay, M.; O’Connell, C.S.; Smith, P.; et al. Spatially explicit estimates of N2O emissions from croplands suggest climate mitigation opportunities from improved fertilizer management. Glob. Chang. Biol. 2016, 22, 3383–3394. [Google Scholar] [CrossRef]
- Gu, B.; Ju, X.; Chang, J.; Ge, Y.; Vitousek, P.M. Integrated reactive nitrogen budgets and future trends in China. Proc. Natl. Acad. Sci. USA 2015, 112, 8792–8797. [Google Scholar] [CrossRef]
- Mei, B.L.; Zheng, X.H.; Xie, B.H.; Dong, H.B.; Yao, Z.S.; Liu, C.Y.; Zhou, Z.X.; Wang, R.; Deng, J.; Zhu, J.G. Characteristics of multiple-year nitrous oxide emissions from conventional vegetable fields in southeastern China. J. Geophys. Res.-Atmos. 2011, 116, D12113. [Google Scholar] [CrossRef]
- Ti, C.P.; Luo, Y.X.; Yan, X.Y. Characteristics of nitrogen balance in open-air and greenhouse vegetable cropping systems of China. Environ. Sci. Pollut. Res. 2015, 22, 18508–18518. [Google Scholar] [CrossRef]
- Zhang, W.F.; Dou, Z.X.; He, P.; Ju, X.T.; Powlson, D.; Chadwick, D.; Norse, D.; Lu, Y.L.; Zhang, Y.; Wu, L.; et al. New technologies reduce greenhouse gas emissions from nitrogenous fertilizer in China. Proc. Natl. Acad. Sci. USA 2012, 110, 8375–8380. [Google Scholar] [CrossRef]
- Wang, F.; Chen, Y.; Wu, Z.; Jiang, F.; Zhang, W.; Weng, B.; You, C.M. Estimation of greenhouse gas emissions from chemical nitrogen fertilizer application and production and transportation processes in a typical tea region in China. Tea Sci. 2020, 40, 205–214. [Google Scholar]
- Oenema, O.; Brentrup, F.; Lammel, J.; Bascou, P.; Billen, G.; Dobermann, A.; Erisman, J.W.; Garnett, T.; Hammel, M.; Haniotis, T.; et al. Nitrogen Use Efficiency (NUE) an Indicator for the Utilization of Nitrogen in Food Systems; EU Nitrogen Expert Panel. 2015. Available online: https://www.researchgate.net/publication/312554339 (accessed on 15 May 2023).
- Hirono, Y.; Sano, T.; Eguchi, S. Changes in the nitrogen footprint of green tea consumption in Japan from 1965 to 2016. Environ. Sci. Pollut. Res. 2021, 28, 44936–44948. [Google Scholar] [CrossRef] [PubMed]
- Chai, Q.; Nemecek, T.; Liang, C.; Zhao, C.; Yu, A.; Coulter, J.A.; Wang, Y.; Hu, F.; Wang, L.; Siddique, K.H.M.; et al. Integrated farming with intercropping increases food production while reducing environmental footprint. Proc. Natl. Acad. Sci. USA 2021, 118, e2106382118. [Google Scholar] [CrossRef] [PubMed]
- Xia, L.; Ti, C.; Li, B.; Xia, Y.; Yan, X. Greenhouse gas emissions and reactive nitrogen releases during the life-cycles of staple food production in China and their mitigation potential. Sci. Total Environ. 2016, 556, 116–125. [Google Scholar] [CrossRef]
- Chen, Z.M.; Wang, Q.; Ma, J.W.; Zou, P.; Jiang, L.N. Impact of controlled-release urea on rice yield, nitrogen use efficiency and soil fertility in a single rice cropping system. Sci. Rep. 2020, 10, 10432. [Google Scholar] [CrossRef]
- Zhang, C.; Ju, X.T.; Powlson, D.; Oenema, O.; Smith, P. Nitrogen Surplus Benchmarks for Controlling N Pollution in the Main Cropping Systems of China. Environ. Sci. Technol. 2019, 53, 6678–6687. [Google Scholar] [CrossRef]
- Wu, H.; MacDonald, G.K.; Galloway, J.N.; Zhang, L.; Gao, L.; Yang, L.; Yang, J.; Li, X.; Li, H.; Yang, T. The influence of crop and chemical fertilizer combinations on greenhouse gas emissions: A partial life-cycle assessment of fertilizer production and use in China. Resour. Conserv. Recycl. 2021, 168, 105303. [Google Scholar] [CrossRef]
- Li, J.; Xing, J.L.; Ding, R.; Shi, W.J.; Shi, X.L.; Wang, X.Q. Systematic Evaluation of Nitrogen Application in the Production of Multiple Crops and Its Environmental Impacts in Fujian Province, China. Agriculture 2023, 13, 694. [Google Scholar] [CrossRef]
- Zhao, C.; Gao, B.; Wang, L.; Huang, W.; Xu, S.; Cui, S.H. Spatial patterns of net greenhouse gas balance and intensity in Chinese orchard system. Sci. Total Environ. 2021, 779, 146250. [Google Scholar] [CrossRef]
- Wang, H.; Zhang, D.; Zhang, Y.; Zhai, L.; Yin, B.; Zhou, F.; Geng, Y.; Pan, J.; Luo, J.; Gu, B.; et al. Ammonia emissions from paddy fields are underestimated in China. Environ. Pollut. 2018, 235, 482–488. [Google Scholar] [CrossRef]
- Gu, B.J.; Zhang, X.M.; Lam, S.K.; Yu, Y.L.; van Grinsven, H.J.M.; Zhang, S.H.; Wang, X.X.; Bodirsky, B.L.; Wang, S.T.; Duan, J.K.; et al. Cost-effective mitigation of nitrogen pollution from global croplands. Nature 2023, 613, 77–84. [Google Scholar] [CrossRef] [PubMed]
- Kang, J.; Wang, J.; Heal, M.R.; Goulding, K.; de Vries, W.; Zhao, Y.; Feng, S.; Zhang, X.; Gu, B.; Niu, X.; et al. Ammonia mitigation campaign with smallholder farmers improves air quality while ensuring high cereal production. Nat. Food 2023, 4, 751–761. [Google Scholar] [CrossRef] [PubMed]
- Ren, K.Y.; Xu, M.G.; Li, R.; Zheng, L.; Liu, S.G.; Reis, S.; Wang, H.Y.; Lu, C.A.; Zhang, W.J.; Gao, H.; et al. Optimizing nitrogen fertilizer use for more grain and less pollution. J. Clean Prod. 2022, 360, 132180. [Google Scholar] [CrossRef]
- Zhang, W.F.; Cao, G.X.; Li, X.L.; Zhang, H.Y.; Wang, C.; Liu, Q.Q.; Chen, X.P.; Cui, Z.L.; Shen, J.B.; Jiang, R.F.; et al. Closing yield gaps in China by empowering smallholder farmers. Nature 2016, 537, 671–674. [Google Scholar] [CrossRef] [PubMed]
Disclaimer/Publisher’s Note: The statements, opinions and data contained in all publications are solely those of the individual author(s) and contributor(s) and not of MDPI and/or the editor(s). MDPI and/or the editor(s) disclaim responsibility for any injury to people or property resulting from any ideas, methods, instructions or products referred to in the content. |
© 2024 by the authors. Licensee MDPI, Basel, Switzerland. This article is an open access article distributed under the terms and conditions of the Creative Commons Attribution (CC BY) license (https://creativecommons.org/licenses/by/4.0/).