
The Impact of Factor Price Change on China’s Cotton Production Pattern Evolution: Mediation and Spillover Effects

 ,
,  ,
,
Abstract
1. Introduction
2. Literature and Theoretical Framework
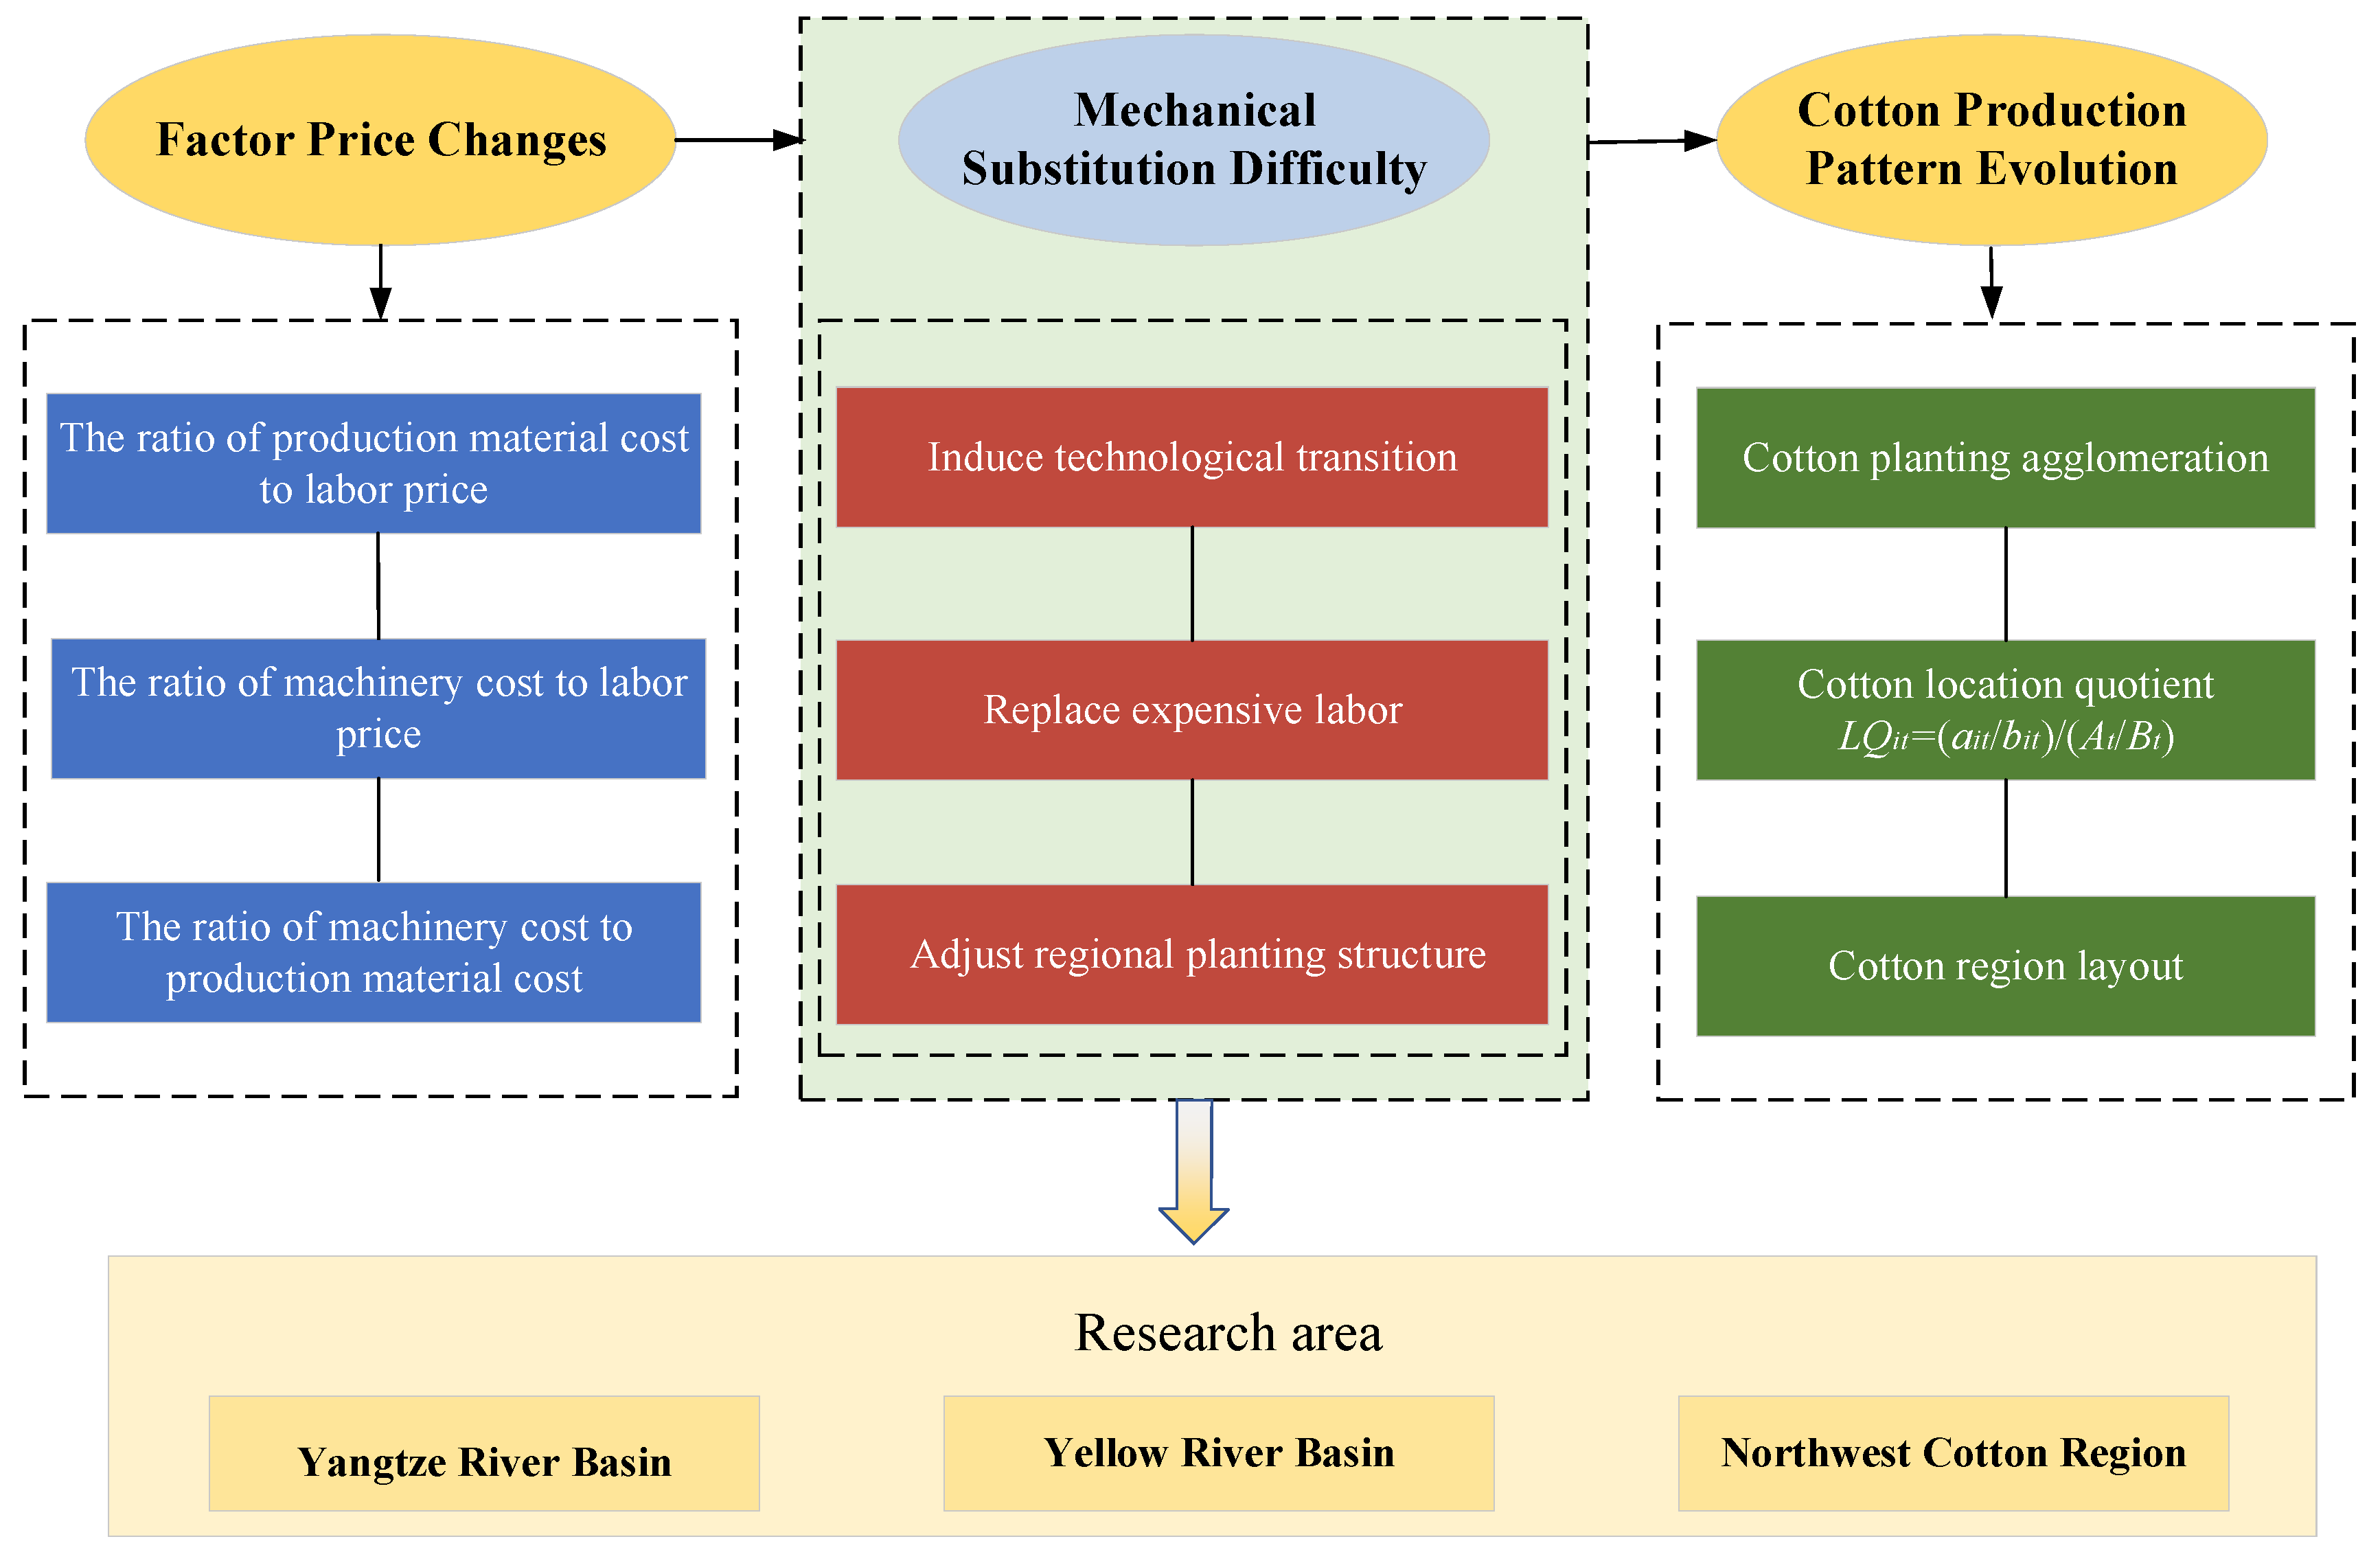
2.1. Effects of Factor Price Change on Cotton Production Pattern Evolution
2.2. Effects of Factor Price Change on Cotton Production Pattern through Mechanical Substitution Difficulty
3. Methodology and Data Sources
3.1. Methodology
3.1.1. Benchmark Model
3.1.2. Global Moran’s I Index
3.1.3. Spatial Economic Model
3.2. Selection of Variables
3.2.1. Explained Variables
3.2.2. Explanatory Variables
3.2.3. Mediating Variables
3.2.4. Control Variables
3.3. Data Sources
4. Empirical Results
4.1. Spatial Autocorrelation Test
4.2. Spatial Durbin Model Analysis
4.3. Spatial Spillover Effects Analysis
4.4. The Transfer Analysis of CPPE
5. Discussion
5.1. The Impacts of FPC and Drs on CPPE
5.2. Limitations and Prospects
5.3. Policy Implications
6. Conclusions
Author Contributions
Funding
Data Availability Statement
Conflicts of Interest
References
- Bakhsh, A.; Anayol, E.; Özcan, S.F.; Hussain, T.; Aasim, M.; Khawar, K.M.; Özcan, S. An Insight into Cotton Genetic Engineering (Gossypium hirsutum L.): Current Endeavors and Prospects. Acta Physiol. Plant. 2015, 37, 171. [Google Scholar] [CrossRef]
- Qian, J.; Li, H. Subsidy Policy Adjustment, Comparative Benefit Change and Farmers’ Cotton Production Decisions: Based on the Provincial Dynamic Panel Data of the Major Producing Areas. J. Hunan Agric. Univ. (Soc. Sci.) 2020, 21, 1–7. [Google Scholar] [CrossRef]
- Wang, W.; Zhang, C.M.; Song, J.H.; Xu, D.D. The Impact of Target Price Policy on Cotton Cultivation: Analysis of County-Level Panel Data from China. Agriculture 2021, 11, 988. [Google Scholar] [CrossRef]
- Zhao, X.; Yang, L.; Wang, L. Models for Evaluating the Resource Integration Capability of Textile Enterprise with Hesitant Fuzzy Uncertain Linguistic Information. J. Intell. Fuzzy Syst. 2016, 31, 2001–2008. [Google Scholar] [CrossRef]
- Lin, B.Q.; Chen, Y.; Zhang, G.L. Impact of Technological Progress on China’s Textile Industry and Future Energy Saving Potential Forecast. Energy 2018, 161, 859–869. [Google Scholar] [CrossRef]
- Feng, W.N.; Li, X.F.; Dong, H.L.; Qin, Y.K.; Sun, M.; Shao, J.J.; Zheng, C.S.; Li, P.C. Fruits-Based Critical Nitrogen Dilution Curve for Diagnosing Nitrogen Status in Cotton. Front. Plant Sci. 2022, 13, 801968. [Google Scholar] [CrossRef] [PubMed]
- Li, M.; Du, Y.; Zhang, F.; Bai, Y.; Fan, J.; Zhang, J.; Chen, S. Simulation of Cotton Growth and Soil Water Content Under Film-Mulched Drip Irrigation Using Modified Csm-Cropgro-Cotton Model. Agric. Water Manag. 2019, 218, 124–138. [Google Scholar] [CrossRef]
- Li, X.; Wang, B.; Sun, L.; Zhu, H.; Lv, N.; Zhang, J. The Transmission Effect Test of China’s Rotation Mechanism on the Cotton Reserve Market. Sustainability 2023, 15, 4247. [Google Scholar] [CrossRef]
- Rudenko, I.; Bekchanov, M.; Djanibekov, U.; Lamers, J.P.A. The Added Value of a Water Footprint Approach: Micro- and Macroeconomic Analysis of Cotton Production, Processing and Export in Water Bound Uzbekistan. Glob. Planet. Chang. 2013, 110, 143–151. [Google Scholar] [CrossRef]
- Li, H.-M.; Liu, S.-D.; Ge, C.-W.; Zhang, X.-M.; Zhang, S.-P.; Chen, J.; Shen, Q.; Ju, F.-Y.; Yang, Y.-F.; Li, Y.; et al. Analysis of Drought Tolerance and Associated Traits in Upland Cotton at the Seedling Stage. Int. J. Mol. Sci. 2019, 20, 3888. [Google Scholar] [CrossRef]
- Han, Z.G.; Hu, Y.; Tian, Q.; Cao, Y.W.; Si, A.J.; Si, Z.F.; Zang, Y.H.; Xu, C.Y.; Shen, W.J.; Dai, F.; et al. Genomic Signatures and Candidate Genes of Lint Yield and Fibre Quality Improvement in Upland Cotton in Xinjiang. Plant Biotechnol. J. 2020, 18, 2002–2014. [Google Scholar] [CrossRef]
- Li, Z.; Li, J. The Influence Mechanism and Spatial Effect of Carbon Emission Intensity in the Agricultural Sustainable Supply: Evidence from China’s Grain Production. Environ. Sci. Pollut. Res. 2022, 29, 44442–44460. [Google Scholar] [CrossRef]
- Günther, J.; Thevs, N.; Gusovius, H.J.; Sigmund, I.; Brückner, T.; Beckmann, V.; Abdusalik, N. Carbon and Phosphorus Footprint of the Cotton Production in Xinjiang, China, in Comparison to an Alternative Fibre (Apocynum) from Central Asia. J. Clean. Prod. 2017, 148, 490–497. [Google Scholar] [CrossRef]
- Chen, Z.K.; Tao, X.P.; Khan, A.; Tan, D.K.Y.; Luo, H.H. Biomass Accumulation, Photosynthetic Traits and Root Development of Cotton as Affected by Irrigation and Nitrogen-Fertilization. Front. Plant Sci. 2018, 9, 173. [Google Scholar] [CrossRef]
- Cheng, S.S.; Chen, P.Y.; Su, Z.Z.; Ma, L.; Hao, P.B.; Zhang, J.J.; Ma, Q.; Liu, G.Y.; Liu, J.; Wang, H.T.; et al. High-Resolution Temporal Dynamic Transcriptome Landscape Reveals a Ghcal-Mediated Flowering Regulatory Pathway in Cotton (Gossypium hirsutum L.). Plant Biotechnol. J. 2021, 19, 153–166. [Google Scholar] [CrossRef]
- Kang, X.; Huang, C.; Zhang, L.; Zhang, Z.; Lv, X. Downscaling Solar-Induced Chlorophyll Fluorescence for Field-Scale Cotton Yield Estimation by a Two-Step Convolutional Neural Network. Comput. Electron. Agric. 2022, 201, 107260. [Google Scholar] [CrossRef]
- Mahan, J.; Payton, P. An Agrocentric Analysis of Regional Rain Patterns as They Relate to a Rained Cotton Cropping System on the Southern High Plains of Texas. Agriculture 2017, 7, 93. [Google Scholar] [CrossRef]
- Cui, M.L.; Liu, C.; Piao, C.L.; Liu, C.L. A Stable Agrobacterium Rhizogenes-Mediated Transformation of Cotton (Gossypium hirsutum L.) and Plant Regeneration from Transformed Hairy Root via Embryogenesis. Front. Plant Sci. 2020, 11, 604255. [Google Scholar] [CrossRef] [PubMed]
- Basile, R.; Ciccarelli, C. The Location of the Italian Manufacturing Industry, 1871-1911: A Sectoral Analysis. J. Econ. Geogr. 2018, 18, 627–661. [Google Scholar] [CrossRef]
- Shao, L.; Gong, J.; Fan, W.; Zhang, Z.; Zhang, M. Cost Comparison between Digital Management and Traditional Management of Cotton Fields-Evidence from Cotton Fields in Xinjiang, China. Agriculture 2022, 12, 1105. [Google Scholar] [CrossRef]
- Mishra, P.K.; Sharma, A.; Prakash, A. Current Research and Development in Cotton Harvesters: A Review with Application to Indian Cotton Production Systems. Heliyon 2023, 9, e16124. [Google Scholar] [CrossRef] [PubMed]
- Baker, K.D.; Delhom, C.D.; Hughs, S.E. Spindle Diameter Effects for Cotton Pickers. Appl. Eng. Agric. 2017, 33, 321–327. [Google Scholar] [CrossRef]
- Huang, W.; Wu, F.; Han, W.; Li, Q.; Han, Y.; Wang, G.; Feng, L.; Li, X.; Yang, B.; Lei, Y.; et al. Carbon Footprint of Cotton Production in China: Composition, Spatiotemporal Changes and Driving Factors. Sci. Total Environ. 2022, 821, 153407. [Google Scholar] [CrossRef] [PubMed]
- Çullu, M.A.; Teke, M.; Aydogdu, M.H.; Günal, H. Effects of Subsidy and Regulation Policy on Soil and Water Resources of Cotton Planted Lands in Harran Plain, Turkey. Land Use Policy 2022, 120, 106288. [Google Scholar] [CrossRef]
- Li, N.; Lin, H.; Wang, T.; Li, Y.; Liu, Y.; Chen, X.; Hu, X. Impact of Climate Change on Cotton Growth and Yields in Xinjiang, China. Field Crops Res. 2020, 247, 107590. [Google Scholar] [CrossRef]
- Jans, Y.; von Bloh, W.; Schaphoff, S.; Mueller, C. Global Cotton Production under Climate Change—Implications for Yield and Water Consumption. Hydrol. Earth Syst. Sci. 2021, 25, 2027–2044. [Google Scholar] [CrossRef]
- Muhammad, N.; He, H.S.; Zong, S.W.; Du, H.B.; Satti, Z.; Tan, X.Y.; Qazi, M.Y. Spatial Pattern of Cotton Yield Variability and Its Response to Climate Change in Cotton Belt of Pakistan. Chin. Geogr. Sci. 2023, 33, 351–362. [Google Scholar] [CrossRef]
- Miao, R.Q.; Khanna, M.; Huang, H.X. Responsiveness of Crop Yield and Acreage to Prices and Climate. Am. J. Agric. Econ. 2016, 98, 191–211. [Google Scholar] [CrossRef]
- Shareef, M.; Gui, D.; Zeng, F.; Waqas, M.; Ahmed, Z.; Zhang, B.; Iqbal, H.; Xue, J. Nitrogen Leaching, Recovery Efficiency, and Cotton Productivity Assessments on Desert-Sandy Soil under Various Application Methods. Agric. Water Manag. 2019, 223, 105716. [Google Scholar] [CrossRef]
- Jung, Y. The Long Reach of Cotton in the Us South: Tenant Farming, Mechanization, and Low-Skill Manufacturing. J. Dev. Econ. 2020, 143, 102432. [Google Scholar] [CrossRef]
- Zhu, Y.Q.; Sun, L.; Luo, Q.Y.; Chen, H.Y.; Yang, Y.D. Spatial Optimization of Cotton Cultivation in Xinjiang: A Climate Change Perspective. Int. J. Appl. Earth Obs. Geoinf. 2023, 124, 103523. [Google Scholar] [CrossRef]
- Han, Y.; Wan, G.; Fan, Z.; Li, Y.; Feng, L.; Mao, S. Analysis of Key Climatic Factors Influencing on Seed Cotton Yield in Cotton-Wheat Double Cropping. Acta Ecol. Sin. 2013, 33, 3185–3191. [Google Scholar]
- Zhou, Y.; Li, F.; Xin, Q.; Li, Y.; Lin, Z. Historical Variability of Cotton Yield and Response to Climate and Agronomic Management in Xinjiang, China. Sci. Total Environ. 2024, 912, 169327. [Google Scholar] [CrossRef] [PubMed]
- Alkimim, A.; Sparovek, G.; Clarke, K.C. Converting Brazil’s Pastures to Cropland: An Alternative Way to Meet Sugarcane Demand and to Spare Forestlands. Appl. Geogr. 2015, 62, 75–84. [Google Scholar] [CrossRef]
- Huang, D.Y.; Zhu, Y.Y.; Yu, Q.Y. Spatial Spillover Effects of Agricultural Agglomeration on agricultural Non-Point Source Pollution in the Yangtze River Basin. Sustainability 2022, 14, 16390. [Google Scholar] [CrossRef]
- Renard, D.; Rhemtulla, J.M.; Bennett, E.M. Historical Dynamics in Ecosystem Service Bundles. Proc. Natl. Acad. Sci. USA 2015, 112, 13411–13416. [Google Scholar] [CrossRef]
- Shi, Y.; Yang, Q.; Zhou, L.; Shi, S. Can Moderate Agricultural Scale Operations Be Developed against the Background of Plot Fragmentation and Land Dispersion? Evidence from the Suburbs of Shanghai. Sustainability 2022, 14, 8697. [Google Scholar] [CrossRef]
- Xu, W.; Jin, X.; Liu, J.; Zhou, Y. Impact of Cultivated Land Fragmentation on Spatial Heterogeneity of Agricultural Agglomeration in China. J. Geogr. Sci. 2020, 30, 1571–1589. [Google Scholar] [CrossRef]
- Binswanger-Mkhize, H. The Measurement of Technological Change Biases with Many Factors of Production. Am. Econ. Rev. 1974, 6, 964–976. [Google Scholar]
- Hayami, Y.; Ruttan, V.W. Agricultural Development: An International Perspective; Johns Hopkins University Press: Baltimore, MD, USA; London, UK, 1985. [Google Scholar]
- Guo, S.B.; Zhang, Z.T.; Guo, E.J.; Fu, Z.Z.; Gong, J.J.; Yang, X.G. Historical and Projected Impacts of Climate Change and Technology on Soybean Yield in China. Agric. Syst. 2022, 203, 103522. [Google Scholar] [CrossRef]
- Zhi, J.J.; Cao, X.Y.; Zhang, Z.H.; Qin, T.T.; Qu, L.; Qi, L.Y.; Ge, L.W.; Guo, A.X.; Wang, X.T.; Da, C.; et al. Identifying the Determinants of Crop Yields in China since 1952 and Its Policy Implications. Agric. For. Meteorol. 2022, 327, 109216. [Google Scholar] [CrossRef]
- Lu, X.; Jia, X.; Niu, J. The Present Situation and Prospects of Cotton Industry Development in China. Sci. Agric. Sin. 2018, 51, 26–36. [Google Scholar]
- Liu, H.; Wang, X.; Wang, Z.; Cheng, Y. Does digitalization mitigate regional inequalities? Evidence from China. Geo Sus. 2024, 5, 52–63. [Google Scholar] [CrossRef]
- Chen, W.X.; Wang, G.Z.; Gu, T.C.; Fang, C.L.; Pan, S.P.; Zeng, J.; Wu, J.H. Simulating the Impact of Urban Expansion on Ecosystem Services in Chinese Urban Agglomerations: A Multi-Scenario Perspective. Environ. Impact Assess. Rev. 2023, 103, 107275. [Google Scholar] [CrossRef]
- Anselin, L. Lagrange Multiplier Test Diagnostics for Spatial Dependence and Spatial Heterogeneity. Geogr. Anal. 1988, 20, 1–17. [Google Scholar] [CrossRef]
- Wang, J.; Xiao, H. Spatio-Temporal Pattern and Its Driving Facdtors of Cotton Production in Xinjiang. J. China Agric. Resour. Reg. Plan. 2018, 39, 155. [Google Scholar]
- Feng, L.; Wan, S.; Zhang, Y.; Dong, H. Xinjiang Cotton: Achieving Super-High Yield through Efficient Utilization of Light, Heat, Water, and Fertilizer by Three Generations of Cultivation Technology Systems. Field Crops Res. 2024, 312, 109401. [Google Scholar] [CrossRef]
- Lu, H.; Dai, J.; Li, W.; Tang, W.; Zhang, D.; Eneji, A.E.; Dong, H. Yield and Economic Benefits of Late Planted Short-Season Cotton versus Full-Season Cotton Relayed with Garlic. Field Crops Res. 2017, 200, 80–87. [Google Scholar] [CrossRef]
- Baker, K.D.; Hughs, E.; Foulk, J. Cotton Quality as Affected by Changes in Spindle Speed. Appl. Eng. Agric. 2010, 26, 363–369. [Google Scholar] [CrossRef]
- Wang, X.B.; Yamauchi, F.; Huang, J.K. Rising Wages, Mechanization, and the Substitution between Capital and Labor: Evidence from Small Scale Farm System in China. Agric. Econ. 2016, 47, 309–317. [Google Scholar] [CrossRef]
- Zhang, X.B.; Yang, J.; Thomas, R. Mechanization Outsourcing Clusters and Division of Labor in Chinese Agriculture. China Econ. Rev. 2017, 43, 184–195. [Google Scholar] [CrossRef]
- Feng, L.; Chi, B.J.; Dong, H.Z. Cotton Cultivation Technology with Chinese Characteristics Has Driven the 70-Year Development of Cotton Production in China. J. Integr. Agric. 2022, 21, 597–609. [Google Scholar] [CrossRef]
- Xin, M.; Wang, Z.; Han, Y.; Fan, Z.; Feng, L.; Yang, B.; Li, X.; Wang, G.; Lei, Y.; Xing, F.; et al. Review, Status and Measures of Xinjiang Machine-Picked Cotton. J. Agric. Sci. Technol. 2021, 23, 11–20. [Google Scholar]
- Zhang, H.; Wu, J.; Wang, Z. Empirical Analysis of Evolution of Major Cotton-Growing Provinces and Its Reasons in China. Res. Agric. Mod. 2007, 28, 93–95. [Google Scholar]
- Yang, Z.N.; Tang, J.J.; Yu, M.; Zhang, Y.; Abbas, A.; Wang, S.D.; Bagadeem, S. Sustainable Cotton Production through Increased Competitiveness: Analysis of Comparative Advantage and Influencing Factors of Cotton Production in Xinjiang, china. Agronomy 2022, 12, 2239. [Google Scholar] [CrossRef]
- Saliou, I.O.; Zannou, A.; Aoudji, A.K.N.; Honlonkou, A.N. Drivers of Mechanization in Cotton Production in Benin, West Africa. Agriculture 2020, 10, 549. [Google Scholar] [CrossRef]
- Shi, X.Y.; Wang, C.; Zhao, J.C.; Wang, K.C.; Chen, F.; Chu, Q.Q. Increasing Inconsistency between Climate Suitability and Production of Cotton (Gossypium hirsutum L.) in China. Ind. Crops Prod. 2021, 171, 113959. [Google Scholar] [CrossRef]
- Arshad, M.U.; Yuanfeng, Z.; Hanif, S.; Fatima, F. Impact of Climate Change and Technological Advancement on Cotton Production: Evidence from Xinjiang Region, China. J. Agric. Sci. Technol. 2022, 24, 1519–1531. [Google Scholar] [CrossRef]
- Li, N.; Yao, N.; Li, Y.; Chen, J.Q.; Liu, D.L.; Biswas, A.; Li, L.C.; Wang, T.X.; Chen, X.G. A Meta-Analysis of the Possible Impact of Climate Change on Global Cotton Yield Based on Crop Simulation Approaches. Agric. Syst. 2021, 193, 103221. [Google Scholar] [CrossRef]
- Qian, B.; Jing, Q.; Smith, W.; Grant, B.; Cannon, A.J.; Zhang, X. Quantifying the Uncertainty Introduced by Internal Climate Variability in Projections of Canadian Crop Production. Environ. Res. Lett. 2020, 15, 074032. [Google Scholar] [CrossRef]


| Variables | Symbols | Mean | Standard Deviation | Minimum Value | Maximum Value |
|---|---|---|---|---|---|
| Cotton location quotient | LQ | 1.653 | 3.124 | 0.004 | 21.857 |
| The average labor price (CNY) | Labor | 636.687 | 647.025 | 0.176 | 2634.060 |
| The average production material cost (CNY) | Prod | 254.805 | 166.218 | 3.135 | 1708.580 |
| The average mechanical cost (CNY) | Mach | 28.928 | 37.626 | 0.000 | 263.830 |
| Cotton planting area (Thousand Hectares) | Area | 327.256 | 431.684 | 0.300 | 2540.500 |
| Price ratio of production materials cost to labor price | PRL | 0.832 | 1.332 | 0.015 | 17.848 |
| Price ratio of mechanical cost to labor price | MAL | 0.328 | 2.846 | 0.000 | 50.496 |
| Price ratio of mechanical cost to production materials cost | MAP | 0.134 | 0.248 | 0.000 | 2.829 |
| Mechanical substitution difficulty | Dcs | 1.928 | 5.083 | 0.000 | 67.395 |
| Proportion of disaster-affected area to total planting area (%) | Dar | 0.264 | 0.148 | 0.010 | 0.756 |
| Proportion of effective irrigated area to total planting area (%) | Pia | 0.410 | 0.167 | 0.222 | 1.005 |
| Cotton yield per hectare (kilograms per hectare) | Pmy | 1073.234 | 331.842 | 346.900 | 2088.470 |
| Comparative benefits of grain and cotton | GPadt−1 | 0.669 | 3.054 | 0.066 | 68.074 |
| Major Cotton Planting Region | Province | Population |
|---|---|---|
| Yangtze River Basin | Jiangsu | 8505 |
| Zhejiang | 6540 | |
| Anhui | 6113 | |
| Jiangxi | 4517 | |
| Hunan | 9883 | |
| Sichuan | 8372 | |
| Hubei | 5830 | |
| Yellow River Basin | Shanxi | 3480 |
| Henan | 9883 | |
| Hebei | 7448 | |
| Shandong | 10,170 | |
| Shaanxi | 3954 | |
| Northwest Inland | Xinjiang | 2589 |
| Gansu | 2490 |
| Variable | Description | Source | Link |
|---|---|---|---|
| LQ | Cotton location quotient | China Statistical Yearbook | https://data.stats.gov.cn/ (accessed on 1 May 2023) |
| Frb | The ratio of production material cost to labor price | National Compilation of Cost-Benefit Data for Agricultural Products | https://www.ndrc.gov.cn/fzggw/jgsj/jgs/ (accessed on 1 May 2023) |
| Lfm | The ratio of mechanical cost to labor price | National Compilation of Cost-Benefit Data for Agricultural Products | https://www.ndrc.gov.cn/fzggw/jgsj/jgs/ (accessed on 1 May 2023) |
| Mbr | The ratio of mechanical cost to production material cost | National Compilation of Cost-Benefit Data for Agricultural Products | https://www.ndrc.gov.cn/fzggw/jgsj/jgs/ (accessed on 1 May 2023) |
| Dcs | Mechanical substitution difficulty | National Compilation of Cost-Benefit Data for Agricultural Products | https://www.ndrc.gov.cn/fzggw/jgsj/jgs/ (accessed on 1 May 2023) |
| Dar | The natural conditions for agricultural production | National Bureau of Statistics | https://data.stats.gov.cn/ (accessed on 1 May 2023) |
| Pia | The degree of irrigation conditions | National Bureau of Statistics | https://data.stats.gov.cn/ (accessed on 1 May 2023) |
| Pmy | The per-unit yield level | National Bureau of Statistics | https://data.stats.gov.cn/ (accessed on 1 May 2023) |
| Gpad | Comparative benefits of grain and cotton | National Compilation of Cost-Benefit Data for Agricultural Products | https://www.ndrc.gov.cn/fzggw/jgsj/jgs/ (accessed on 1 May 2023) |
| Bee | The ratio of beet to cotton net output | National Compilation of Cost-Benefit Data for Agricultural Products | https://www.ndrc.gov.cn/fzggw/jgsj/jgs/ (accessed on 1 May 2023) |
| Pea | The ratio of peanut to cotton net output | National Compilation of Cost-Benefit Data for Agricultural Products | https://www.ndrc.gov.cn/fzggw/jgsj/jgs/ (accessed on 1 May 2023) |
| Rap | The ratio of rapeseed to cotton net output | National Compilation of Cost-Benefit Data for Agricultural Products | https://www.ndrc.gov.cn/fzggw/jgsj/jgs/ (accessed on 1 May 2023) |
| Year | Moran’s I | Year | Moran’s I | Year | Moran’s I |
|---|---|---|---|---|---|
| 1985 | 0.230 ** (0.16) | 1998 | −0.025 (0.084) | 2011 | 0.008 (0.08) |
| 1986 | 0.141 * (0.159) | 1999 | −0.015 (0.079) | 2012 | 0.014 (0.078) |
| 1987 | 0.141 * (0.158) | 2000 | −0.01 (0.083) | 2013 | 0.016 (0.076) |
| 1988 | 0.202 ** (0.159) | 2001 | 0.000 (0.085) | 2014 | 0.021 * (0.073) |
| 1989 | 0.176 * (0.158) | 2002 | −0.001 (0.09) | 2015 | 0.022 * (0.071) |
| 1990 | 0.138 * (0.156) | 2003 | 0.006 (0.097) | 2016 | 0.023 * (0.069) |
| 1991 | 0.133 (0.153) | 2004 | 0.015 (0.101) | 2017 | 0.028 * (0.068) |
| 1992 | 0.083 (0.147) | 2005 | 0.007 (0.093) | 2018 | 0.031 * (0.067) |
| 1993 | −0.032 (0.123) | 2006 | 0.005 (0.086) | 2019 | 0.032 * (0.067) |
| 1994 | −0.025 (0.113) | 2007 | 0.008 (0.078) | 2020 | 0.033 * (0.067) |
| 1995 | −0.027 (0.115) | 2008 | 0.007 (0.085) | 2021 | 0.035 ** (0.066) |
| 1996 | −0.024 (0.099) | 2009 | 0.005 (0.089) | ||
| 1997 | −0.041 (0.093) | 2010 | 0.005 (0.082) |
| Model | Test | Statistic | p-Value |
|---|---|---|---|
| SAR & SDM | Wald_spatial | 47.61 *** | 0.000 |
| LR_spatial | 47.66 *** | 0.000 | |
| SEM & SDM | Wald_spatial | 25.31 *** | 0.000 |
| LR_spatial | 58.99 *** | 0.000 |
| Variables | Unfixed Effects | Individual Fixed Effects | Two-Way Fixed Effects | Variables | Unfixed Effects | Individual Fixed Effects | Two-Way Fixed Effects |
|---|---|---|---|---|---|---|---|
| PRL | −0.336 *** | −0.335 *** | −0.315 *** | W×PRL | 0.021 | 0.020 | 0.109 |
| (0.056) | (0.055) | (0.059) | (0.122) | (0.120) | (0.144) | ||
| MAL | 0.102 *** | 0.101 *** | 0.082 *** | W×MAL | −0.014 | −0.012 | −0.071 |
| (0.024) | (0.024) | (0.025) | (0.057) | (0.057) | (0.062) | ||
| MAP | 0.216 | 0.247 | 0.491 ** | W×MAP | −0.733 ** | −0.749 ** | −0.240 |
| (0.194) | (0.191) | (0.228) | (0.298) | (0.295) | (0.519) | ||
| Dcs | −0.032 * | −0.034 ** | −0.053 *** | W×Dcs | 0.026 | 0.029 | −0.057 * |
| (0.017) | (0.016) | (0.017) | (0.022) | (0.022) | (0.032) | ||
| Dar | 0.102 | 0.113 * | 0.137 ** | W×Dar | 0.274 *** | 0.257 *** | 0.291 *** |
| (0.063) | (0.062) | (0.061) | (0.093) | (0.092) | (0.112) | ||
| Pia | −0.615 ** | −0.827 *** | −1.436 *** | W×Pia | −1.219 *** | −1.125 *** | −3.578 *** |
| (0.281) | (0.274) | (0.291) | (0.437) | (0.435) | (0.659) | ||
| Pmy | 0.215 | 0.210 | 0.155 | W×Pmy | 0.227 | 0.253 | −0.239 |
| (0.151) | (0.149) | (0.152) | (0.214) | (0.212) | (0.299) | ||
| Gpadt−1 | −0.156 *** | −0.158 *** | −0.158 *** | W×Gpadt−1 | 0.187 *** | 0.195 *** | 0.124 |
| (0.052) | (0.051) | (0.056) | (0.070) | (0.069) | (0.088) | ||
| sigma2 | 0.325 *** | 0.316 *** | 0.295 *** | ρ | 0.369 *** | 0.368 *** | 0.305 *** |
| (0.021) | (0.020) | (0.019) | (0.047) | (0.047) | (0.052) | ||
| R2 | 0.018 | 0.004 | 0.001 | N | 518 | 518 | 518 |
| Variables | Direct Effect | Indirect Effect | Total Effect | Variables | Direct Effect | Indirect Effect | Total Effect |
|---|---|---|---|---|---|---|---|
| PRL | −0.311 *** | 0.032 | −0.279 | Dar | 0.171 *** | 0.447 *** | 0.618 *** |
| (0.067) | (0.199) | (0.241) | (0.060) | (0.155) | (0.173) | ||
| MAL | 0.076 *** | −0.067 | 0.010 | Pia | −1.826 *** | −5.395 *** | −7.221 *** |
| (0.028) | (0.088) | (0.105) | (0.303) | (1.015) | (1.190) | ||
| MAP | 0.498 ** | −0.145 | 0.354 | Pmy | 0.134 | −0.285 | −0.151 |
| (0.252) | (0.758) | (0.938) | (0.165) | (0.399) | (0.478) | ||
| Dcs | −0.061 *** | −0.098 ** | −0.158 *** | Gpadt−1 | −0.153 *** | 0.097 | −0.056 |
| (0.018) | (0.047) | (0.054) | (0.059) | (0.123) | (0.157) |
| Variables | Yangtze River Basin | Yellow River Basin | Northwest Inland | Variables | Yangtze River Basin | Yellow River Basin | Northwest Inland |
|---|---|---|---|---|---|---|---|
| PRL | −0.261 *** | −0.024 | −0.375 | W×PRL | −1.239 *** | −0.892 * | 0.123 |
| (0.055) | (0.211) | (0.278) | (0.308) | (0.519) | (0.279) | ||
| MAL | 0.086 *** | −1.313 | 3.296 * | W×MAL | 2.955 ** | 5.695 | −4.952 *** |
| (0.017) | (2.287) | (1.691) | (1.335) | (6.065) | (1.664) | ||
| MAP | −0.298 * | 3.197 * | −4.527 ** | W×MAP | −1.554 *** | 4.683 | 4.747 ** |
| (0.178) | (1.724) | (2.291) | (0.403) | (3.451) | (2.288) | ||
| Dcs | 0.019 | 0.034 | −0.020 | W×Dcs | 0.046* | 0.072 | 0.002 |
| (0.015) | (0.021) | (0.024) | (0.028) | (0.050) | (0.024) | ||
| Dar | 0.196 *** | −0.234 *** | 0.093 | W×Dar | 0.455 *** | −0.746 *** | 0.075 |
| (0.053) | (0.074) | (0.102) | (0.116) | (0.167) | (0.102) | ||
| Pia | −1.191 *** | 2.053 *** | 0.793 | W×Pia | −2.519 *** | 5.554 *** | −0.282 |
| (0.234) | (0.581) | (0.596) | (0.387) | (1.413) | (0.599) | ||
| Pmy | 0.541 *** | 0.146 | 0.929 *** | W×Pmy | 1.552 *** | −1.096 ** | 0.384 |
| (0.126) | (0.188) | (0.332) | (0.297) | (0.445) | (0.339) | ||
| Gpadt−1 | −0.057 | 0.019 | −0.233 ** | W×Gpadt−1 | 0.345 ** | 0.232 * | −0.034 |
| (0.074) | (0.056) | (0.119) | (0.164) | (0.139) | (0.120) | ||
| Rapt−1 | −0.016 | Rapt−1 | 0.261 * | ||||
| (0.079) | (0.144) | ||||||
| Peat−1 | −0.410 *** | Peat−1 | −1.416 *** | ||||
| (0.044) | (0.107) | ||||||
| Beet−1 | 0.127 | Beet−1 | −0.201 | ||||
| (0.138) | (0.138) | ||||||
| sigma2 | 0.083 *** | 0.058 *** | 0.081 *** | ρ | −0.196 * | −0.565 *** | 0.044 |
| (0.007) | (0.006) | (0.013) | (0.116) | (0.096) | (0.082) | ||
| R2 | 0.467 | 0.088 | 0.859 | N | 259 | 185 | 74 |
| Hypothesis Number | Hypothesis Content | Research Findings | Results Description |
|---|---|---|---|
| 1 | CPPE demonstrates a spatial agglomeration, and FPC has a significant spatial effect on CPPE. | The global Moran’s index of LQ across most years from 1985 to 2021 was significantly positive, indicating that CPPE has spatial autocorrelation. In spatial analysis, the spatial autoregressive coefficient ρ was significantly positive, and the coefficients of FPC (PRL, MAL, MAP) were significant. | The results support Hypothesis 1 |
| 2 | The higher difficulty of mechanical substitution exerted an inhibitory effect on cotton production | The coefficient of Dsc is significantly negative, leading to the migration of the cotton region transfer. | The results support Hypothesis 2 |
Disclaimer/Publisher’s Note: The statements, opinions and data contained in all publications are solely those of the individual author(s) and contributor(s) and not of MDPI and/or the editor(s). MDPI and/or the editor(s) disclaim responsibility for any injury to people or property resulting from any ideas, methods, instructions or products referred to in the content. |
© 2024 by the authors. Licensee MDPI, Basel, Switzerland. This article is an open access article distributed under the terms and conditions of the Creative Commons Attribution (CC BY) license (https://creativecommons.org/licenses/by/4.0/).
Share and Cite
Zhang, X.; Zhou, X.; Liu, H.; Zhang, J.; Zhang, J.; Wei, S. The Impact of Factor Price Change on China’s Cotton Production Pattern Evolution: Mediation and Spillover Effects. Agriculture 2024, 14, 1145. https://doi.org/10.3390/agriculture14071145
Zhang X, Zhou X, Liu H, Zhang J, Zhang J, Wei S. The Impact of Factor Price Change on China’s Cotton Production Pattern Evolution: Mediation and Spillover Effects. Agriculture. 2024; 14(7):1145. https://doi.org/10.3390/agriculture14071145
Chicago/Turabian StyleZhang, Xuewei, Xiqing Zhou, Haimeng Liu, Jinghao Zhang, Jingde Zhang, and Suhao Wei. 2024. "The Impact of Factor Price Change on China’s Cotton Production Pattern Evolution: Mediation and Spillover Effects" Agriculture 14, no. 7: 1145. https://doi.org/10.3390/agriculture14071145
APA StyleZhang, X., Zhou, X., Liu, H., Zhang, J., Zhang, J., & Wei, S. (2024). The Impact of Factor Price Change on China’s Cotton Production Pattern Evolution: Mediation and Spillover Effects. Agriculture, 14(7), 1145. https://doi.org/10.3390/agriculture14071145