Article

Assessing the Contribution of Smallholder Irrigation to Household Food Security in Zimbabwe

by
Norman Mupaso
1,*,
Godswill Makombe
2,
Raymond Mugandani
3,* and
Paramu L. Mafongoya
4
1
Department of Agricultural Economics and Development, Midlands State University, Gweru P.O. Box 9055, Zimbabwe
2
Gordon Institute of Business Science, University of Pretoria, Lynnwood Rd, Hatfield, Pretoria 0002, South Africa
3
Department of Lands and Water Resources Management, Midlands State University, Gweru P.O. Box 9055, Zimbabwe
4
School of Agriculture, Earth and Environmental Sciences, University of KwaZulu-Natal, Pietermaritzburg 3201, South Africa
*
Authors to whom correspondence should be addressed.
Agriculture 2024, 14(4), 617; https://doi.org/10.3390/agriculture14040617
Submission received: 7 March 2024 / Revised: 11 April 2024 / Accepted: 12 April 2024 / Published: 16 April 2024
(This article belongs to the Section Agricultural Economics, Policies and Rural Management)

Abstract

:
Sustainable Development Goal (SDG) 2 seeks to end hunger and guarantee food and nutrition security worldwide by 2030. Smallholder irrigation development remains a key strategy to achieve SDG 2. This study assesses how smallholder irrigation contributes to household food security in Mberengwa district, Zimbabwe. Primary data were gathered from a randomly chosen sample of 444 farmers (344 irrigators and 100 non-irrigators) using a structured questionnaire. Microsoft Excel and Statistical Package for Social Sciences version 27 software packages were used to analyse the data. Descriptive statistics, chi-square test, t-test, and binary logistic regression were performed. The t-test results show significant differences in mean between irrigators and non-irrigators for household size, the dependency ratio, farming experience, farm income, food expenditure share, and livestock owned (p < 0.05). Irrigators had significantly higher area planted, yield, and quantity sold for maize during the summer than non-irrigators (p < 0.05). Food Consumption Score results show that 97% of irrigators and 45% of non-irrigators were food secure. Binary logistic regression results reveal a significant association between food security and household size, irrigation access, and farm income (p < 0.05). In conclusion, access to smallholder irrigation increases household food security. The government and its development partners should prioritise investments in smallholder irrigation development, expansion, and rehabilitation.

1. Introduction

The United Nations’ Sustainable Development Goal (SDG) 2 seeks to end hunger, guarantee food security and improved nutrition, and advance sustainable agriculture for all people in the world by the year 2030 [1,2]. To achieve SDG 2, there is a need to improve food production, distribution, and access [1,2,3]. Global targets for SDG 2 are hindered by poverty, climate change, conflicts, economic instability, natural disasters, and the COVID-19 pandemic [1,4]. All these factors impede food production and distribution and make it more difficult for people to acquire the food they require [1,4]. Access to food is a problem in most countries in the developing world [2]. The percentage of people suffering from hunger in Africa is almost 20% (257 million individuals); out of this number, 237 million reside in Sub-Saharan Africa (SSA) [1]. In comparison, the rate of hunger is 3% in North America and Europe, 6% in Oceania, 9% in Latin America and the Caribbean, and 9% in Asia [1,2]. Global food insecurity has been increasing since 2014, and if the current patterns continue, an estimated 670 million people will be undernourished by 2030 [2].
Food security is defined as a situation where everyone has physical, economic, and social access to enough food that is safe, nourishing, and meets their dietary needs and preferences for an active and healthy life [2,3]. Food security has four dimensions, namely, stability, availability, access, and utilisation [3,4,5]. Food availability means the physical existence of enough amounts and quality of food, whether locally produced or imported [4]. Access means the ability of a household to obtain food, both physically and financially [3]. Utilization refers to whether households have the resources and knowledge to prepare and consume food safely and healthily to meet all physiological needs [4]. Stability refers to whether the food system can withstand shocks like natural disasters, economic downturns, or conflicts [2,5]. Food security may be attained by addressing all these dimensions. Food security is influenced by several variables, including population growth, income, global warming, climate change, a lack of arable land, poor soils, insufficient water for irrigation, technological obstacles, conflict, and poverty [1]. A food-secure household can consistently obtain adequate and diverse foods to meet its nutritional needs [4]. Household food insecurity can result in hunger, malnutrition, poor health, and, in extreme cases, can even lead to death [2].
Food security and agriculture are closely related [6]. This is mainly due to the agriculture sector’s role in producing food in the economy. In addition, most of the undernourished populations in the world are smallholder farmers [7]. Consequently, there is a growing interest among stakeholders to comprehend how agriculture interventions might enhance the nutritional status of smallholder farmers in developing nations [7]. Investments in smallholder irrigation are commonly used as a tool to address concerns over food and nutrition insecurity by most governments and development partners in developing countries [3,8]. Access to smallholder irrigation enables farmers to cultivate a wider range of crops, increase production and productivity, provide jobs, and increase farm incomes, which can ultimately improve overall food security [9,10,11]. Irrigation technology reduces households’ vulnerability to changing rainfall and temperature patterns [12].
However, the provision of irrigation infrastructure alone does not guarantee that all farmers in a given area will be able to take full advantage of it. While some farmers may have favourable conditions (such as the availability of water and financial resources) to take advantage of irrigation infrastructure, others may face constraints, limiting their ability to benefit from irrigation [8,9]. Addressing these constraints through targeted interventions, such as providing access to finance, training, and infrastructure maintenance support, can help more farmers in rural communities maximise the advantages of irrigation infrastructure [3,8,9]. While higher income and wealth can provide advantages for farmers to invest in and maintain irrigation infrastructure, it does not mean that farmers with limited resources cannot benefit [3]. Governments, development agencies, and other stakeholders play a crucial role in providing support mechanisms, creating an enabling environment, and ensuring equitable access to irrigation opportunities for farmers across income and wealth spectrums [3].
Research studies show that having access to smallholder irrigation improves household food security. For example, Adeniyi and Dinbabo [13] studied the determinants of food security amongst smallholder irrigators in Northwest Nigeria. Using a structured questionnaire, primary data were gathered from 306 randomly chosen households. Food security was assessed using a combination of the Household Dietary Diversity Score (HDDS) and the Food Consumption Score (FCS). A multivariate regression model was used to investigate variables associated with food security. The findings revealed that 55% of the farmers were food secure. There was a significant association between livestock ownership, farming experience, farm size, education, training, income, and household food security. In addition, Adeniyi and Dinbabo [13] evaluated the efficiency, food security, and differentiation of small-scale irrigation agriculture in Northwest Nigeria. Their study evaluated the households’ FCSs and the technical efficiency of the farmers. A random sample of 306 smallholder farmers provided the primary data. A multinomial regression model, a segmentation strategy utilising cluster analysis, and Pearson correlation analysis were all used to analyse the data. Most households were food secure, with a mean technical efficiency of approximately 86%. The observed variations in efficiency, income, and food security were due to variations in household characteristics. The findings from these research studies are consistent as they imply that smallholder irrigation improves household food security. Similarly, Ogunniyi et al. [14] evaluated the effect of irrigation technology adoption on crop yield, crop income, and household food security in Nigeria using the treatment-effect approach. Primary data were gathered from a sample of 2305 households and analysed using a combination of PSM and logistic regression. The findings show that access to irrigation contributes positively to income, crop yield, and food security.
Research conducted by Balana et al. [15] in northern Ghana revealed that small-scale irrigation improved household nutrition significantly. Their study used a farm simulation model to evaluate the economic viability and potential of small-scale irrigation to increase income and nutrition. The results revealed that the adoption of irrigation increased net farm profit by 154%. Likewise, Wondimagegnhu and Bogale [8] carried out a comparative study on the impact of small-scale irrigation on food security in Northwest Ethiopia. A questionnaire was used to collect data from a total of 185 randomly chosen households (84 irrigators and 101 non-irrigators). Data were analysed using a household food balance model, descriptive analysis, and binary logit regression. About 85% of irrigators and 65% of non-irrigators were food secure. The size of farmland, household size, access to credit, irrigation, and income from rainfed crops were found to significantly impact household food security. Their study concluded that access to irrigation improves household food security.
Mhembwe, Chiunya, and Dube [10] researched the impact of small-scale irrigation schemes on household food security in Shurugwi district, Zimbabwe. A qualitative method was applied in the investigation. Primary data were gathered from 40 participants who were purposively chosen. A total of 32 irrigators and eight government representatives from the Department of Agritex, Mechanisation and Irrigation, and the District Administrator’s office participated in their study. Data analysis was conducted using thematic analysis. The findings show that irrigation projects improve food security and farm incomes significantly transforming the lives of rural farmers. The study concluded that having access to irrigation improves food security. The researchers recommended that the government and its development partners should establish new irrigation schemes and rehabilitate the dilapidated ones.
Research conducted by Chidavaenzi, Mazenda, and Ndlovu [9] in Chipinge, Zimbabwe, assessed how households cope with food shortages and their resilience. Their study aimed to investigate the impact of drip irrigation on income, food security, and nutrition. The researchers used a mixed methods approach. A semi-structured questionnaire was administered to 40 irrigators, and a focus group discussion was also conducted. Data were analysed using descriptive statistics, the Mann–Whitney U test, and Kruskal–Wallis H non-parametric tests. The study found that implementing drip irrigation led to increased household income, food production, and improved nutrition. The availability of cheap labour and extension support were identified as the main success factors of the drip irrigation project. The study concluded that developing irrigation systems is necessary to reduce household food insecurity.
Food and nutrition insecurity remains a global concern and is more prevalent among SSA countries, including Zimbabwe [2]. Thus, the Zimbabwean government pledges in its National Development Strategy 1 (NDS 1) to support and guarantee food and nutrition security for every citizen [16]. The NDS 1 seeks to enhance food self-sufficiency from 45% to 100% (between the years 2019 and 2025), reduce food insecurity to less than 10%, and restore the country’s bread basket status by the year 2025 [16]. In Zimbabwe, an estimated 29% of the urban population (1.5 million people) and 19% of the rural population (1.9 million people) are food insecure [17,18]. It is reported that the high rate of poverty is the leading cause of food and nutrition insecurity in the country [18]. Approximately 71% of the population is classified as poor, with 29% of them being extremely poor based on the local Total Consumption Poverty Line (TCPL), which is set at USD 2.31 per day [19,20]. Furthermore, food and nutrition insecurity were made worse by the COVID-19 pandemic’s disruption of the nation’s food supply systems [4]. As part of its strategies to enhance food and nutrition security, the Zimbabwean government has prioritised the development of smallholder irrigation and the rehabilitation of dilapidated irrigation infrastructure, as stipulated in NDS 1 [16]. The government aims to increase the land area equipped for irrigation to at least 350,000 ha by 2025, which is more than a 90% increase from the current 180,000 ha [16]. However, a few current studies have assessed the impact of these irrigation investments on food security in Zimbabwe [9,10]. This study aims to investigate the relationship between smallholder irrigation and household food security in Zimbabwe. This study provides a valuable resource for policymakers, researchers, organizations, and individuals interested in understanding the connection between smallholder irrigation projects and food security.

2. Materials and Methods

2.1. Research Approach
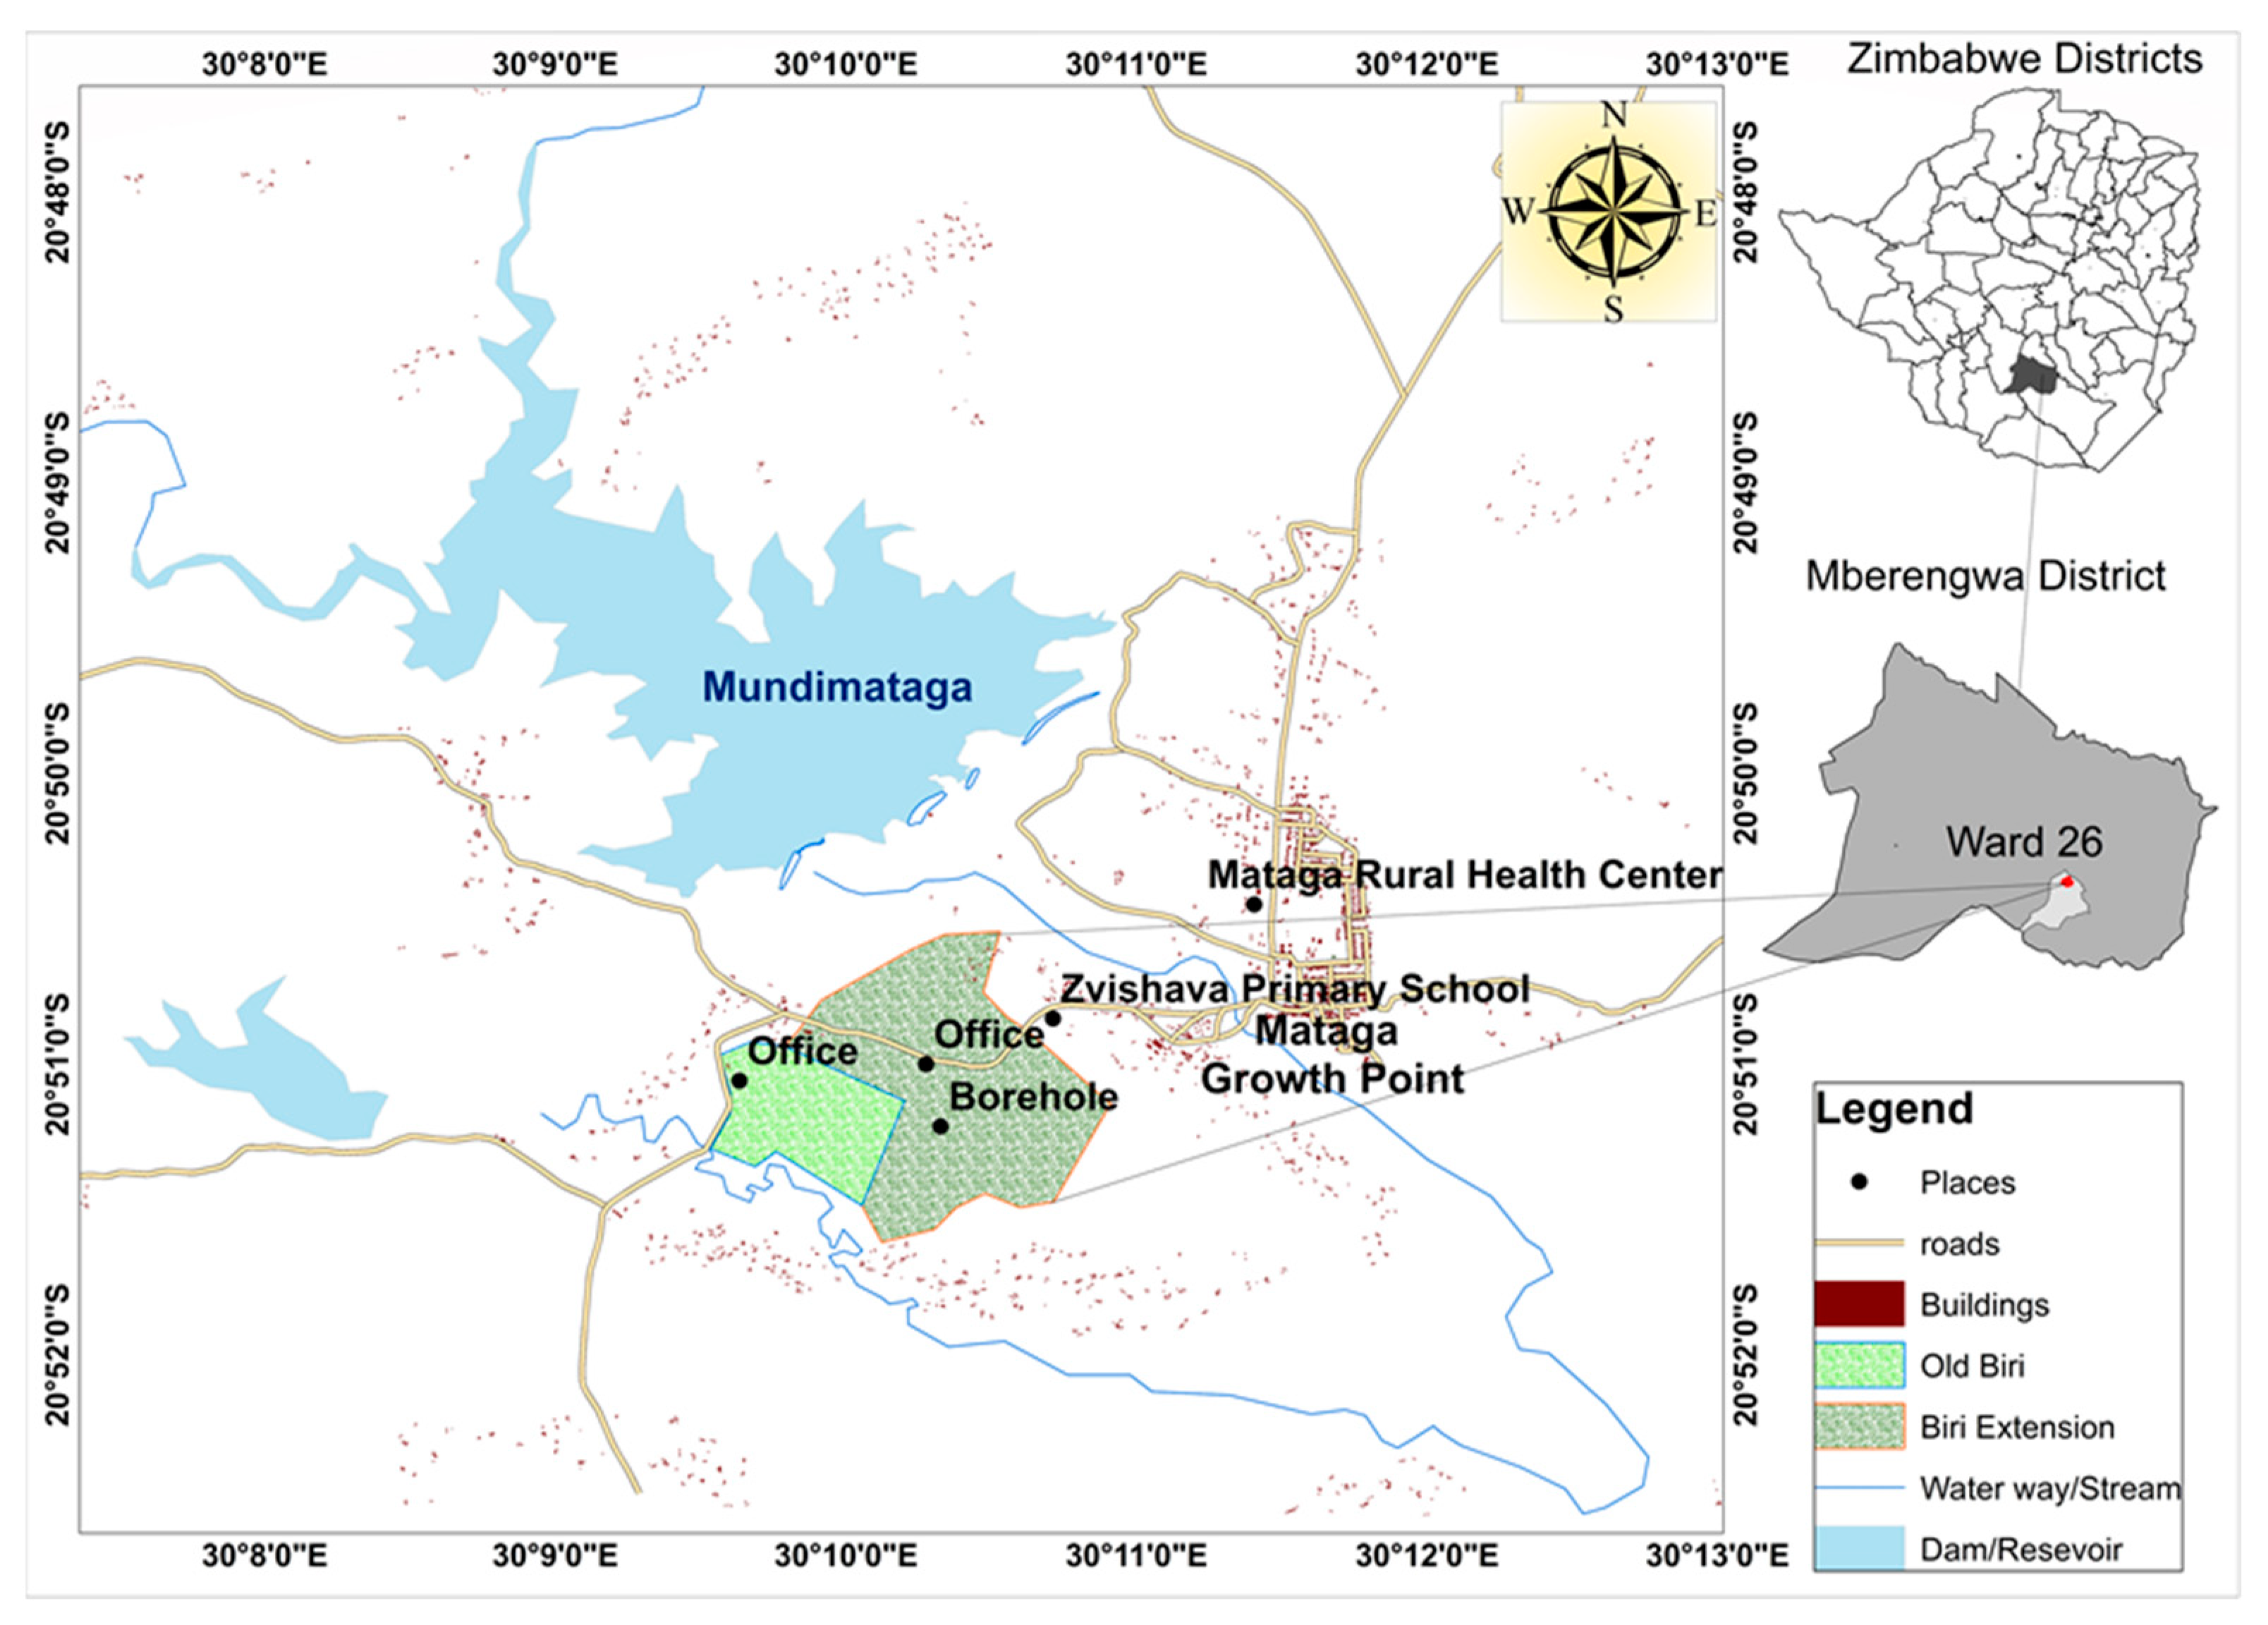
This study employed a quantitative approach to assess the contribution of smallholder irrigation to household food security. The quantitative approach refers to empirical research that uses numerical data to determine causal and correlative relationships between variables [21]. Quantitative researchers argue that observations must be collected and measured for repeated incidences of social phenomena [22]. Identifying a specific social phenomenon is possible when variables are observed over a large number of cases [21]. Thus, quantitative researchers use statistically representative samples to enhance their confidence in the findings and generalise about the empirical world [21]. Since quantitative research is objective and value-free, it focuses on social behaviour characteristics that are quantifiable and systematic rather than merely determining and interpreting their meanings [23].

2.2. Study Area

The study sites were Old-Biri and Biri-Extension irrigation schemes located in the Mberengwa district of the Midlands Province in Zimbabwe (Figure 1). The study sites were purposively selected considering that they are functional irrigation schemes located in a semiarid agroecological region where irrigated farming is vital for food production [24,25]. Agroecological zones are geographical areas that exhibit distinct combinations of uniform agro-climate, biodiversity, soil composition, and farming practices [24]. Mberengwa has an average annual rainfall range of 450–600 mm [24]. The study area’s prevalence of poverty is predicted to be 31.6% based on Zimbabwe’s TCPL of USD 2.31 per day [19]. Old-Biri and Biri-Extension irrigation schemes are located nearby and separated by a road. The Old-Biri irrigation scheme consists of 71 beneficiaries owning an average irrigated plot of 0.5 hectares (ha). The scheme was commissioned in 1988 and uses a gravity irrigation system to irrigate 40.2 ha [26]. The scheme draws its water from Biri Dam. The Biri-Extension irrigation scheme has 280 beneficiaries and was commissioned in 2005. The scheme also uses a gravity irrigation system to irrigate 117 ha with the potential to extend to 131 ha [26]. The scheme draws its water from the Mundi Mataga Dam. The main summer crops grown at the schemes are maize (Zea mays), sugar beans (Phaseolus vulgaris), and groundnuts (Arachis hypogaea), while the main winter crops grown are wheat (Triticum aestivum), green mealies (Zea mays), cucumbers (Cucumis sativus), tomatoes (Solanum lycopersicum), cabbage (Brassica oleracea), okra (Abelmoschus esculentus), and potatoes (Solanum tuberosum). The farmers in both irrigation schemes also rear cattle, goats, sheep, donkeys, and various types of poultry.

2.3. Selection of Respondents

The targeted population was all the irrigators in communal irrigation schemes located in semi-arid to arid agro-ecological regions IV and V of Zimbabwe, which receive an average of less than 650 mm of rainfall per annum [24]. The estimated population of smallholder irrigators in these regions is 5000 farmers. An acceptable representative sample size was established using Slovin’s formula [27]. Assuming a confidence level of 95%, and a 5% precision level, the statistically representative sample size was calculated to be 370 irrigators (Equation (1)).
n = N 1 + N ( e ) 2 = 5000 1 + 5000 ( 0.05 ) 2   = 370   i r r i g a t o r s  
where n = sample size, N = population size, and e = level of precision. Using Equation (1), the required sample size for this study is 370 irrigators. The total number of irrigators in the Old-Biri and Biri-Extension irrigation schemes is 351 farmers. Thus, all the irrigators in both irrigation schemes were included in the sample. In addition, a control group of 100 non-irrigators was randomly selected from areas adjacent to the irrigation schemes. As suggested by Israel [27], a review of the literature in a discipline can guide “typical” sample sizes that are appropriate for a study. The control group sample size was based on similar studies [28,29,30].

2.4. Data Collection Procedure

A structured questionnaire was used to collect primary data from irrigators and non-irrigators. The questionnaire was administered with the help of four trained enumerators. The local vernacular languages of Shona and Ndebele were used during the interviews. To enhance the instrument’s validity and reliability, a pre-test of the questionnaire was conducted with seven randomly selected farmers at the Biri-Extension irrigation scheme. The questionnaire captured household socioeconomic, demographic, agricultural production, and food consumption information. The household member in charge of food preparation provided information on food consumption. If unavailable, another adult was interviewed. Food items that were consumed outside the home by the household or individual members (for example, food purchased in restaurants) were excluded [2].

2.5. Data Analysis

The data were analysed using Microsoft Excel 2019 and Statistical Package for Social Sciences (SPSS) version 27. Descriptions of the analyses that were conducted follow.
i
Socioeconomic characteristics
This study utilised descriptive statistics to examine the socioeconomic characteristics of the participants. The mean, percentages, and frequencies were calculated for selected variables. The chi-square test was used to check for associations among the categorical variables. In addition, t-tests were utilised to ascertain whether the observed differences between selected variables were statistically significant. The analyses’ findings are presented in tables.
ii
Household food security valuation
The Food Consumption Score (FCS) index was used to assess household food security. The FCS index was developed by the World Food Programme (WFP) in 1996 [31]. The FCS measures the food access dimension by considering dietary diversity and the frequency of consumption of nine food groups in the past seven days, weighted according to the nutrition values of the food groups (Table 1) [31]. The FCS ranges from 0 to 112 and considers both the frequency of food consumption and the nutritional significance of the food consumed over a given period [31]. The higher the score, the better the household’s food security status [31].
The FCS is expressed as shown in Equation (2).
F C S = W S t a p l e X s t a p l e + W p u l s e X p u l s e + W v e g e t a b l e s X v e g e t a b l e s + W f r u i t X f r u i t + W m e a t X m e a t + W m i l k X m i l k + W s u g a r X s u g a r + W o i l X o i l + W c o n d i m e n t s X c o n d i m e n t s      
where Wi = vector of weights for food groups and Xi = vector of food consumption frequency for food groups. Based on the FCS, food consumption is categorised as poor (0–21), borderline (21.5–35), or acceptable (>35) [31]. The FCS measure was used to delineate the food-secure and food-insecure households, and those with an FCS less than or equal to 35 were categorised as food-insecure and those with an FCS greater than 35 were considered food-secure.
iii
Contribution of irrigation to food security
This study used binary logistic regression to measure the contribution of smallholder irrigation to food security. This model was chosen because it is suitable for binary dependent variables, normally distributed data, and large sample sizes [32]. Food security status was determined using the FCS. Households with an FCS of 35 or less were deemed food-insecure (coded as 0), while those with an FCS greater than 35 were considered food-secure (coded as 1). The likelihood of being food secure or not (PVi) depends on socioeconomic characteristics (Xi). Equation (3) shows the model’s empirical specification. Woleba et al. [33] used a similar model.
P r o b   F o o d   s e c u r e = 1 = α + β 1 X 1 + β 2 X 2 + β 3 X 3 + β 4 X 4 . . + μ i
where α is the slope, Prob (Food secure = 1) is the likelihood of household i being food secure, Xi is a vector of the farmer characteristics, β i are the parameters of the exogenous variables estimated, and μ i   is the error term.
The binary logistic regression model was run after checking the hypothesised explanatory variables for multicollinearity. To ensure accurate predictions, the presence of multicollinearity was tested using the variance inflation factor (VIF) for continuous variables and the contingency coefficient for discrete variables. If the mean VIF exceeds 10, the variable is highly collinear [32,33]. A contingency coefficient that is greater than or equal to 0.75 indicates serious multicollinearity [32,33]. The Pearson Goodness-of-fit, Nagelkerke R-squared, and Hosmer–Lemeshow tests were applied to evaluate the goodness of fit and assess the binary logistic regression model’s overall performance [32]. For the Pearson goodness-of-fit, if the p-value is significant (p < 0.05), it suggests a lack of fit between the model and the data [32]. For the Hosmer–Lemeshow test, a significant p-value (p < 0.05) suggests a lack of calibration, indicating that the model’s predictions do not align well with the observed data [32]. The Nagelkerke R-squared ranges from 0 to 1, and it provides a sense of how well the model predicts the binary outcomes [32,33]. Table 2 shows the description of the independent variables chosen based on a thorough review of similar studies [3,8,9,13,33,34].
Justification of variables
Age of household head was measured in years. According to Woleba et al. [33], age is a crucial factor that determines the access to land by household heads. Their study suggests that older heads of households have accumulated years of experience and knowledge and are likely to have more access to land than young ones. As individuals grow older, they acquire knowledge, skills, and assets that are essential for increased agricultural production [33]. The older the household head, the more the likelihood to be food secure.
Gender was captured as a dummy variable. Research shows that male-headed households have better access to resources and opportunities, making them more food secure than those headed by women [33,34].
Education of household head was measured as the number of years a household head spent attending school. It was expected that higher education levels would result in a higher likelihood to be food secure. According to Woleba et al. [33], a more educated household head is more likely to be aware of the benefits of modernizing agriculture, leading to an increase in food production. With greater knowledge and understanding of good farming practices, a more educated farmer can produce higher yields [33].
Household size was measured as the number of people who live at the same address and share meals and common housekeeping. According to Woleba et al. [33] and Sekhampu [35], a larger household size means more people to feed. This study hypothesises that household size is negatively associated with food security.
The dependency ratio indicates the percentage of household members who rely on economically active household members for their food, clothing, and education needs [36]. The higher the dependency ratio, the less likely the level of food security [36]. Hence, this study hypothesised that household food security and the dependency ratio are negatively correlated.
The farm size was a continuous variable captured in hectares. Generally, the larger the farm, the more food production and farm income can be generated. Owning a larger piece of land allows families to cultivate a variety of crops, which in turn can increase the household food supply [33]. This study hypothesised that farm size and food security are positively correlated.
Irrigation access was captured as a dummy variable. This study hypothesised a positive correlation between irrigation access and food security. As per the findings of Ahmed [37] and Feliciano [38], irrigation contributes to achieving food security by increasing crop production, facilitating crop diversification, promoting sustainable intensification, enhancing resilience, and generating employment and income.
Farm income was measured as a continuous variable in USD. Fanzo et al. [39] argue that farm income is essential for households to have enough financial resources to purchase nutritious food, and it also enables them to access a diverse range of food items, including fresh produce, protein sources, and other essential nutrients. This study assumed that farm income is positively correlated to food security.
Livestock holding was measured as tropical livestock units (TLUs). This measurement included cattle, goats, and poultry. For instance, cattle provide draught power, manure for fertilizer, income, and a store of value, contributing to food security [33]. Thus, it is common for rural communities to invest in cattle [33]. This study hypothesised that livestock holding and food security are positively correlated.
Extension frequency was measured as the number of visits made by extension officers to farmers per given period. Extension services are designed to provide farmers with skills and know-how to enhance their farm production, productivity, and food security levels [33]. We assume that extension frequency and household food security are positively correlated.

3. Results and Discussion

3.1. Description of the Farmers’ Socio-Economic Characteristics

The chi-square test was performed to determine if there was any association between access to irrigation and the gender, marital status, and education level of the farmers (Table 3). The findings show that the majority of the respondents were male, with 56.4% being irrigators and 51% being non-irrigators. However, there was no significant association between the farmer’s gender and access to irrigation.
Most of the respondents were married (80.8% irrigators and 85% non-irrigators), as shown in Table 3. The chi-square test result shows that p = 0.027, which is less than 0.05, meaning that there is an association between irrigation access and marital status at a 5% level of significance. The reason behind this could be that the marital status of a farmer has an impact on their access to resources, decision-making power, and responsibilities [40]. The results also show that 72.1% of the irrigators had attained secondary-level education. In addition, 68% of the non-irrigators had achieved secondary-level education. The chi-square test result reveals that there is an association between the level of education and irrigation access (p = 0.05). Education plays a vital role in a farmer’s ability to access irrigation technology. According to Achichi et al. [40], educated farmers are more likely to embrace new technology to enhance their farming practices.
Descriptive statistics were also performed to analyse the age, household size, dependency ratio, household labour, farming experience, farm income, food expenditure share, and livestock ownership of the farmers. We performed the t-test to check if the differences between irrigators and non-irrigators were significant (Table 4).
The t-test results indicate no significant difference in the ages of irrigators and non-irrigators. The results show significant differences in household size, dependency ratio, farming experience, farm income, food expenditure share, and livestock owned between irrigators and non-irrigators (p < 0.05). Household members under the age of 15 years and those above 64 years are considered dependent [36]. The results show that the dependency ratio was higher for irrigators (50%) than for non-irrigators (30%). There is a significant difference in the dependency ratios (p < 0.05). This means that the irrigators have more members who are dependent on them for basic needs such as food, clothing, and education than non-irrigators. As expected, the irrigators were found to have significantly higher farm income compared with non-irrigators (p < 0.05). Irrigation farming is practised throughout the year; hence, it is usually associated with more income than rainfed farming [9,10]. Rainfed farming is confined to the rainy season; thus, no farm income is generated from crop production during the dry season. High farm incomes are usually associated with high levels of household food security [9,10].
The findings show that the food expenditure share was less for irrigators (25%) compared with non-irrigators (38.9%) (Table 4). The difference in food expenditure shares was significant (p < 0.05). Because of their lower food expenditure shares, irrigators are more food secure than non-irrigators [3]. A high food expenditure share indicates that a household is struggling to meet its food needs, while a low food expenditure share may indicate that a household is food secure [3].
Table 4 shows that irrigators have average livestock ownership of 3.1 TLUs and non-irrigators have 1.4 TLUs. The difference in livestock owned was significant (p < 0.05). Irrigators are more likely to invest in livestock such as cattle, which have a symbiotic relationship with crop production as they can provide draught power and manure for crop production, while the Stover from the irrigated crops can be used as cattle feed [33]. Livestock ownership and food security are positively correlated [33]. This study’s findings suggest that irrigating households are more food secure than non-irrigating ones.

3.2. Contribution of Access to Irrigation to Crop Production and Productivity

An analysis of the contribution of access to irrigation to crop production was also conducted. Communal irrigation schemes such as Old-Biri and Biri-Extension are interventions designed to increase income levels and food security for rural communities [26]. The choice of crops grown is usually influenced by the subsistence threshold, the availability of good roads, and the distance from marketing points for the marketed surplus [41]. Table 5 shows the crops grown, area planted, yield, and quantity sold.
Table 5 shows the area planted, yield, and quantity sold for both summer and winter crops. Irrigators also own dryland plots on which they practice rainfed crop production during the summer season. The area planted for maize was 1.14 ha for irrigators and 0.03 ha for non-irrigators. For the irrigators, the area under maize production during the summer season included both rainfed and irrigated plots, which explains the higher land holding of the irrigators. The t-test results show that irrigators had significantly higher area planted, yield, and quantity sold of maize during the summer than non-irrigators (p < 0.01). In addition, the irrigators grew sugar beans on an average area of 0.04 ha during the summer season, achieving a yield of 0.54 t/ha. During the summer season, the non-irrigators also planted sorghum (0.01 ha), obtaining average yields of 0.04 t/ha.
Green mealies and wheat were grown under irrigation during the winter season. Table 5 shows that wheat was planted on an average area of 0.16 ha, whereas green mealies were grown on an average area of 0.25 ha. The findings imply that irrigators produce more cereals and have greater food security than non-irrigators. The findings are similar to those of Nhundu and Mushunje [42], who found that irrigators produce more cereals, which makes them more food secure than non-irrigators. In general, crop production was higher and more diverse under the irrigation farming system compared with the rainfed farming system. The findings are consistent with those of Gebregziabher et al. [43], who found that the productivity of crops grown under irrigation was greater than that of rainfed crops in Tigray, Ethiopia. Irrigation improves crop production and productivity by providing a reliable water supply, increasing crop yield, extending growing seasons, facilitating crop diversification, and promoting, efficient resource utilization in agricultural communities [44,45,46]. Understanding the crops grown in a farming system helps researchers and policymakers develop technologies and policies to improve crop production and productivity.

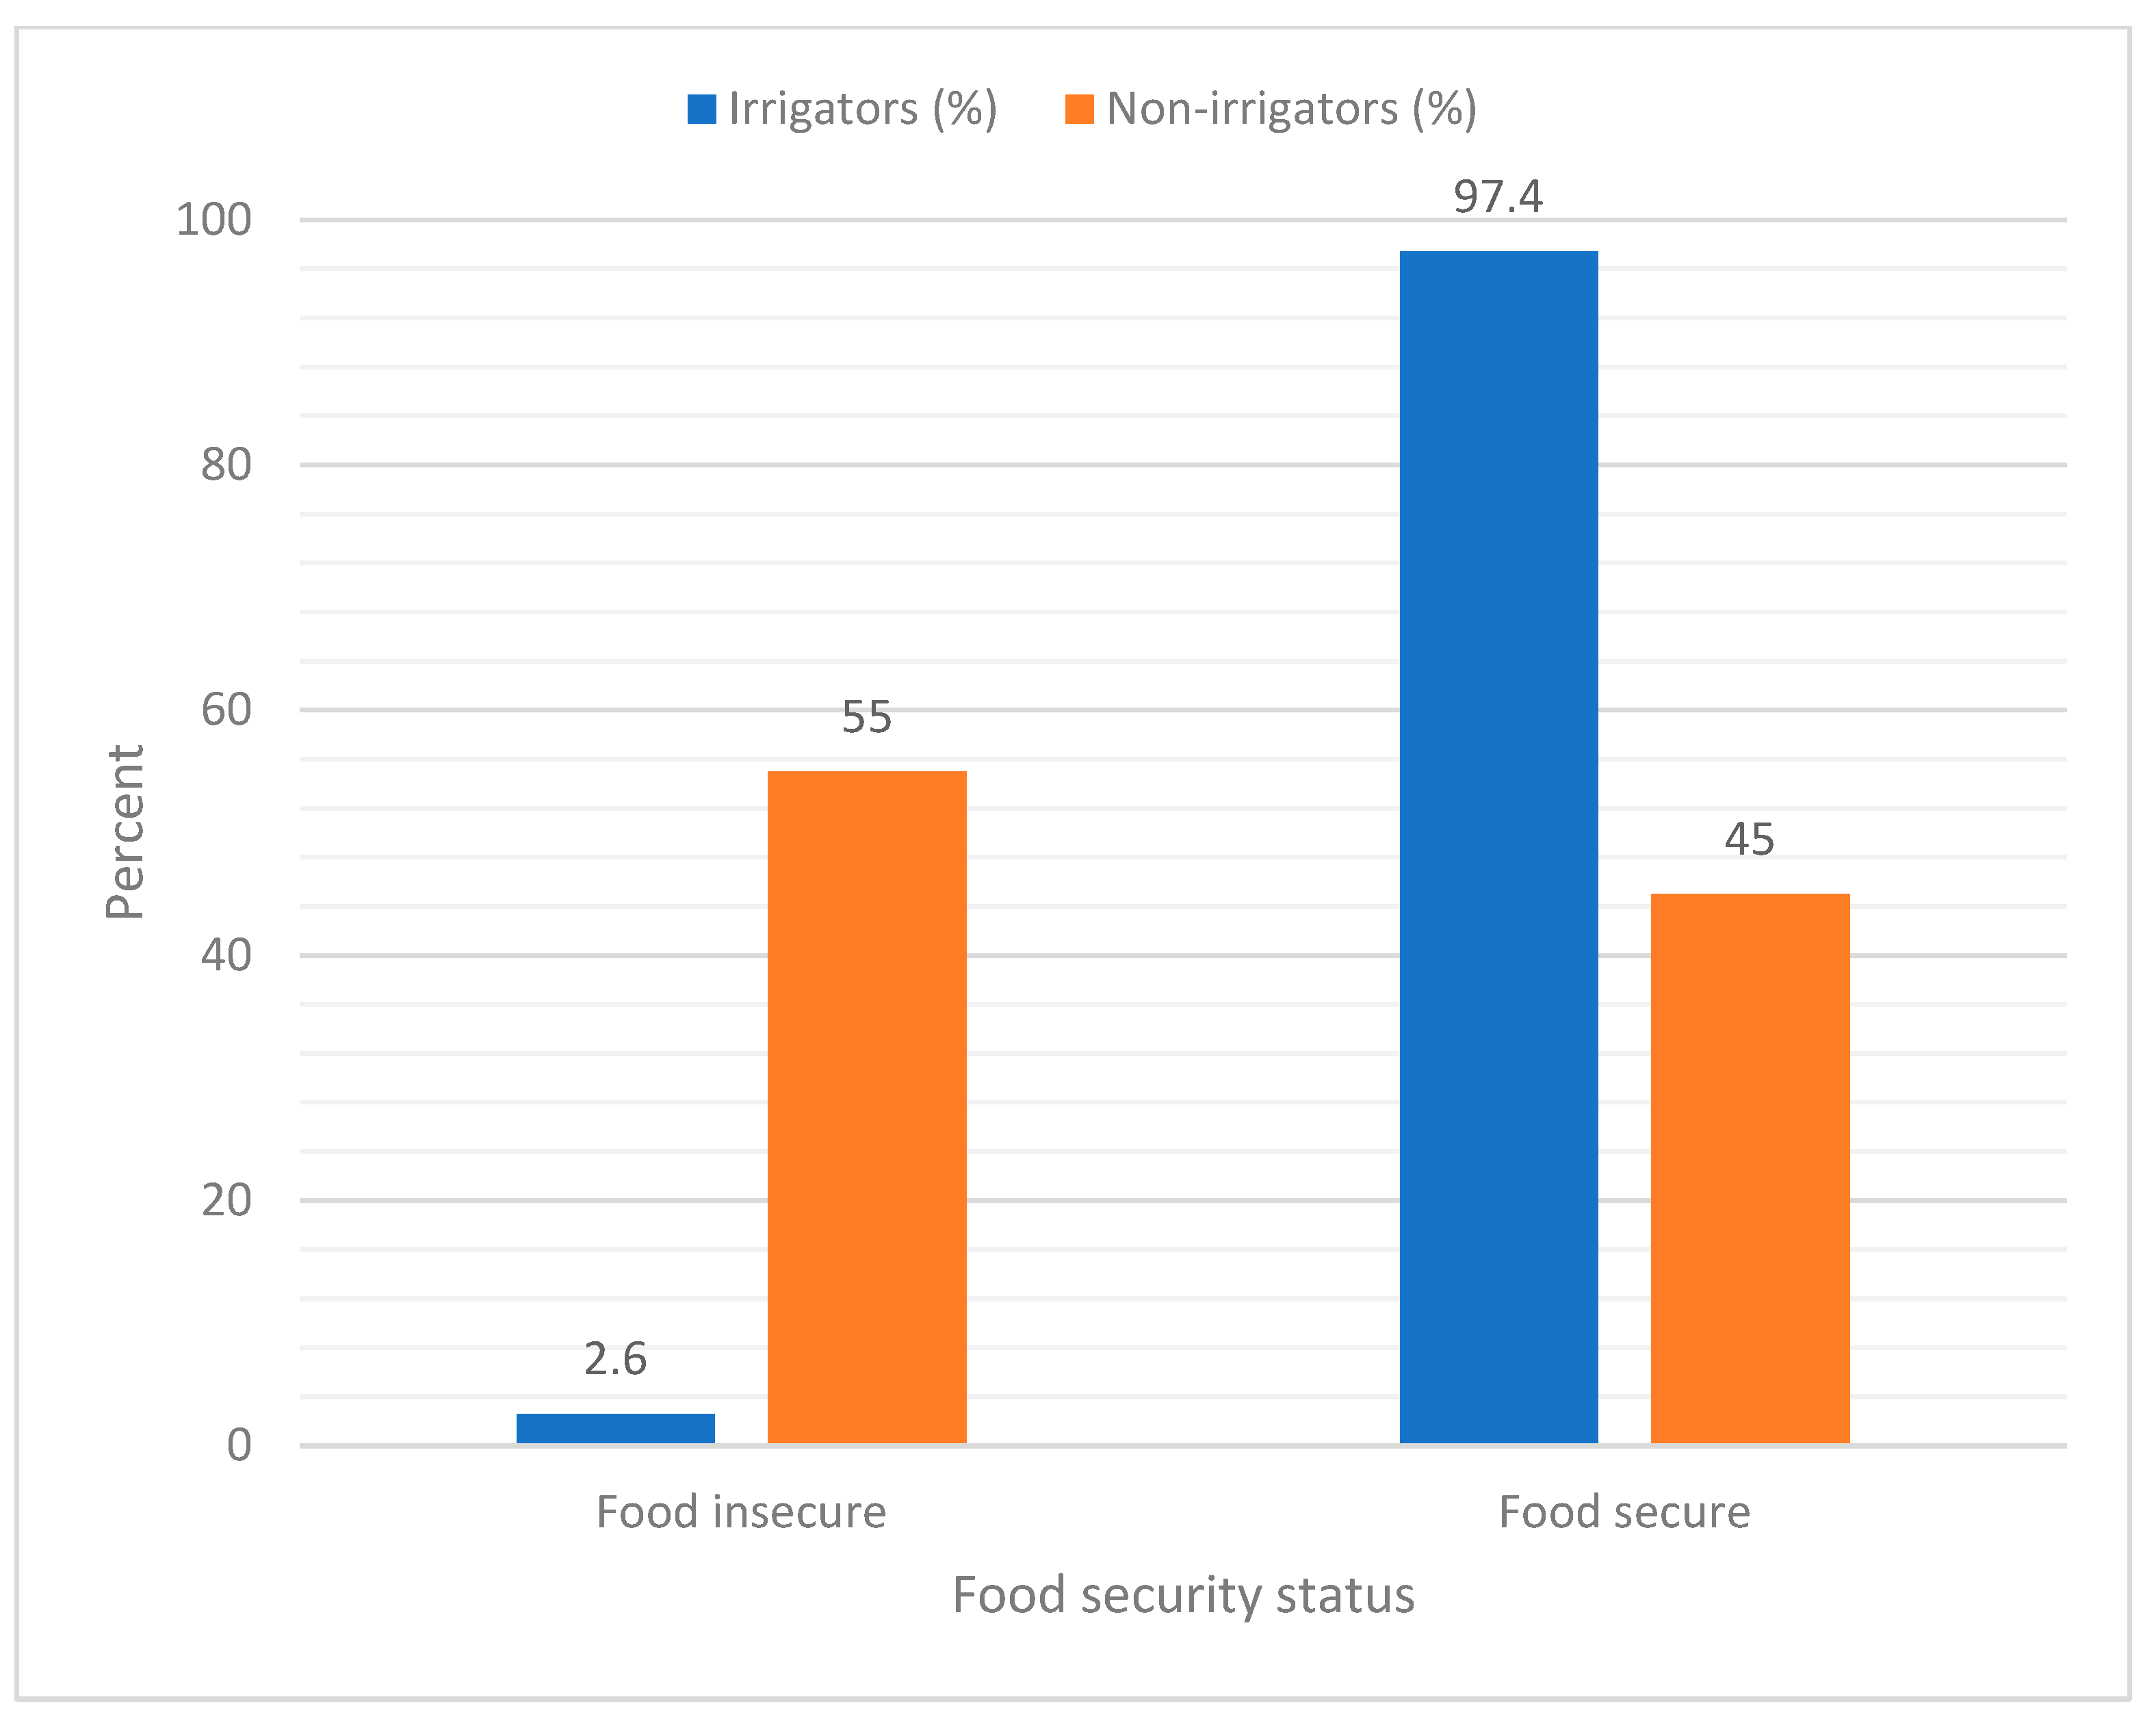
3.3. Contribution of Irrigation Access to Food Security

The respondents’ food security status is shown in Figure 2. Approximately 97% of the irrigating households and 45% of the non-irrigating households were food secure. Thus, irrigating households were more food secure than non-irrigating ones. These observed differences could be attributed to differences in access to irrigation technology. For instance, irrigators can grow crops all year round which helps to boost their household food stocks compared with non-irrigators who only grow crops during the rainy season. The findings concur with the prior expectation that access to irrigation increases household food security. Wondimagegnhu and Bogale [8] reported similar findings, where families with irrigation had higher levels of food security than those without.
Table 6 shows the results of the binary logistic regression model. The diagnostic test results indicate that there was no multicollinearity because the VIF values were less than 10 and the contingency coefficient values were less than 0.7 [32]. The pseudo-R2 value indicates that the independent variables account for 60.8% of the variation in food security. The χ2 statistic for the Hosmer and Lemeshow test of 5.377 and the model fit of p = 0.717 demonstrate that the model fits the data sufficiently because the p-value is greater than 0.05.
Most independent variables had expected signs except for the dependency ratio and extension frequency (Table 6). Only three variables, including household size, farm income, and irrigation access, had a significant correlation with food security. The age of the farmer, gender of the farmer, education of the farmer, dependency ratio, farm size, livestock holding, and extension frequency had no significant correlation with food security.
Household size had a negative and significant correlation with food security (p = 0.012, which is less than 0.05). This suggests that the likelihood of a household being food secure decreases by a factor of 0.64 if household size increases by one member. The results are similar to those of a study carried out by Gemechu, Zemedu, and Yousuf [47], which revealed that a bigger family size reduces the likelihood of being food secure. According to Sekhampu [35], bigger households typically have a higher demand for food. If resources are limited, larger households may find it difficult to access sufficient and nutritious food, reducing food security [35].
The findings show that irrigation access has a positive and significant correlation with food security (p = 0.000, which is less than 0.01). A unit increase in access to irrigation increases the likelihood of a household being food secure by a factor of 32.36. The findings are similar to the prior expectation that access to irrigation increases food security as farmers can grow crops throughout the year, thus, increasing their food supplies. The results are similar to those of research carried out by Balana et al. [15] and Wondimagegnhu and Bogale [8], which found that irrigation increases household food security. Access to irrigation enhances food security by improving crop production, enabling crop diversification, enhancing resilience, promoting sustainable intensification, and generating employment and income [37,38]. Hence, government policies should enhance access to irrigation, and more resources should be availed towards investments in irrigation infrastructure, expanding coverage and rehabilitation of existing irrigation systems. The government of Zimbabwe aims to increase the irrigated land area from 180,000 ha to more than 350,000 ha from 2021 to 2025, as stated in the NDS 1 [16]. This policy measure will help to increase access to irrigation, which will in turn improve household food security in the country.
Farm income has a positive and significant correlation with household food security (p = 0.000, which is less than 0.01). This implies that if farm income increases by one unit, the likelihood of being food secure increases by a factor of 1.01. The findings are similar to the prior expectation that farm income directly correlates with household food security. Money obtained from farming can be used to buy food for the household [15]. Balana et al. [15] and Wondimagegnhu and Bogale [8] also found similar results that farm income and household food security are positively related. Farm income enables households to access a diverse range of food items, including fresh produce, protein sources, and other essential nutrients [39]. It is also important to note that the relationship between income access to irrigation, and food security is bidirectional, with each factor influencing the others [8]. A positive feedback loop can exist, where higher income facilitates access to irrigation, leading to improved food security, which, in turn, can contribute to increased income [8,15]. Recognizing this bidirectional relationship is important for designing comprehensive interventions that address multiple determinants and promote sustainable improvements in food security [8].

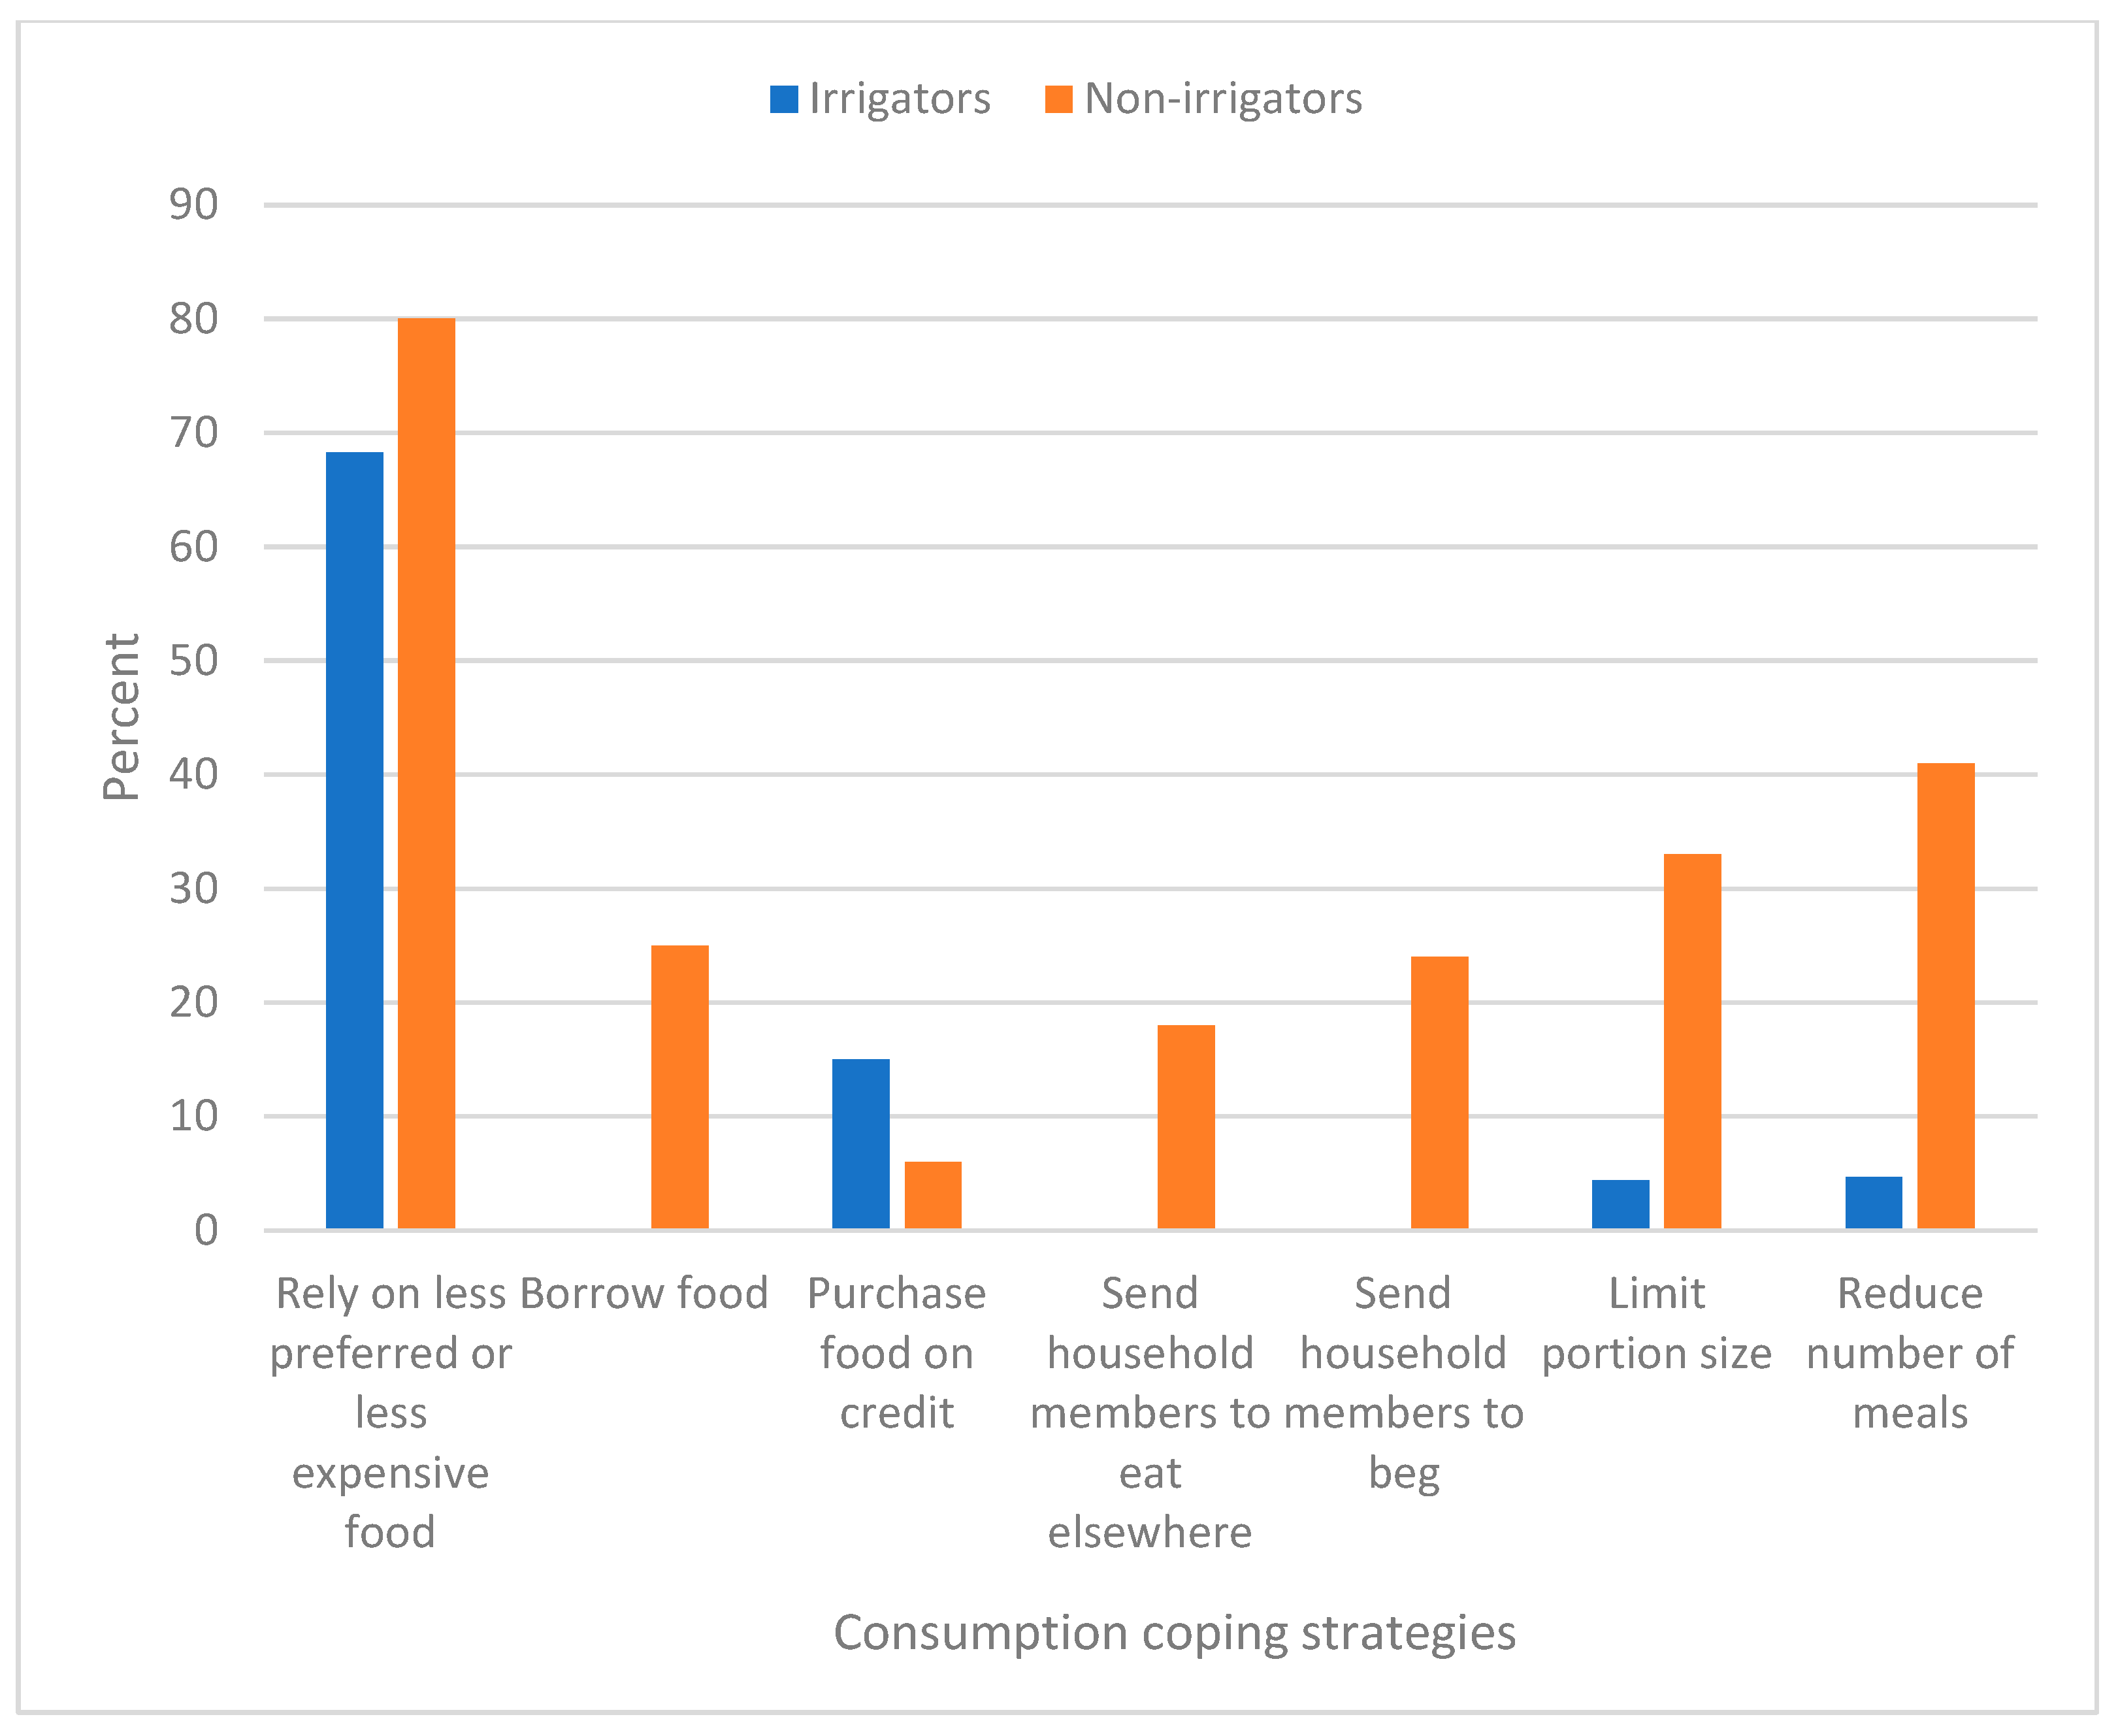
3.4. Food Insecurity Consumption Coping Strategies

If households fail to access enough food to meet their needs, they resort to various consumption coping strategies that are necessary for them to survive. The four main categories of consumption coping strategies are change in diet, reducing the number of people to feed, food rationing, and temporary strategies that increase food supply [31]. Consumption coping strategies are commonly employed in the short run. Figure 3 shows the various consumption coping strategies that were being utilised by households to cope with food shortages. The coping strategies were obtained from the survey conducted in the study area.
The irrigators used four consumption coping strategies including relying on less preferred or less expensive food (68%), purchasing food on credit (15%), limiting portion size (4%), and reducing the number of meals (5%). Non-irrigators were using seven different consumption coping strategies, which included relying on less preferred or less expensive food (80%), borrowing food (25%), purchasing food on credit (6%), sending household members to eat elsewhere (18%), begging for food (24%), limiting portion size (33%), and reducing the number of meals eaten per day (41%). The findings show that non-irrigators have more food insecurity coping mechanisms compared with irrigators. Non-irrigators are more vulnerable to food insecurity compared with irrigators. It is important to note that these coping strategies are often adopted out of necessity and reflect the resource constraints faced by food-insecure households. Addressing food insecurity requires comprehensive approaches that go beyond short-term coping strategies [15]. Long-term solutions such as investments in irrigation infrastructure help to improve access to nutritious and affordable food, enhance income opportunities, promote sustainable agricultural practices, and build resilience in vulnerable rural communities [3,8,9].

4. Conclusions

Smallholder irrigation development increases the chances that Zimbabwe will achieve the global SDG 2 and the local NDS 1 goals of improving food security. This study contributes to the debate on smallholder irrigation and household food security in Zimbabwe and similar developing countries. This study’s findings suggest that irrigating households tend to be more food secure compared with non-irrigating households. Crop production was higher and more diverse for irrigating households compared with non-irrigating ones. Furthermore, the FCS measure revealed that about 97% of irrigating households were food secure compared with 45% of non-irrigating households. The binary logistic regression results indicate that irrigation access, household size, and farm income have a significant relationship with food security. However, the age of the farmer, gender, education, dependency ratio, farm size, livestock holding, and access to extension had no significant relationship with food security. Households were found to be employing various strategies to cope with food insecurity, such as opting for cheaper and less desirable food choices, borrowing food, buying food on credit, sending household members to eat elsewhere, sending household members to beg, reducing portion sizes, and cutting down on the number of daily meals consumed. Based on the results, this study concludes that the presence of smallholder irrigation enhances crop production, productivity, and the overall food security of households. This study recommends that the government and its development partners should continue to invest in smallholder irrigation development in rural areas because access to irrigation contributes positively to household food security. Further studies should be conducted on the determinants of irrigation access in the studied areas. Understanding the determinants of irrigation access is vital for improving household food security by increasing agricultural productivity, promoting crop diversification, enhancing resilience to climate change, generating income, and supporting sustainable water resource management. By addressing barriers and improving access to irrigation, households can enhance their ability to produce food, increase their income, and improve their overall well-being.

Author Contributions

N.M.: conceptualization, data curation, formal analysis, investigation, methodology, software, visualization, writing—original draft, and writing—review and editing. G.M. and R.M.: project administration, supervision, validation, visualization, and writing—review and editing. P.L.M.: writing—review and editing, validation, project administration, visualization, resources, and funding acquisition. All authors have read and agreed to the published version of the manuscript.

Funding

This research received no external funding.

Institutional Review Board Statement

The study was approved by the Midlands State University Research Board Committee (20 September 2021).

Data Availability Statement

The data are available on request because of restrictions.

Acknowledgments

This work is part of a Doctoral research project by the first author supported by the Midlands State University. The National Research Foundation of South Africa, through the Department of Agronomy and Rural Development [grant 86893], University of KwaZulu Natal, provided funding for the publication of this paper. The authors are grateful to the enumerators who assisted during the data collection process. We also express gratitude to the farmers who participated in the survey.

Conflicts of Interest

The authors declare no conflicts of interest.

References

  1. FAO; IFAD; UNICEF; WFP; WHO. The State of Food Security and Nutrition in the World 2022. Repurposing Food and Agricultural Policies to Make Healthy Diets More Affordable; FAO: Rome, Italy, 2022. [Google Scholar] [CrossRef]
  2. FAO; IFAD; UNICEF; WFP; WHO. The State of Food Security and Nutrition in the World 2023. Urbanization, Agrifood Systems Transformation and Healthy Diets across the Rural–Urban Continuum; FAO: Rome, Italy, 2023. [Google Scholar] [CrossRef]
  3. Jambo, Y.; Alemu, A.; Tasew, W. Impact of small-scale irrigation on household food security: Evidence from Ethiopia. Agric. Food Secur. 2021, 10, 21. [Google Scholar] [CrossRef]
  4. FAO. Zimbabwe|Agricultural Livelihoods and Food Security in the Context of COVID-19: Monitoring Report—May 2021; FAO: Rome, Italy, 2021. [Google Scholar] [CrossRef]
  5. Nkegbe, P.K.; Abu, B.M.; Issahaku, H. Food security in the Savannah Accelerated Development Authority Zone of Ghana: An ordered probit with household hunger scale approach. Agric. Food Secur. 2017, 6, 35. [Google Scholar] [CrossRef]
  6. Wiggins, S.; Keats, S. Smallholder Agriculture’s Contribution to Better Nutrition; ODI: London, UK, 2013. [Google Scholar]
  7. Fan, S.; Rue, C. The role of smallholder farms in a changing world. In The Role of Smallholder Farms in Food and Nutrition Security; Springer Nature: Cham, Switzerland, 2020; pp. 13–28. [Google Scholar]
  8. Wondimagegnhu, B.A.; Bogale, B.A. Small-scale irrigation and its effect on food security of rural households in North-West Ethiopia: A comparative analysis. Ethiop. J. Sci. Technol. 2020, 13, 31–51. [Google Scholar] [CrossRef]
  9. Chidavaenzi, F.R.; Mazenda, A.; Ndlovu, N. Household survival and resilience to food insecurity through the drip irrigation scheme in dry rural areas. Jàmbá J. Disaster Risk Stud. 2021, 13, 1–8. [Google Scholar] [CrossRef]
  10. Mhembwe, S.; Chiunya, N.; Dube, E. The contribution of small-scale rural irrigation schemes towards food security of smallholder farmers in Zimbabwe. Jàmbá J. Disaster Risk Stud. 2019, 11, a674. [Google Scholar] [CrossRef]
  11. Endale, W.; Mengesha, Z.B.; Atinafu, A.; Adane, A.A. Food Insecurity in Farta District, Northwest Ethiopia: A community based cross–sectional study. BMC Res. Notes 2014, 7, 1–6. [Google Scholar] [CrossRef] [PubMed]
  12. FAO. The State of the World’s Land and Water Resources for Food and Agriculture (SOLAW)—Managing Systems at Risk; Food and Agriculture Organization of the United Nations: Rome, Italy; Earthscan: London, UK, 2011. [Google Scholar]
  13. Adeniyi, D.A.; Dinbabo, M.F. Factors influencing household food security among irrigation smallholders in North West Nigeria. J. Rev. Glob. Econ. 2019, 8, 291–304. [Google Scholar] [CrossRef]
  14. Ogunniyi, A.; Omonona, B.; Abioye, O.; Olagunju, K. Impact of irrigation technology use on crop yield, crop income and household food security in Nigeria: A treatment effect approach. AIMS Agric. Food 2018, 3, 154–171. [Google Scholar]
  15. Balana, B.B.; Bizimana, J.C.; Richardson, J.W.; Lefore, N.; Adimassu, Z.; Herbst, B.K. Economic and food security effects of small-scale irrigation technologies in northern Ghana. Water Resour. Econ. 2020, 29, 100141. [Google Scholar] [CrossRef]
  16. Government of Zimbabwe (GoZ). National Development Strategy 1 (2021–2025); GoZ: Harare, Zimbabwe, 2020. [Google Scholar]
  17. World Food Program. Zimbabwe Country Brief; WFP: Rome, Italy, 2023. [Google Scholar]
  18. Zimbabwe Vulnerability Assessment Committee (ZimVAC). Rural Livelihoods Assessment Report; Food and Nutrition Council Zimbabwe: Harare, Zimbabwe, 2023. [Google Scholar]
  19. Zimbabwe National Statistics Agency. Zimbabwe Poverty Report; ZIMSTAT: Harare, Zimbabwe, 2019. [Google Scholar]
  20. Zimbabwe Vulnerability Assessment Committee (ZimVAC). Rural Livelihoods Assessment Report; Food and Nutrition Council Zimbabwe: Harare, Zimbabwe, 2022. [Google Scholar]
  21. Punch, K. Introduction to Social Research: Quantitative and Qualitative Approaches; Sage Publications: London, UK, 2005. [Google Scholar]
  22. Balarabe Kura, S.Y. Qualitative and Quantitative Approaches to the Study of Poverty: Taming the Tensions and Appreciating the Complementarities. Qual. Rep. 2012, 17, 1–19. [Google Scholar] [CrossRef]
  23. Rahman, M.S. The Advantages and Disadvantages of Using Qualitative and Quantitative Approaches and Methods in Language “Testing and Assessment” Research: A Literature Review. J. Educ. Learn. 2017, 6, 102–112. [Google Scholar] [CrossRef]
  24. Manatsa, D.; Mushore, T.; Gwitira, T.; Wuta, M.; Chemura, A.; Shekede, M.; Mugandani, R.; Sakala, L.; Ali, L.; Masukwedza, G.; et al. Report on Revised Agroecological Zones of Zimbabwe; Bindura University: Bindura, Zimbabwe, 2020. [Google Scholar]
  25. Gumbo, D. Working Together to Respond to Climate Change. Annex I Expert Group Seminar in Conjunction with the OECD Global Forum on Sustainable Development Zimbabwe Country Case Study on Domestic Policy Frameworks for Adaptation in the Water Sector. WWF Southern Africa: Washington, DC, USA, 2006. [Google Scholar]
  26. Ministry of Agriculture, Mechanisaion and Irrigation Development. Irrigation Schemes Report, Midlands Province; MAMID: Harare, Zimbabwe, 2020. [Google Scholar]
  27. Israel, G.D. Determining Sample Size; University of Florida Cooperative Extension Service. Institute of Food and Agriculture Sciences, EDIS: Gainesville, FL, USA, 1992; pp. 1–5. [Google Scholar]
  28. Haji, J.; Aman, M.; Hailu, T. Impact analysis of Mede Telila small scale irrigation scheme on house poverty alleviation: Case of Gorogutu district in eastern Haratghe Oromia national regional state Ethiopia. Int. J. Dev. Econ. Sustain. 2013, 1, 15–30. [Google Scholar]
  29. Sinyolo, S. The Impact of Smallholder Irrigation and Water Security on Household Welfare: The Case of Tugela Ferry Irrigation Scheme in KwaZulu-Natal, South Africa; School of Agricultural, Earth and Environmental Sciences; University of KwaZulu-Natal: Durban, South Africa, 2013. [Google Scholar]
  30. Bacha, D.; Namara, R.; Bogale, A.; Tesfaye, A. Impact of small-scale irrigation on household poverty: Empirical evidence from the Ambo district in Ethiopia. Irrig. Drain. 2011, 60, 1–10. [Google Scholar] [CrossRef]
  31. VAM; WFP. Food Consumption Analysis: Calculation and Use of the Food Consumption Score in Food Security Analysis; Vulnerability Analysis and Mapping Unit, World Food Programme: Rome, Italy, 2008. [Google Scholar]
  32. Gujarati, D.N. Basic Econometrics, 4th ed.; McGraw-Hill: New York, NY, USA, 2013. [Google Scholar]
  33. Woleba, G.; Tadiwos, T.; Bojago, E.; Senapathy, M. Household food security, determinants and coping strategies among small-scale farmers in Kedida Gamela district, Southern Ethiopia. J. Agric. Food Res. 2023, 12, 100597. [Google Scholar] [CrossRef]
  34. Bojago, E.; Abrham, Y. Small-scale irrigation (SSI) farming as a climate-smart agriculture (CSA) practice and its influence on livelihood improvement in Offa District, Southern Ethiopia. J. Agric. Food Res. 2023, 12, 100534. [Google Scholar] [CrossRef]
  35. Sekhampu, T.J. Determination of the factors affecting the food security status of households in Bophelong, South Africa. Int. Bus. Econ. Res. J. (IBER) 2013, 12, 543–550. [Google Scholar] [CrossRef]
  36. Hammer, B.; Prskawetz, A.; Freund, I. Production activities and economic dependency by age and gender in Europe: A cross-country comparison. J. Econ. Ageing 2015, 5, 86–97. [Google Scholar] [CrossRef] [PubMed]
  37. Ahmed, J. The Role of Small Scale Irrigation to Household Food Security in Ethiopia: A Review Paper. J. Resour. Dev. Manag. 2019, 60, 20–25. [Google Scholar]
  38. Feliciano, D. A review on the contribution of crop diversification to Sustainable Development Goal 1 “No poverty” in different world regions. Sustain. Dev. 2019, 27, 795–808. [Google Scholar] [CrossRef]
  39. Fanzo, J.; Hawkes, C.; Udomkesmalee, E.; Afshin, A.; Allemandi, L.; Assery, O.; Baker, P.; Battersby, J.; Bhutta, Z.; Chen, K.; et al. 2018 Global Nutrition Report: Shining a Light to Spur Action on Nutrition. Development Initiatives: London, UK, 2018. [Google Scholar]
  40. Achichi, C.; Sennuga, S.O.; Osho-Lagunju, B.; Alabuja, F.O. Effect of Farmers’ Socioeconomic Characteristics on Access to Agricultural Information in Gwagwalada Area Council, Abuja. Discov. Agric. Food Sci. 2023, 10, 28–47. [Google Scholar]
  41. Kassegn, A.; Abdinasir, U. Determinants of rural households’ livelihood diversification strategies: In the case of north Wollo zone, Amhara National Regional State, Ethiopia. Cogent Econ. Financ. 2023, 11, 2185347. [Google Scholar] [CrossRef]
  42. Nhundu, K.; Mushunje, A. Irrigation Development: A Food Security and Household Income Perspective, Problems, Perspectives and Challenges of Agricultural Water Management; Kumar, M., Ed.; InTech: London, UK, 2012; ISBN 978-953-51-0117-8. Available online: http://www.intechopen.com/books/problems-perspectives-and-challenges-of-agricultural-water-management/irrigation-development-food-security-and-household-income-perspective (accessed on 17 September 2023).
  43. Gebregziabher, G.; Namara, R.E.; Holden, S. Technical efficiency of irrigated and rainfed smallholder agriculture in Tigray, Ethiopia: A comparative stochastic frontier production function analysis. Q. J. Int. Agric. 2012, 51, 203–226. [Google Scholar]
  44. Mkanthama, J.; Makombe, G.; Kihoro, J.; Ateka, E.M.; Kanjere, M. Technical efficiency of rainfed and irrigated rice production in Tanzania. Irrig. Drain. 2018, 67, 233–241. [Google Scholar] [CrossRef]
  45. Kalkidan, F.; Tewodros, M. Review on the role of small scale irrigation agriculture on poverty alleviation in Ethiopia. North Asian Int. Res. J. Multidiscipl. 2017, 3, 1–18. [Google Scholar]
  46. Makombe, G.; Namara, R.E.; Awulachew, S.B.; Hagos, F.; Ayana, M.; Kanjere, M. An analysis of the productivity and technical efficiency of smallholder irrigation in Ethiopia. Water SA 2017, 43, 48–57. [Google Scholar] [CrossRef]
  47. Gemechu, F.; Zemedu, L.; Yousuf, J. Determinants of farm household food security in Hawi Gudina district, west Hararghe zone, Oromia regional national state, Ethiopia. J. Agric. Ext. Rural Dev. 2016, 8, 12–18. [Google Scholar]
Figure 1. Map of the study area.
Agriculture 14 00617 g001
Figure 2. Food security status.
Agriculture 14 00617 g002
Figure 3. Consumption coping strategies.
Agriculture 14 00617 g003
Table 1. The nine standard food groups used to calculate FCS.
Food GroupsWeights
Main staples2
Pulses3
Vegetables1
Fruit1
Meat and fish4
Milk4
Sugar0.5
Oil0.5
Condiments0
Source: VAM, WFP [31].
Table 2. List of independent variables, their codes, and expected signs.
Description of Variable Unit/CodeExpected Sign
Age of household headYears+
Gender of household head1 = male, 0 = female+
Education of household headYears+
Household size Number of persons
Dependency ratioProportion per working-age members
Farm sizeHectares+
Irrigation access1 = Irrigator, 0 = non-irrigator+
Farm incomeUSD+
Livestock holding (TLU)TLU+
Extension frequencyNumber of visits+
− means negative, + means positive.
Table 3. Chi-square test results.
Variable DescriptionIrrigators (%)Non-Irrigators (%)Chi-Square (p-Value)
Gender of household headMale56.4510.133
(0.716)
Female43.649
Marital status of household headMarried80.8857.223 **
(0.027)
Divorced6.70
Widowed12.515
Education of household headNo formal education6.71916.150 **
(0.001)
Primary education19.513
Secondary education72.168
Tertiary education1.70
** Significant at a 5% level.
Table 4. Differences in the mean for continuous variables.
VariableMeasureFarmer Typet-Value
IrrigatorsNon-Irrigators
Age (years)Mean
(Standard dev)
51.9
(10.6)
51.6
(8.4)
−0.324
Household size
(number of persons)
Mean
(Standard dev)
4.9
(1.3)
4.3
(0.9)
−3.995 **
Dependency ratio
(proportion per working-age members)
Mean
(Standard dev)
0.5
(0.8)
0.3
(0.4)
2.669 **
Household labour (number of persons)Mean
(Standard dev)
2.8
(1.1)
2.5
(0.7)
−2.405 **
Farming experience (years)Mean
(Standard dev)
15.8
(5.8)
26.5
(8.6)
14.677 **
Farm income (USD)Mean
(Standard dev)
269.22
(114.4)
96.12
(97.3)
13.754 **
Food expenditure share (%)Mean
(Standard dev)
25
(13.6)
38.9
(13.7)
8.945 **
Livestock owned (TLU)Mean
(Standard dev)
3.1
(3.2)
1.4
(1.4)
4.988 **
** Significant at a 5% level.
Table 5. Area planted, yield, and quantity sold for summer and winter crops.
Season Type of Crop VariableFarmer Typet-Values
IrrigatorsNon-Irrigators
SummerMaize Area planted (ha)1.140.0325.849 **
Yield (t/ha)0.580.139.372 **
Quantity sold (t)0.300.0121.750 **
SorghumArea planted (ha)00.01n/a
Yield (t/ha)00.04n/a
Quantity sold (t)00.01n/a
Sugar beanArea planted (ha)0.040n/a
Yield (t/ha)0.540n/a
Quantity sold (t)0.020n/a
WinterGreen mealiesArea planted (ha)0.250n/a
Yield (dozens/ha)35100n/a
Quantity sold (dozens)8500n/a
WheatArea planted (ha)0.160n/a
Yield (t/ha)2.910n/a
Quantity sold (t)0.470n/a
** Significant at a 5% level, n/a means not applicable.
Table 6. Binary logistic regression results.
Explanatory VariablesBWaldSig.Exp (B)
Age of farmer0.0030.0170.8951.003
Gender of farmer0.3770.8860.3471.458
Education of farmer0.0160.0760.7831.016
Household size −0.4436.2490.012 **0.642
Dependency ratio0.5151.3850.2391.673
Farm size0.1560.7230.3951.169
Irrigation access3.47718.6460.000 **32.357
Farm income0.01012.1400.000 **1.010
Livestock holding (TLU)0.0500.2060.6501.051
Extension frequency−0.0732.5880.1080.930
Constant −0.0700.0020.9680.932
Pearson χ25.377
Nagelkerke R20.608
N444
Log-likelihood184.936
Hosmer and Lemeshow Test0.717
** Significant at a 5% level.
Disclaimer/Publisher’s Note: The statements, opinions and data contained in all publications are solely those of the individual author(s) and contributor(s) and not of MDPI and/or the editor(s). MDPI and/or the editor(s) disclaim responsibility for any injury to people or property resulting from any ideas, methods, instructions or products referred to in the content.

