
An Assessment of Food Value Chains to Identify Gaps and Make Recommendations for Further Development: A Slovenian Case Study


Abstract
1. Introduction
2. Materials and Methods
2.1. Context Analysis of Added Value in Food Supply Chains
- -
- Trust between the stakeholders (producers, processors, traders, and consumers) along the agri-food chains;
- -
- The price of the end product evenly distributed among all participants (with slight variations depending on the costs in the process);
- -
- Increased market orientation in terms of supplying locally produced food and increasing demand for it.
- -
- Through agricultural products or foods made from raw materials, which demonstrate the origin of the food and thus the added value and consequently a higher price on the market;
- -
- Through protected food names that express either the geographical location, the higher quality of the raw materials and/or food safety;
- -
- As a network of proper business relationships and interactions between the different actors in the food chain.
- -
- In the following, Stevenson and Pirog [33], Pirog and Bregendahl [34], and Stevenson et al. [35] have developed a definition that defines agri-food chains with added value. The definition is mainly based on a description of the differences between chains that do not express added value and those that do. One can speak of value-added agri-food chains if the following important principles are taken into account and differ from conventional agri-food chains in these segments:
- -
- The business relationships between the strategic partners in the chain are based on common principles that are primarily based on trust. In the chain, one of the strategic partners stands out and makes a major contribution to the good and organised functioning of the chain.
- -
- In the chain, the growers/farmers are treated equally as strategic partners with all rights and obligations in terms of risk-taking, management, and decision-making.
- -
- The obligations and rights in the chain apply equally to all participants in the chain.
- -
- The coordination of the actors in the chain is effectively coordinated at the local, regional, national, and/or international levels.
2.2. Research Methodology
- Collecting statistical data and recalculating the data according to the methodology of each indicator
- Analysis and assessment of case studies using the DEXi model based on defined criteria or constraints
- Plus-minus-1 analysis of the case studies based on the boundaries of the DEXi model
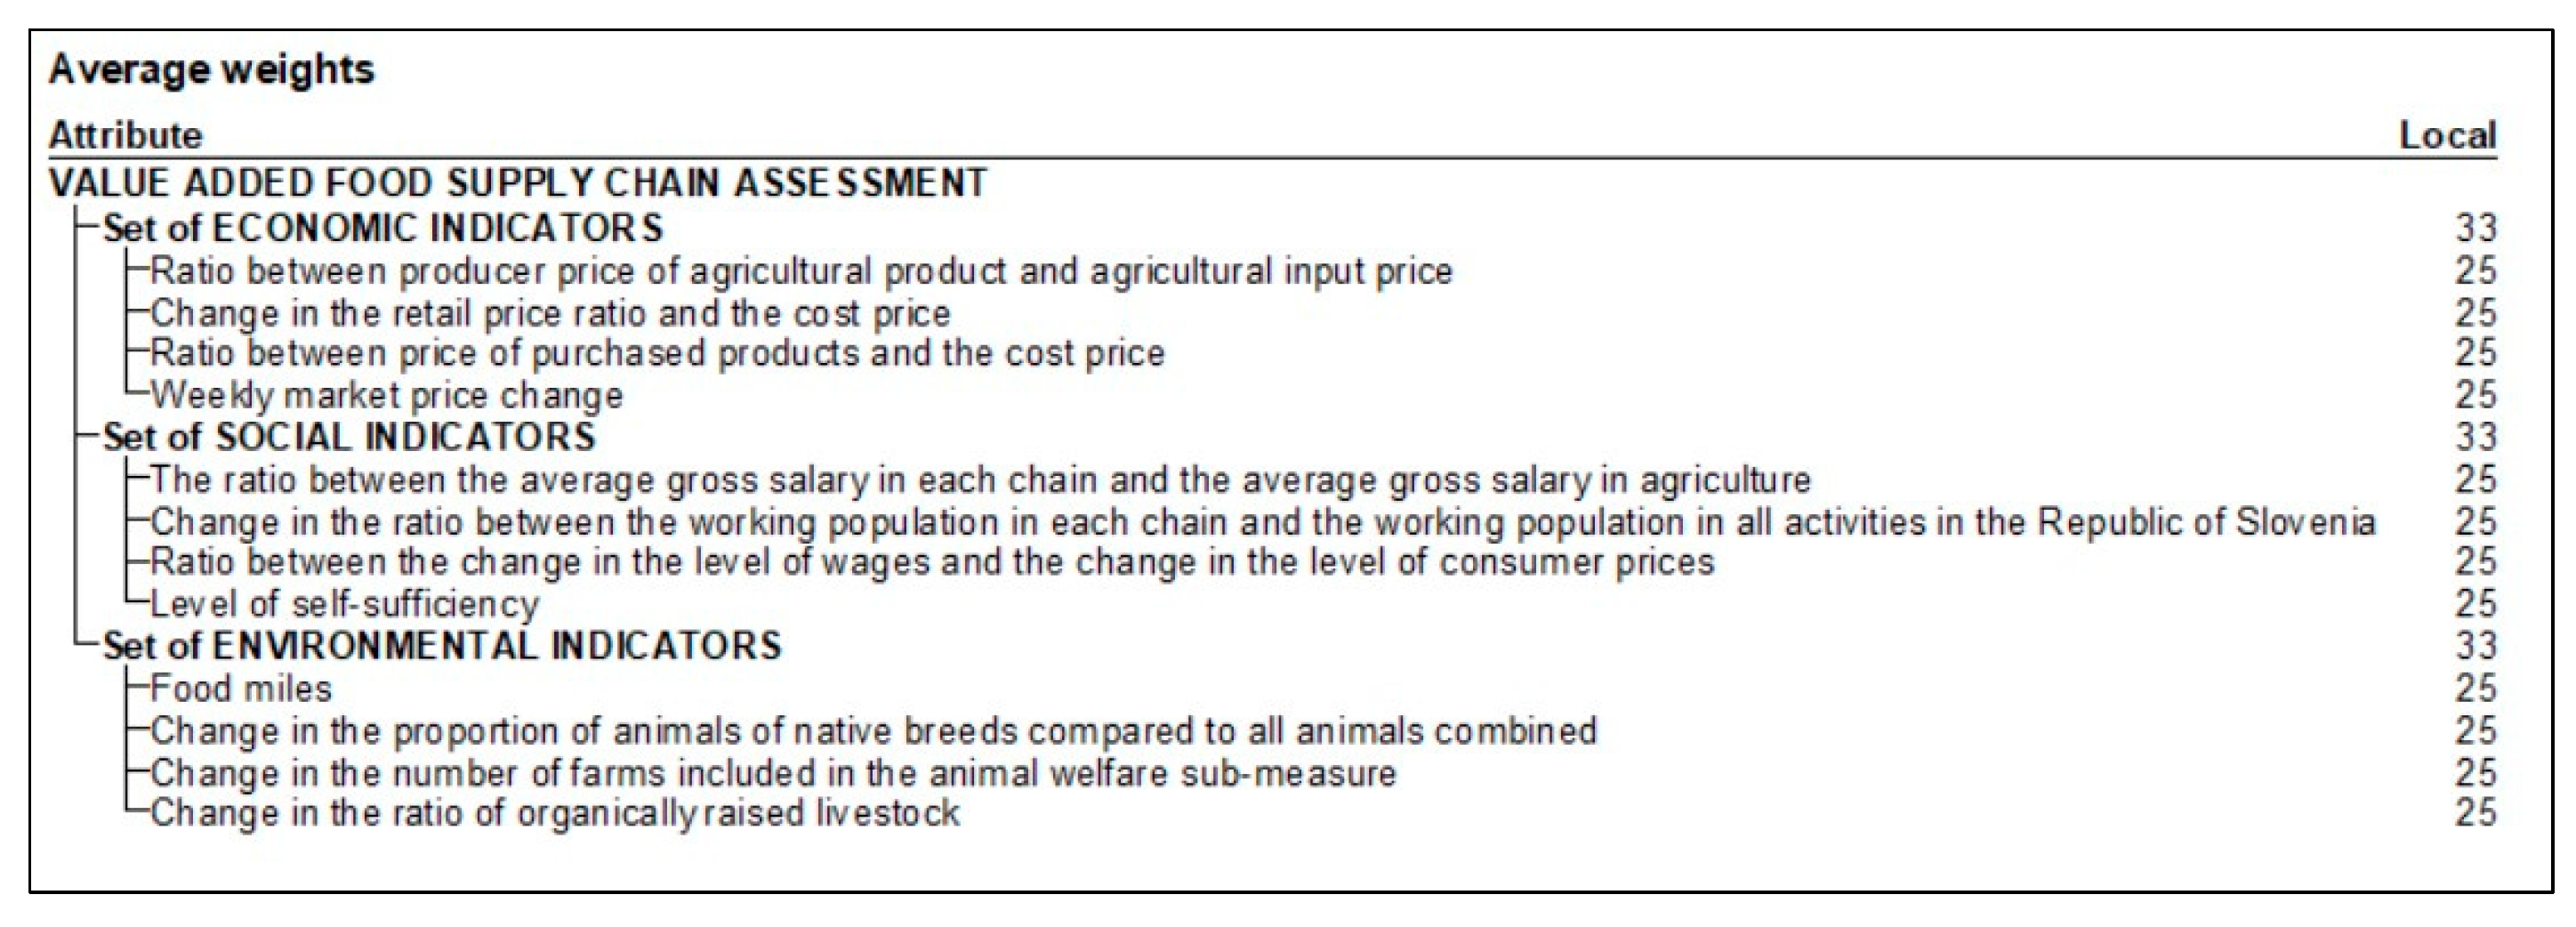
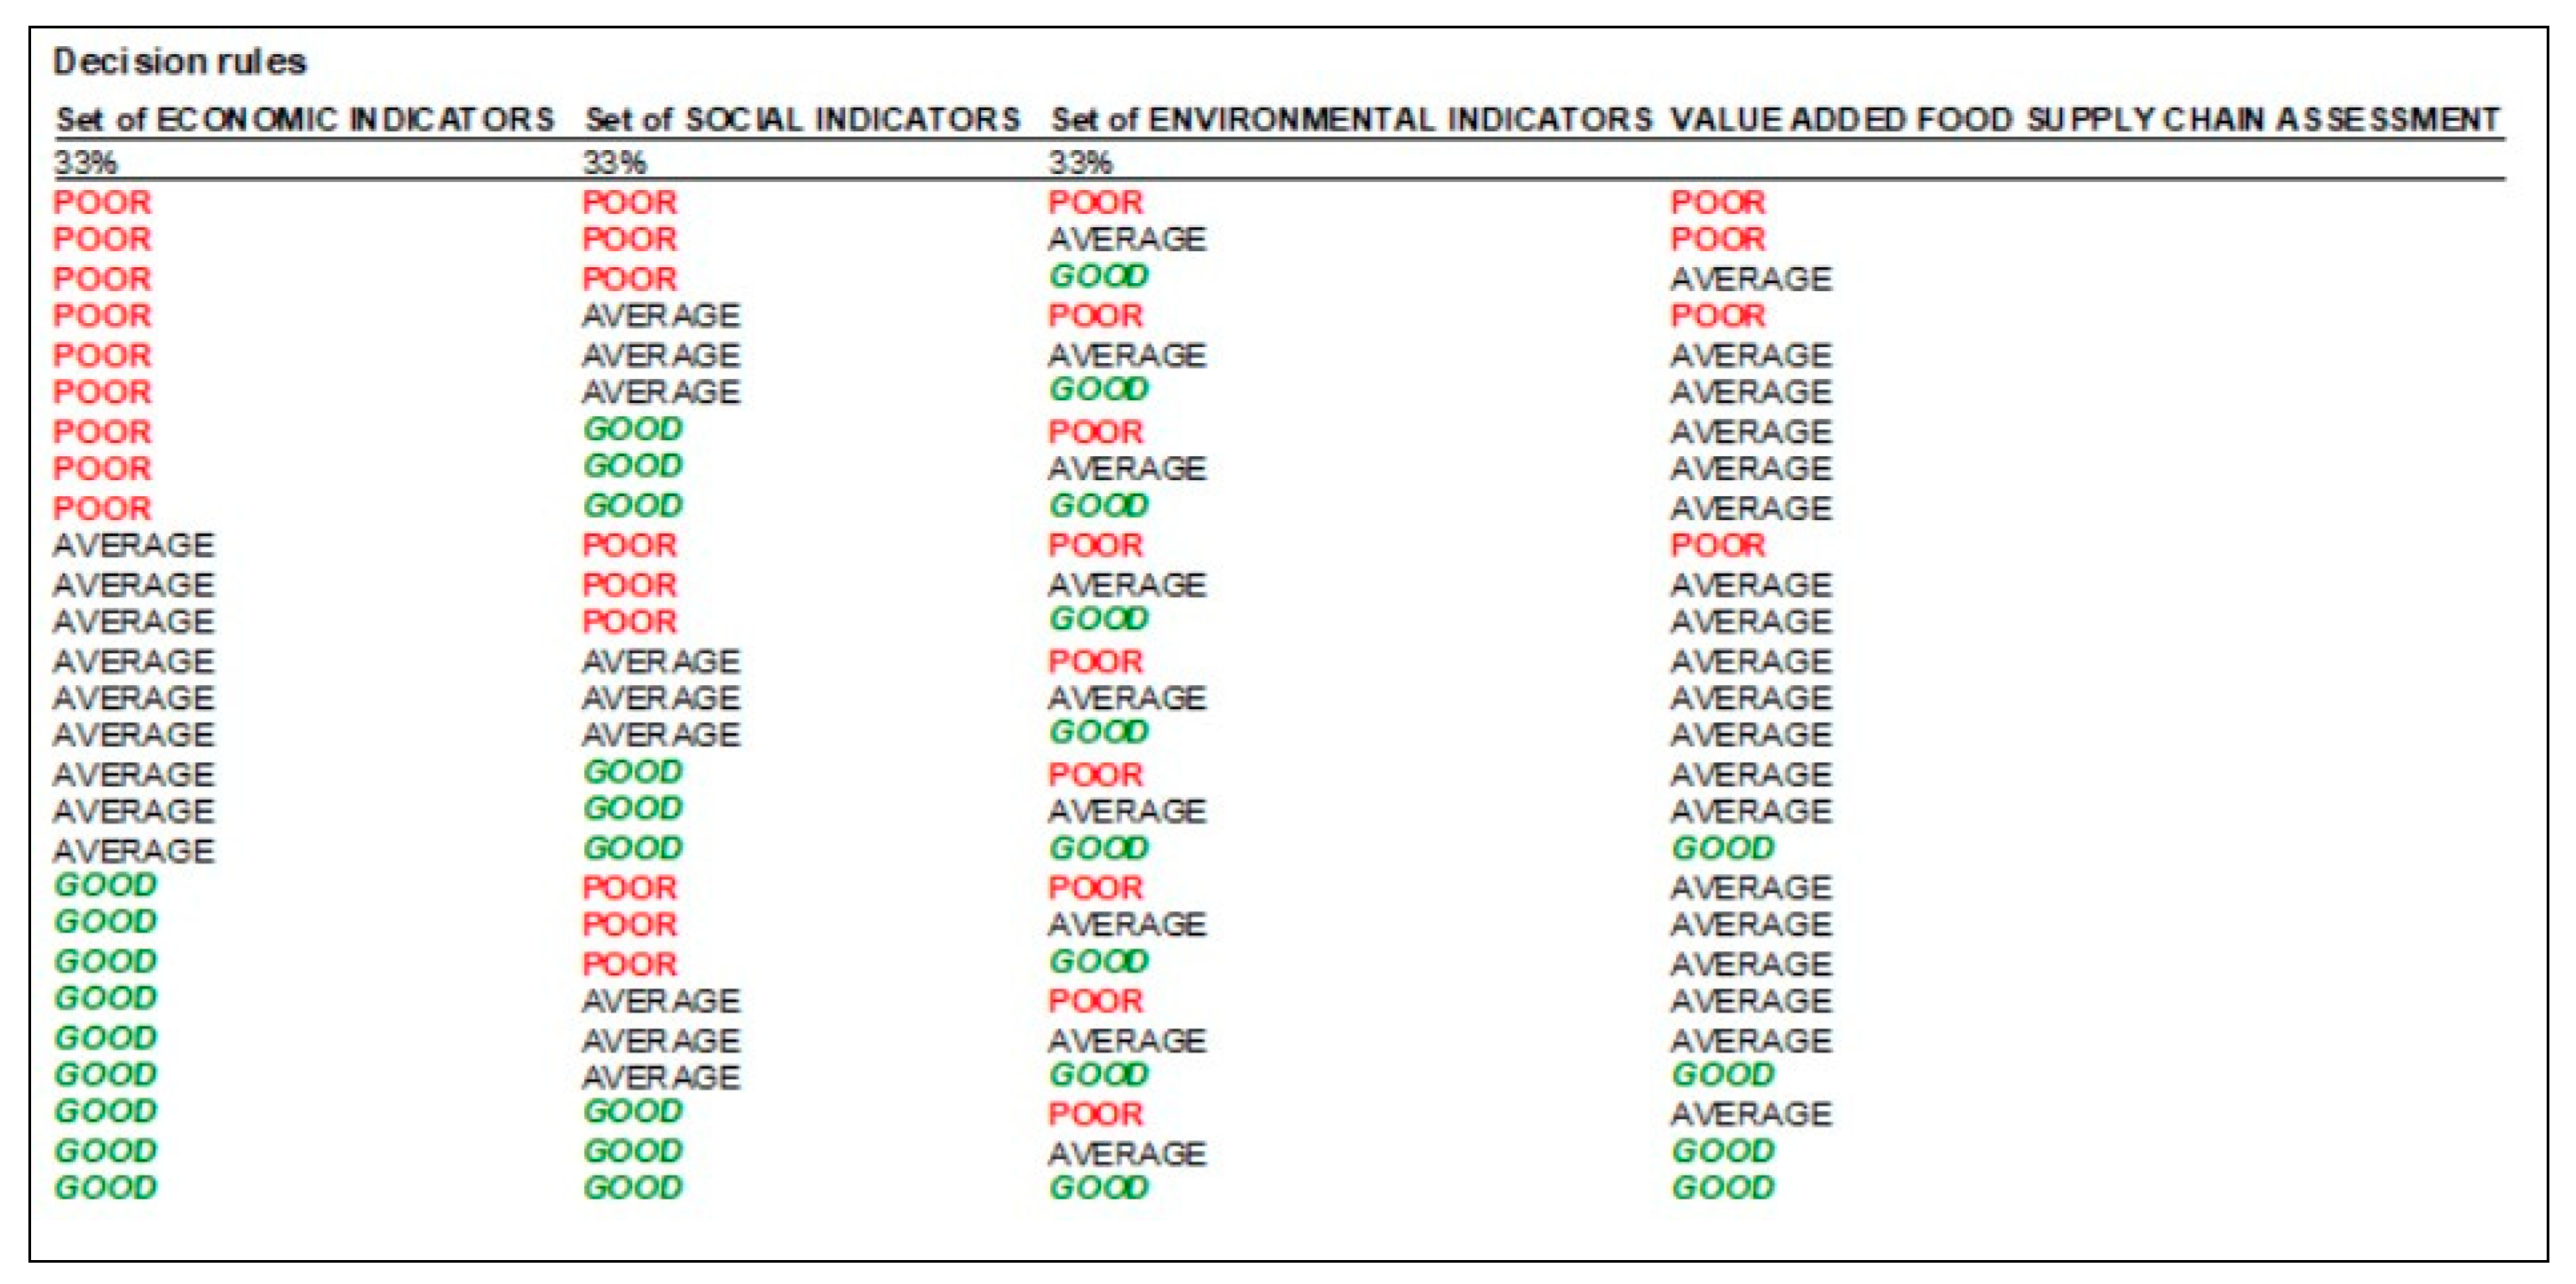
2.3. Model Development Theory
- -
- DEX uses qualitative discrete criteria; values are usually described in words (qualitative values), rarely in numbers or numerical intervals;
- -
- Utility functions are defined by simple decision rules of the type “if—then”.
- Knowledge acquisition and preparation: it helps the user to create a tree of criteria and decision rules for the problem under consideration; it is a process of structuring a decision problem and expressing preferences, where the consistency of the given decision rules is also checked by the computer on the fly.
- Evaluating and analysing variants: The acquired knowledge base is used to evaluate and analyse variants.
- -
- Explanations of the assessment: DEXi is able to explain how each individual assessment was arrived at based on the criteria values and the decision rules used.
- -
- “What-if” analysis: it is performed interactively by changing the description of the variants, re-evaluating them and comparing the results obtained with the original (reference) results.
- -
- Selective interpretation of variants: DEXi finds and outputs the sub-criteria trees that reflect the strongest or weakest features of each variant, extracting only the most relevant information.
2.4. Descriptions of the Indicators Used in the DEXi Model
2.4.1. Description of the Indicators of Economic Parameter
- (a)
- The average ratio between the producer price index for agricultural products and the price index for agricultural inputs on an annualised basis
- (b)
- Average annual change in the ratio of the average retail price of agricultural products to the farm-gate price (in per cent)
- (c)
- The average ratio between the average prices of purchased agricultural products and the own price
- (d)
- Average weekly change in the market price of the product on a representative market in %
2.4.2. Description of the Indicators of Social Parameter
- (a)
- The average ratio between the average gross wage in each production chain and the average gross wage in agriculture
- (b)
- The average change in the proportion of the economically active population engaged in a single agricultural activity compared to all activities combined in a single year (based on the proportion in 2012)
- (c)
- The average ratio between the wage index in each agricultural activity and the consumer price index
- (d)
- Average degree of self-sufficiency for individual products (between 2012 and 2021)
2.4.3. Description of Indicators of Environmental Parameter
- (a)
- Food miles—average route/distance of imports in the last 10 years, route or distance between Ljubljana and the capital of each country (between 2012 and 2021)
- (b)
- Average annual change in the proportion of all indigenous breeds of a single species compared to all livestock of a single species in %
- (c)
- Average annual change in the number of livestock farms included in the animal welfare sub-measure, in %
- (d)
- Average annual change in the proportion of organically reared animals of a single species compared to all reared animals of that species in % (based on the situation in 2012)
3. Results
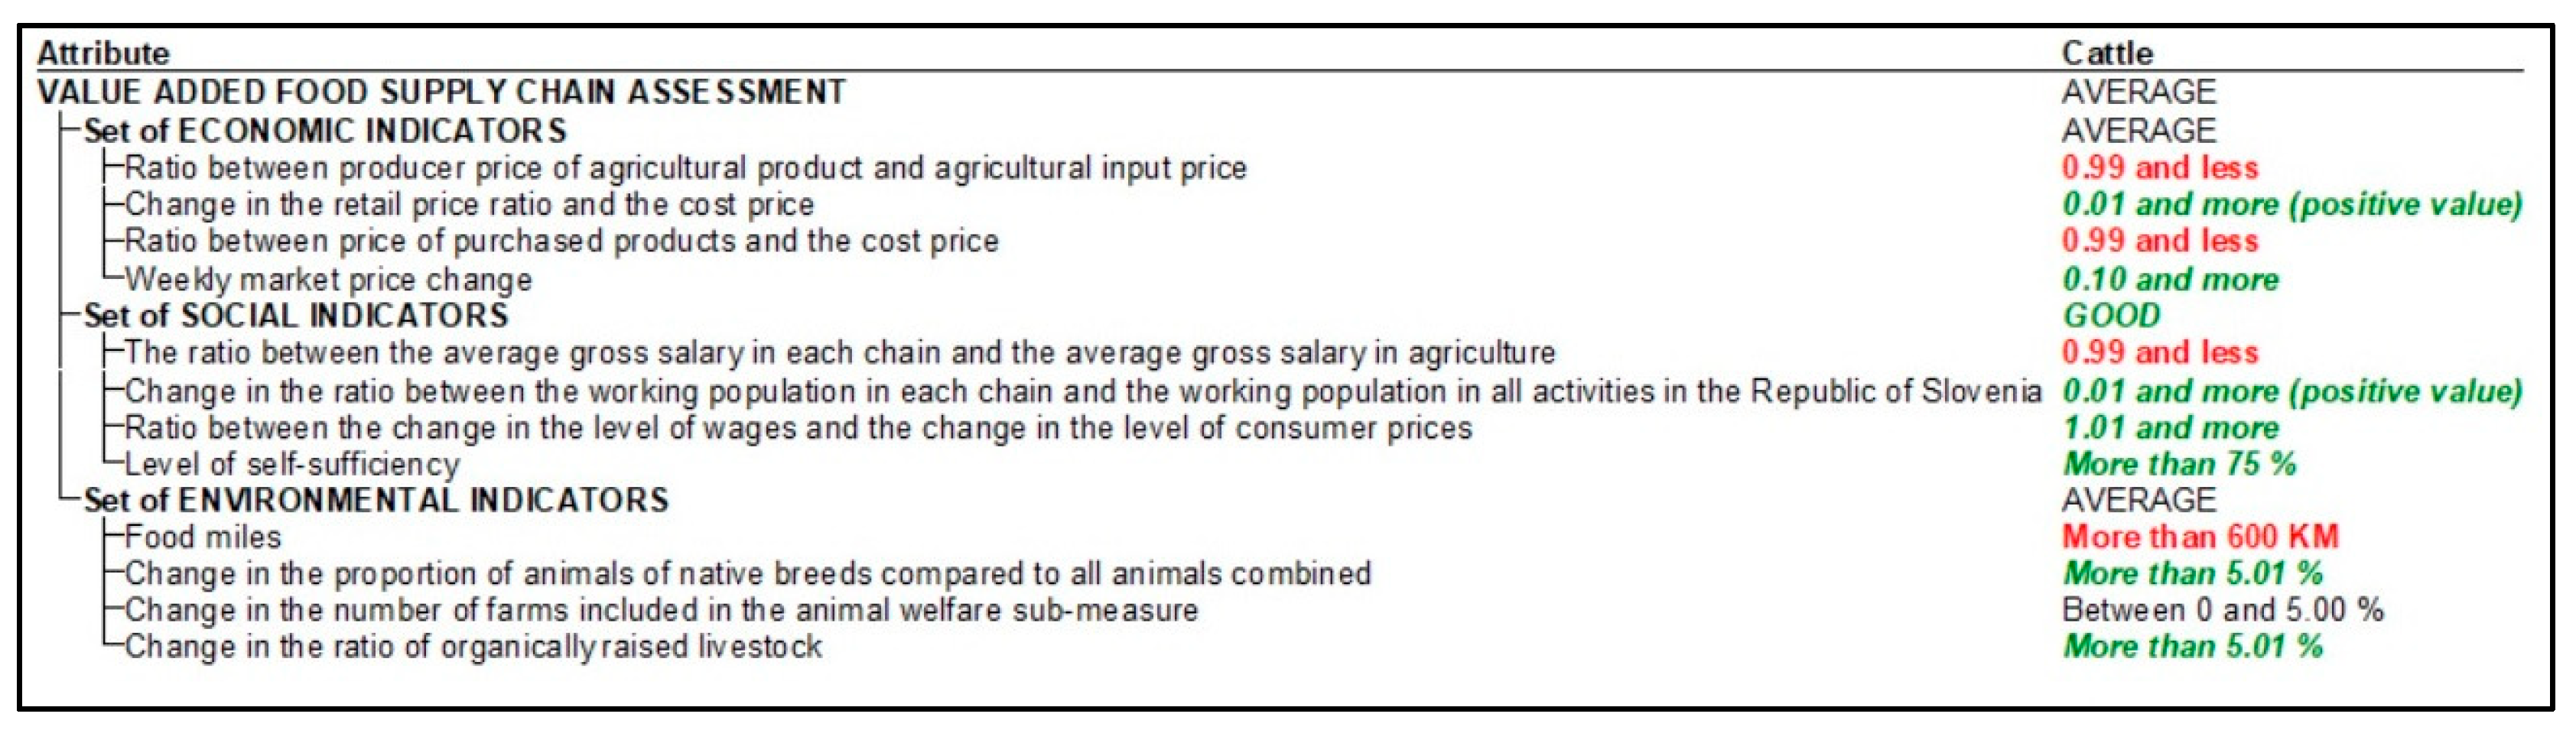
3.1. DEXi Model Results of Cattle Breeding Sector
- -
- Evolution of the ratio between the retail price (beef on the bone) and the price for own processing (young beef cattle, herd of 29 animals);
- -
- Change in the market price for beef (beef quality A-R3) on a representative market.
- -
- The average ratio between the prices of agricultural products (cattle) and the prices of agricultural inputs;
- -
- The average ratio between the prices of purchased products (bulls) and the farm’s own price.
- -
- Average changes in the share of the working population in the primary agricultural activity in each chain (cattle breeding) compared to the total working population in all activities in the Republic of Slovenia;
- -
- The average ratio between the change in the level of wages in a single agricultural activity (cattle breeding) and the change in the prices of consumer goods (total consumer goods);
- -
- Degree of self-sufficiency (beef).
- -
- the average ratio between the average gross wage in the beef sector and the average gross wage in agriculture (agriculture as a whole)
- -
- Average annual change in the proportion of all animals of indigenous breeds of a single species (cattle) compared to all bred animals of that species (cattle);
- -
- The average annual change in the proportion of organically reared animals of a single species (cattle) compared to all reared animals of that species (cattle).
- -
- Average food miles due to imports (beef, fresh, chilled, and frozen)
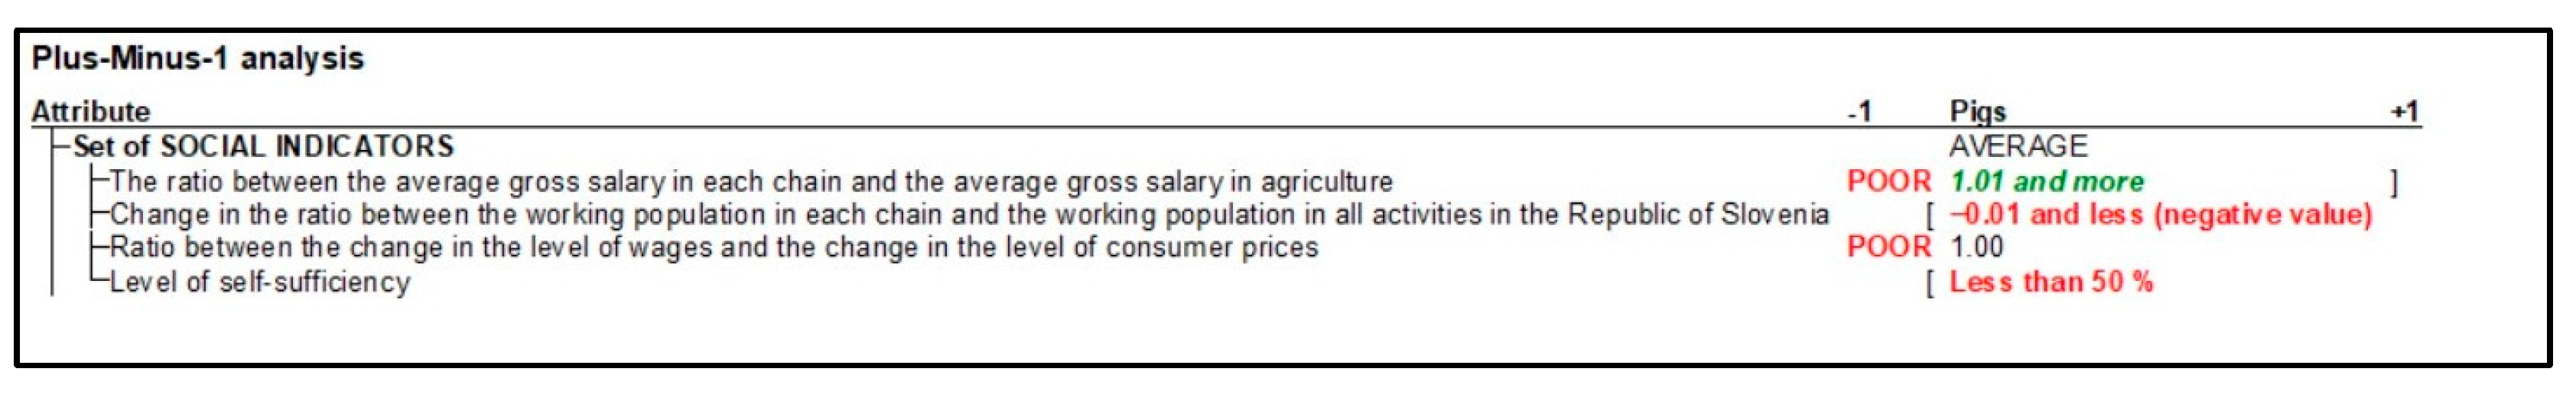
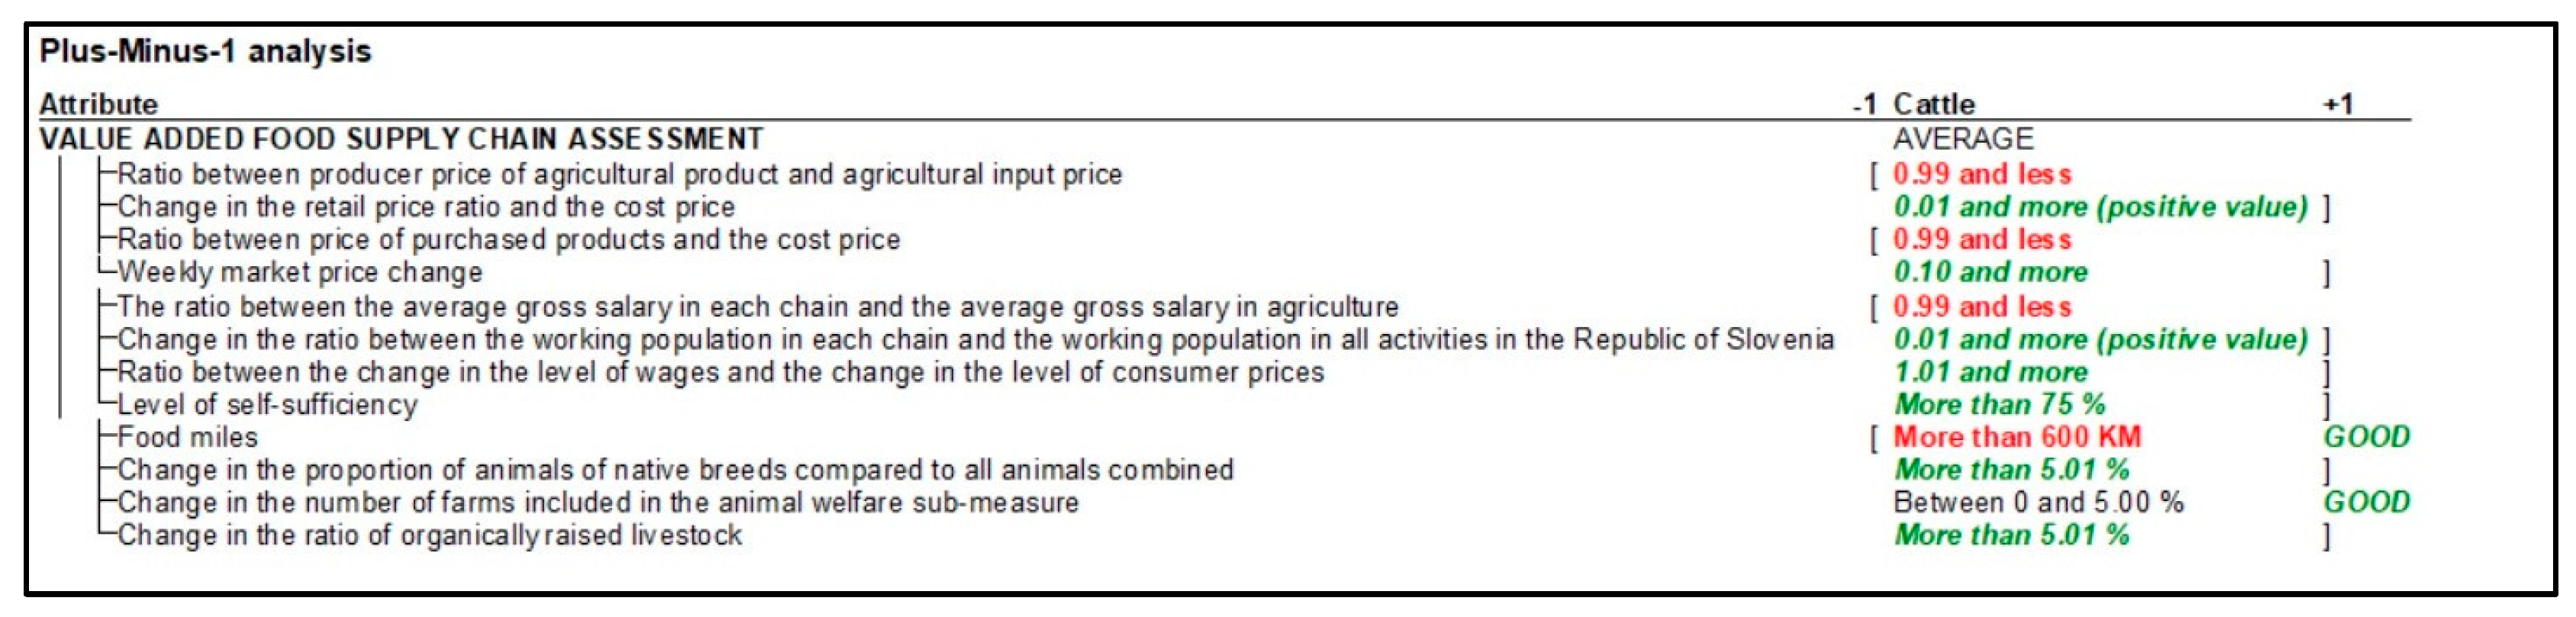
Results of Plus-Minus-1 Analysis
- -
- Indicator for the average food kilometres for the import of products (imports of fresh, chilled, and frozen meat)
- -
- Indicator for the average annual change in the number of livestock farms included in the animal welfare sub-measure (corresponding to the situation in 2016)
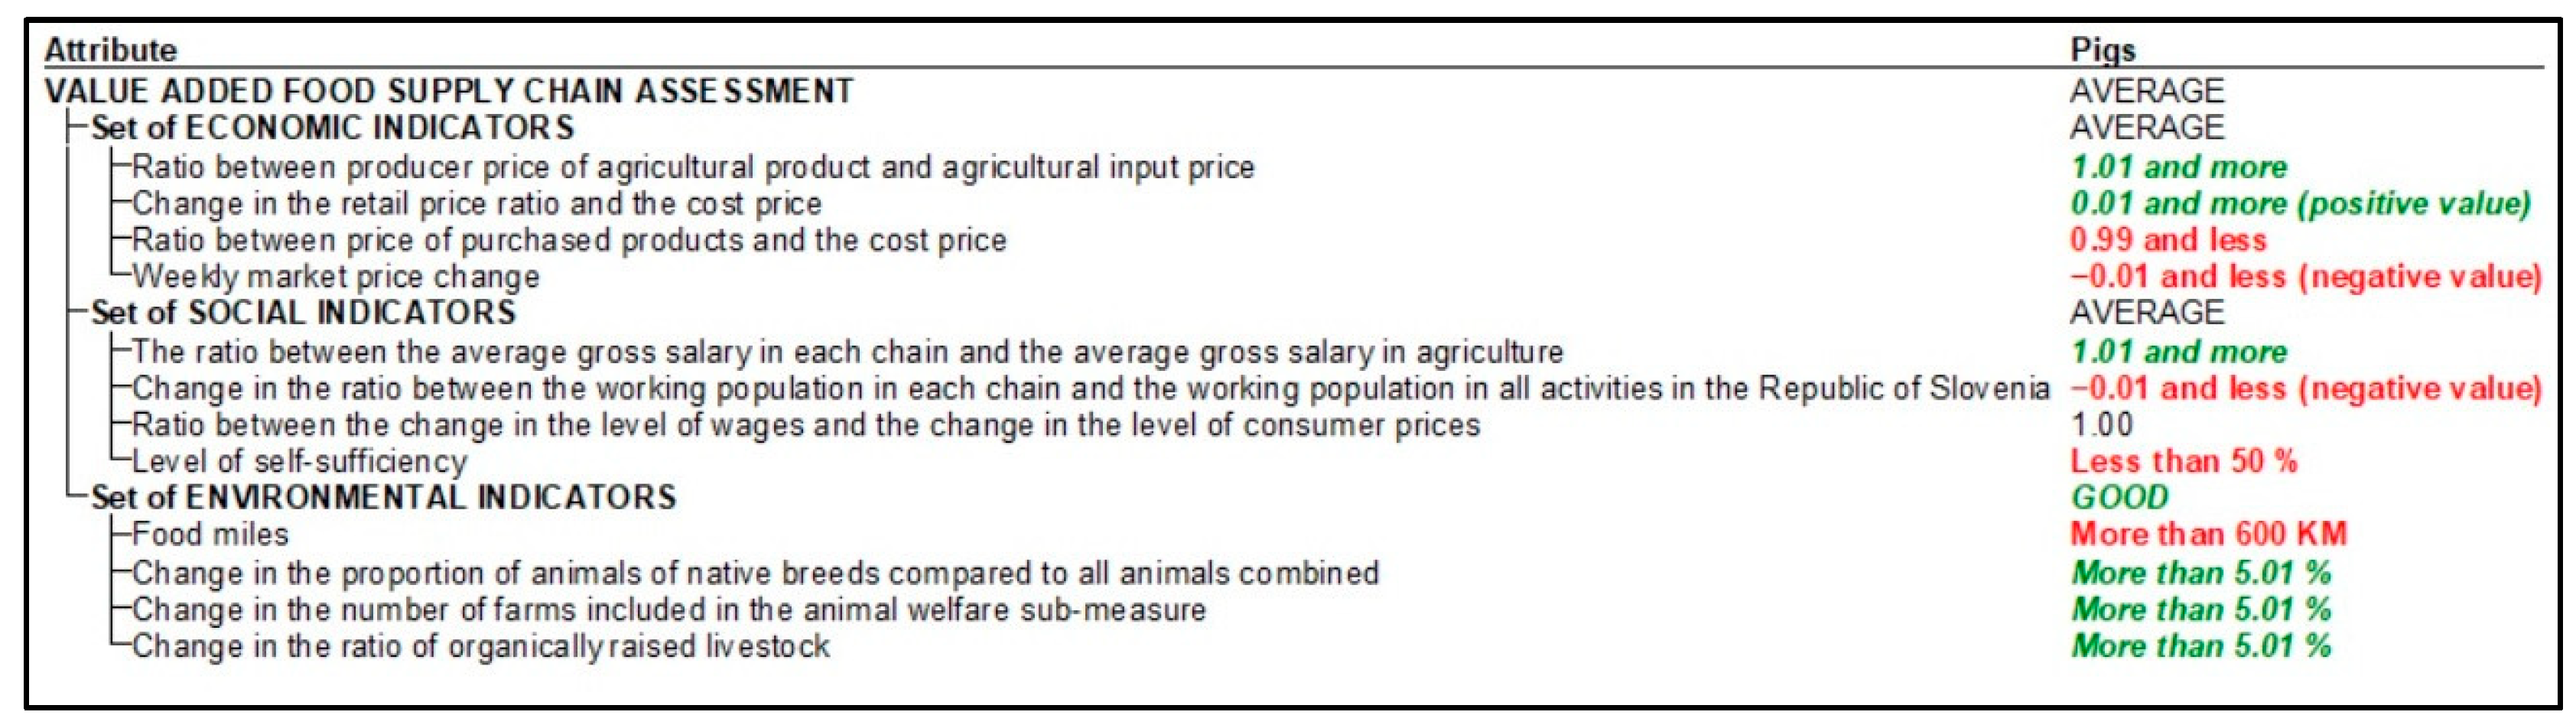
3.2. DEXi Model Results of Pig Farming Sector
- -
- The average ratio between price changes in agricultural products (pigs) and price changes in agricultural inputs
- -
- The evolution of the ratio between retail prices (bone-in pork) and the price of own production
- -
- The average ratio between the prices of purchased products (fattening pigs 50–150 kg) and own price
- -
- The development of market prices for pork (class S) on the representative market.
- -
- The average ratio between the average gross wage in each chain (pig farms) and the average gross wage in agriculture (total).
- -
- Average changes in the share of the labour force in the main agricultural activity in each chain (pig farms) compared to the total labour force in all activities in the Republic of Slovenia;
- -
- Self-sufficiency rate (pork).
- -
- The average annual change in the proportion of all animals of indigenous breeds of a single species (“Krškopoljski” pig) compared to all farmed animals of that species (pigs);
- -
- Average annual changes in the number of livestock farms included in the animal welfare sub-measure (pigs);
- -
- Average annual changes in the proportion of organically reared animals of each species compared to all reared animals of that species (pigs).
- -
- Average food miles due to imports (fresh, chilled, and frozen pork)
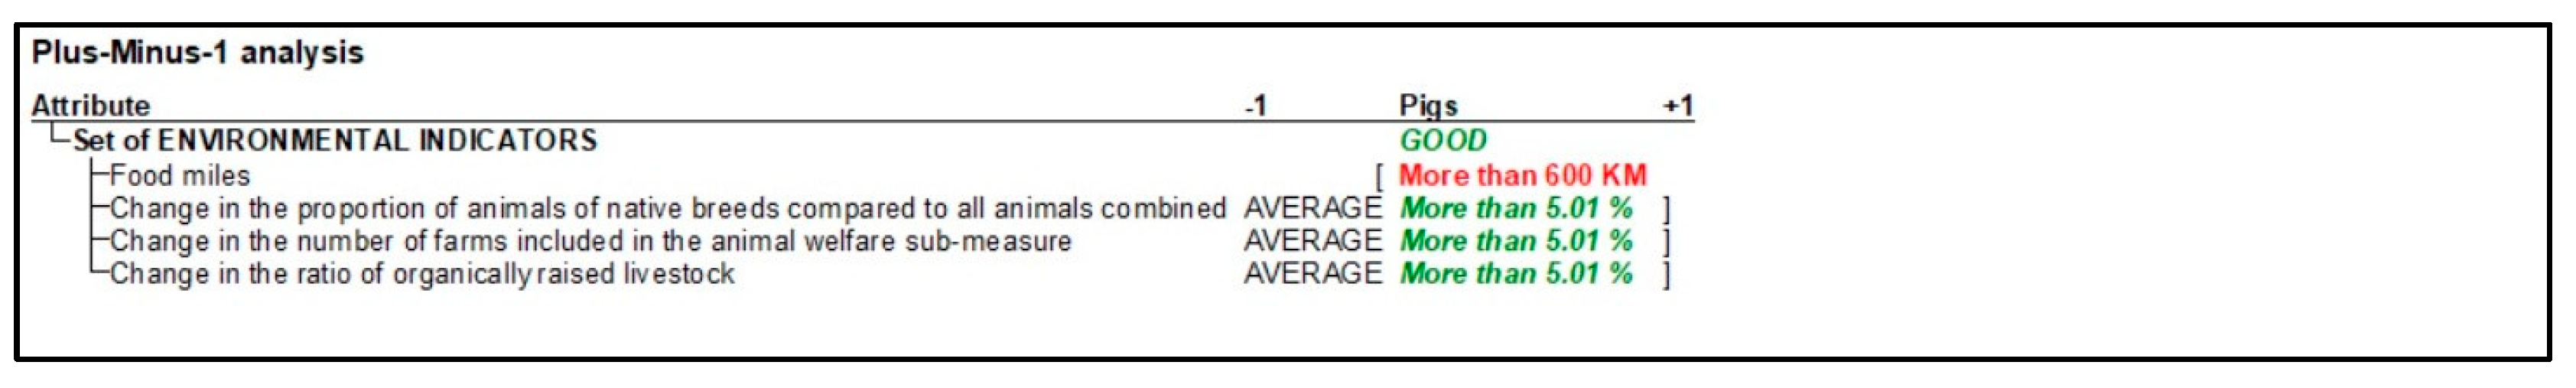
Results of Plus-Minus-1 Analysis
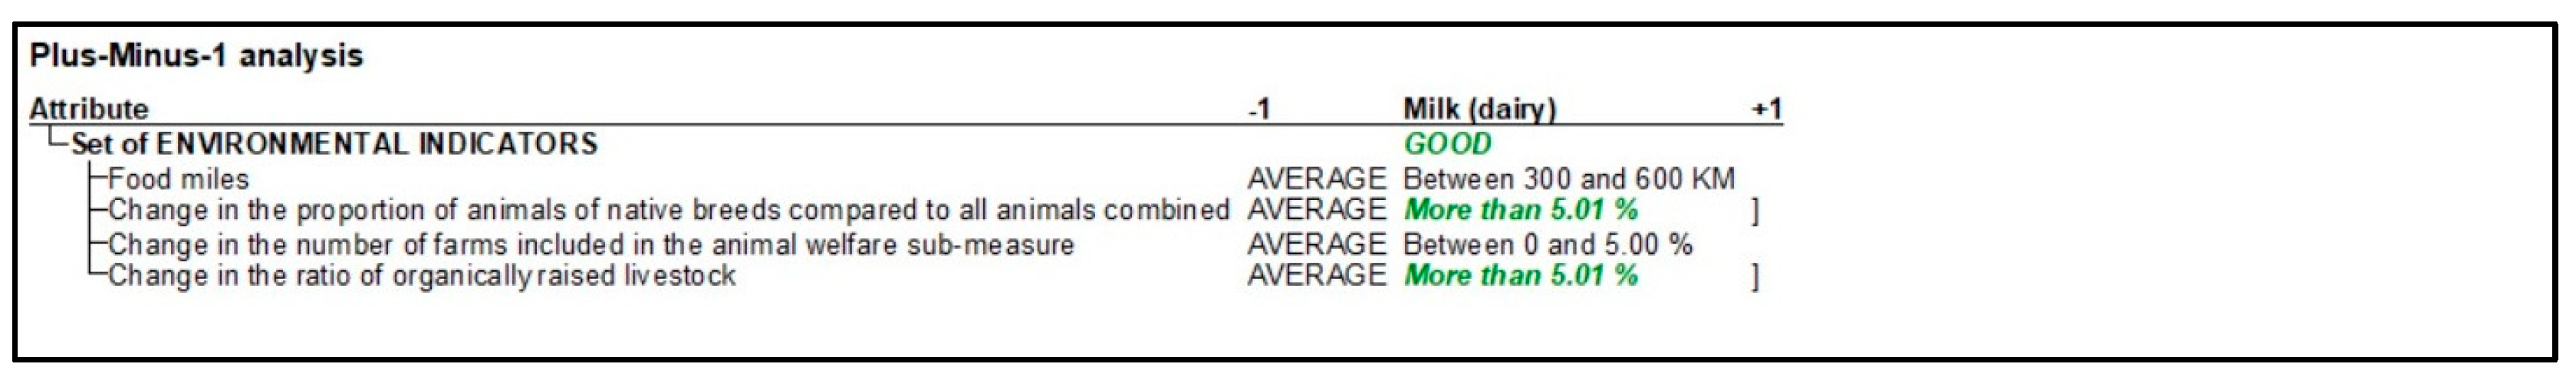
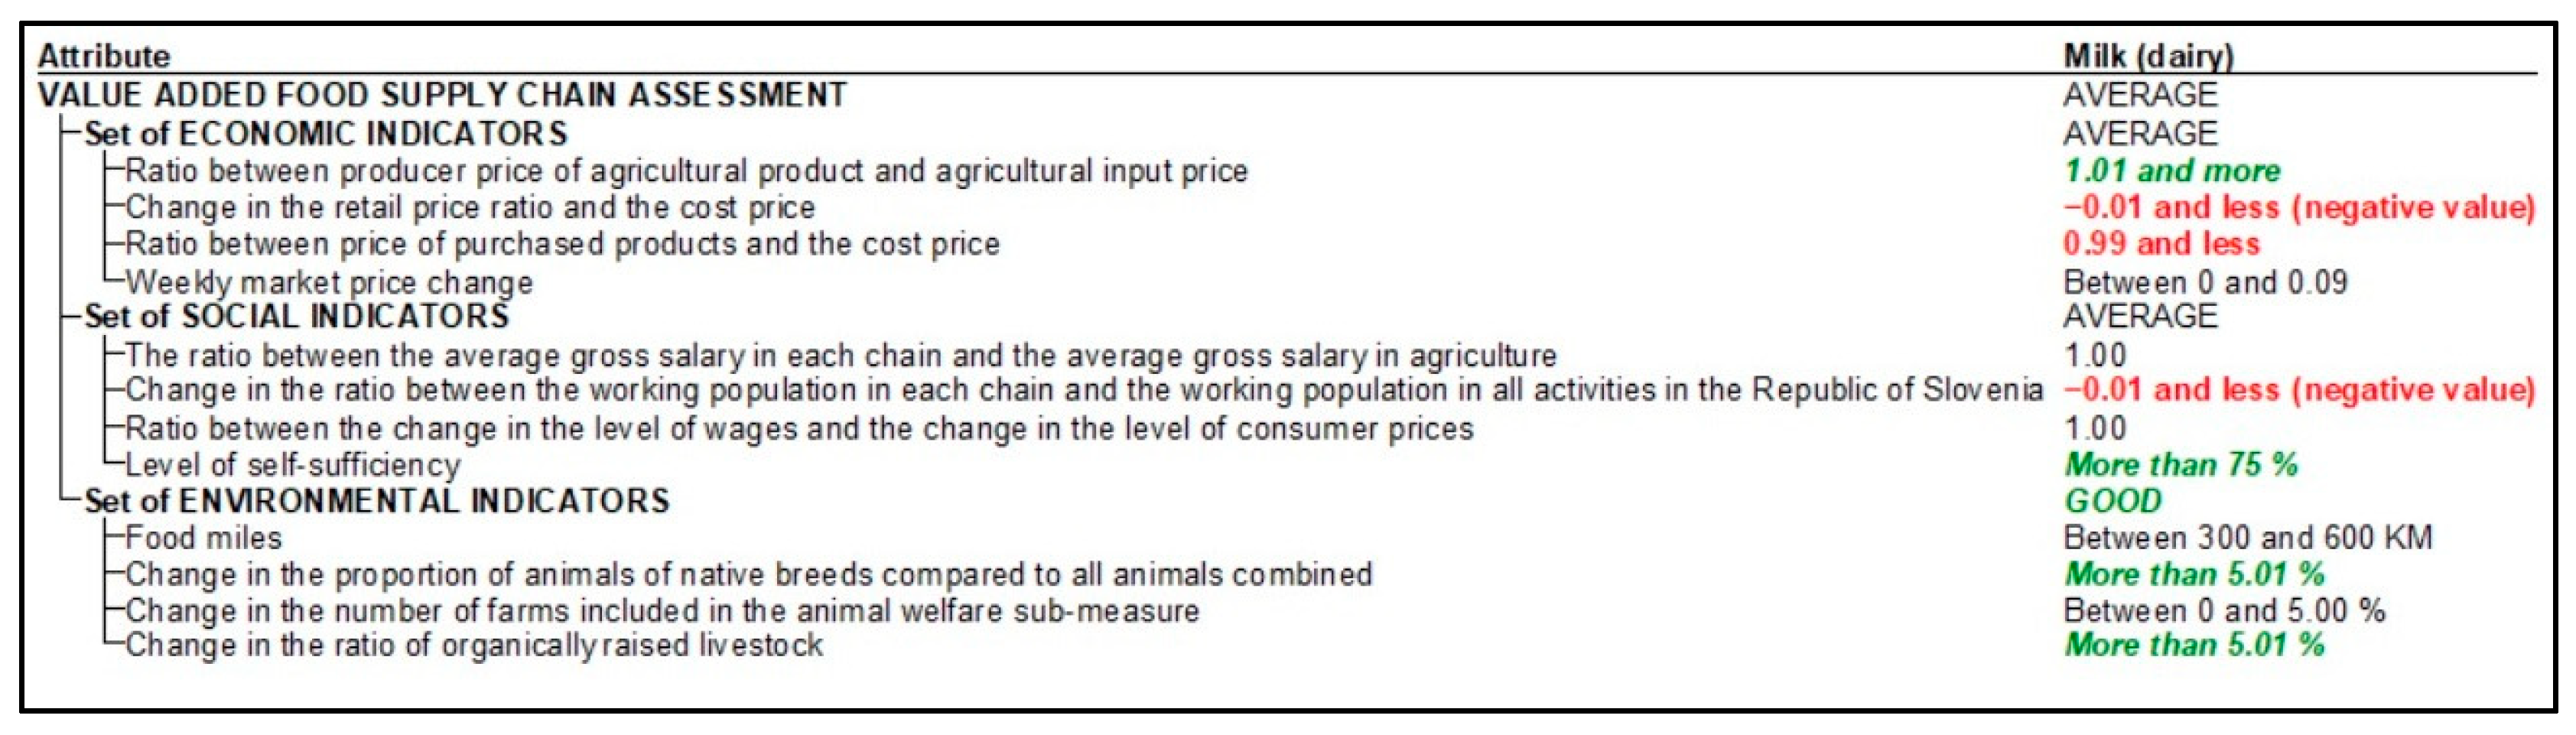
3.3. DEXi Model Results of Milk Production Sector
- -
- The average ratio between the prices of agricultural products (raw milk) and the prices of agricultural inputs
- -
- Change in the ratio between the retail price and the own price of production (milk 6500 L/cow);
- -
- Average ratio between the prices of purchased products (raw milk) and own price (milk 6500 L/cow).
- -
- Degree of self-sufficiency (milk)
- -
- Average development of the share of the economically active population in the main agricultural activity in each chain (milk production) compared to the total economically active population in all activities in the Republic of Slovenia.
- -
- The average annual change in the proportion of all animals of domestic breeds of a single species (cattle) compared to all breed animals of that species (cattle);
- -
- The average annual change in the proportion of organically reared animals of each species compared to all reared animals of that species (cattle).
- -
- Average food miles due to imports (milk and cream, not concentrated and without added sugar or other sweeteners);
- -
- Average annual change in the number of livestock farms included in the animal welfare sub-measure (cattle).
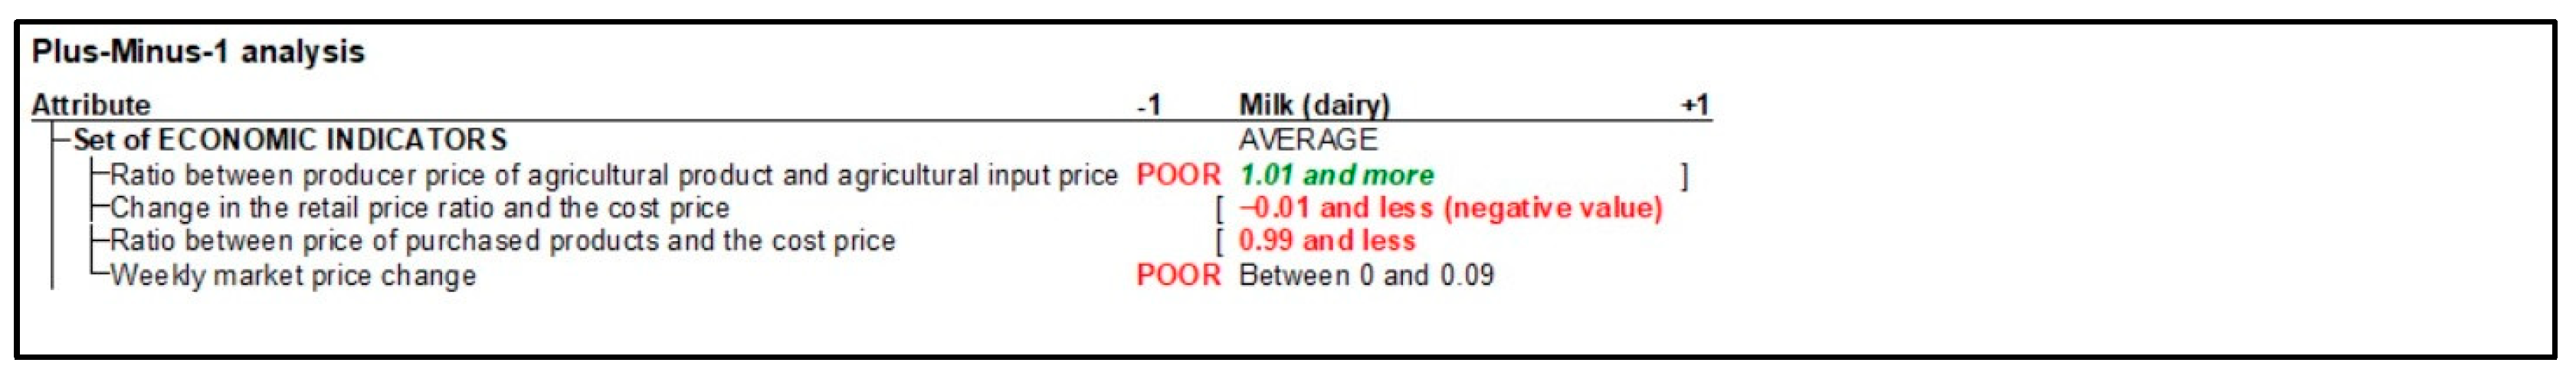
Results of Plus-Minus-1 Analysis
4. Discussion
5. Conclusions
Author Contributions
Funding
Institutional Review Board Statement
Data Availability Statement
Conflicts of Interest
Appendix A

| Economic Parameter | ||||
|---|---|---|---|---|
| Indicator | Indicator Description | Meaning of Indicator | A Stock of Value | Source of Data |
| The ratio between the prices of agricultural products and the prices of agricultural inputs | Average (multi-year) ratio between the producer price index of agricultural products and the annual agricultural input price index (between 2012 and 2021) Z = average (multi-year) ratio X (Ratio) = Crop Price Index/Total Input Price Index Z = (X1 + X2 + … + Xn)/n | Added value or a positive economic situation for the primary producer (farmer) occurs if the prices of inputs rise more slowly than the prices of agricultural products for growers. All ratio values greater than 1.00 represent a positive economic position for the primary producer. | POOR—≥0.99 AVERAGE—1 GOOD—≤1.01 | SORS |
| Change in the ratio between retail price and own price | Average year-on-year change in the ratio between the average retail price of agricultural products and the own price, on an annual basis, in % Z = average year-on-year change in ratio X (ratio) = retail price/own price Y (year-on-year change in ratio) = ((X – X–1)/X–1) × 100 Z = (Y1 + Y2 + … + Yn)/n | Added value or a positive economic situation for the primary producer (farmer) occurs if the prices of inputs rise more slowly than the prices of agricultural products for growers. All ratio values greater than 1.00 represent a positive economic position for the primary producer. | POOR—≥0.01 AVERAGE—0 GOOD—≤0.01 | SORS AIS (Model calculations) |
| The ratio between the prices of purchased products and the own price | Average (multi-year) ratio between average prices of purchased agricultural products and own price (between 2018 and 2021) Z = average (multi-year) ratio X (ratio) = purchase price/own price Z = (X1 + X2 + … + Xn)/n | Added value, or a favourable economic position for the primary producer, occurs when the prices of purchased agricultural products are higher than their own price. Considering that the goal of every grower is to make a profit, it is very important that the sales revenue is higher than the production costs. | POOR—≥0.99 AVERAGE—1 GOOD—≤1.01 | SORS AIS (Model calculations) |
| Weekly market price change | Average weekly change in product market price in % Z = average weekly change Y (weekly price change) = ((X – X–1)/X–1) × 100 Z = (Y1 + Y2 + … + Yn)/n | Added value or a positive economic position for the primary producer occurs if the average weekly price change is positive over a significant period of time. | POOR—≥0.10% (more than 0.10) AVERAGE—0 0.09 (between 0 and 0.09) GOOD—≤0 (less than 0) | MAFF ARSAMRD |
| Social Parameter | ||||
| Indicator | Indicator Description | Meaning of Indicator | A Stock OF Value | Source of Data |
| The ratio between the average gross salary in each chain and the average gross salary in agriculture | Average (multi-year) ratio between the average gross salary in each production chain and the average gross salary in the Republic of Slovenia (between 2014 and 2021) Z = average (multi-year) ratio X (ratio) = gross wage in each chain/gross wage in agriculture in total Z = (X1 + X2 + … + Xn)/n | It shows how much the primary producers in the considered chains are financially rewarded compared to the average payment in agriculture, which, in the case of an above-average payment in the individual considered chain (cattle, pigs, and dairy), indicates a certain added value of these chains. | POOR—≥0.99 AVERAGE—1 GOOD—≤1.01 | SORS |
| Change in the ratio between the working population in each chain and the working population in all activities in the Republic of Slovenia | Average annual change in the ratio between the working population in each chain and the working population in all activities in the Republic of Slovenia together, in % (based on the situation in 2012) Z = average annual change in the ratio X (ratio) = number of DAP in each activity/number of DAP in all activities together Y (change in ratio over the years in %) = ((Xn – X2012)/X2012) × 100 Z = Y/n | It shows the trend of changing the share of the working population in each chain compared to the entire working population in the Republic of Slovenia. Added value is given if the trend of changing the share is positive in relation to the state or value of the ratio in 2012. | POOR—≥0.01 AVERAGE—0 GOOD—≤0.01 | SORS |
| The ratio between the change in the level of wages and the change in the level of consumer prices | Average (multi-month) ratio between the wage index in individual agricultural activity and the consumer price index (between 2014 and 2021) Z = average (multi-year) ratio X (ratio) = wage index in individual activity/consumer price index Z = (X1 + X2 + … + Xn)/n | This criterion expresses a certain added value for subjects in individual agricultural activities if their wages rise faster than the prices of consumer goods. | POOR—≥0.99 AVERAGE—1 GOOD—≤1.01 | SORS |
| Level of self-sufficiency | Average level of self-sufficiency with individual products or with products from individual sectors (between 2012 and 2021) | The degree of self-sufficiency shows the extent to which domestic production (from domestic of the basic product) covers domestic consumption (consumption for fodder, food and consumption in the industry) | POOR—˃50 AVERAGE—≤50 and ˃75 GOOD—≤75 | SORS AIS |
| Environmental Parameter | ||||
| Indicator | Indicator Description | Meaning of Indicator | A Stock OF Value | Source of Data |
| Food miles | Food kilometres—the average route/distance of imports in the last 10 years; the route or distance is calculated based on the distance between Ljubljana and the capital of the individual country of import and based on the share of imports from the individual country (between 2012 and 2021) | The route or distance travelled during the average transport when importing products in an individual chain is an important indicator of the sustainability of the chain itself, as transport has a significant impact on CO2 emissions, the well-being of livestock in transport, the freshness of products, etc. | POOR ˃ 300 AVERAGE—≤300 and ˃600 GOOD—≤600 | SORS GOOGLE MAPS |
| Change in the proportion of animals of indigenous breeds compared to all animals combined | Average year-on-year change in the share of all indigenous breeds of an individual animal species compared to all farmed animals in an individual species in % (between 2014 and 2021) Z = average year-on-year change in ratio X (ratio) = number of indigenous animals (individual species)/total number of animals (individual species) Y (change in ratio between individual consecutive years, in %) = ((X – X–1)/X–1) × 100 Z = (X + X–1 + … + Xn)/n | The added value of an individual chain is given if the value of the average change is positive, which means that the share of indigenous breeds in an individual chain is increasing in the period between 2012 and 2021. | POOR ˃ 0.00 AVERAGE—≤0.01 and ≥5.00 GOOD—≤5.01 | SORS MAFF |
| Change in the number of farms included in the animal welfare sub-measure | Average year-on-year change in the number of livestock farms included in the animal welfare sub-measure, in % (between 2015/2016 and 2021, respectively) Z = average year-on-year change in the number of farms (in %) X = number of farms included in the sub-measure Y (change in the number of farms between individual consecutive years, in %) = ((X – X–1)/X–1) × 100 Z = Y/n | The added value in a certain chain is given if the value of the average annual changes is positive, which means that in the period between 2015 and 2016 and 2021, the number of farms that are included in the animal welfare sub-measure in each chain increases. | POOR ˃ 0.00 AVERAGE—≤0.01 and ≥5.00 GOOD—≤5.01 | AIS |
| Change in the share of organically raised livestock | Average year-on-year change in the share of organically raised livestock of a particular species compared to all farmed animals of that species in % (between 2012 and 2021) Z = average annual change in ratio X (ratio) = number of ECO animals (individual species)/number of all animals (individual species) Y (change in ratio between individual consecutive years, in %)) = ((X – X–1)/X–1) × 100 Z = (X + X–1 + … + Xn)/n | The added value in an individual chain is given if the value of these average annual changes is positive in relation to the period in question, which means that the share of organically raised animals is increasing compared to the entire population of a certain raised animal species. | POOR ˃ 0.00 AVERAGE—≤0.01 and ≥5.00 GOOD—≤5.01 | AIS |
References
- Ostrom, M.; Master, K.D.; Noe, E.; Schermer, M. Values-based Food Chains from a Transatlantic Perspective: Exploring a Middle Tier of Agri-food System Development. Int. J. Sociol. Agric. Food 2018, 24. [Google Scholar] [CrossRef]
- Chiffoleau, Y.; Dourian, T. Sustainable Food Supply Chains: Is Shortening the Answer? A Literature Review for a Research and Innovation Agenda. Sustainability 2020, 12, 9831. [Google Scholar] [CrossRef]
- Béné, C.; Oosterveer, P.; Lamotte, L.; Brouwer, I.D.; de Haan, S.; Prager, S.D.; Talsma, E.F.; Khoury, C.K. When food systems meet sustainability–Current narratives and implications for actions. World Dev. 2019, 113, 116–130. [Google Scholar] [CrossRef]
- Feenstra, G.; Hardesty, S. Values-Based Supply Chains as a Strategy for Supporting Small and Mid-Scale Producers in the United States. Agriculture 2016, 6, 39. [Google Scholar] [CrossRef]
- Rivera, M.; Guarín, A.; Pinto-Correia, T.; Almaas, H.; Mur, L.A.; Burns, V.; Czekaj, M.; Ellis, R.; Galli, F.; Grivins, M.; et al. Assessing the role of small farms in regional food systems in Europe: Evidence from a comparative study. Glob. Food Secur. 2020, 26, 100417. [Google Scholar] [CrossRef]
- Prišenk, J. Vplivi Agro-Živilske Verige z Dodano Vrednostjo na Socio-Ekonomski Položaj Gorskih Mlečnih Kmetij. Ph.D. Thesis, Faculty of Agriculture and Life Sciences. University of Maribor, Maribor, Slovenia, 2015. [Google Scholar]
- SEA. Food Self–Sufficiency. Environmental Indicators; Slovenian Environment Agency: Ljubljana, Slovenia, 2021. [Google Scholar]
- DuPuis, E.M.; Goodman, D. Should we go “home” to eat?: Toward a reflexive politics of localism. J. Rural. Stud. 2005, 21, 359–371. [Google Scholar] [CrossRef]
- Bui, S.; Costa, I.; De Schutter, O.; Dedeurwaerdere, T.; Hudon, M.; Feyereisen, M. Systemic ethics and inclusive governance: Two key prerequisites for sustainability transitions of agri-food systems. Agric. Hum. Values 2019, 36, 277–288. [Google Scholar] [CrossRef]
- Malak-Rawlikowska, A.; Majewski, E.; Wąs, A.; Borgen, S.O.; Csillag, P.; Donati, M.; Freeman, R.; Hoang, V.; Lecoeur, J.L.; Mancini, M.C.; et al. Measuring the Economic, Environmental, and Social Sustainability of Short Food Supply Chains. Sustainability 2019, 11, 4004. [Google Scholar] [CrossRef]
- Christopher, M. Logistics and Supply Chain Management: Logistics & Supply Chain Management; Pearson UK: London, UK, 2016. [Google Scholar]
- Bayir, B.; Charles, A.; Sekhari, A.; Ouzrout, Y. Issues and Challenges in Short Food Supply Chains: A Systematic Literature Review. Sustainability 2022, 14, 3029. [Google Scholar] [CrossRef]
- Peterson, H.H.; Feenstra, G.; Ostrom, M.; Tanaka, K.; Brekken, C.A.; Engelskirchen, G. The value of values-based supply chains: Farmer perspective. Agric. Hum. Values 2022, 39, 385–403. [Google Scholar] [CrossRef] [PubMed]
- Viitaharju, L.; Lähdesmäki, M.; Kurki, S.; Valkosalo, P. Food Supply Chains in Lagging Rural Regions of Finland: An SME Perspective; University of Helsinki: Helsinki, Finland, 2005. [Google Scholar]
- Todorovic, V.; Maslaric, M.; Bojic, S.; Jokic, M.; Mircetic, D.; Nikolicic, S. Solutions for More Sustainable Distribution in the Short Food Supply Chains. Sustainability 2018, 10, 3481. [Google Scholar] [CrossRef]
- Clark, J.K.; Jablonski, B.B.R.; Inwood, S.; Irish, A.; Freedgood, J. A contemporary concept of the value(s)-added food and agriculture sector and rural development. Community Dev. 2021, 52, 186–204. [Google Scholar] [CrossRef]
- Marsden, T.; Banks, J.; Bristow, G. Food Supply Chain Approaches: Exploring their Role in Rural Development. Sociol. Rural. 2000, 40, 424–438. [Google Scholar] [CrossRef]
- Reckinger, R. Values-based territorial food networks: Qualifying sustainable and ethical transitions of alternative food networks. Reg. Cohes. 2022, 12, 78–109. [Google Scholar] [CrossRef]
- Albala, K. The SAGE Encyclopedia of Food Issues; SAGE Publications: Thousand Oaks, CA, USA, 2015. [Google Scholar]
- Michel-Villarreal, R.; Vilalta-Perdomo, E.L.; Canavari, M.; Hingley, M. Resilience and Digitalization in Short Food Supply Chains: A Case Study Approach. Sustainability 2021, 13, 5913. [Google Scholar] [CrossRef]
- Peters, R.; Markuszewska, A.; Prior, A.; Strano, A.; Bálint, B.; Midoux, B.; Bros, C.; Koutsaftaki, C.; Jochum, C.; Buff, C.; et al. EU Rural Review: Local Food and Short Supply Chains. In European Network for Rural Development. 2012. Available online: https://ec.europa.eu/enrd/sites/default/files/E8F24E08-0A45-F272-33FB-A6309E3AD601.pdf (accessed on 10 January 2024).
- Bojnec, Š.; Latruffe, L. Farm size, agricultural subsidies and farm performance in Slovenia. Land Use Policy 2013, 32, 207–217. [Google Scholar] [CrossRef]
- Bojnec, Š.; Fertő, I. The growth of farms: A Hungarian-Slovenian comparison. Post-Communist Econ. 2021, 33, 79–93. [Google Scholar] [CrossRef]
- Guiomar, N.; Godinho, S.; Pinto-Correia, T.; Almeida, M.; Bartolini, F.; Bezák, P.; Biró, M.; Bjørkhaug, H.; Bojnec, Š.; Brunori, G.; et al. Typology and distribution of small farms in Europe: Towards a better picture. Land Use Policy 2018, 75, 784–798. [Google Scholar] [CrossRef]
- Zidar, N.; Turk, J.; Prišenk, J. Expressing Added Value in Food Supply Chains. Agric. Sci. 2023, 20, 31–40. [Google Scholar] [CrossRef]
- Yakovleva, N. Measuring the Sustainability of the Food Supply Chain: A Case Study of the UK. J. Environ. Policy Plan. 2007, 9, 75–100. [Google Scholar] [CrossRef]
- Nikoloski, T.; Udovč, A.; Pavlovič, M.; Rajkovič, U. Multi-criteria assessment model for farm reorientation. J. Decis. Syst. 2018, 27 (Suppl. S1), 79–87. [Google Scholar] [CrossRef]
- Montemurro, F.; Persiani, A.; Diacono, M. Environmental Sustainability Assessment of Horticultural Systems: A Multi-Criteria Evaluation Approach Applied in a Case Study in Mediterranean Conditions. Agronomy 2018, 8, 98. [Google Scholar] [CrossRef]
- Nikoloski, T.; Udovč, A.; Pavlovič, M.; Rajkovič, U. Farm reorientation assessment model based on multi-criteria decision making. Comput. Electron. Agric. 2017, 140, 237–243. [Google Scholar] [CrossRef]
- Bohanec, M. DEX (Decision EXpert): A Qualitative Hierarchical Multi-criteria Method. In Multiple Criteria Decision Making: Techniques, Analysis and Applications; Springer: Singapore, 2022; pp. 39–78. [Google Scholar] [CrossRef]
- Cicciù, B.; Schramm, F.; Schramm, V.B. Multi-criteria decision making/aid methods for assessing agricultural sustainability: A literature review. Environ. Sci. Policy 2022, 138, 85–96. [Google Scholar] [CrossRef]
- Vittersø, G.; Torjusen, H.; Laitala, K.; Tocco, B.; Biasini, B.; Csillag, P.; de Labarre, M.D.; Lecoeur, J.L.; Maj, A.; Majewski, E.; et al. Short Food Supply Chains and Their Contributions to Sustainability: Participants’ Views and Perceptions from 12 European Cases. Sustainability 2019, 11, 4800. [Google Scholar] [CrossRef]
- Lyson, T.A.; Stevenson, G.W.; Welsh, R. Food and the Mid-Level Farm: Renewing an Agriculture of the Middle; MIT Press: Cambridge, MA, USA, 2008. [Google Scholar]
- Pirog, R.; Bregendahl, C. Creating Change in the Food System: The Role of Regional Food Networks in Iowa; Center for Regional Food Systems, Michigan State University: East Lansing, MI, USA, 2012. [Google Scholar]
- Stevenson, G.W.; Clancy, K.; King, R.; Lev, L.; Ostrom, M.; Smith, S. Midscale Food Value Chains: An Introduction. J. Agric. Food Syst. Community Dev. 2011, 1, 27–34. [Google Scholar] [CrossRef]
- Feagan, R.B.; Morris, D. Consumer quest for embeddedness: A case study of the Brantford Farmers’ Market. Int. J. Consum. Stud. 2009, 33, 235–243. [Google Scholar] [CrossRef]
- Wittman, H.; Beckie, M.; Hergesheimer, C. Linking Local Food Systems and the Social Economy? Future Roles for Farmers’ Markets in Alberta and British Columbia. Rural. Sociol. 2012, 77, 36–61. [Google Scholar] [CrossRef]
- Mugerle, M. Model Upravljanja z Znanjem za Omrežno Pomoč Strankam. Master’s Thesis, Faculty of Organizational Sciences, University of Maribor, Maribor, Slovenia, 2003. [Google Scholar]
- Žnidaršič, M.; Bohanec, M. Handling uncertainty in DEX methodology. In Proceedings of the URPDM 2010: Proceedings of the 25th Mini-EURO Conference, Coimbra, Portugal, 15–17 April 2010. [Google Scholar]
- Bohanec, M.; Rajkovič, V. DEX: An expert system shell for decision support. Sistemica 1990, 1, 145–157. [Google Scholar]
- Bohanec, M.; Rajkovic, V. Multi-attribute decision modeling: Industrial applications of DEX. Inform. Ljubl. 1999, 23, 487–491. [Google Scholar]
- Bohanec, M.; Žnidaršič, M.; Rajkovič, V.; Bratko, I.; Zupan, B. DEX Methodology: Three Decades of Qualitative Multi-Attribute Modeling. Informatica 2013, 37, 49–54. [Google Scholar]
- Jereb, E.; Bohanec, M.; Rajkovič, V. Dexi: Računalniški Program za Večparametrsko Odločanje: Uporabniški Priročnik; Moderna Organizacija: Kranj, Slovenia, 2003. [Google Scholar]
- SORS. Producer Price Indices of Agricultural Products (Average 2015=100) by Agricultural Product, Year and Measures; Statistical Office of the Republic of Slovenia: Ljubljana, Slovenia, 2023; Available online: https://pxweb.stat.si/sistat/en/Home/GetSearchResultsRedirect?searchQuery=Producer%20price%20indices%20of%20agricultural%20products%20(average%202015=100)%20by%20agricultural%20product,%20year%20and%20measures&searchString=Producer%20price%20indices%20of%20agricultural%20products%20(average%202015=100)%20by%20agricultural%20product,%20year%20and%20measures (accessed on 20 February 2023).
- SORS. Agricultural Input Price Indices (Average 2015=100) by Goods and Services, Year and Measures; Statistical Office of the Republic of Slovenia: Ljubljana, Slovenia, 2023; Available online: https://pxweb.stat.si/sistat/en/Home/GetSearchResultsRedirect?searchQuery=Agricultural%20input%20price%20indices%20(average%202015=100)%20by%20goods%20and%20services,%20year%20and%20measures&searchString=Agricultural%20input%20price%20indices%20(average%202015=100)%20by%20goods%20and%20services,%20year%20and%20measures (accessed on 20 February 2023).
- SORS. Average Retail Prices of Goods and Services by Goods and Services, Measures and Year; Statistical Office of the Republic of Slovenia: Ljubljana, Slovenia, 2023; Available online: https://pxweb.stat.si/sistat/en/Home/GetSearchResultsRedirect?searchQuery=Average%20retail%20prices%20of%20goods%20and%20services%20by%20goods%20and%20services,%20measures%20and%20year&searchString=Average%20retail%20prices%20of%20goods%20and%20services%20by%20goods%20and%20services,%20measures%20and%20year (accessed on 20 February 2023).
- AIS. Archive of Model Calculations. Agricultural Institute of Slovenia. Available online: https://www.kis.si/arhiv_nove_MK (accessed on 20 February 2023).
- SORS. Quantities and Average Prices of Purchased Agricultural Products by Agricultural Product, Year and Measures; Statistical Office of the Republic of Slovenia: Ljubljana, Slovenia, 2023; Available online: https://pxweb.stat.si/sistat/en/Home/GetSearchResultsRedirect?searchQuery=Quantities%20and%20average%20prices%20of%20purchased%20agricultural%20products%20by%20agricultural%20product,%20year%20and%20measures&searchString=Quantities%20and%20average%20prices%20of%20purchased%20agricultural%20products%20by%20agricultural%20product,%20year%20and%20measures (accessed on 20 February 2023).
- ARSAMRD. Preparation of Market Reports for Agricultural Products and Foodstuffs. Available online: https://www.gov.si/zbirke/storitve/priprava-trznih-porocil-za-kmetijske-pridelke-in-zivila/ (accessed on 20 February 2023).
- SORS. Average Monthly Earnings and Index of Average Monthly Earnings (Nace rev. 2) by Activity, Month, Earnings and Measures; Statistical Office of the Republic of Slovenia: Ljubljana, Slovenia, 2023; Available online: https://pxweb.stat.si/sistat/en/Home/GetSearchResultsRedirect?searchQuery=Average%20monthly%20earnings%20and%20index%20of%20average%20monthly%20earnings%20(nace%20rev.%202)%20by%20activity,%20month,%20earnings%20and%20measures&searchString=Average%20monthly%20earnings%20and%20index%20of%20average%20monthly%20earnings%20(nace%20rev.%202)%20by%20activity,%20month,%20earnings%20and%20measures (accessed on 20 February 2023).
- SORS. Persons by Activity, Year and Persons in Employment; Statistical Office of the Republic of Slovenia: Ljubljana, Slovenia, 2023; Available online: https://pxweb.stat.si/sistat/en/Home/GetSearchResultsRedirect?searchQuery=Persons%20by%20activity,%20year%20and%20persons%20in%20employment&searchString=Persons%20by%20activity,%20year%20and%20persons%20in%20employment (accessed on 20 February 2023).
- SORS. Consumer Price Indices (Ecoicop) by Consumer Products, Month and Measures; Statistical Office of the Republic of Slovenia: Ljubljana, Slovenia, 2023; Available online: https://pxweb.stat.si/sistat/en/Home/GetSearchResultsRedirect?searchQuery=Consumer%20price%20indices%20(ecoicop)%20by%20consumer%20products,%20month%20and%20measures&searchString=Consumer%20price%20indices%20(ecoicop)%20by%20consumer%20products,%20month%20and%20measures (accessed on 20 February 2023).
- Bedrač, M.; Kožar, M.; Moljk, B.; Pintar, M.; Volk, T.; Zagorc, B. Report on the State of Agriculture, Food, Forestry and Fisheries during the Year 2013; Agricultural Institute of Slovenia: Ljubljana, Slovenia, 2014; Available online: https://www.kis.si/f/docs/Porocila_o_stanju_v_kmetijstvu_OEK/ZP-2013-splosnopriloge.pdf (accessed on 20 February 2023).
- Bedrač, M.; Kožar, M.; Moljk, B.; Pintar, M.; Volk, T.; Zagorc, B. Report on the State of Agriculture, Food, Forestry and Fisheries during the Year 2012; Agricultural Institute of Slovenia: Ljubljana, Slovenia, 2013; Available online: https://view.officeapps.live.com/op/view.aspx?src=https%3A%2F%2Farhiv.kis.si%2Fdatoteke%2FFile%2Fkis%2FSLO%2FEKON%2FPorocilo2012%2FZP-2012-splosno-30.8.doc&wdOrigin=BROWSELINK (accessed on 20 February 2023).
- Bedrač, M.; Kožar, M.; Moljk, B.; Pintar, M.; Rednak, M.; Volk, T.; Zagorc, B. Report on the State of Agriculture, Food, Forestry and Fisheries during the Year 2014; Agricultural Institute of Slovenia: Ljubljana, Slovenia, 2015; Available online: https://www.kis.si/f/docs/Porocila_o_stanju_v_kmetijstvu_OEK/ZP-2014-splosnopriloge_koncno.pdf (accessed on 20 February 2023).
- Bedrač, M.; Kožar, M.; Moljk, B.; Pintar, M.; Rednak, M.; Volk, T.; Ttavnikar, T.; Zagorc, B. Report on the State of Agriculture, Food, Forestry and Fisheries during the Year 2015; Agricultural Institute of Slovenia: Ljubljana, Slovenia, 2016; Available online: https://www.kis.si/f/docs/Porocila_o_stanju_v_kmetijstvu_OEK/ZP-2015-splosnopriloge-NET.pdf (accessed on 20 February 2023).
- Bedrač, M.; Kožar, M.; Moljk, B.; Brečko, J.; Pintar, M.; Travnikar, T.; Zagorc, B. Report on the State of Agriculture, Food, Forestry and Fisheries during the Year 2016; Agricultural Institute of Slovenia: Ljubljana, Slovenia, 2017; Available online: https://www.kis.si/f/docs/Porocila_o_stanju_v_kmetijstvu_OEK/ZP_2016_splosno_priloge-pop.pdf (accessed on 20 February 2023).
- Bedrač, M.; Bele, S.; Kožar, M.; Moljk, B.; Brečko, J.; Pintar, M.; Zagorc, B. Report on the State of Agriculture, Food, Forestry and Fisheries during the Year 2017; Agricultural Institute of Slovenia: Ljubljana, Slovenia, 2018; Available online: https://www.kis.si/f/docs/Porocila_o_stanju_v_kmetijstvu_OEK/ZP_2017_splosno__priloge_za_net_2.pdf (accessed on 20 February 2023).
- Bedrač, M.; Bele, S.; Kožar, M.; Moljk, B.; Brečko, J.; Pintar, M.; Travnikar, T.; Zagorc, B. Report on the State of Agriculture, Food, Forestry and Fisheries during the Year 2018; Agricultural Institute of Slovenia: Ljubljana, Slovenia, 2019; Available online: https://www.kis.si/f/docs/Porocila_o_stanju_v_kmetijstvu_OEK/ZP_2018_splosno__priloge_koncna_02.12.pdf (accessed on 20 February 2023).
- Bedrač, M.; Bele, S.; Brečko, J.; Hiti, A.; Kožar, M.; Moljk, B.; Travnikar, T.; Zagorc, B. Report on the State of Agriculture, Food, Forestry and Fisheries during the Year 2019; Agricultural Institute of Slovenia: Ljubljana, Slovenia, 2020; Available online: https://www.kis.si/f/docs/Porocila_o_stanju_v_kmetijstvu_OEK/ZP_2019_splosno__priloge_net.pdf (accessed on 20 February 2023).
- Bedrač, M.; Bele, S.; Brečko, J.; Hiti Dvoršak, A.; Kožar, M.; Ložar, L.; Moljk, B.; Travnikar, T.; Zagorc, B. Report on the State of Agriculture, Food, Forestry and Fisheries during the Year 2020; Agricultural Institute of Slovenia: Ljubljana, Slovenia, 2021; Available online: https://www.kis.si/f/docs/Porocila_o_stanju_v_kmetijstvu/ZP__splosno__priloge_2020.pdf (accessed on 20 February 2023).
- Bedrač, M.; Bele, S.; Brečko, J.; Hiti Dvoršak, A.; Kožar, M.; Ložar, L.; Moljk, B.; Travnikar, T.; Zagorc, B. Report on the State of Agriculture, Food, Forestry and Fisheries during the Year 2021; Agricultural Institute of Slovenia: Ljubljana, Slovenia, 2022; Available online: https://www.kis.si/f/docs/Porocila_o_stanju_v_kmetijstvu/ZP_2021_splosno__priloge_6.9.2022.pdf (accessed on 20 February 2023).
- SORS. Exports and Imports by Imports/Exports, Country, Combined Nomenclature, Year and Unit; Statistical Office of the Republic of Slovenia: Ljubljana, Slovenia. Available online: https://pxweb.stat.si/sistat/en/Home/GetSearchResultsRedirect?searchQuery=Exports%20and%20imports%20by%20imports/exports,%20country,%20combined%20nomenclature,%20year%20and%20unit&searchString=Exports%20and%20imports%20by%20imports/exports,%20country,%20combined%20nomenclature,%20year%20and%20unit (accessed on 20 February 2023).
- SORS. Number of Livestock by Species and Year; Statistical Office of the Republic of Slovenia: Ljubljana, Slovenia. Available online: https://pxweb.stat.si/sistat/en/Home/GetSearchResultsRedirect?searchQuery=Number%20of%20livestock%20by%20species%20and%20year&searchString=Number%20of%20livestock%20by%20species%20and%20year (accessed on 20 February 2023).
- Register of Breeds with Zootechnical Assessment-Collections. OPSI-Odprti podatki Slovenije. Available online: https://podatki.gov.si/dataset/register-pasem-z-zootehnisko-oceno (accessed on 20 February 2023).
- Renting, H.; Marsden, T.K.; Banks, J. Understanding alternative food networks: Exploring the role of short food supply chains in rural development. Environ. Plan. A Econ. Space 2003, 35, 393–411. [Google Scholar] [CrossRef]
- Chiffoleau, Y.; Millet-Amrani, S.; Rossi, A.; Rivera-Ferre, M.G. The participatory construction of new economic models in short food supply chains. J. Rural. Stud. 2019, 68, 182–190. [Google Scholar] [CrossRef]
- Augère-Granier, M.L. Short Food Supply Chains and Local Food Systems in the EU. Policy Commons. 2016. Available online: https://policycommons.net/artifacts/1340881/short-food-supply-chains-and-local-food-systems-in-the-eu/1951844/ (accessed on 15 February 2024).
- Paraušić, V.; Roljević Nikolić, S. Concept and State of Producer Organizations Development in European Organic Farming. In Entrepreneurial Innovation in Agri-Food Science; Alexandru Ioan Cuza University: Iași, Romania, 2022; pp. 48–68. [Google Scholar]
- Thomé, K.M.; Cappellesso, G.; Alves Ramos, E.L.; de Lima Duarte, S.C. Food supply chains and short food supply chains: Coexistence conceptual framework. J. Clean. Prod. 2021, 278, 123207. [Google Scholar] [CrossRef]
- Cronin, E.; Selten, M.; van Galen, M.A.; Bijman, J.; Viaggi, D.; Arevalo, I.; Smit, A.B.; Ruijs, M.N.A.; van der Meulen, B.M.J.; Vollaro, M. Study on Producer Organisations and Their Activities in the Olive Oil, Beef and Veal and Arable Crops Sectors. European Union. 2018. Available online: https://library.wur.nl/WebQuery/wurpubs/539380 (accessed on 15 February 2024).
- Bijman, J.; Hanisch, M. Support for Farmers’ Cooperatives: Developing a Typology of Cooperatives and Producer Organisations in the EU. European Commission. 2012. Available online: https://library.wur.nl/WebQuery/wurpubs/fulltext/244820 (accessed on 15 February 2024).
- Rucabado-Palomar, T.; Cuéllar-Padilla, M. Short food supply chains for local food: A difficult path. Renew. Agric. Food Syst. 2020, 35, 182–191. [Google Scholar] [CrossRef]
- MacDonald, J.M.; Perry, J.; Ahearn, M.C.; Banker, D.; Chambers, W.; Dimitri, C.; Key, N.; Nelson, K.E.; Southard, L.W. Contracts, markets, and prices: Organizing the production and use of agricultural commodities. In USDA-ERS Agricultural Economic Report 837; USDA: Washington, DC, USA, 2004. [Google Scholar] [CrossRef]
- Sexton, R.J. Market power, misconceptions, and modern agricultural markets. Am. J. Agric. Econ. 2013, 95, 209–219. [Google Scholar] [CrossRef]
- Federgruen, A.; Lall, U.; Serdar Şimşek, A. Supply chain analysis of contract farming. Manuf. Serv. Oper. Manag. 2019, 21, 361–378. [Google Scholar] [CrossRef]
- Jarzębowski, S.; Bourlakis, M.; Bezat-Jarzębowska, A. Short food supply chains (SFSC) as local and sustainable systems. Sustainability 2020, 12, 4715. [Google Scholar] [CrossRef]
- Bazzani, C.; Canavari, M. Alternative agri-food networks and short food supply chains: A review of the literature. Econ. Agro-Aliment. 2013, XV, 11–34. Available online: https://www.torrossa.com/en/resources/an/2644265 (accessed on 15 February 2024).
- Kneafsey, M.; Venn, L.; Schmutz, U.; Balázs, B.; Trenchard, L.; Eyden-Wood, T.; Bos, E.; Sutton, G.; Blackett, M. Short food supply chains and local food systems in the EU. A state of play of their socio-economic characteristics. JRC Sci. Policy Rep. 2013, 123, 129. Available online: https://www.academia.edu/download/31538404/2013_Kneafsey-etal.pdf (accessed on 15 February 2024).


Disclaimer/Publisher’s Note: The statements, opinions and data contained in all publications are solely those of the individual author(s) and contributor(s) and not of MDPI and/or the editor(s). MDPI and/or the editor(s) disclaim responsibility for any injury to people or property resulting from any ideas, methods, instructions or products referred to in the content. |
© 2024 by the authors. Licensee MDPI, Basel, Switzerland. This article is an open access article distributed under the terms and conditions of the Creative Commons Attribution (CC BY) license (https://creativecommons.org/licenses/by/4.0/).
Share and Cite
Prišenk, J.; Turk, J.; Pažek, K.; Rozman, Č.; Borec, A.; Zidar, N. An Assessment of Food Value Chains to Identify Gaps and Make Recommendations for Further Development: A Slovenian Case Study. Agriculture 2024, 14, 502. https://doi.org/10.3390/agriculture14030502
Prišenk J, Turk J, Pažek K, Rozman Č, Borec A, Zidar N. An Assessment of Food Value Chains to Identify Gaps and Make Recommendations for Further Development: A Slovenian Case Study. Agriculture. 2024; 14(3):502. https://doi.org/10.3390/agriculture14030502
Chicago/Turabian StylePrišenk, Jernej, Jernej Turk, Karmen Pažek, Črtomir Rozman, Andreja Borec, and Nejc Zidar. 2024. "An Assessment of Food Value Chains to Identify Gaps and Make Recommendations for Further Development: A Slovenian Case Study" Agriculture 14, no. 3: 502. https://doi.org/10.3390/agriculture14030502
APA StylePrišenk, J., Turk, J., Pažek, K., Rozman, Č., Borec, A., & Zidar, N. (2024). An Assessment of Food Value Chains to Identify Gaps and Make Recommendations for Further Development: A Slovenian Case Study. Agriculture, 14(3), 502. https://doi.org/10.3390/agriculture14030502