Article

Digital Village Construction: A Multi-Level Governance Approach to Enhance Agroecological Efficiency

1
School of Economics and Management, Chongqing Normal University, Chongqing 401331, China
2
National Center for Applied Mathematics in Chongqing, Chongqing 401331, China
3
School of Computer and Information Sciences, Chongqing Normal University, Chongqing 401331, China
4
School of Public Policy and Administration, Chongqing University, Chongqing 400044, China
*
Author to whom correspondence should be addressed.
Agriculture 2024, 14(3), 478; https://doi.org/10.3390/agriculture14030478
Submission received: 21 February 2024 / Revised: 10 March 2024 / Accepted: 13 March 2024 / Published: 15 March 2024
(This article belongs to the Section Agricultural Economics, Policies and Rural Management)

Abstract

:
This study conducts a comprehensive analysis of China’s digital village construction, emphasizing its role in rural organizational governance, from bureaucracies to self-governance bodies to market forces and social organizations. Utilizing sample data from 30 provinces from 2014 to 2020, the study dissects the dynamics and diversity of multi-level governance in bolstering agroecological efficiency (AEE). Notable insights include a significant positive correlation between digital villages and AEE. However, it wanes in an “inverted U” pattern beyond a digital development index of 0.8. Furthermore, rural bureaucrats and self-governing entities independently advance AEE, while market forces and social organizations require enhancement. These findings contribute to the field of digital village construction and inform sustainable agricultural strategies in developing nations.

1. Introduction

Agriculture remains vital for human sustenance, and it is essential to prioritize sustainable practices, digital technologies, climate resilience, food security, ecosystem conservation, and farmer incomes. The infusion of digital technology in agriculture demonstrates immense potential, as witnessed in IoT’s role in produce management [1] and AI’s contribution to smart farming [2,3]. These developments are part of a larger trend toward the digitalization of agriculture, aiming to boost productivity and address resource supply–demand imbalances, thus advancing sustainable development [4]. Consequently, initiatives like Niger’s “Smart Africa Action Plan”, the European Union’s “Smart Villages”, and China’s digital village endeavor have emerged. For example, the European Union’s “Smart Villages” provides knowledge, technology, policies, and services to support the development of “smart villages”, which cover residents’ lives, public services, sustainable development, and rural industry revitalization. These provide a new development path for solving the problem of agricultural sustainable development.
Yet, these ambitious projects grapple with implementation challenges, notably in developing nations. They suffer from inadequate digital infrastructure and farmers’ inability to adopt new technologies. Moreover, the physical infrastructure of the digital village itself may introduce environmental pollutants [5]. China’s deployment of village cadres and technicians illustrates the need for collaborative government–farmer action in digital village realization, a task necessitating comprehensive research.
As a developing country, China encounters challenges such as the imbalance between the supply and demand of agricultural resources and environmental issues stemming from production practices. These circumstances underscore the urgent need for China to embark on a digital transformation in agriculture. To answer such challenges, this study first constructs a multi-level governance system that is “rural bureaucrats–villagers’ self-governance-market forces-social organizations”, which consists of four subjects to participate in digital rural governance. Among them, rural bureaucrats represent state power, villagers’ self-governance represents rural construction forces, and market forces and social organizations represent social forces. Next, this study analyzes the impact of multi-level rural governance on digital village construction, considering agroecological efficiency (AEE) as a gauge. AEE is defined as the efficiency of obtaining the highest economic and social benefits at the lowest possible resource and environmental cost in the agricultural production process. Current studies on agroecological efficiency in digital village construction mostly focus on the investigation of average effect and path analysis of rural infrastructure conditions, and few start from the dynamic perspective and multi-agent structure. Therefore, the study’s innovations are fourfold: (1) detailed examination of China’s provincial data to elucidate the digital village and AEE relationship, (2) investigation of AEE’s dynamic dependence on digital village growth via GPSM, (3) development of an integrated “government–farmer–market and social organization” governance framework for the digital village and AEE progress, and (4) differentiated analysis of AEE impacts across crops, grain provinces, and geographies.

2. Literature Review

Digitalization is affecting every aspect of rural society at an unprecedented rate. As this trend continues to develop, the study of digital village construction is becoming increasingly important, which can not only open the door for farmers to connect the modern economy and society but also become a key force in promoting agroecological efficiency (AEE) and sustainability. The study will discuss in detail the current academic research in this field, covering the assessment of digital village construction, governance studies, examination of the impact on rural society, and research advances related to agroecological efficiency, with the aim of providing insight into the future direction of the field.

2.1. Digital Village Construction Studies

As rural societies increasingly adopt digital technologies, the discourse on digital village construction has flourished, primarily focusing on:
(1) Evaluation research. To determine the degree of the construction of a digital village, the majority of the existing literature sets up evaluation index systems using the dimensions of industrial development, hardware construction, and service governance and assigns weights using the entropy weight technique or an analytical hierarchy process [6,7,8].
(2) Research on digital village governance. Scholarly discourse on digital village governance encompasses several key areas. Firstly, governance subjects involved in the construction of digital villages are manifold, as expounded by existing studies highlighting the role of government institutions, local villagers, and market dynamics [9,10]. Secondly, the developmental frameworks of digital villages have been proposed, including the “hierarchical cultivation” model by Zhang et al. (2023) [11] and the “comprehensive intelligent governance” approach by Hu and Wu (2023) [12]. Thirdly, the resource base critical for digital village construction extends beyond digital technology. The efficacy of governance within digital villages hinges on the synergy between the rural governance structure and the underlying institutional systems that support its progression [13].
(3) Research on impact. The extant body of research has also scrutinized the effects of digital village development, examining macro impacts on socioeconomic constructs like common prosperity [14], social quality enhancement [15], and rural revitalization [16]. Furthermore, micro impacts such as the facilitation of entrepreneurial activities among farmers and the advancement of their digital proficiencies are noted [17]. Certain scholars highlight the potential adverse outcomes, such as the exacerbation of the digital divide and the widening of the intergenerational gap in rural cultural consumption [18].
In aggregate, digital village development is still nascent, with the current literature largely focusing on theoretical interpretation, characteristic identification, and exploratory practices of its construction. There is an overt concentration on singular governance entities, with less comprehensive integration of multi-level governance factors in research frameworks. Moreover, sustainable development considerations in digital village studies remain sparse. A limited number of researchers have addressed the implications of digital villages on agricultural carbon emissions, yet expansive analyses of their impact on sustainable agricultural development from an overall AEE perspective are scarce [19].

2.2. Research on AEE

AEE is an indicator of an agricultural system’s adeptness at maintaining yield while minimizing resource wastage, pollution, and ecological degradation. It strives for an equilibrium between economic returns and environmental stewardship by optimizing the nexus between agricultural productivity and resource utilization [20]. The predominant focus of the AEE literature encompasses three aspects:
(1) Measurement methodology. The primary literature utilizes various methods for AEE assessment, such as stochastic frontier analysis, AHP-fuzzy comprehensive evaluation, ecological footprint, and data envelopment analysis (DEA), with the latter being the method of choice due to its non-reliance on predefined functional relationships, thereby reducing subjectivity. Decision-making units with efficiency levels equal to or above unity have seldom been the subject of analysis [21,22]. Recent methodological advancements such as the network DEA model and the network SBM-DEA model, introduced by Tavana et al. (2013) and Zhang and Yang (2017) [23,24], respectively, have pushed the envelope in assessing both overall and internal stage efficiency of decision-making units (DMUs).
(2) Evolution trend analysis. To comprehend spatial effects, dynamic patterns, and convergence characteristics of AEE within specific domains, scholars have employed spatial econometric methods [11,25].
(3) Influencing factors. Research has concentrated on variables such as climate change adaptation within agroecosystems [26,27], trade-offs, and symbiotic relationships among agroecosystem services [28,29,30], and labor configurations [31]. Yet, there is a paucity of studies examining the impact of digital village construction on AEE within the broader context of rural revitalization and the burgeoning digital economy.
In sum, while the existent literature exhibits significant engagement with AEE and digital village construction research, pertinent observations include the following: (1) the AEE-related literature predominantly concentrates on current state measurements and analysis, hence necessitating a deeper exploration of the long-term dynamic effects and mechanisms through which digital technology applications influence AEE. (2) Given digital technology’s inherent characteristics, the operational features of rural organizations, and resource and skill limitations in rural areas, the infusion of digital technology in agriculture can induce complications, including digital overload, authoritative issues, and governance lacunae [32]. Consequently, the role of digital technology in sustainable agricultural development may entail both constructive and detrimental dimensions. As such, adopting a “people-centered” approach to dissecting the effects of digital village construction on AEE from a multi-level rural governance perspective is essential, carrying notable practical and theoretical value. (3) Given the diversity in crop types, grain-producing provinces, and geographical areas, the heterogeneous impacts of digital village construction on AEE warrant more extensive investigation.

3. Theoretical Analysis and Research Hypothesis

3.1. Direct Impact of the Construction of Digital Village on AEE

The theoretical rationale for the influence of digital village construction on AEE may be elucidated through four distinct dimensions. Firstly, concerning resource allocation impact, the inception of the digital village amalgamates with the agricultural sector by employing cutting-edge technologies such as Information Technology, the Internet of Things, and expansive data analytics, thereby fostering innovative practices like digital and smart agriculture. This integration betters the distribution of agricultural production factors, heightens the intellectuality and productivity of agricultural decision-making, diminishes agricultural production expenditures, and augments agricultural yield [33]. Secondly, technological progression’s impact is noteworthy; digital tools serve not only to refine production but also to enhance agricultural yield. Equally important, by facilitating refined management of information-based agricultural data resources and monitoring of the agroecological environment, digital technology notably amplifies the ability to fine-tune agricultural production, elevating resource utilization efficiency, curtailing mishandling of chemicals, and lessens energy consumption in agriculture, thus enriching AEE [19]. Thirdly, the impact on the extension of the industrial chain is crucial. Digital village construction propels the intermingling of distinct industry chains and leaps in value chains by integrating sectors like digital inclusive finance, deep processing of agricultural products, rural e-commerce, tourism, and healthcare through digital means. This integration mitigates rural dependence on high-carbon energy, scales down energy consumption per output unit, and incites the adoption of renewable energy, thereby boosting AEE [34]. Fourthly, the effect induced by market demand is observable. Utilization of digital technologies, including network platform interfacing and product traceability, not only fulfills the demand for eco-friendly and low-carbon agricultural goods but also influences agricultural production and operational entities to opt for environmentally benign production methodologies, elevating AEE levels [35]. Hence, this study posits the following hypothesis:
H1: 
The construction of a digital village contributes positively to the enhancement of AEE.

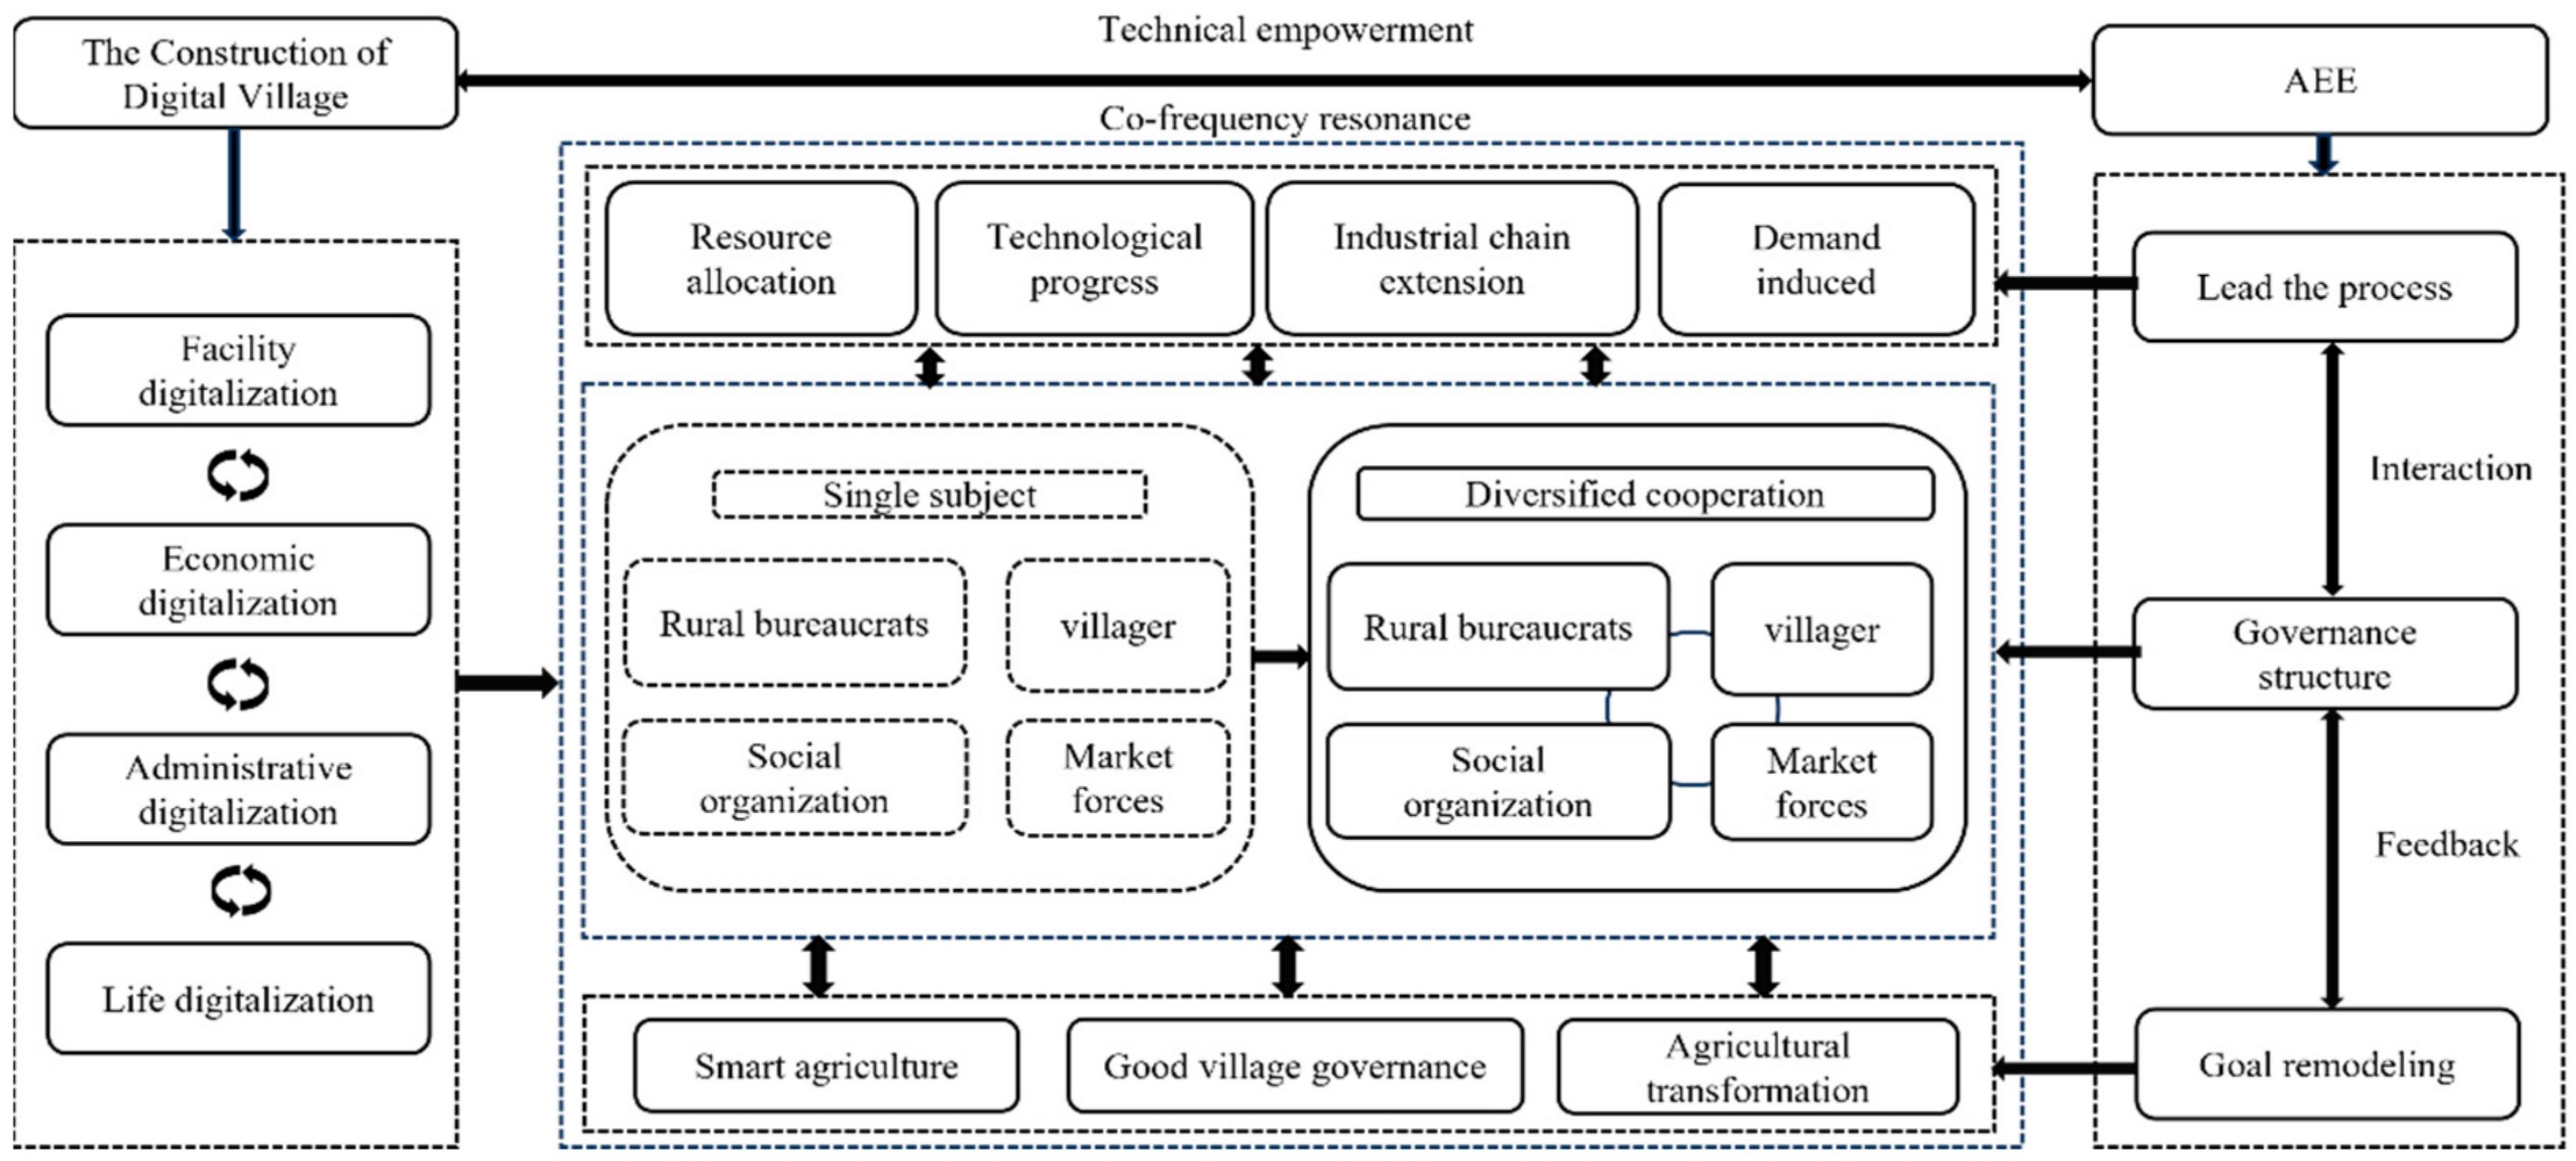
3.2. The Construction of Digital Village, Rural Multi-Governance, and AEE

While digitalization heralds an irreversible trend, its comprehensive and profound merger with rural productivity and lifestyle is not without challenges, which include technological disruptions and superficial digitization (“formalism at the fingertips”) [36]. Thus, harnessing the subjective initiative of people in this amalgamation is prime. “People” encompass not only the rural bureaucrats who primarily manage but also the farmers, technology firms, and social organizations engaged in the process, asserting that rural grassroots administrative bodies should lead, buttressing the farmers’ dominant role to endorse digital empowerment and activate intrinsic dynamism, which in turn catalyzes the high-grade development of agriculture through external collaborative factors like markets and commercial entities [37], thereby empowering sustainable agricultural development via digital village construction. The involvement of multilevel governance agents involves the following:
(1) Rural bureaucrats: foremost, the advent of digital villages elevates rural bureaucrats’ managerial efficacy. Digitally enhanced technology broadens the administrative reach both temporally and spatially. Moreover, digital governance of local affairs also rectifies traditional limitations of time and space in villager engagement, low enthusiasm, and response inadequacies, thereby reducing rural bureaucratic management costs while enhancing overall efficiency. Secondly, digital village development equips rural bureaucrats with tools to support farmers in scientific production choices, bolster the monitoring of agricultural ecological hazards, and facilitate agricultural resource optimization through visual management and precision services. Furthermore, considering China’s recent efforts, the national enterprise has penetrated rural areas, enabling urban administrators to be stationed in villages and introducing technological expertise, thus addressing the digital skill scarcity in rural communities.
(2) Villagers: the administrative support to bolster sustainable agricultural development faces the critical “last mile” of execution. Notably, villagers are the paramount endogenous force—both as implementers and beneficiaries of digital villages and sustainable agricultural progress. However, digital village progress simplifies their participation in sustainable agricultural development, potentially aiding intrinsic motivation. Digital tools empower joint villager engagement and sustainable agricultural actions by superseding the constraints of physical geography on the rural populace. Prompt digital platforms enable swift feedback and risk management for concentrated agricultural risks and ecological threats, minimizing adverse AEE impacts. Digital technology access also expands villagers’ information repertoire, facilitating awareness of environmental policies, acquisition of green agricultural techniques, and enhancement of agricultural supply chain connectivity while bolstering their collective decision-making abilities and AEE advancement.
(3) Market forces and social organizations: as of late 2022, China’s agricultural cooperatives tallied 2,243,600 units, encompassing nearly half the farming populace. Given their members’ environmental considerations and the long-term developmental importance of rural ecology, these cooperatives are engaging in agricultural activities and rural ecological stewardship, driving sustainable organizational growth via ecological management. Local agricultural cooperatives tailor governance methodologies to regional idiosyncrasies, with a focus on environmentally mindful agricultural practices, thus aiding AEE elevation [38]. Additionally, assorted new agricultural entities notably contribute to pivotal realms such as rural economic progress, environmental guidance, and talent cultivation [39]. Based on the delineation above, the study advances hypotheses H2, H2a–H2c as follows:
H2: 
Enhancement of rural multi-governance mechanisms significantly bolsters the beneficial effects of digital village initiatives on AEE.
H2a: 
The participation of rural bureaucrats plays a pivotal role in augmenting AEE through digital village projects.
H2b: 
The engagement of local villagers is fundamental to the improvement of AEE facilitated by digital village development.
H2c: 
An increased engagement of market dynamics and social institutions correlates with a pronounced positive influence on AEE attributable to digital village construction.
Based on hypotheses H1, H2, and the sub-hypotheses H2a to H2c, our research delineates a comprehensive framework (as shown in Figure 1) that explores the influence of digital rural development on agricultural eco-efficiency. This framework is structured around two primary components. First, the direct impact of digital village construction on agroecological efficiency is manifested in four effects: resource allocation, technological progress, industrial chain extension, and demand induced. Second, the study believes that the moderating variable of rural multi-level governance plays a strengthening role in the positive impact of digital village construction on agroecological efficiency and finally realizes smart agriculture, good rural governance, and agricultural transformation.

4. Research Design

4.1. Samples and Data

In this study, official platforms such as CSMAR data, EPS data platform, National Bureau of Statistics, and the websites of governments or departments of Agriculture and Rural Affairs (committees and bureaus) of provinces are used as data sources. Due to the fact that some data started to be updated in 2014 or stayed in 2020, it was difficult to collect data in Tibet, Hong Kong, Macao, and Taiwan due to geographical and other factors. In order to unify the research caliber and reduce errors, 30 provinces in China (excluding Tibet, Hong Kong, Macao, and Taiwan) from 2014 to 2020 were selected as sample data.

4.2. Variable Definition and Measurement

4.2.1. Explanatory Variable: The Construction of Digital Village

The research shows that the construction of a digital countryside should focus on hardware input, economic development, production, and life [6,7,8]. Therefore, the index system of digital village construction is defined in this study based on data availability, encompassing four dimensions: facilities, economy, administration, and life. The specific index system is presented in Table 1.
According to the index system in Table 1, taking the data of 30 provinces in China from 2014 to 2020 as an example, the level of the construction of a digital village is measured by the entropy weight method. According to the measured results, the overall level of China’s construction of digital villages showed an increasing trend year by year, but there was a large heterogeneity among provinces. The provinces (cities) with the best development level of the construction of digital villages are Shanghai, Zhejiang, Guangdong, Beijing, and Jiangsu in the eastern region, while the provinces (cities) with the relatively backward development are mainly located in the western region, namely Inner Mongolia, Gansu, Hainan, Ningxia, and Qinghai, respectively, showing the regional characteristics of high east and low west. The eastern regions such as Beijing, Shanghai, Zhejiang, and Guangdong are not only the most economically developed provinces in China but also at the forefront of technological innovation, with a relatively good level of technological infrastructure and information infrastructure, which obviously provides convenience for the construction of digital villages [40]. The regions with low levels of digital village construction are Inner Mongolia, Gansu, Hainan, Ningxia, and Qinghai. In addition to poor natural conditions, these provinces are also relatively weak in terms of economic level and technical foundation. This reflects the high correlation between the construction of digital villages and the characteristics of economic development, regional advantages, and resource endowments and also reflects the severity of the digital divide in China’s provinces to a certain extent.

4.2.2. Explained Variable: Agroecological Efficiency

According to Ren et al. (2023) [41], considering that agricultural input and production conditions are not static, the study chooses the SBM-DEA model under variable returns to scale as the measurement model of AEE level. Due to the spatial agglomeration of agroecological efficiency [34], the research presented the measurement results from four aspects: national, eastern, central, and western (as shown in Table 2). The overall level of agroecological efficiency shows an upward trend, especially in the eastern region, which has seen a significant improvement in 2020. China attaches great importance to the transformation and development of green agriculture. In 2019, a series of policies were issued intensively. The innovation system and mechanism in the eastern region are relatively complete, the overall awareness of agricultural and environmental protection is high, and the understanding and application of policies are high, which is the first to be reflected in the substantial improvement of AEE [42].
In addition, most of the studies on AEE in the existing literature take the whole industry as the research object, and there are few in-depth discussions on AEE by crop classification. Therefore, in order to understand the eco-efficiency of different crop types, we refer to the existing literature [43] and classify crops into food crops and cash crops according to their use and botanical classification. Food crops include cereals (rice, wheat, and corn), beans, and potatoes. Cash crops include fiber (cotton and hemp), oil, sugar, and others (tobacco, vegetables, etc.). At the same time, considering that resource input, economic output, and ecological output required by food crops and cash crops cannot be effectively separated in agricultural production activities, the index was innovatively optimized based on the original AEE index system by referring to the existing literature [44], and crop proportion coefficient was introduced. It is β i = S o w n   a r e a   o f   c l a s s i f i e d   c r o p s / t o t a l   s o w n   a r e a   o f   c r o p s   ( i = f o o d   c r o p s ,   c a s h   c r o p s ) . We subdivide the sown area index of crops again, replace the agricultural output value in the expected output with the output of food crops and cash crops, and multiply the remaining 10 indicators by the corresponding crop proportion coefficient, respectively. Finally, the ecological efficiency level of food and cash crops is measured. The calculated results are shown in Table 2.
Table 2 shows that the overall ecological efficiency of food crops in China has been stable, showing a slight decline to begin with and a gradual increase subsequently, reaching the lowest level in 2017 and then improving. The eastern and central regions are also consistent with the ups and downs of the country, and the gap between the ecological efficiency of food crops in the eastern region and the central and western regions has further increased since 2018. From the perspective of the eco-efficiency level of cash crops, whether it is the whole country or the three major sectors, the eco-efficiency level of cash crops fluctuates greatly, which may be because compared with food crops, the eco-efficiency of cash crops is more affected by market demand and policies.

4.2.3. Moderating Variables: Multi-Level Governance

Rural bureaucrats, villagers’ self-governance, market forces, and social organizations were used to characterize the rural multi-level governance system. The Python crawler technology was used to obtain the news keyword word frequency of the above four multiple subjects from the websites of the governments or departments of Agriculture and Rural Affairs (committees and bureaus) of 30 provinces in China from 1 January 2014 to 31 December 2020 (Table 3), and then the crawled data were cleaned, the frequency of statistical data was counted, and the final research data were obtained. The reasons for taking the government website as the core path to obtain rural multiple governance data are as follows: on the one hand, the government website is the official information release platform, which is authoritative and reliable and can fully cover the above four dimensions and relatively comprehensive information; on the other hand, as the main body leading rural governance, the areas of concern and priorities of the government also reflect the balance and focus of rural governance. In the specific crawling process, in order to avoid interference from other fields of news, three conditions are set for the agricultural field (Table 3), and only news that meets the three conditions at the same time can be taken down as effective information. Among them, due to the small sample size of market and social organization, the data of market power and social organization are combined as proxy variables of “other governance organizations” for subsequent analysis. The rural multi-governance data are represented by the sum of the three main data of the grassroots administrative organization, the villagers’ self-government, and other governance organizations. For the same magnitude, the sample data of the four factors are reduced by 100 times.

4.2.4. Control Variables

In order to minimize the bias caused by missing variables, the following control variables were selected in this study with reference to the practices of Xue and Wen (2019) and Bai et al. (2022) [45,46]: (1) agricultural economic development level (AED), expressed as the proportion of total agricultural output value and permanent population of each province, in units (ten thousand yuan/person); (2) agricultural disaster rate (ADR), expressed as the ratio of the affected area of crops to the total sown area of crops, unit (/); (3) human capital level (RHC), expressed as the number of employment in the primary industry in the total number of employment in the industry, unit (/); (4) the amount of fertilizer used (FU), expressed in the amount of fertilizer used and the sown area of crops, unit (/); and (5) entrepreneurial activity (EA), the micro-data of new enterprises during the sample period collected through the enterprise check database, and matched to the provincial level according to the province, establishment time and other information, expressed as the number of new enterprises and the ratio of urban population per 100 people, unit.

4.2.5. Data Description

The descriptive statistics of variables are shown in Table 4. The missing data of the study are replaced by the interpolation method, but multi-level governance is limited by the website itself; some data are covered, and the study chooses to use “0” instead.

4.3. Model Selections

4.3.1. Baseline Regression

This study adopts the fixed effect model as the benchmark model to explore the impact of the construction of a digital village on AEE:
A E E i t = α 0 + α 1 D V C i t + α 2 C o n t r o l i t + μ i t + u i t + ε i t
In Formula (1), A E E i t represents the agroecological efficiency level in t period of province i; D V C i t represents the level of the construction of digital village in t period of province i; Control represents all the control variables mentioned above; ε i t represents the random error term. In addition, taking into account the development differences among provinces and unobserved factors, common changes and influences in time, the study introduces regional fixed effects ( μ i t ) and time fixed effects ( u i t ).

4.3.2. Dynamic Effect Evaluation

The above benchmark regression model is the average effect of the construction of a digital village on agroecological efficiency, which cannot accurately describe the dynamic impact of the construction of a digital village on agroecological efficiency under different intensities. At the same time, the traditional propensity score matching is only suitable for “0–1” discrete variables and cannot be used to test continuous variables, while the generalized propensity score matching can make up for this shortcoming, which can not only mine more information but also deal with selective bias. Therefore, this article chooses generalized propensity score matching under the different intensities of the digital dynamic heterogeneous effect on the efficiency of the agricultural ecological village construction [47].
Firstly, the generalized propensity score GPS and conditional probability density are obtained according to covariate Z. Secondly, the conditional expectation of the result variable Y is represented by the processing variable X and the generalized propensity score GPS, and the quadratic term, cubic term, and interaction term are selected according to the result. Then, according to the result of the second step, the average expected value of the result variable Y is estimated when X = x. Finally, the function points in different value ranges are connected to obtain the dose relationship diagram of the whole study interval for the result variable Y.
E x = 1 N i = 1 n α 0 + α 1 x + α 2 x + + α i x
Therefore, this study selected the level of agricultural economic development, agricultural disaster rate, human capital level, fertilizer use, and entrepreneurial activity as matching variables while controlling the time and regional level to analyze the dynamic impact of the construction of digital villages on AEE.

4.3.3. Adjustment Effect

According to the above theoretical analysis, rural multi-governance plays a regulating role in the impact of the construction of digital villages on the level of AEE. Therefore, in order to verify hypothesis H2, H2a–H2c, this study introduces the regulating variables of rural multi-governance (divided into three dimensions, namely rural bureaucrats, villagers’ autonomous organizations, and other governance organizations) on the basis of Formula (1) and adds the interactive terms of the construction of the digital village and the four regulating variables, respectively.
A E E i t = α 0 + α 1 D V C i t + α 2 R P G i t + α 3 D V C i t × R P G i t + α 4 C o n t r o l i t + μ i t + u i t + ε i t
A E E i t = α 0 + α 1 D V C i t + α 2 P G O i t + α 3 D V C i t × P G O i t + α 4 C o n t r o l i t + μ i t + u i t + ε i t
A E E i t = α 0 + α 1 D V C i t + α 2 V i l l i t + α 3 D V C i t × V i l l i t + α 4 C o n t r o l i t + μ i t + u i t + ε i t
A E E i t = α 0 + α 1 D V C i t + α 2 M S i t + α 3 D V C i t × M S i t + α 4 C o n t r o l i t + μ i t + u i t + ε i t
In Formulas (3)–(6), R P G i t stands for rural multi-governance, P G O i t stands for rural bureaucrats, V i l l i t stands for villagers’ governance, and M S i t stands for other governance (market forces and social organizations).

5. Results and Analysis

5.1. Baseline Regression Analysis

AEE’s baseline regression results on the digital village level are shown in Table 5. Column (1) indicates that when the core explanatory variable is the construction of a digital village, the influence coefficient is significantly positive at the 1% level, indicating that the construction of a digital village has a positive promoting effect on the improvement of AEE. Column (2) introduces control variables, control time, and regional effects on the basis of column (1), and the results show that the influence coefficient of the construction of a digital village is still significantly positive at the 1% level and the fit degree is further improved, indicating that the construction of digital village can indeed improve the level of AEE. It will promote the agroecological efficiency level to increase by 7.5329 units. This provides direct empirical evidence for developing countries to achieve sustainable agricultural development through the construction of digital villages, and H1 is verified.
Table 5 lists (3) to (6) from the four dimensions of the construction of the digital village, namely, facility digitalization, economy digitalization, administrative digitalization, and life digitalization, on the impact of AEE to clarify the main dimension of the construction of digital village on AEE and the heterogeneity of the impact degree. In terms of results, first of all, economic and administrative digitalization can have a positive impact on AEE, and both are significantly positive at the 5% level. They provide various opportunities for the improvement of AEE to achieve the goal of sustainable development and ecological protection. Secondly, the impact coefficient of facility digitalization is positive but not significant, which indicates that the positive impact of facility digitalization on AEE is not statistically significant, possibly because agricultural production processes are complex. While facility digitalization can provide decision support and improve technology, it cannot completely eliminate the impact of external factors such as soil quality and topography, markets, and economics on agricultural production. Finally, the impact coefficient of life digitalization is negative but not significant, which may be due to the existence of a “digital divide”; villagers’ acceptance or adaptability to digital technology is not high, resulting in insignificant or even reverse impact of life digitalization on AEE [48,49].

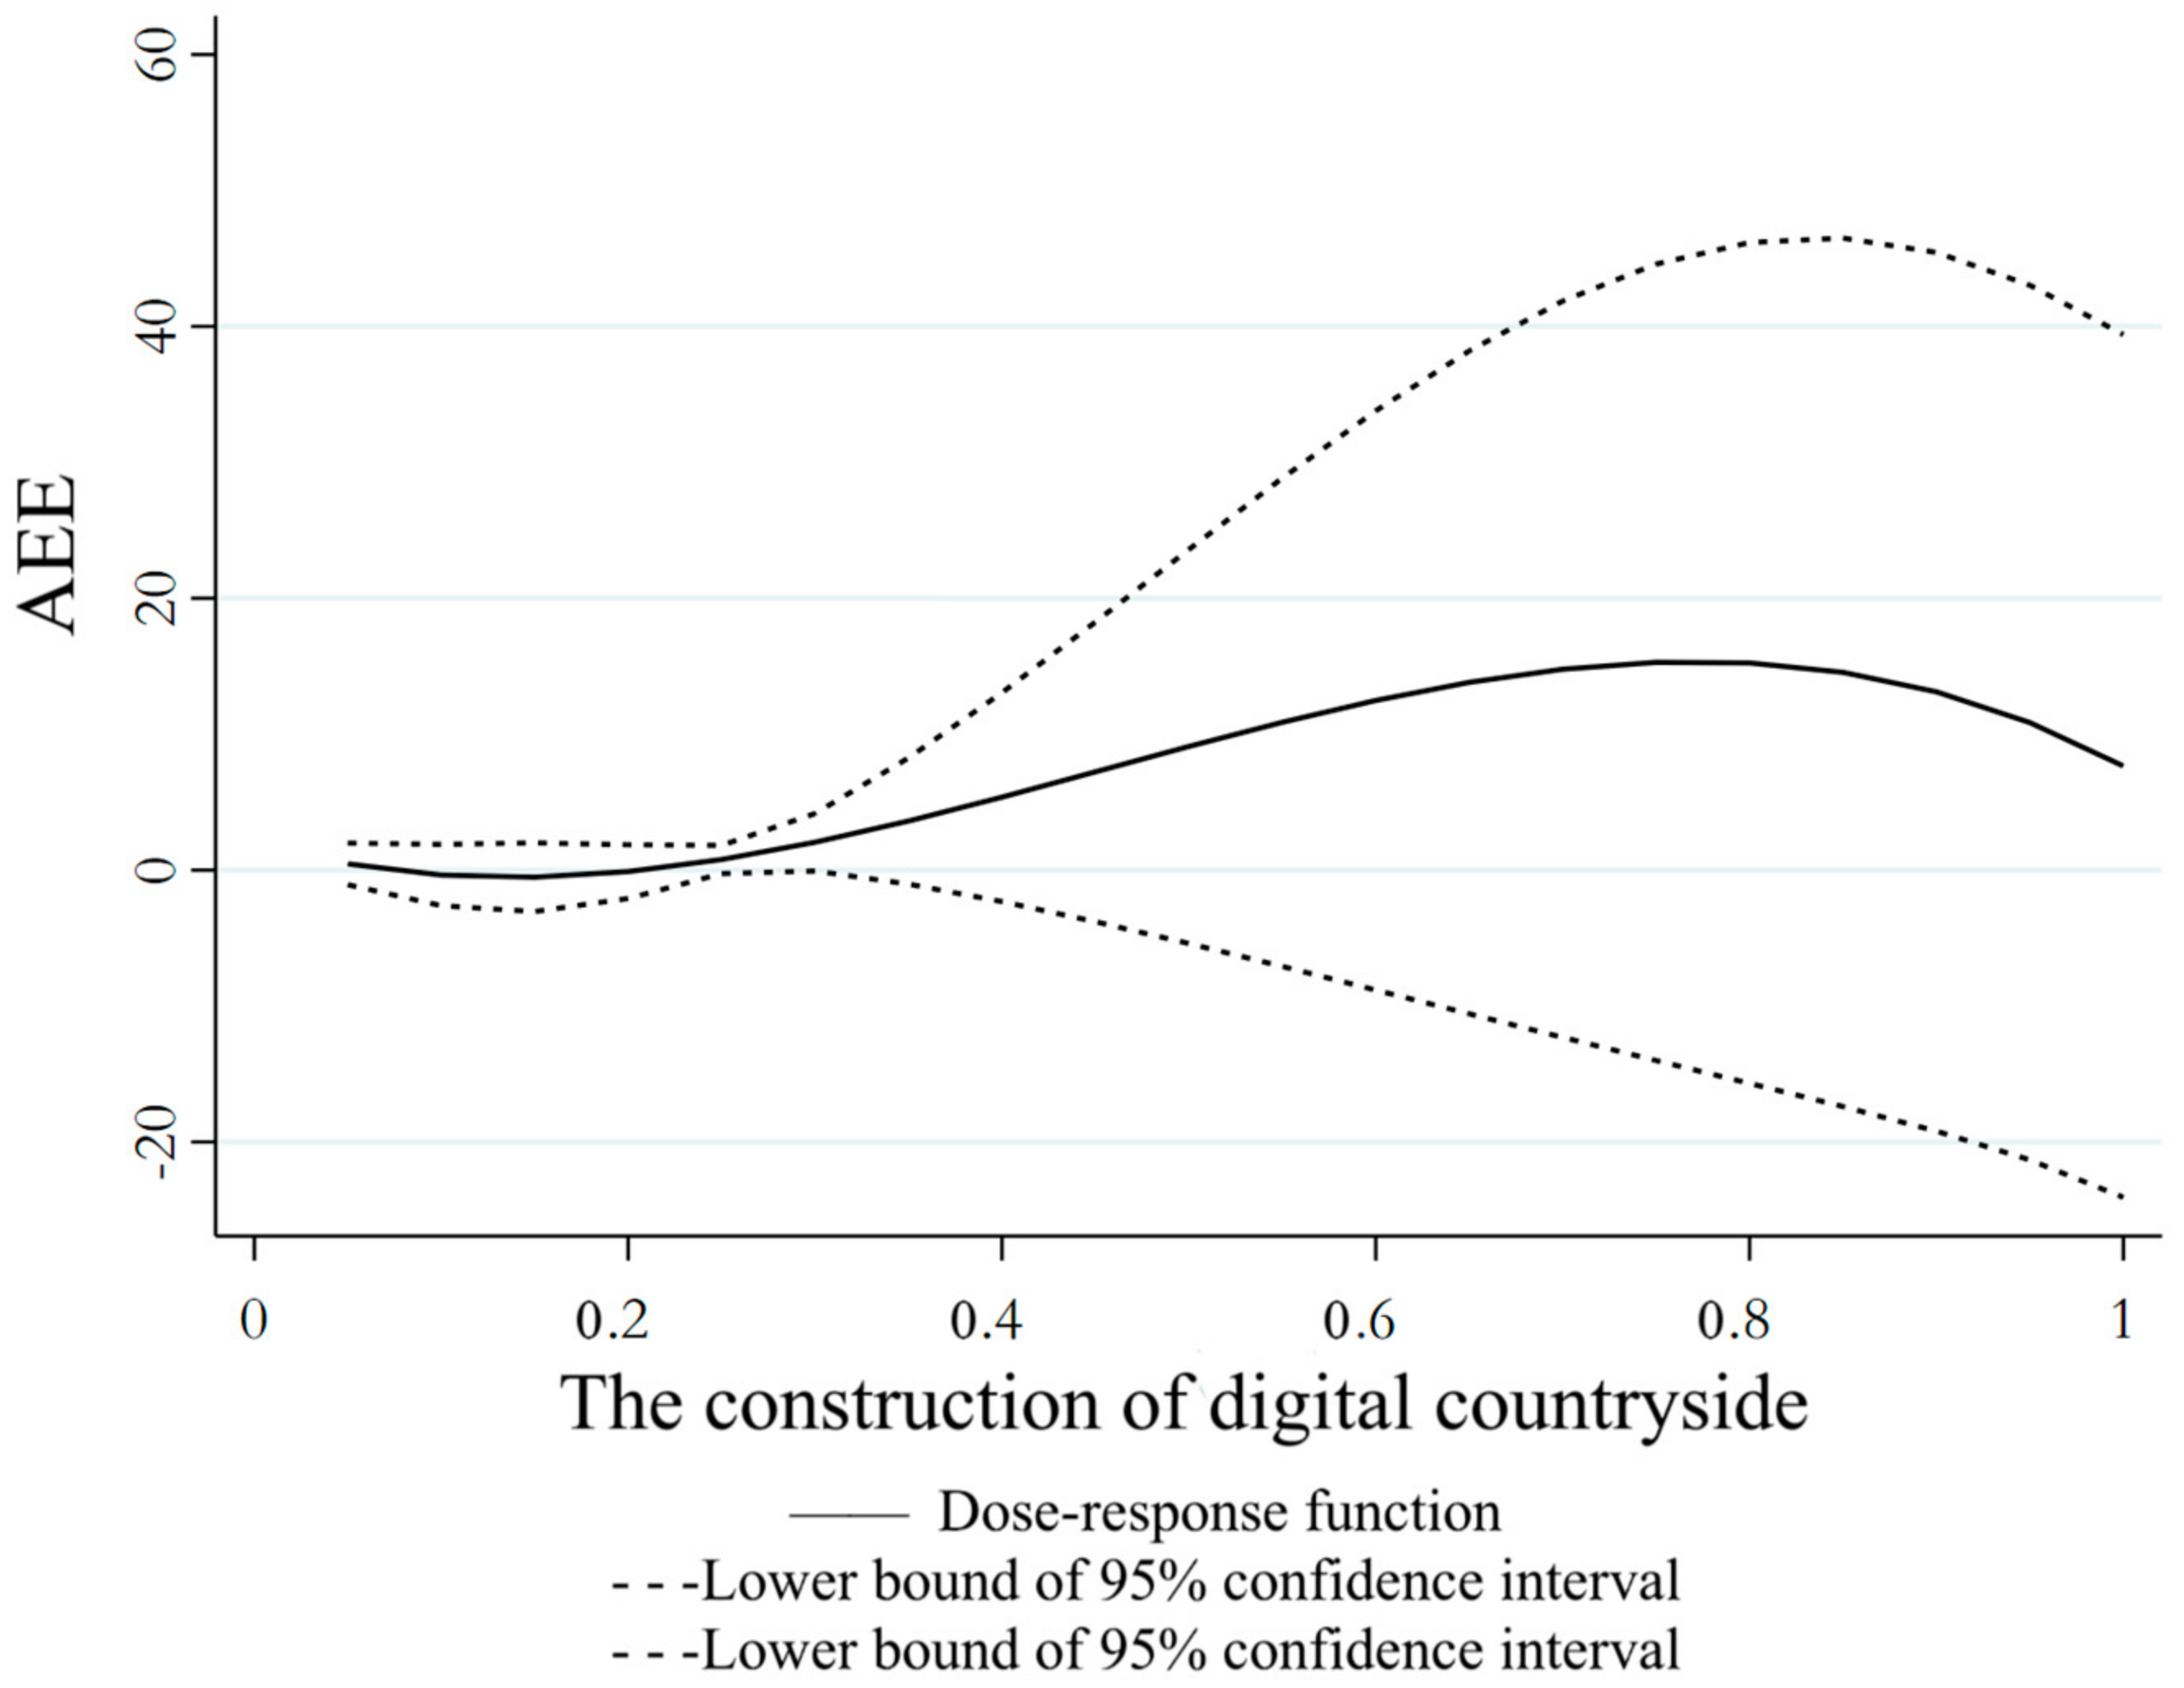
5.2. Dynamic Effect Analysis

Compared with the average effect, the dynamic effect of the construction of a digital village has more important practical significance in promoting the improvement of AEE, and the dynamic effect emphasizes that the role of the construction of a digital village will constantly change with different processing intensities. Specifically, the fractional logit model is used to estimate the generalized propensity score, and the sample is matched by GPSM. In the matching process, it is required to meet the equilibrium condition to ensure the balance of covariables between samples. This study conducts a balance test on the relevant covariables. It can be seen from the test results that after GPSM matching adjustment, the standardization deviation of most matching variables is significantly reduced after matching; that is, the difference between the samples of the treatment group and the control group has been significantly reduced, indicating that the selected matching variables and matching methods are suitable, which means that the estimated results obtained after matching are effective. This study analyzes the development of digital village construction by constructing a normal distribution map. In the figure, we observe that the construction of digital villages has a high intensity in the interval [0, 0.2], indicating that the construction activities in this area are frequent. For a more detailed study, this interval is further subdivided into four equally long subintervals. At the same time, (0.2, 1) is also selected as the subinterval of another study. Then, the regression estimation is carried out for each subinterval. Figure 2 reports the dose-response function of the construction of a digital village on AEE obtained based on the GPSM method.
According to Figure 2, as a whole, the dynamic effect of the construction of a digital village on AEE presents a similar “inverted U-shaped” relationship. Specifically, when the construction level of a digital village belongs to the range [0.1, 0.2], there is a short negative effect. This shows that the development level of digital village construction at this stage is relatively low, influenced by the inclusion of digital village construction in the Central Document No. 1 policy issued by the Chinese government in 2018. And the application of digital technology has not fully played a role and even has a “crowding out effect”, which shows a negative effect on the whole. After crossing the threshold of 0.2, the construction of the digital village began to exert a positive impact on AEE, and the impact degree gradually deepened until it reached the inflection point of 0.8. However, when the value threshold is greater than 0.8, the marginal utility of the construction of a digital village to promote AEE begins to decline.

5.3. Robustness Test

To ensure the reliability of the previous research findings, this study conducted several robustness tests. Firstly, to examine any potential time lag effect on the impact of digital village construction on AEE and address concerns about causal inversion in the double-fixed effect model (H1), we introduced a one-stage lag for explanatory variables and tested explained variables one stage earlier. Secondly, following prior literature [45], we employed a Tobit model as an alternative to the baseline model for testing purposes. The results from Table 6 demonstrate that there is a significant positive influence of digital village construction on AEE, confirming the robustness of our research outcomes.

5.4. Endogeneity Test

The robustness of the baseline results has been demonstrated by the aforementioned estimation. However, there may be some potential endogenous problems in this study. For example, the implementation of digital village construction may be selected because some rural areas already have high agroecological efficiency, so the research results may be affected by selectivity bias, or the improvement of agroecological efficiency may also promote digital village construction, and if left unchecked, reverse causality may lead to problems such as endogenous problems. Therefore, to ensure the accuracy of the findings and mitigate issues like reverse causality and measurement errors in variables, this study employs 2SLS regression with an instrumental variable method to address endogenous problems. In line with the existing literature [50], we construct an instrumental variable for digital village development by creating an interaction term between the number of fixed telephones per 100 people in 1984 and the mobile phone base stations present during that year. The development of digital villages may be influenced by the state of communication infrastructure. The number of fixed telephones is indicative of the level of communication infrastructure, while mobile phone base stations are crucial for mobile communication in rural areas. By examining how these two factors interact, we can better understand the impact that communication infrastructure has on the construction of digital villages. Additionally, since there is a significant time gap between the data collected from fixed telephone usage in 1984 and our current study period, this satisfies instrumental variable exogeneity conditions and does not have a direct relationship with AEE.
The results of the instrumental variables test can be found in Table 7. Based on the regression analysis from the first stage, there is a significant positive correlation between the number of fixed telephones per 100 people in 1984 and the interaction term consisting of mobile phone base stations during that year with regard to digital village construction. This correlation is statistically significant at a confidence level of 1%. The corresponding F statistic for this test is 103.595, which exceeds the critical value for a significance level of 10%. Therefore, we can conclude that there are no issues related to weak instrumental variables and thus ensure their effectiveness. According to the regression findings in the second stage, the construction of a digital village remains a significant positive factor for AEE, with an impact coefficient of 17.8599 at a significance level of 1%. These results are consistent with the baseline regression outcomes, suggesting that even after addressing endogeneity concerns, the construction of a digital village continues to have a substantial promoting effect on AEE. Therefore, this study’s conclusion remains robust.

5.5. Analysis of Influence Mechanism: Regulating Effect of Rural Multi-Governance

Baseline regression analysis proved the positive effect of the construction of a digital village on AEE, and dynamic effect analysis further discussed the differentiated effect of the construction of a digital village in different stages. This shows that it is difficult to rely on external forces to promote the improvement of AEE, and the main body of rural bureaucrats is not only the core participants and beneficiaries of the digital village but also the practitioners of AEE improvement. Therefore, from the perspective of rural multi-governance, this study further discusses the mechanism of how digital rural construction can effectively promote AEE from the perspectives of rural bureaucrats, villagers’ self-governing organizations, enterprises and social organizations, and other governance organizations. In this study, the interaction terms were constructed, and the parameters of the above adjustment variables were estimated using a fixed effect model. The regression results of Equations (3)–(6) were reported, respectively, in columns (1) to (4) of Table 8. Column (1) of Table 8 shows that, on the whole, the cross coefficient between rural multi-governance and the construction of the digital village is positive at the level of 1%; that is, the improvement of rural multi-governance level will strengthen the promotion effect of digital rural construction on AEE level, and the estimated coefficient of interaction term is 0.3378. H2 is verified.
Columns (2) to (4) in Table 8 show that in the practice of rural multi-level governance systems, each subject plays different regulatory roles. Among them, the cross coefficients of rural bureaucrats (PGO), villagers (Vill), and digital village construction (AD) are significantly positive, and the impact coefficients are 0.9994 and 0.4280, respectively. This indicates that the improvement of the participation of rural bureaucrats and villagers has strengthened the positive impact of digital village construction on agroecological efficiency. Rural bureaucrats are the implementation terminal of various policies benefiting agriculture and play a key role in promoting rural revitalization and sustainable agricultural development. Taking China’s “First Secretary” policy as an example, the selection of outstanding cadres from government organs, enterprises, and public institutions to rural areas not only strengthened and enriched the grassroots administrative leadership resources but also played a role in the application of digital technology in the sustainable development of agriculture. On the other hand, villagers are the direct participants and ultimate beneficiaries of agricultural production and rural construction, as well as the users of digital networks and advanced production technologies. Only through the effective participation of villagers can the results of the construction of a digital village be effectively transformed into high-quality agricultural development. H2a and H2b are verified.
The cross-coefficient between market force and social organization (MS) and digital rural construction (AD) is positive but not significant, which may be due to the imperfect market force and relatively weak social organization in China, although both can play a certain role in promoting rural development. This is because organizations such as new cooperative organizations and science and technology extension organizations may have problems such as imperfect mechanisms, insufficient professional level, and limited coverage, which cannot give full play to their roles in digital agricultural promotion, technical training, and information sharing, limiting their effective adjustment between digital rural construction and agricultural ecological efficiency. H2c has not been verified.

5.6. Heterogeneity Analysis

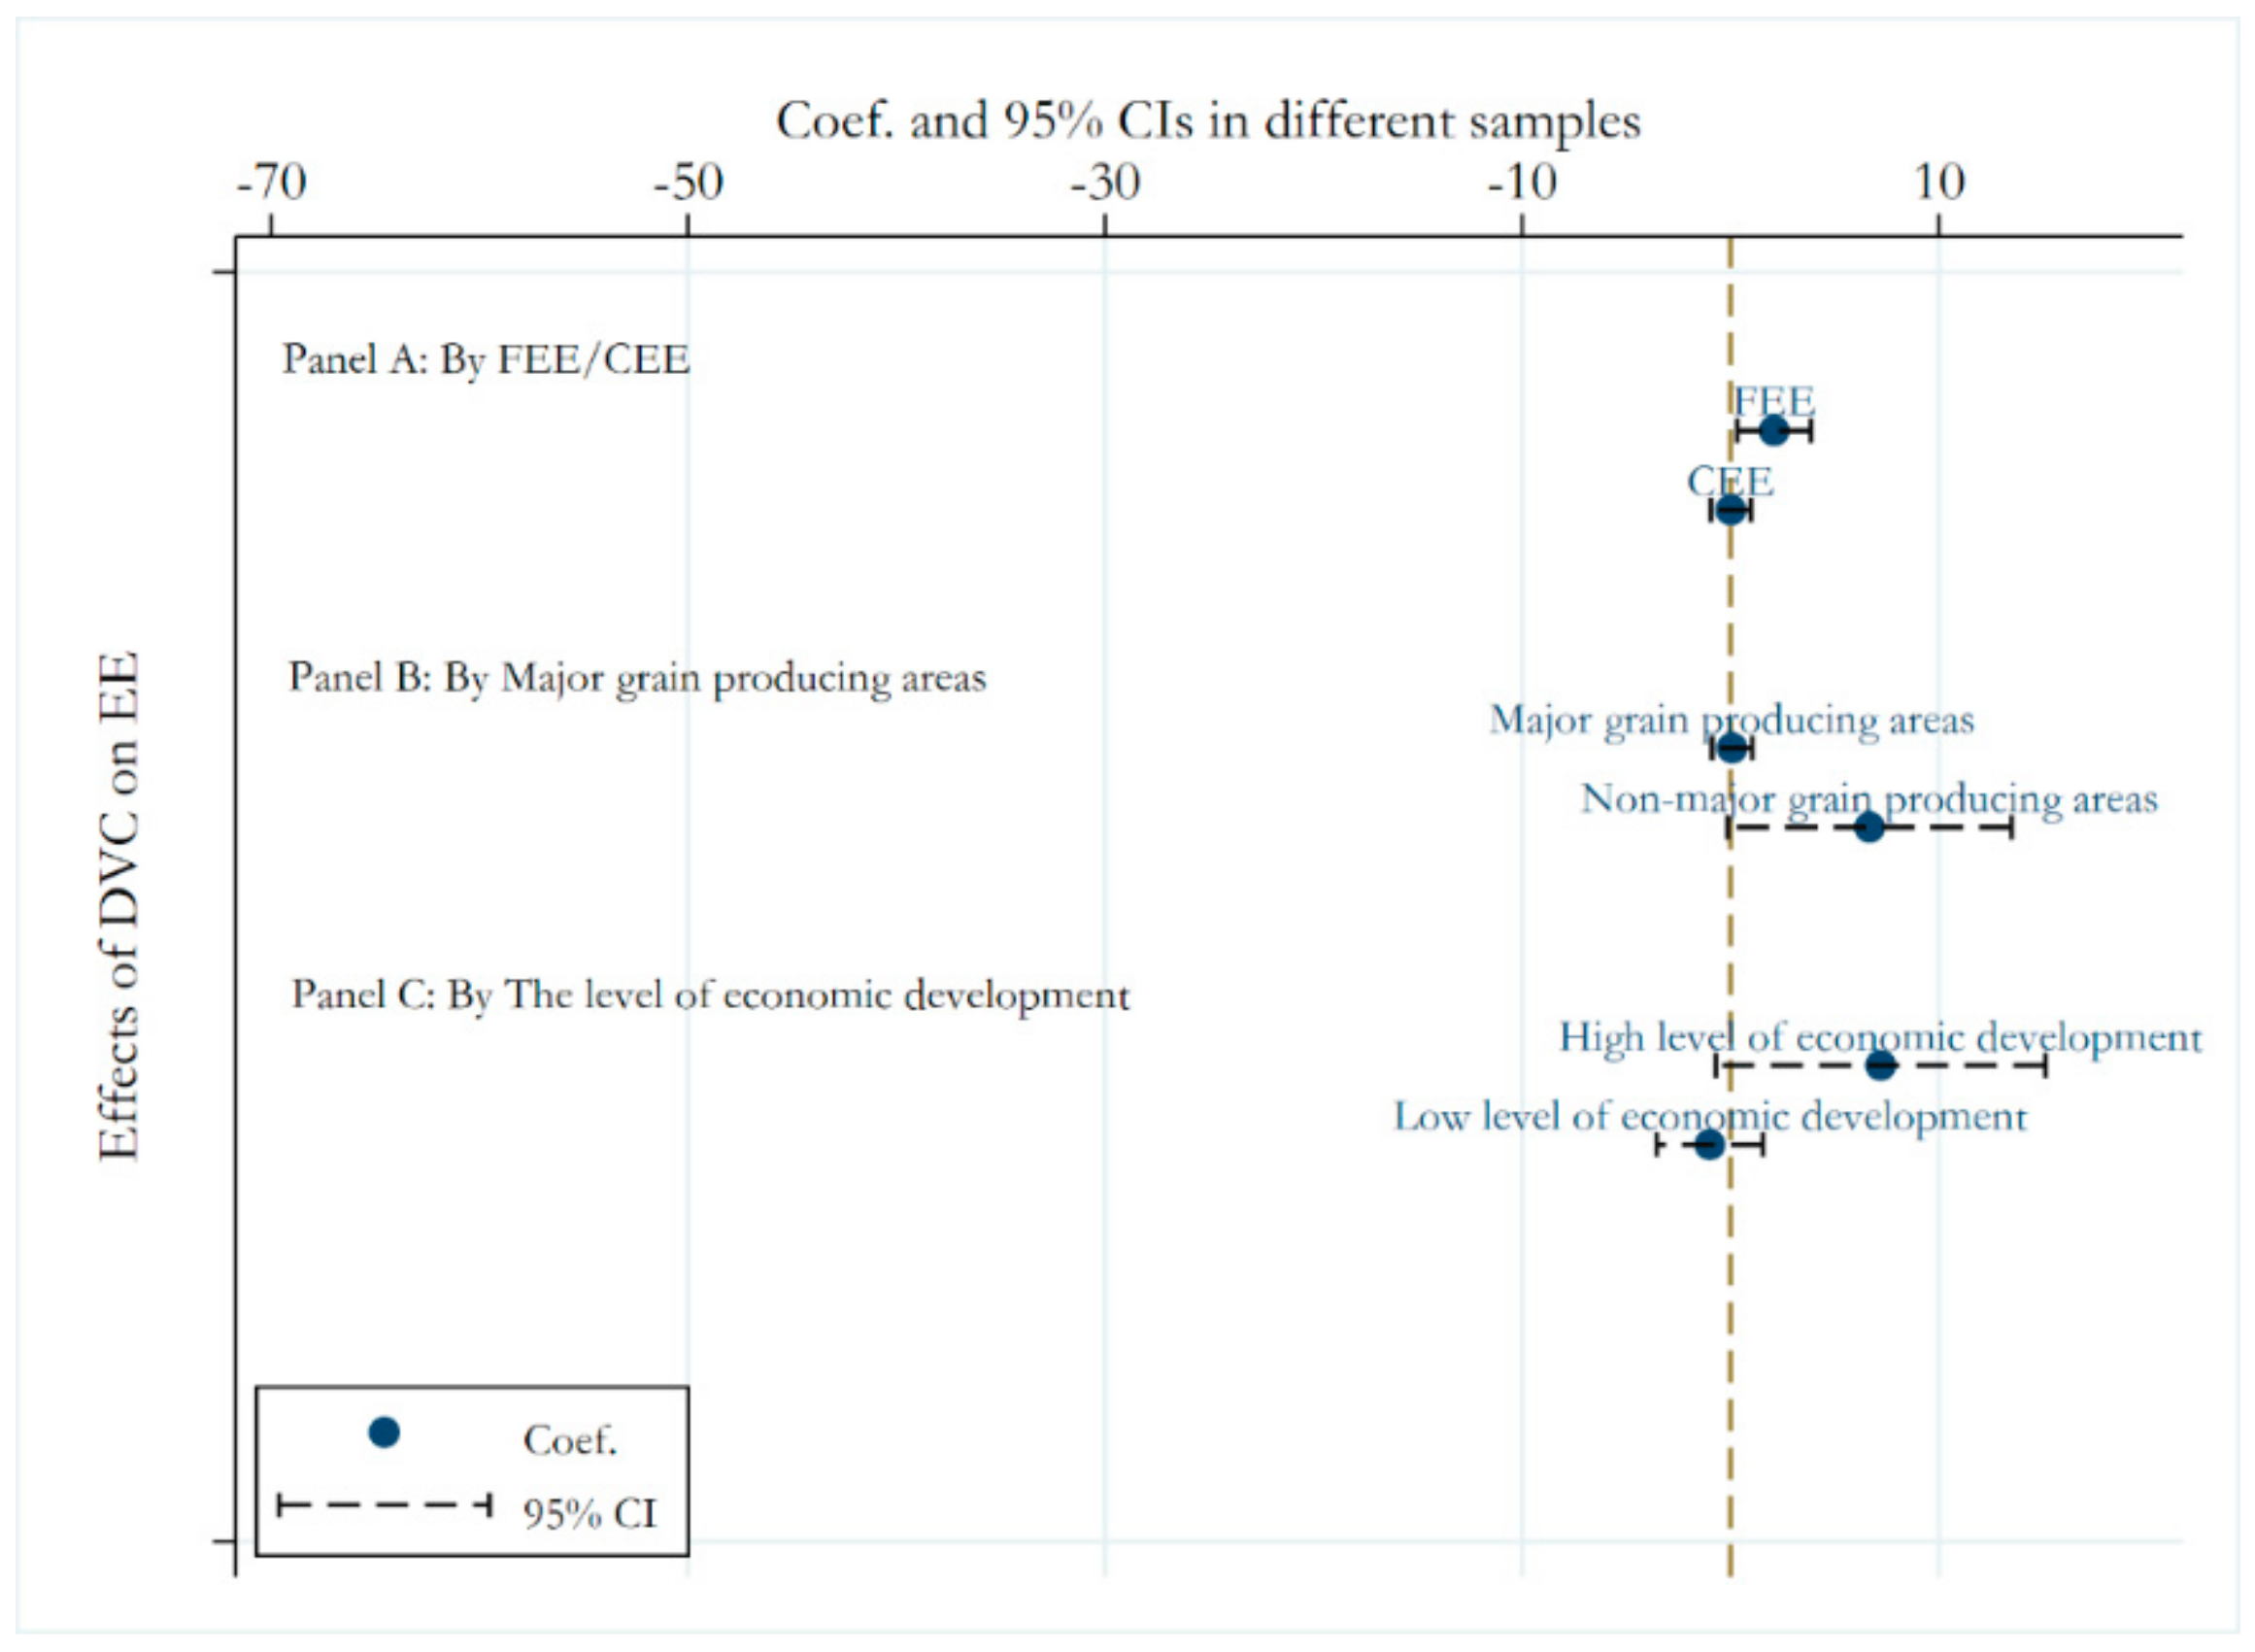
5.6.1. Heterogeneity of Crop Species

The previous analysis found that the AEE levels of food crops and cash crops have different characteristics. The former is relatively stable, while the latter fluctuates greatly under the influence of industrial development and market demand. Therefore, this characteristic difference will also be reflected in the heterogeneous effect of the construction of digital villages on the improvement of the ecological efficiency of different crop types. In Figure 3, FEE and AEE, respectively, show the results of regression between the construction of the digital village and the ecological efficiency of food crops and cash crops: the level of the construction of the digital village has a positive and significant impact on the ecological efficiency of food crops by 5%, with a coefficient of 2.0909 (FEE), while the impact coefficient on the ecological efficiency of cash crops is positive but not significant, with a coefficient of 0.0185 (CEE). The possible reasons are as follows: first, food crops are of great significance to the food security of developing countries, their planting area is extensive, and their quantity is large. Digital technology can improve the output level and environmental benefits of food crops in planting, irrigation, fertilization, disease and pest control, etc. Therefore, the positive impact of the construction of digital villages on food crops is relatively obvious. Second, compared with food crops, the production process of cash crops is more complex, has higher technical requirements, and is more sensitive to market factors. The positive effect of a digital village may be limited by market factors, technology, or production mode and cannot be fully played. Third, food is a basic survival and development need for a country and is regarded as the “lifeline” of the country. Governments usually adopt a series of support policies such as subsidies, priority resource allocation, and technical support to promote the production and development of food crops, which may also boost the application and effect of the construction of digital villages in food crop production.

5.6.2. Differences in Grain-Producing Areas

According to data from the China Statistical Yearbook, during the period of 2014–2020, the combined average annual grain production in Liaoning, Hebei, Shandong, Jilin, Inner Mongolia, Jiangxi, Hunan, Sichuan, Henan, Hubei, Jiangsu Anhui, and Heilongjiang provinces accounted for approximately 77.55% of the total grain output in China. To analyze the impact of digital village construction on agroecological efficiency (AEE), a distinction was made between major grain-producing regions and non-grain-producing regions based on variations in resource endowments and agricultural development conditions. The findings are presented in rows (3) and (4) of Figure 3. The influence of the construction of digital villages in major grain-producing areas on agroecological efficiency is positive but not significant, and the sample coefficient of non-major grain-producing areas is 6.6716, which is significant at the level of 10%. The possible reasons are that the main grain-producing provinces generally have a good agricultural technology foundation and management experience, and the production mode in these areas is relatively stable and can enjoy the scale effect after long-term adjustment and optimization to achieve a high production efficiency and resource utilization efficiency. Therefore, when digital technologies are introduced, the improvement to AEE may not be significant. However, non-grain-producing provinces have low initial benchmarks and have certain room for improvement in terms of resource utilization efficiency and environmental protection. The construction of a digital village can make up for the relative shortage of agricultural production scale and improve production efficiency and ecological efficiency.

5.6.3. Differences in Economic Development Levels

The more developed the regional economy, the stronger the infrastructure and technical conditions for the construction of a digital village, the more positive interaction with ecological agriculture can be realized, and sustainable agricultural development can be promoted [25]. Therefore, referring to Ren et al. (2023) [41], this paper selects the average GDP of 30 provinces in China during 2014–2020 as the median. China’s 30 provinces were divided into the regions with higher economic development levels (Beijing, Hebei, Liaoning, Shanghai, Jiangsu, Zhejiang, Anhui, Fujian, Shandong, Henan, Hubei, Hunan, Guangdong, Sichuan, and Shaanxi) and region with lower economic development level (Tianjin, Shanxi, Inner Mongolia, Jilin, Heilongjiang, Jiangxi, Guangxi, Hainan, Chongqing, Guizhou, Yunnan, Gansu, Qinghai, Ningxia, and Xinjiang). Sample regression was conducted for the two regions, respectively, and the results were shown in rows (5) and (6) of Figure 3. In areas with high economic development levels, the coefficient of the construction of a digital village on AEE is 7.1992 and statistically significant, while in areas with low economic development levels, the coefficient is not significant. This reaffirms the importance of the economic base in protecting and improving agroecology. The relatively poor economic foundation limits the effective allocation and utilization of resources, the conversion rate of agricultural input-output is not ideal, and the low-carbon development of agricultural ecology is still in its infancy, which also limits the positive role of digital technology.

6. Discussion and Conclusions

6.1. Research Findings

Employing a dataset encompassing thirty Chinese provinces within the specified period, this study assesses the construct of digital villages and their impact on AEE. Further, it analyzes textual data related to rural governance through Python to understand how digital villages influence AEE, considering their mechanisms and variability. The key findings are delineated below.
Firstly, AEE shows notable regional differences within China. High AEE is seen in the east and west but is low in central areas. This suggests a link between AEE and regional economic and technological development. However, this regional disparity, known as the “Matthew effect”, presents a challenge for sustainable agricultural growth in developing economies and needs addressing to ensure fairness and sustainability.
Secondly, GPSM analyses indicate digital villages positively influence AEE, especially when development levels are close to optimal 0.8. As digitization progresses, it is important to develop rural governance to prevent a temporary “inverted U-shaped” relationship between digital villages and AEE. But in the long term, this effect diminishes. The digital village model focuses on promoting sustainable agriculture through the digitalization of economic and administrative aspects rather than just facility and lifestyle improvements. This supports the idea that boosting AEE requires a collective effort beyond just technology and infrastructure.
Nevertheless, several structural impediments remain that must be addressed to facilitate a comprehensive and profound fusion of rural life with digital village constructs. Challenges stem from the inherent complexities of agricultural systems, the potential for digital advancements to “crowd out” traditional practices, and the prerequisite for villagers’ digital literacy, as well as their capacity for technology adoption, diffusion, and environmental protection measures. These challenges highlight the importance of not overlooking regional characteristics in the push for digital village development. Instead, a balanced approach is advocated to deter superficial or ineffectual construction efforts within the digital space.
Thirdly, there are main differences in the governance effects of multi-level governance systems. Findings highlight that strong rural governance enhances the positive impact of digital villages on AEE. In China’s 2014–2020 sample, the active roles of rural bureaucrats and villagers’ self-governance are effective, while other entities like businesses and social organizations have less impact. This suggests that developing countries with systems similar to China’s might benefit from internal development models centered on grassroots administrative coordination and local self-governance, but further support for enterprises and social organizations is still needed.
Fourthly, heterogeneity analyses show digital villages significantly improve the ecological efficiency of food crops more than cash crops, which face stronger market forces. Regions with stronger economic bases benefit more from digital villages than major grain-producing areas, which corresponds with findings that wealthier countries typically have higher AEE [19].

6.2. Policy Recommendations

In summary, this study puts forward the following policy recommendations.
To boost efficiency in agricultural production and resource use, it is advisable for developing countries to promote the adoption of modern digital technologies and information systems among farmers. However, it should be noted that there are compatibility issues between digital technology and rural society, which may be negatively affected by aspects such as digital burden and digital formalism. Therefore, it is crucial to consider the local economic conditions, management capabilities, resource availability, and farmers’ digital literacy during the construction of digital villages. Enhancing farmers’ understanding and use of digital technologies should include clear communication and focused training.
A robust rural governance system, coupled with the engagement of various stakeholders, is vital in leveraging digital villages for sustainable agricultural growth. Rural leaders should use their influence to involve community members in digital governance and eco-friendly agricultural practices. Local organizations can harness their grassroots motivation to support sustainable initiatives, which are the core of digital villages. Meanwhile, new agricultural entities—such as market participants, specialized cooperatives, and technical advisory bodies—should collaborate to maintain and improve the rural environment. Establishing an integrated multi-tier governance framework and an information-sharing platform that links all sectors will address agricultural issues effectively, adapt to environmental shifts swiftly, and maintain a healthy agroecosystem, all while sharing the benefits of technology and fostering mutual success.
Despite increased participation in building digital villages, challenges in coordination and motivation persist. Looking at the experiences of countries like Germany, France, and South Korea, the state should act as a facilitative “intermediary” in these efforts, respecting the roles of people and social organizations. It is essential to define roles clearly, cooperate efficiently, and share resources—financial, technological, and human—to maximize resource use and minimize the costs of developing digital villages. We should also establish a risk-sharing mechanism to distribute risks more evenly, reduce pressures, fortify cooperative resilience, and ensure a mutually beneficial outcome.

6.3. Limitations and Suggestions for Future Research

Future studies could expand in three directions. First, refine the methods for measuring digital village progress by considering the interconnectedness of indicators and enhancing the dimensions of evaluation. Second, as governance varies across the agricultural industry’s production, distribution, and consumption stages, future research might examine governance roles along these stages from the perspective of the agricultural industry chain. Third, considering the granularity of data, it is crucial to go beyond provincial-level analyses to capture the idiosyncrasies of digital village progress. Focusing on a county-level analysis would allow researchers to discern local variations and better understand how multi-level governance shapes outcomes at a more nuanced level. It would also enable the investigation of specific context-driven factors that influence the success or failure of digital initiatives.

Author Contributions

Conceptualization, J.R. and Z.T.; methodology, J.R., Z.T. and X.C.; formal analysis, J.R., X.C., L.S., Z.T. and P.L.; resources, J.R., X.C. and Z.T.; writing—original draft preparation, J.R., X.C., L.S., P.L. and Z.T.; writing—review and editing, J.R., X.C., L.S., P.L. and Z.T.; visualization, J.R., X.C. and Z.T.; supervision, Z.T. All authors have read and agreed to the published version of the manuscript.

Funding

This research was funded by (1) The National Social Science Foundation of China, grant number 21BJY047; (2) The Youth Project of Humanities and Social Science Foundation of the Ministry of Education, grant number 19YJC790106; (3) Chongqing graduate research project, grant number CYS23408.

Institutional Review Board Statement

Not applicable.

Data Availability Statement

Data supporting reported results are available upon request from the authors.

Conflicts of Interest

The authors declare no conflicts of interest.

References

  1. Malik, P.K.; Singh, R.; Gehlot, A.; Akram, S.V.; Das, P.K. Village 4.0: Digitalization of village with smart internet of things technologies. Comput. Ind. Eng. 2022, 165, 1–17. [Google Scholar] [CrossRef]
  2. Wang, X.; Kang, M.; Sun, H.; de Reffye, P.; Wang, F.Y. DeCASA in agriverse: Parallel agriculture for smart villages in metaverses. IEEE/CAA J. Autom. Sin. 2022, 9, 2055–2062. [Google Scholar] [CrossRef]
  3. Lundgren, A.S.; Johansson, A. Digital rurality: Producing the countryside in online struggles for rural survival. J. Rural Stud. 2017, 51, 73–82. [Google Scholar] [CrossRef]
  4. Wang, B.; Zhang, W. Measurement and spatiotemporal difference of agricultural eco-efficiency in China. China Popul. Resour. Environ. 2016, 26, 11–19. [Google Scholar]
  5. Tian, Y.; Yin, M. Do technological advances promote agricultural energy carbon reduction?—Based on the test of rebound effect and spatial spillover effect. Reform 2021, 12, 45–58. [Google Scholar]
  6. Mu, J.; Ma, L. Development index measurement and regional differences of agricultural and rural digital economy in China. J. South China Agric. Univ. Soc. Sci. Ed. 2021, 20, 90–98. [Google Scholar]
  7. Huang, F.; Xu, X.; Chen, X. Research on the coupling and coordination of agricultural digitalization and agricultural modernization. North Hortic. 2023, 1, 142–150. [Google Scholar]
  8. Feng, C.; Xu, H. Construction of evaluation index system of digital rural construction and its practical utility. J. Yunnan Norm. Univ. Philos. Soc. Sci. Ed. 2023, 55, 109–120. [Google Scholar]
  9. Fang, K.; Li, F.; Jin, M. Research on Digital rural public service System based on holistic governance. E-Government 2019, 72–81. [Google Scholar] [CrossRef]
  10. Zhang, X.; Lu, Y. Research on the influencing factors of digital village construction and villagers’ political participation behavior. J. South China Agric. Univ. Soc. Sci. Ed. 2023, 22, 44–57. [Google Scholar]
  11. Zhang, L.; Tan, X.; Xiao, Q. Measurement and regional differences of agricultural eco-efficiency based on climate resource input in China. Econ. Geogr. 2023, 43, 154–163. [Google Scholar]
  12. Hu, Z.; Wu, Y. How can digital villages achieve “holistic smart governance”?—Empirical investigation based on the panoramic governance platform of “One Map of digital village” in Wusi Village, Zhejiang. E-Government 2023, 40–53. [Google Scholar] [CrossRef]
  13. Peng, C. The logic of promoting digital rural strategy. Peoples Forum 2019, 33, 72–73. [Google Scholar]
  14. Gong, X.; Li, D.; Liu, Y. An empirical test of the impact of digital rural construction on common prosperity. Stat. Decis. 2023, 39, 24–29. [Google Scholar]
  15. Shen, F.; Cui, Y. How digital rural governance can improve social quality: An explanation based on Social quality theory. J. Nanjing Agric. Univ. Soc. Sci. Ed. 2019, 23, 95–105. [Google Scholar]
  16. Zhou, B.; Li, Y.; Zhang, G. The influence mechanism and spatial effect of rural revitalization empowered by digital rural construction. China Circ. Econ. 2023, 37, 3–16. [Google Scholar]
  17. Li, C.; Zhang, M.; Zhang, J.; Song, J.; Zhao, S.N. The structure and connotation of farmers’ digital literacy framework under the background of digital village construction. Libr. Inf. Knowl. 2023, 40, 62–71. [Google Scholar]
  18. Chen, T.; Wang, P. Information Gap and Practical Symptoms of Digital village Construction. E-Government 2020, 2–12. [Google Scholar] [CrossRef]
  19. Yang, X.; Wang, Y.; Wang, J. Study on the effect and mechanism of digital rural development on agricultural carbon emission intensity. Stat. Decis. 2019, 39, 66–71. [Google Scholar]
  20. Müller, K.; Holmes, A.; Deurer, M.; Clothier, B.E. Eco-efficiency as a sustainability measure for kiwifruit production in New Zealand. J. Clean. Prod. 2015, 106, 333–342. [Google Scholar] [CrossRef]
  21. Pan, D.; Ying, R. Evaluation methods and empirical evidence of agricultural eco-efficiency in China: An analysis of SBM model based on non-expected output. Acta Ecol. Sin. 2013, 33, 3837–3845. [Google Scholar] [CrossRef]
  22. Wang, B.; Zhang, W. Inter-provincial differences and influencing factors of agricultural eco-efficiency in China: Based on panel data of 31 provinces from 1996 to 2015. Chin. Rural Econ. 2018, 1, 46–62. [Google Scholar]
  23. Tavana, M.; Mirzagoltabar, H.; Mirhedayatian, S.M.; Saen, R.F.; Azadi, M. A new network epsilon-based DEA model for supply chain performance evaluation. Comput. Ind. Eng. 2013, 66, 501–513. [Google Scholar] [CrossRef]
  24. Zhang, H.; Yang, H. Efficiency of Chinese commercial banks based on super-efficient network SBM model considering non-expected output. Syst. Eng. 2017, 35, 17–24. [Google Scholar]
  25. Cui, X.; Wang, Y.; Zhang, G. Measurement and spatial-temporal evolution of agricultural ecological efficiency for low-carbon development: Based on SBM-ESDA model. Issues Agric. Econ. 2022, 9, 47–61. [Google Scholar]
  26. Olesen, J.E.; Bindi, M. Consequences of climate change for European agricultural productivity, land use and policy. Eur. J. Agron. 2002, 16, 239–262. [Google Scholar] [CrossRef]
  27. Akbar, U.; Li, Q.L.; Akmal, M.A.; Shakib, M.; Iqbal, W. Nexus between agro-ecological efficiency and carbon emission transfer: Evidence from China. Environ. Sci. Pollut. Res. 2021, 28, 18995–19007. [Google Scholar] [CrossRef] [PubMed]
  28. Power, A.G. Ecosystem services and agriculture: Tradeoffs and synergies. Philos. Trans. R. Soc. B Biol. Sci. 2010, 365, 2959–2971. [Google Scholar] [CrossRef]
  29. Sun, X.; Lu, Z.; Li, F.; Crittenden, J.C. Analyzing spatio-temporal changes and trade-offs to support the supply of multiple ecosystem services in Beijing, China. Ecol. Indic. 2018, 94, 117–129. [Google Scholar] [CrossRef]
  30. Geffersa, A.G.; Agbola, F.W.; Mahmood, A. Technical efficiency in crop production across agro-ecological zones in Ethiopia: A meta-analysis of frontier studies. Outlook Agric. 2019, 48, 5–15. [Google Scholar] [CrossRef]
  31. Hou, M.; Yao, S. Spatial spillover effect and threshold characteristics of rural labor transfer on agricultural eco-efficiency in China. Resour. Sci. 2018, 40, 2475–2486. [Google Scholar]
  32. Ding, B. Digital governance: A new model of village governance in the digital village. J. Northwest AF Univ. Soc. Sci. Ed. 2022, 22, 9–15. [Google Scholar]
  33. Wen, T.; Chen, Y. Integrated development of digital economy and agricultural and rural economy: Practice model, realistic obstacles and breakthrough path. Issues Agric. Econ. 2020, 7, 118–129. [Google Scholar]
  34. Wang, G.; Qian, Z.; Shi, R. Research hotspots and trends of agricultural eco-efficiency in China. China Agric. Resour. Reg. Plan. 2023, 44, 20–31. [Google Scholar]
  35. Wan, S.; Tang, K. Research on mechanism and path of digital economy promoting rural industry revitalization. J. Zhongzhou 2022, 3, 29–36. [Google Scholar]
  36. Yang, R.; Cao, Y. On the tension and resolution between rural digital empowerment and digital divide. J. Nanjing Agric. Univ. Soc. Sci. Ed. 2021, 21, 31–40. [Google Scholar]
  37. Zhan, L.; Zhang, Y.; Ma, X. Levitation, instrumental rationality and transformation of digital rural construction. Rural Econ. 2023, 6, 1–10. [Google Scholar]
  38. Ma, L. Rural Professional Cooperative economic Organizations promote good governance of rural society. Peoples Forum 2017, 9, 78–79. [Google Scholar]
  39. Zuo, T.; Su, Q. Rural organization innovation: The experience of poverty alleviation and inspiration for rural revitalization. Search 2020, 4, 99–105. [Google Scholar]
  40. Cui, E. Research on Regional Differences of Digital Rural construction in China. Liaoning University. Master’s Thesis, Shenyang, China, 2023. [Google Scholar]
  41. Ren, J.; Chen, X.; Gao, T.; Chen, H.; Shi, L.; Shi, M. New Digital Infrastructure’s Impact on Agricultural Eco-Efficiency Improvement: Influence Mechanism and Empirical Test—Evidence from China. Int. J. Environ. Res. Public Health 2023, 20, 3552. [Google Scholar] [CrossRef] [PubMed]
  42. Chen, J.; Xin, M.; Ma, X.; Chang, B.; Zhang, Z. Measurement and driving factors of agricultural eco-efficiency in China. China Environ. Sci. 2020, 40, 3216–3227. [Google Scholar]
  43. Zhao, L.; Hou, D.; Wang, Y. Impact of urbanization on environmental technical efficiency of grain production. China Popul. Resour. Environ. 2016, 26, 153–162. [Google Scholar]
  44. Li, X.; Gu, L.; Li, R. Evaluation of ecological efficiency of grain production in major grain producing areas in China. Chin. J. Agric. Mech. 2022, 43, 205–213. [Google Scholar] [CrossRef]
  45. Xue, X.; Wen, Y. Effect of agricultural industrial agglomeration on agro-ecological efficiency in the Yellow River Basin: An empirical study based on PCA-DEA and Panel Tobit model. Chin. J. Agric. Resour. Reg. 2019, 44, 150–160. [Google Scholar]
  46. Bai, J.; Zhang, Y.; Bian, Y. Whether innovation-driven policies promote entrepreneurial activity in cities: Empirical evidence from national innovation-driven city pilot policies. China Ind. Econ. 2022, 6, 61–78. [Google Scholar]
  47. Hirano, K.; Imbens, G.W. The propensity score with continuous treatments. In Applied Bayesian Modeling and Causal Inference from Incomplete-Data Perspectives; John Wiley & Sons, Inc.: Hoboken, NJ, USA, 2004; Volume 226164, pp. 73–84. [Google Scholar]
  48. Hu, H.; Yang, X.; Li, J.; Shen, J.; Dai, J.; Jin, Y. Can Digital Rural Construction Improve China’s Agricultural Surface Pollution? Autoregressive Modeling Based on Spatial Quartiles. Sustainability 2023, 15, 13138. [Google Scholar] [CrossRef]
  49. Yao, W.; Sun, Z. The Impact of the Digital Economy on High-Quality Development of Agriculture: A China Case Study. Sustainability 2023, 15, 5745. [Google Scholar] [CrossRef]
  50. Zhao, T.; Zhang, Z.; Liang, S. Digital economy, entrepreneurial activity and high-quality development: Empirical evidence from Chinese cities. Manag. World 2019, 36, 65–76. [Google Scholar]
Figure 1. Research structure diagram.
Agriculture 14 00478 g001
Figure 2. Dose response to the construction of a digital village to AEE.
Agriculture 14 00478 g002
Figure 3. Results of heterogeneity analysis.
Agriculture 14 00478 g003
Table 1. Index system of the construction of a digital village.
Primary IndicatorSecondary IndicatorIndex MeaningUnitStats
Facility digitalizationIntensity of construction investmentInvestment in fixed assets in rural information transmission, software, and information technology servicesHundred million yuan+
Rural mobile phone penetrationThe number of mobile phones per 100 rural householdsTai+
Rural Internet penetrationNumber of rural broadband access households/Total rural households%+
Rural logistics construction levelRural delivery route densitySquare kilometers per kilometer+
Agrometeorological observation stationNumber of agrometeorological observation stationsa+
Rural electricity consumptionRural electricity consumption/rural populationKilowatt-hours per person+
Economic digitalizationAgricultural digital baseNumber of Taobao villagesa+
Agricultural digital scalePrimary industry online retail sales/rural populationOne hundred yuan/person+
Rural postal rateNumber of administrative villages reached by post/Total number of administrative villages%+
Rural digital financeThe digitalization degree of digital financial inclusion index at the county level/+
Administrative digitalizationDigital subsidyAmount of expenditures related to agricultureTen thousand yuan+
Digital government constructionLocal government digital technology attention/+
Local government digital application attention/+
Life digitalizationFarmers’ consumption level of digital products and services(Base period) Transport and communication expenditure per capita of rural households/+
Network culture construction levelThe proportion of digital TV users in total households%+
Rural financial coverageCounty digital financial inclusion index coverage breadth/+
Depth of use of rural financeDepth of use of county digital financial inclusion index/+
Rural computer penetration rateThe average number of computers per 100 rural households at the end of the yearTai+
Table 2. Value of AEE level from 2014 to 2020.
Sort Year2014201520162017201820192020
Classification
Agroecological efficiency levelNationwide0.71780.85050.86740.91300.95070.97971.6286
Eastern0.75230.94640.89460.97981.08511.19252.9134
Central0.66110.73160.77530.78150.81740.82520.7119
Western0.72840.84170.92310.95560.90480.85060.8320
Ecological efficiency level of grain cropsNationwide0.96060.94400.88660.88471.02081.04371.1762
Eastern0.99540.94640.85760.88891.12781.19671.5710
Central0.95030.94960.88450.87160.95850.95700.9470
Western0.92460.93530.92730.89210.94040.92660.8789
Ecological efficiency level of grain cropsNationwide0.78960.75190.82310.91480.72420.86120.6949
Eastern0.73210.79670.86160.97440.81780.92110.6613
Central0.78290.78510.91031.02800.90960.77720.5870
Western0.87290.65880.68450.72220.41410.86530.8476
Note: based on the classification of the National Bureau of Statistics, 30 provinces in China are divided into eastern, central, and western regions. The national average level of AEE in 30 provinces (municipalities) of China is the same as table above. The eastern region of China includes Beijing, Tianjin, Hebei, Liaoning, Shanghai, Jiangsu, Zhejiang, Fujian, Shandong, Guangdong, Guangxi, and Hainan; the central region of China includes Shanxi, Inner Mongolia, Jilin, Heilongjiang, Anhui, Jiangxi, Henan, Hubei, and Hunan; and the western region of China includes Sichuan, Guizhou, Yunnan, Tibet, Shaanxi, Gansu, Ningxia, Qinghai, and Xinjiang.
Table 3. Keywords of rural multi-governance.
Condition 1Condition 2Condition 3
Grassroots administrative organizations: township party organizations, grassroots cadres, young party members, township personnel, village party organization secretary, village party branch secretary, village first secretary, village work team, rural work team, village “two committees”, responsible persons, grid members, villagers, village party branches, college students in the township, village party organizations, rural grassroots party organizations, rural communities Neighborhood committee, administrative village party organization, etc.
Villagers’ self-governing organizations: villagers’ self-governing organizations, villagers’ committees, villagers’ groups, villagers’ representative meetings, villagers’ supervision committees, villagers’ committees, etc.
Other governance organizations: village-level collective economic organizations, cooperative economic organizations, agriculture-related organizations, social organizations, etc.
Lead, coordinate, help, safeguard, manage, use, organize, support, drive, promote, carry out, build, establish, guide, attract, self-govern, formulate, govern, adopt, repair, control, reduce, etc.Technology, technical measures, management measures, technology, information, investment, funds, mechanisms, models, models, facilities, engineering, equipment, electronics, sales channels, acquisitions, sales strategies, sales systems, transportation, projects, industries, construction, environment, ecology, action, platforms, participation, collaboration, pollution, sharing platforms, etc.
Table 4. Descriptive statistics.
VariableSymbolUnitObservedMeanStandard ErrorMinMax
Agroecological efficiencyAEE/2100.98681.87490.242226.4558
Ecological efficiency of food cropsFEE/2100.98810.84530.303710.0394
Ecological efficiency of cash cropsCEE/2100.79420.48120.01802.2332
The construction of a digital villageDVC/2100.18940.13590.01130.7948
Facility digitalizationFD/2100.17350.11010.0270.8048
Economic digitalizationED/2100.07360.10390.00520.6503
Administrative digitalizationGD/2100.31510.13240.07940.7464
Life digitalizationLD/2100.38020.14780.05660.7312
Rural multi-governanceRPGThousand2107.842615.75650105.88
Grassroots administrative organization governancePGOThousand2103.31237.7658053.02
Villager governanceVillThousand2102.15214.2187023.46
Other governanceMSThousand2102.37815.8806050.86
The level of agricultural economic developmentAEDTen thousand yuan/person2105.23486.29860.145776.9461
Agricultural disaster rateADR/2100.13390.116900.6186
Human capital levelRHC/2100.29520.130000.5802
Fertilizer useFU/2100.36780.13460.09540.7508
Entrepreneurial activityEAper 100 people2101.32900.49140.52034.4225
Table 5. Influence of the construction of digital village on AEE.
AEE
(1)(2)(3)(4)(5)(6)
DVC2.5005 ***7.5329 ***
(2.66)(3.14)
FD 6.8178
(0.76)
ED 5.6027 **
(2.42)
GD 4.2104 **
(2.48)
LD −1.1243
(−0.34)
AED −0.0558 **−0.0609 **−0.0525 **−0.0581 **−0.0534 **
(−2.28)(−2.32)(−2.12)(−2.35)(−2.08)
ADR −1.4675−0.9966−1.1929−1.4655−0.9369
(−1.11)(−0.74)(−0.89)(−1.09)(−0.69)
RHC 12.3301 ***12.8036 ***11.2272 ***12.1541 ***10.8079 **
(2.96)(2.69)(2.67)(2.88)(2.44)
FU 0.16810.73280.27141.91551.2242
(0.04)(0.16)(0.06)(0.42)(0.27)
EA −1.4715 ***−1.2440 ***−1.4267 ***−1.1710 ***−1.2151 ***
(−3.38)(−2.81)(−3.23)(−2.71)(−2.76)
Time effectNoYesYesYesYesYes
Regional effectNoYesYesYesYesYes
N210210210210210210
R20.03280.1610.1150.1410.1430.112
Notes: the following tables are identical to Table 5, with “*, **, ***” showing significance levels of 10%, 5%, and 1%. The t-value is in parentheses.
Table 6. Robustness test results.
AEEF.AEE
(1)(2)(3)
L.DVC8.4479 **
(2.52)
DVC 7.5329 ***5.7542 *
(3.51)(1.85)
Control variablesYesYesYes
Time effectYesYesYes
Regional effectYesYesYes
N180210180
R20.1390.1520.208
Notes: “*, **, ***” show significance levels of 10%, 5%, and 1%. The t-value is in parentheses.
Table 7. Results of endogeneity test.
Instrumental Variable
(1)(2)
DVC 17.8599 ***
(4.88)
IV0.0153 ***
(10.18)
Control variablesYesYes
Time effectYesYes
Regional effectYesYes
F statistic103.595
N210210
R20.93450.4031
Note: The values in column 1 parentheses are the T-value, and the values in brackets are the Z-values in column (2). “***” shows a significance level of 1%.
Table 8. The regulating effect of rural pluralistic governance.
AEE
(1)(2)(3)(4)
DVC4.16275.4791 **4.4008 *7.1384 ***
(1.62)(2.22)(1.72)(2.85)
RPG−0.0493 **
(−2.10)
DVC × RPG0.3378 ***
(3.13)
PGO −0.1843 ***
(−2.61)
DVC×PDO 0.9994 ***
(3.07)
Vill −0.0170
(−0.22)
DVC × Vill 0.4280 **
(2.17)
MS −0.0207
(−0.33)
DVC × MS 0.2182
(0.68)
Control variablesYesYesYesYes
Time effectYesYesYesYes
Regional effectYesYesYesYes
N210210210210
R20.2180.2120.2110.166
Notes: “*, **, ***” show significance levels of 10%, 5%, and 1%. The t-value is in parentheses.
Disclaimer/Publisher’s Note: The statements, opinions and data contained in all publications are solely those of the individual author(s) and contributor(s) and not of MDPI and/or the editor(s). MDPI and/or the editor(s) disclaim responsibility for any injury to people or property resulting from any ideas, methods, instructions or products referred to in the content.

