Article

High-Precision Detection for Sandalwood Trees via Improved YOLOv5s and StyleGAN

1
College of Electronic Engineering (College of Artificial Intelligence), South China Agricultural University, Guangzhou 510642, China
2
College of Natural Resources and Environment, South China Agricultural University, Guangzhou 510642, China
*
Author to whom correspondence should be addressed.
Agriculture 2024, 14(3), 452; https://doi.org/10.3390/agriculture14030452
Submission received: 29 January 2024 / Revised: 29 February 2024 / Accepted: 5 March 2024 / Published: 11 March 2024
(This article belongs to the Special Issue Advanced Image Processing in Agricultural Applications)

Abstract

:
An algorithm model based on computer vision is one of the critical technologies that are imperative for agriculture and forestry planting. In this paper, a vision algorithm model based on StyleGAN and improved YOLOv5s is proposed to detect sandalwood trees from unmanned aerial vehicle remote sensing data, and this model has excellent adaptability to complex environments. To enhance feature expression ability, a CA (coordinate attention) module with dimensional information is introduced, which can both capture target channel information and keep correlation information between long-range pixels. To improve the training speed and test accuracy, SIOU (structural similarity intersection over union) is proposed to replace the traditional loss function, whose direction matching degree between the prediction box and the real box is fully considered. To achieve the generalization ability of the model, StyleGAN is introduced to augment the remote sensing data of sandalwood trees and to improve the sample balance of different flight heights. The experimental results show that the average accuracy of sandalwood tree detection increased from 93% to 95.2% through YOLOv5s model improvement; then, on that basis, the accuracy increased by another 0.4% via data generation from the StyleGAN algorithm model, finally reaching 95.6%. Compared with the mainstream lightweight models YOLOv5-mobilenet, YOLOv5-ghost, YOLOXs, and YOLOv4-tiny, the accuracy of this method is 2.3%, 2.9%, 3.6%, and 6.6% higher, respectively. The size of the training sandalwood tree model is 14.5 Mb, and the detection time is 17.6 ms. Thus, the algorithm demonstrates the advantages of having high detection accuracy, a compact model size, and a rapid processing speed, making it suitable for integration into edge computing devices for on-site real-time monitoring.

1. Introduction

The sandalwood tree is a semi-parasitic evergreen plant with high economic value [1]. Its growth cycle is usually 10 to 15 years. In order to ensure their high productivity and economic benefits, sandalwood trees need different care methods during different growth stages. The death of sandalwood trees may be caused by a lack of companion plants, vicious weather, noxious weeds, etc., especially in the first 5 years of the seedling period. Without timely replanting, old sandalwood trees around the missing seedlings will be much larger than the new seedlings, and the new ones will be hidden from the sun, which may lead to death again or poor growth [2,3,4,5]. Therefore, it is necessary to monitor missing seedlings in real time and then replant them in a timely manner to avoid the situation mentioned above. Ultimately, the yield would be ensured for sandalwood growers. Currently, the monitoring efforts mentioned above are mainly conducted manually, but it is difficult and inefficient for workers to pass through sandalwood plantations because of the intercrop with companion plants, such as cassava, weeds, etc. Meanwhile, the high labor cost and difficult means of supervision are also challenges, especially for large-scale sandalwood cultivation. Therefore, conducting research on low-cost, high-precision, and intelligent detection technology to identify the conditions of growth is imperative.
In recent years, intelligent detection technology in agriculture and forestry has gradually developed from machine learning [6,7,8,9] to deep learning. Machine vision technology based on deep learning is more widely used in agricultural and forestry monitoring because neural networks can automatically extract target features. Object detection algorithms based on deep learning can be summarized into two categories. One comprises two-stage algorithms based on candidate regions, which mainly includes R-CNN and its derivative algorithms Fast R-CNN and Faster R-CNN, of which the latter is the dominant one [10,11,12]. Based on the Faster R-CNN model, Zhu et al. [13] identified different ripeness degrees in blueberry, with accuracies of 97%, 95%, and 92% for ripe, semi-ripe, and unripe fruits, respectively, and with an average detection time of 250 ms per image; Sun et al. [14] successfully recognized ripeness in tomato with an accuracy of 90.7% and a detection time of 73 ms using the Faster R-CNN model with the feature extraction network ResNet50. In general, this kind of algorithm has a high detection accuracy but a slow detection speed. The second category is the single-stage algorithm mainly based on regression, with typical ones including the SSD and YOLO series, especially the latter [15,16]. Based on the YOLOv4-tiny object detection model and remote sensing data, dead trees were detected with an accuracy of 93.25% and a detection time of 5.5 ms per image in the study by Jin et al. [17]. By combining improved YOLOv5s and DeepSort, peanut seedlings were captured and counted from UAV-captured videos in the study by Lin et al. [18], achieving an average accuracy of 98.08% and a detection speed of 24.9 ms. The improved YOLOv5s model fused with the convolution attention mechanism was used to identify sugarcane seedlings with an average accuracy of 93.1% and a detection time of 48 ms per image in the study by Wu et al. [19]. YOLO series models can both ensure accuracy and detection speed; therefore, they show better real-time performance than two-stage algorithms.
Generative adversarial networks (GANs) are another significant technology that can improve detection accuracy and have been widely used in machine vision [20,21,22]. Tian et al. [23], Wang et al. [24], and Zeng et al. [25] used a GAN to generate samples of apples with pests and diseases, samples of litchi with different defects, and samples of grape leaves with pests and diseases, respectively; the samples were augmented and their detection accuracies were improved by 8.85% at most.
Although YOLOv5s has both speed and environmental adaptability, it still cannot ideally detect sandalwood trees with particularly complex planting conditions [26]. So far, sandalwood planting has not yet formed a scale, and UAVs are limited by high-voltage wires and other restrictions in limited planting bases when taking remote sensing images. Samples collected at different flight altitudes are greatly different, which may cause the number of samples to be unbalanced at different resolutions. To solve the two problems above, a detection algorithm based on improved YOLOv5s and StyleGAN is proposed in this paper. The traditional loss function replaced by SIOU and the CA module with dimensional features are both introduced in YOLOv5s to improve the training speed and detection accuracy (details below). StyleGAN is introduced to expand samples and improve the generalization ability of the YOLOv5s training model.

2. Materials and Methods

2.1. Data Acquisition and Preprocessing

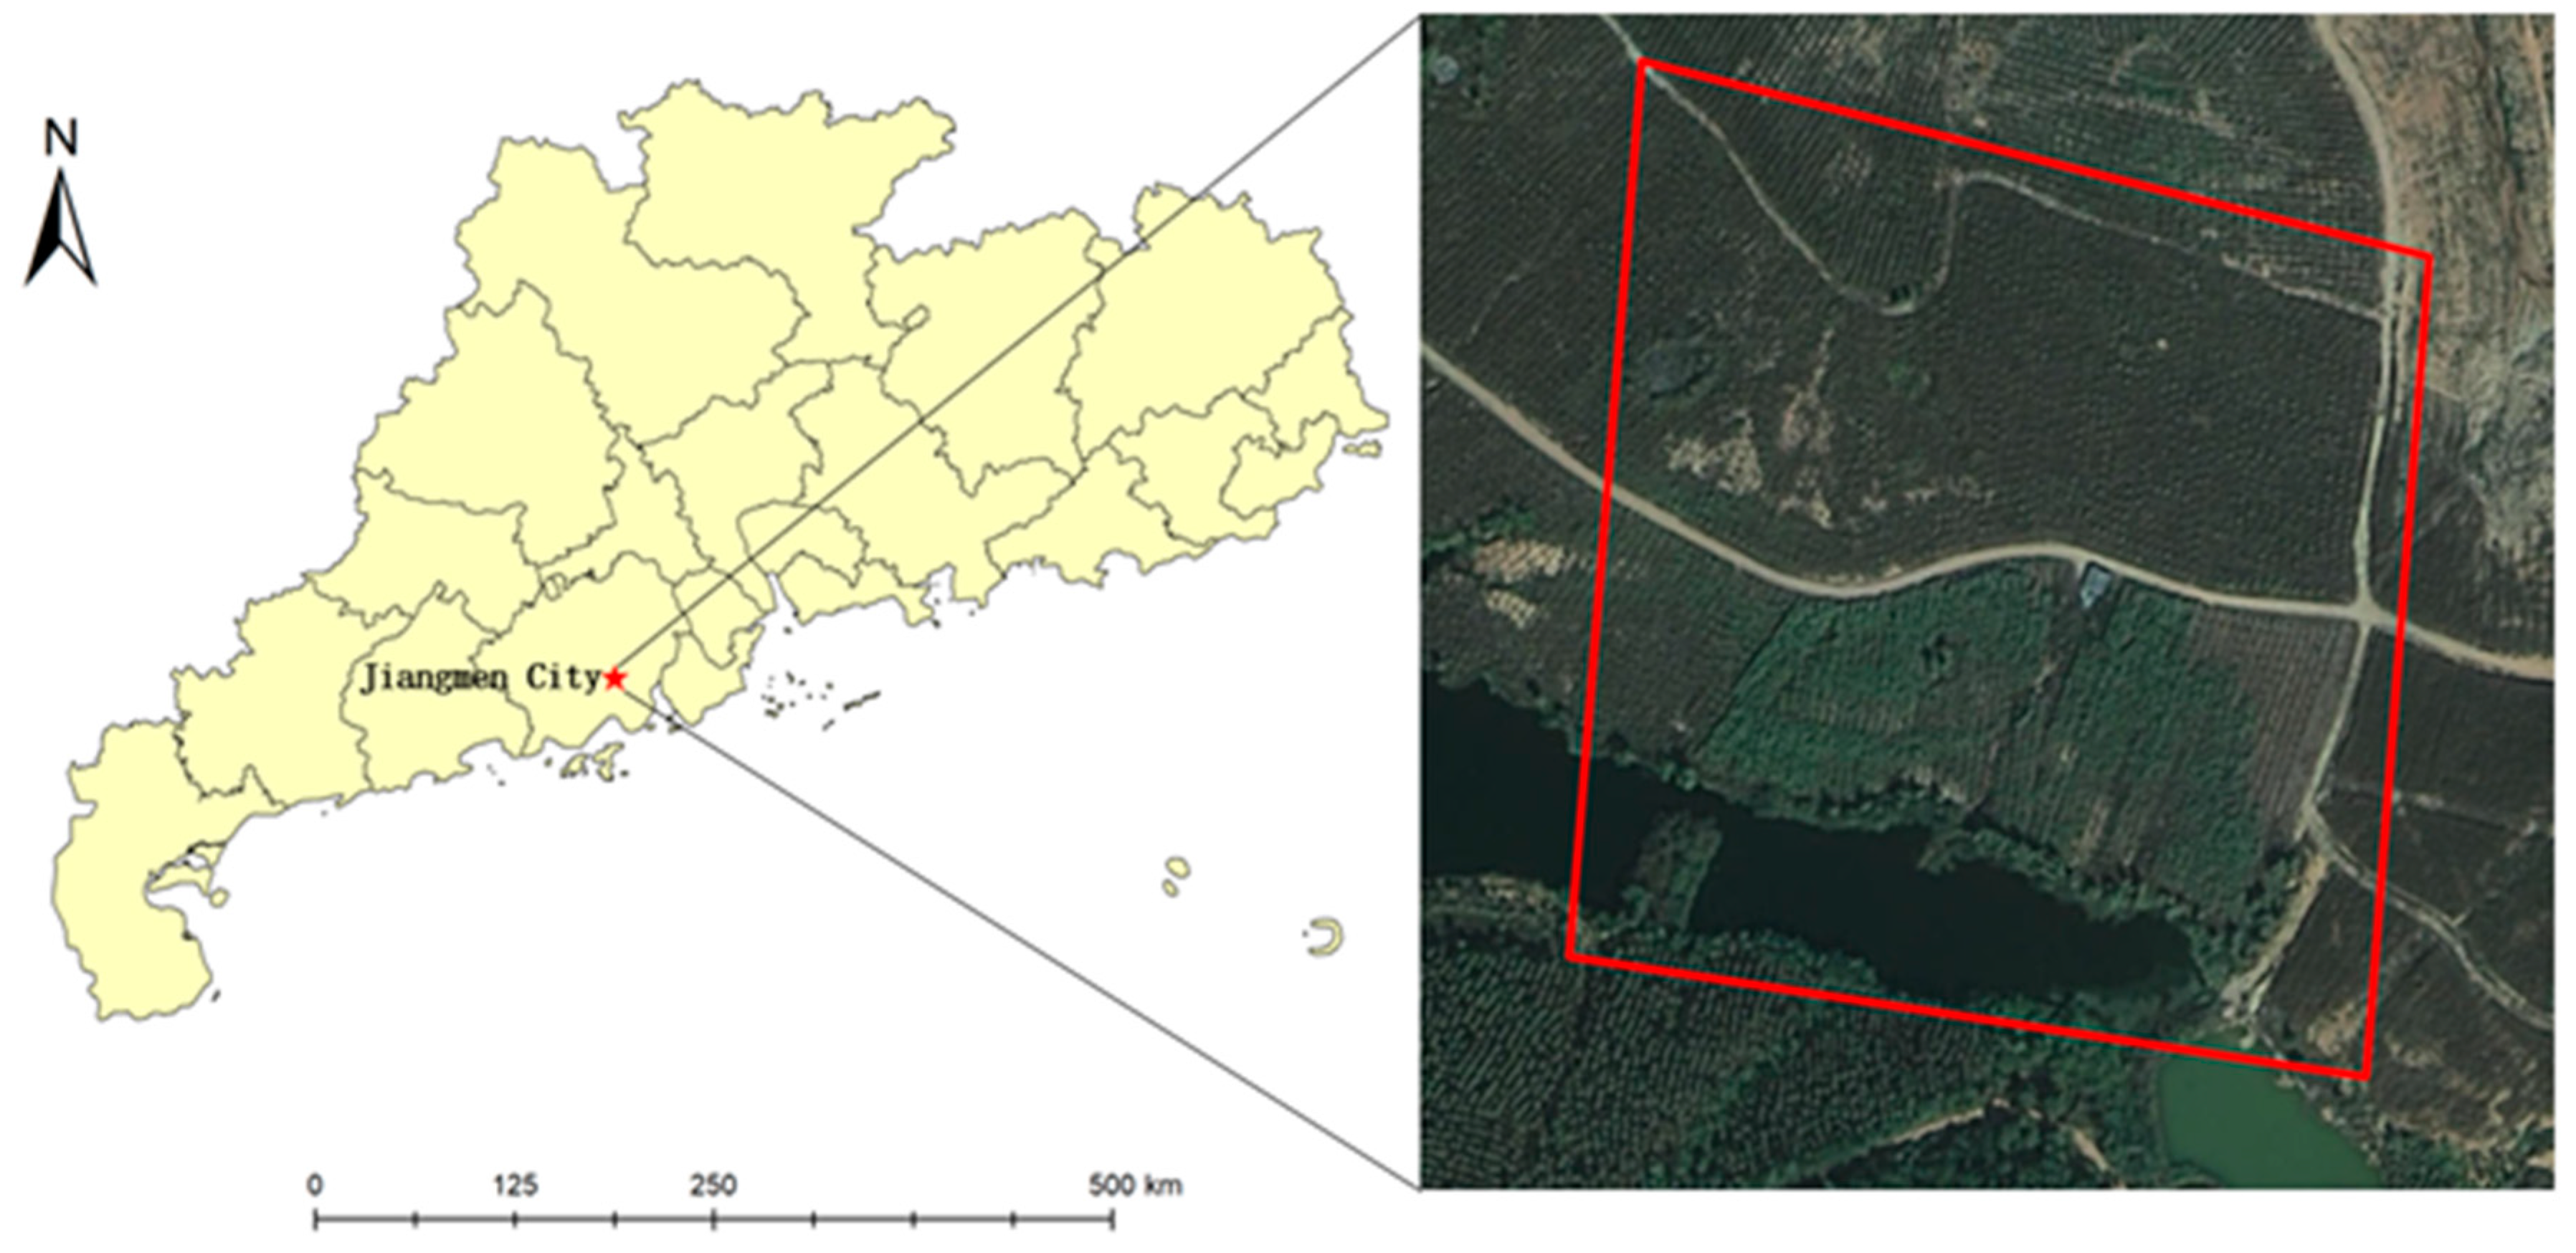
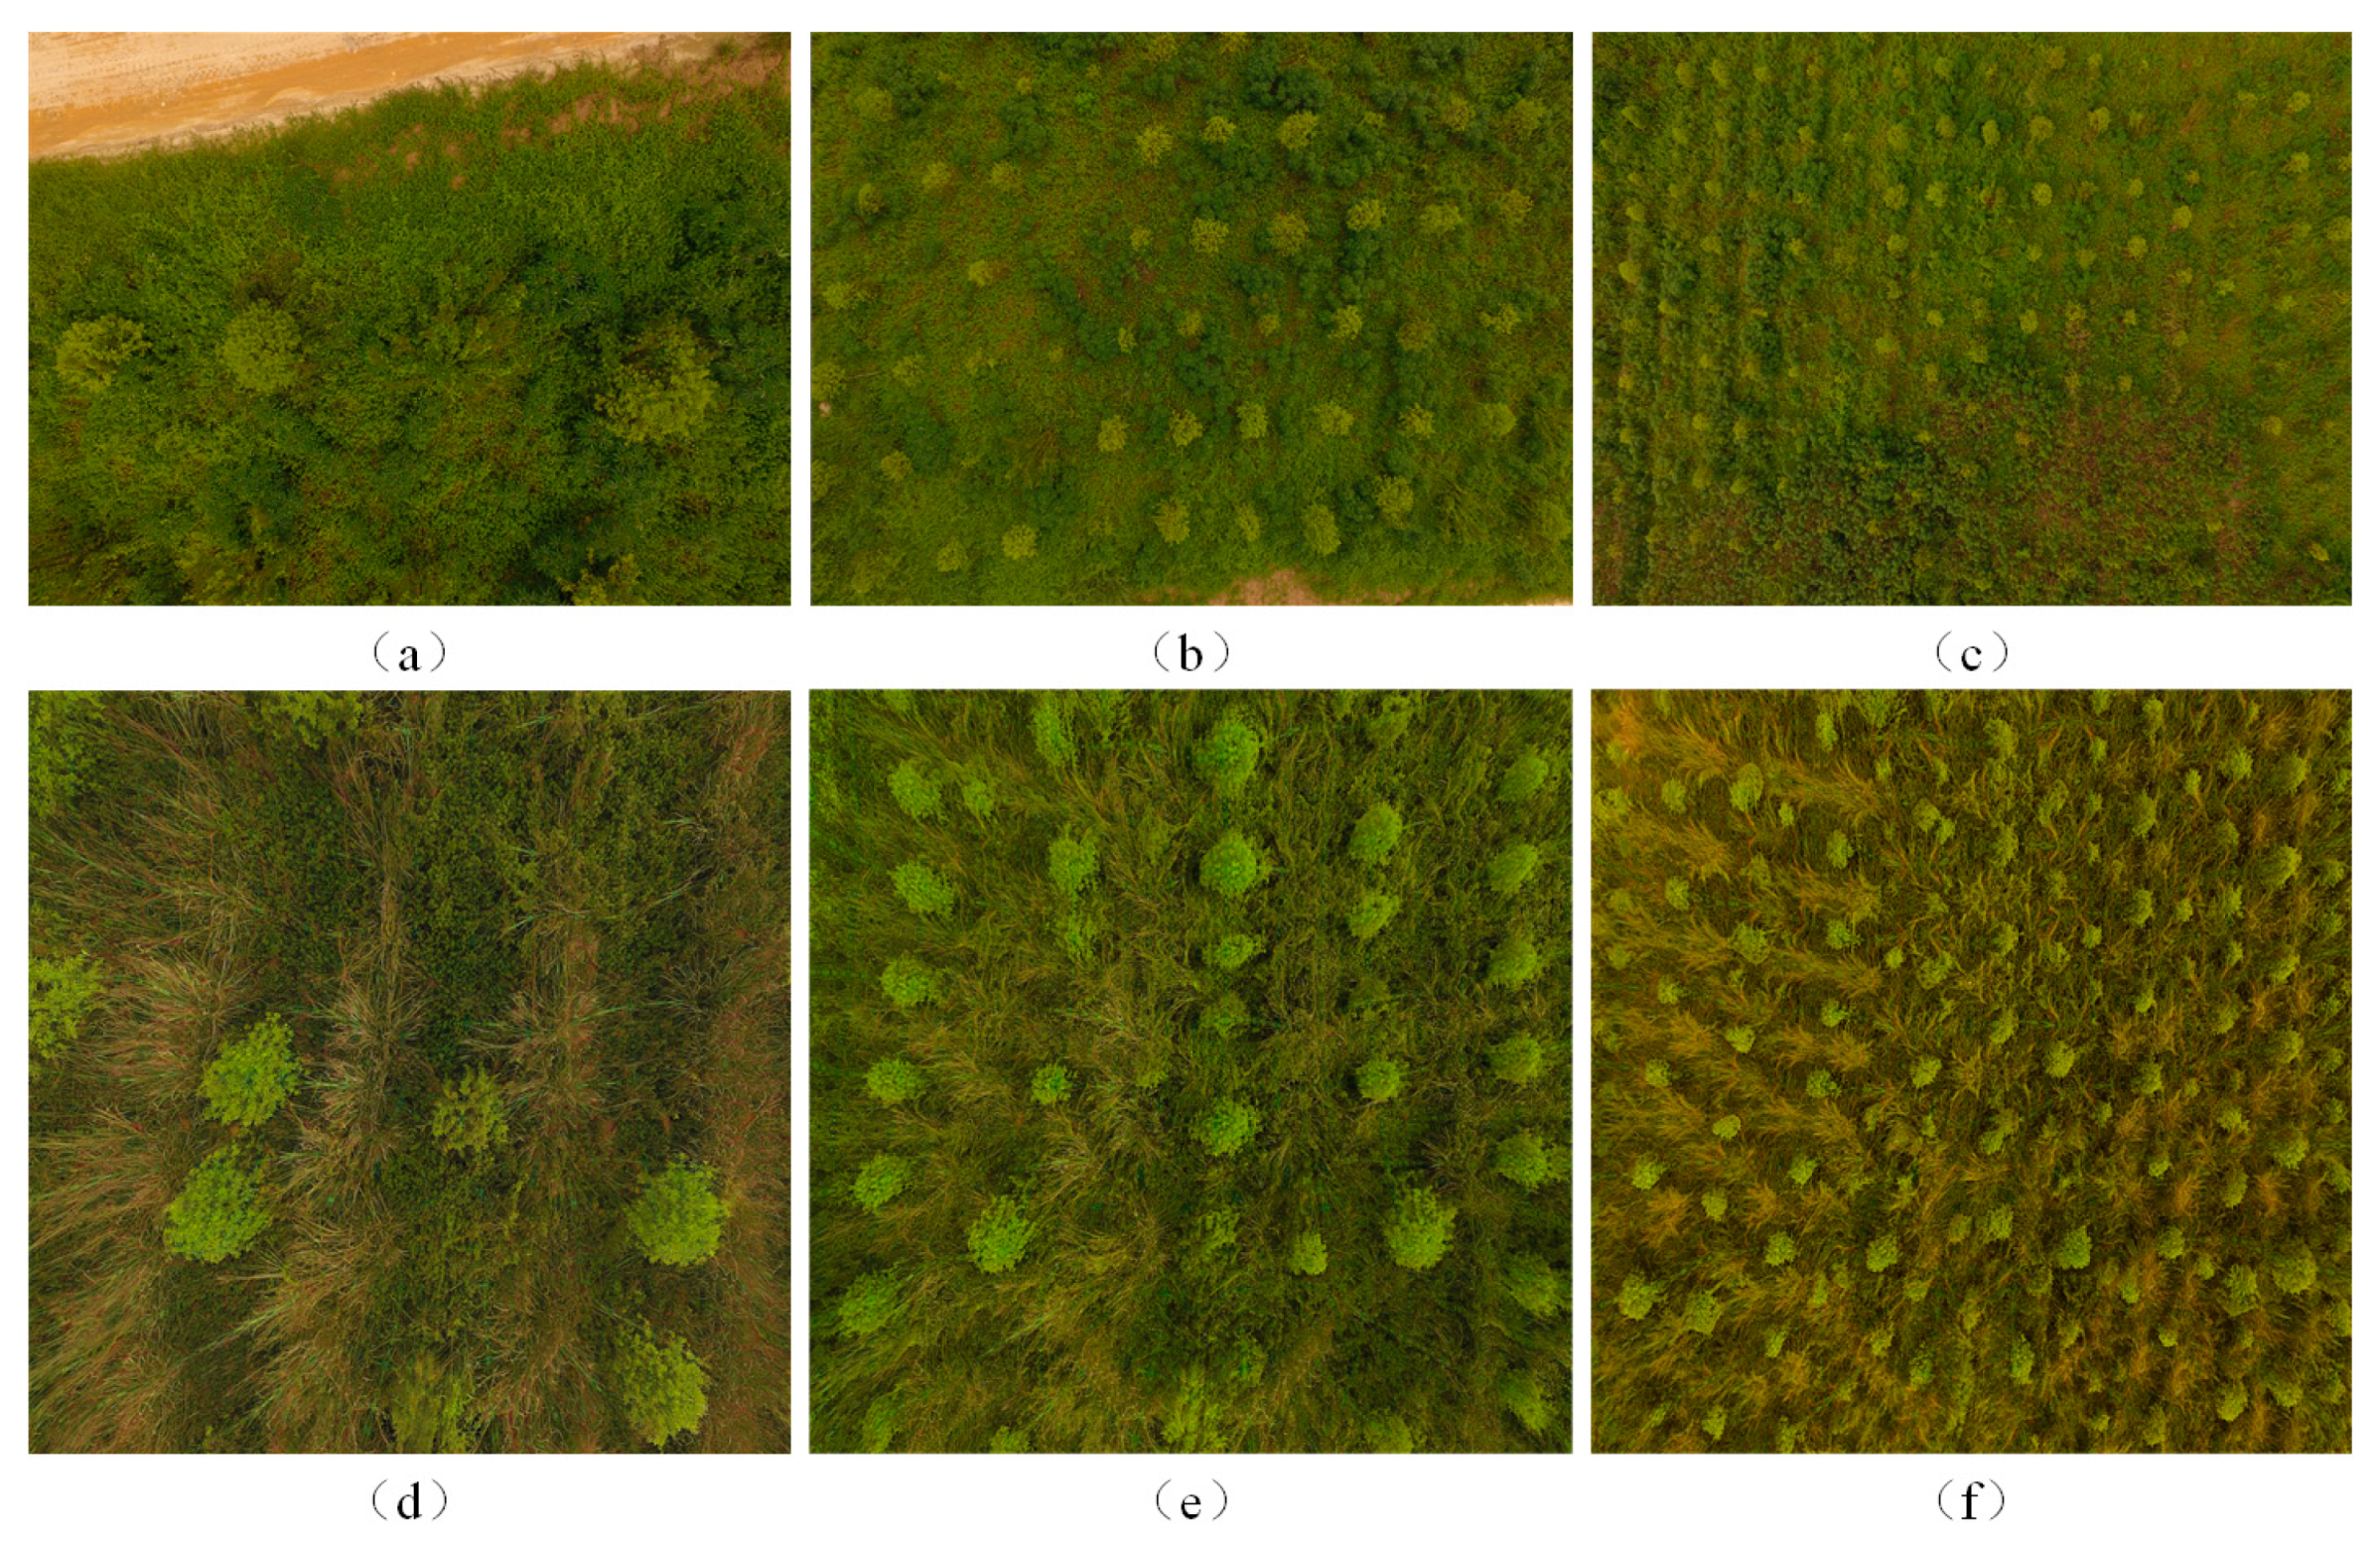
2.1.1. Data Collection

The study area is located in the sandalwood plantation of Baisha Town, Taishan County, Jiangmen City, Guangdong Province, China (center coordinates: 112.84° N, 22.14° E, as illustrated in Figure 1). Data collection was conducted from 9:00 a.m. to 6:00 p.m. on 29 September 2020. The unmanned aerial vehicle (UAV) used for data acquisition was the DJI Phantom 4 (DJI, Shenzhen, China) equipped with a DJIFC330 sensor. During aerial photography, the gimbal was set to capture images vertically to the ground, with the flight parameters configured to maintain a fixed lateral overlap of 80%. The photography altitudes were set at 10 m, 20 m, and 30 m, and each image had dimensions of 4000 × 3000 pixels. The red box delineates the experimental area, with the aerial coverage extending slightly beyond the trial zone. In total, 1051 remote sensing images were acquired, consisting of 696 images captured at a 10 m altitude, 155 images at a 20 m altitude, and 200 images at a 30 m altitude.

2.1.2. Dataset Construction

Visual interpretation was employed to screen the data, resulting in a total of 557 remote sensing samples, encompassing 6235 sandalwood trees. A total of 497 samples were randomly selected for the original training set, and the remaining 60 were used for the testing set. To improve the imbalance of the samples at different flight altitudes, the original training set was augmented with StyleGAN with 625 augmented samples and an augmented sample size of 1024 × 1024 pixels. All samples were labeled using the Labelimg tool (Version 1.8.6) in the Pascal VOC dataset format with the label “sandalwood” and the rectangular box coordinates of the sandalwood tree and the label information.
The specific quantitative distribution of the dataset is shown in Table 1, and some of the samples are shown in Figure 2.

2.2. Research Methodology

StyleGAN Data Augmentation

GANs comprise two neural networks: the generator ( G ) and the discriminator ( D ). The generator is responsible for transforming input random variables z to produce generated samples G ( z ) that closely resemble the distribution of real samples. The discriminator assesses input samples x and produces a score D ( x ) between 0 and 1. This score signifies the probability that the input sample was originated from real data. A score closer to 1 indicates a higher likelihood that the sample came from real data, while a score closer to 0 indicates a higher likelihood that the sample was generated by the G . The optimization process of a GAN can be mathematically expressed as follows:
min G max D V D , G =   E x ~ P data   x log D x +   E Z ~ P noise   z log 1 D G z
where E ( * ) represents the expectation value of the loss function, P data   x denotes the distribution of samples sourced from real data, P noise   z is random noise, D ( * ) signifies the result of samples after mapping through D , and G ( * ) represents the result after mapping through the generator network G . During training, G and D operate alternately, learning through mutual competition, and their respective parameters are updated via backpropagation.
Since the inception of GANs, researchers have proposed numerous derivative variants. Among them, StyleGAN employs a progressively trained approach from low to high resolutions, which is not only conducive to generating high-resolution images but also enhances image details. The structure of the StyleGAN network is illustrated in Figure 3.
StyleGAN primarily focuses on improving the generator component. In contrast to traditional generators that directly input random vectors into the synthesis network, StyleGAN takes an innovative approach. It first encodes random vectors into latent variables through a mapping network. These latent variables are then operated upon by Adaptive Instance Normalization (AdaIN) within the synthesis network. This mechanism enables style control over the generated images and enhances image quality. Simultaneously, within the synthesis network, StyleGAN introduces the noise of corresponding scales after each convolution, leading to diverse image generation [27]. In this study, StyleGAN is used to augment data to correct the sample imbalance from different UAV flight altitudes, with lower altitudes having more images. This imbalance can lead to overfitting and reduced model generalizability, impacting detection accuracy. Specifically, this augmentation aims to balance the sample quantities for 20 m and 30 m sandalwood samples.

2.3. Improved Lightweight Sandalwood Detection Algorithm

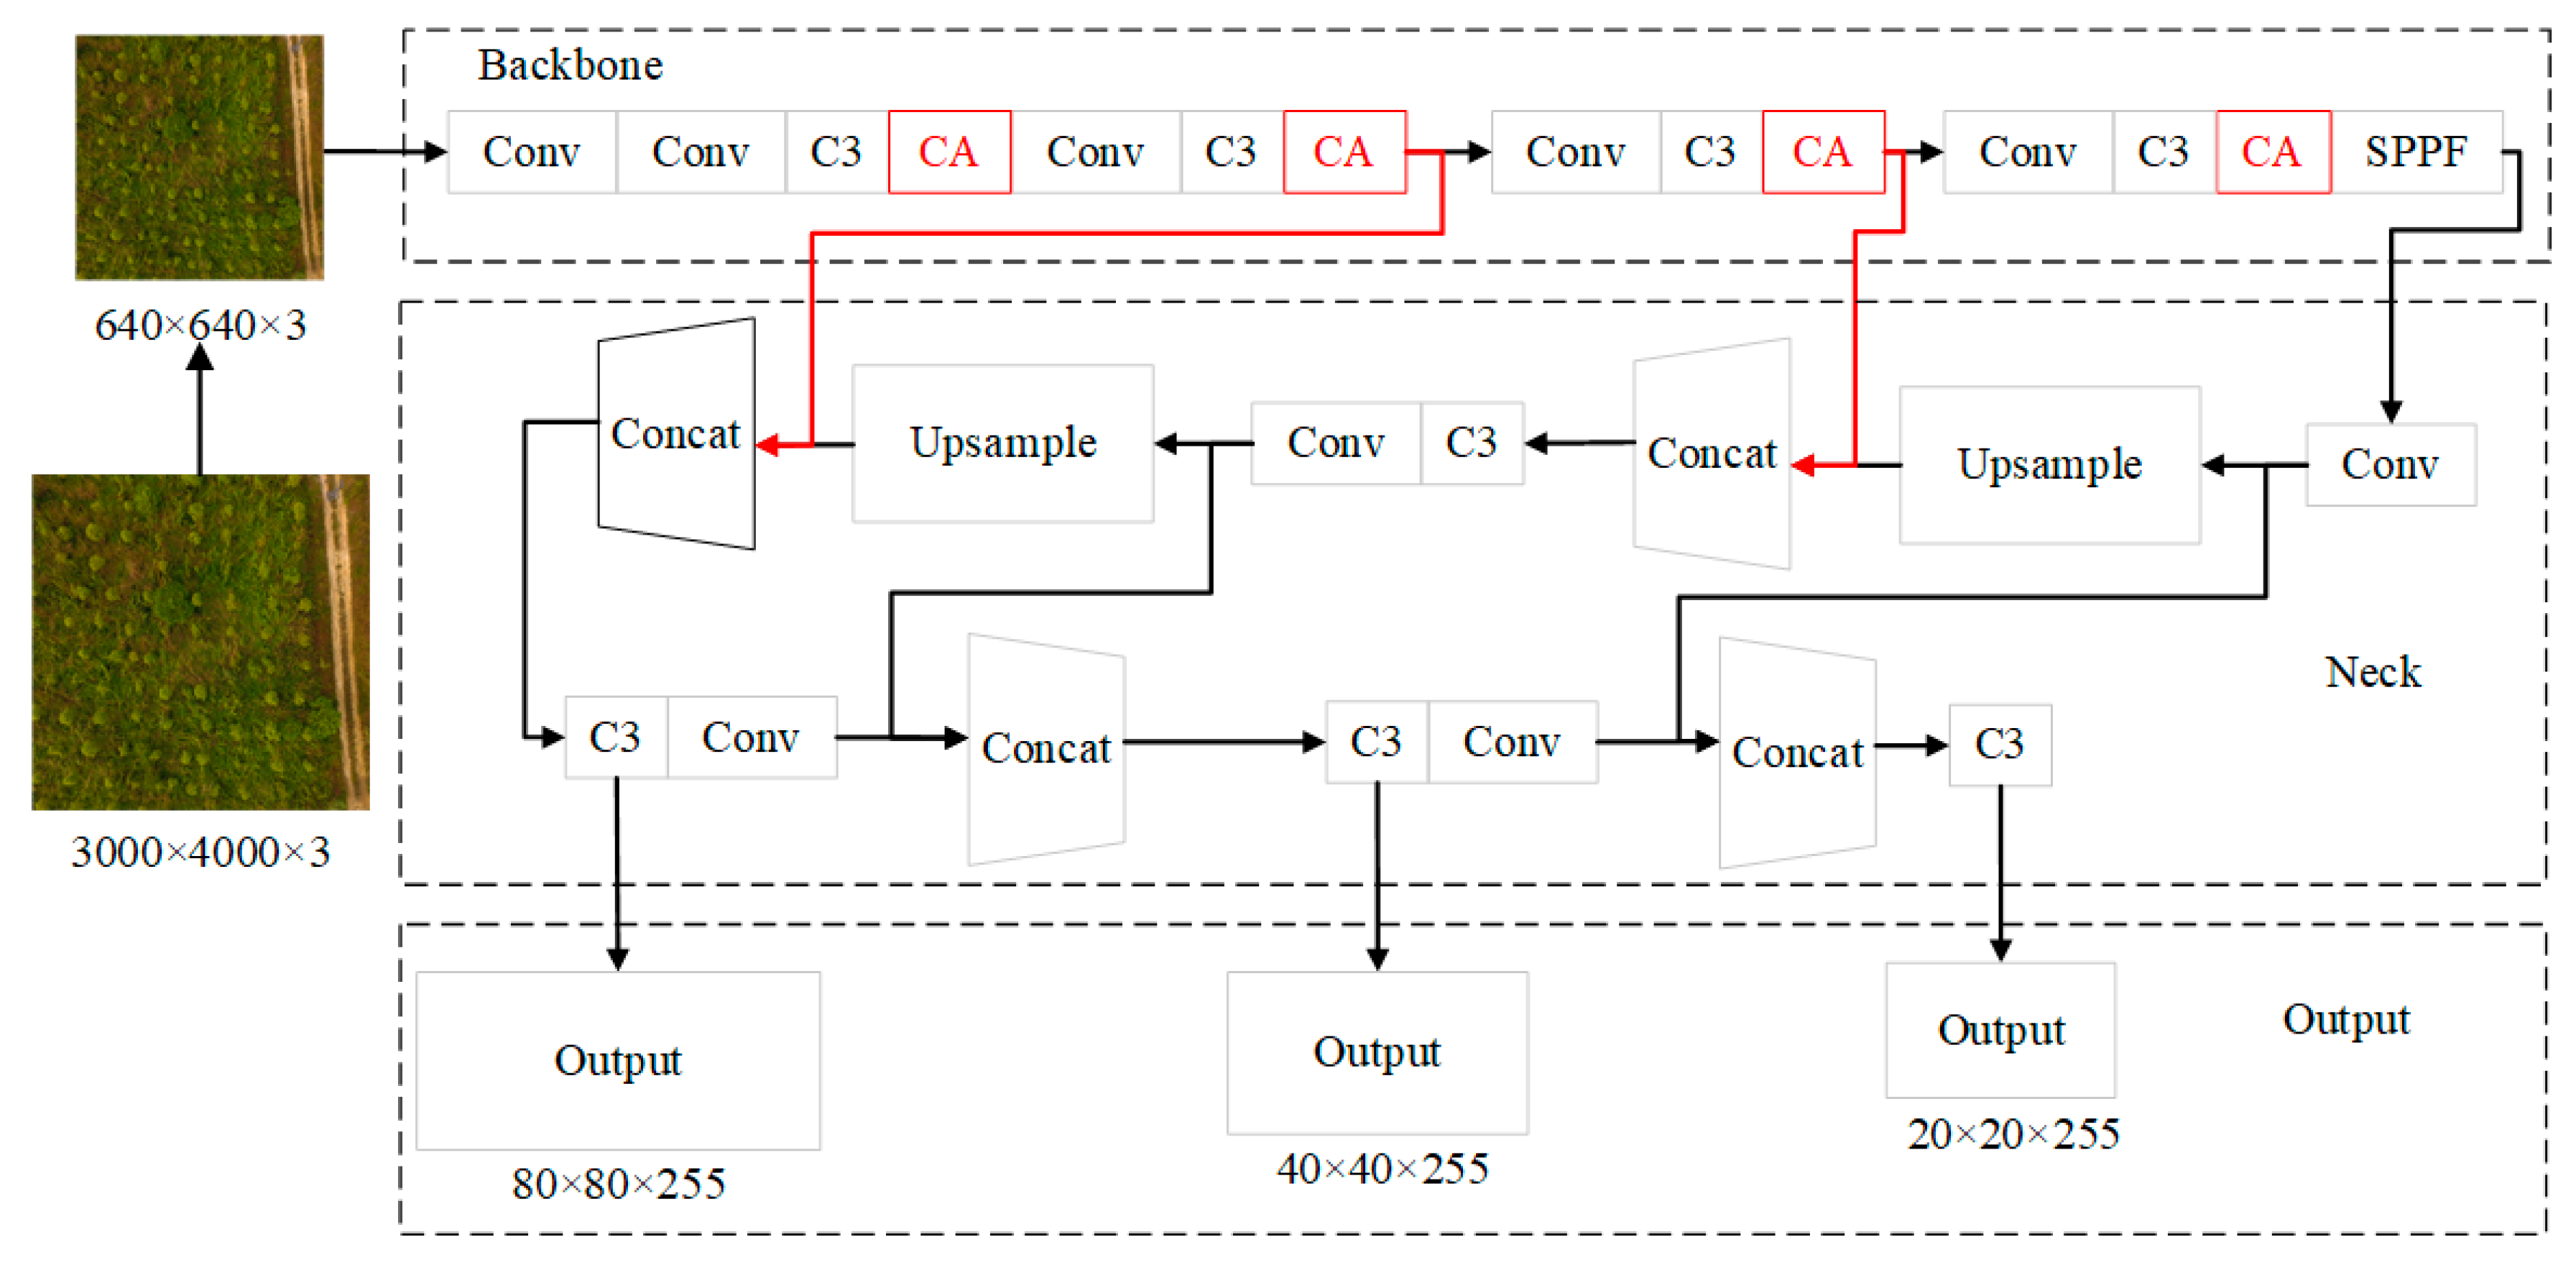
2.3.1. YOLOv5s Object Detection Model

In recent years, the YOLO (you only look once) series of single-stage object detection algorithms have evolved through iterations and optimizations, with YOLOv5 standing out as one of the high-performance real-time object detection models. The YOLOv5 algorithm offers five network models: YOLOv5nano, YOLOv5s, YOLOv5m, YOLOv5l, and YOLOv5x. Considering the balance between operational efficiency and detection accuracy, this study adopts YOLOv5s as the sandalwood detection model.
The architecture of YOLOv5s comprises three main components: a backbone, neck, and output head. The backbone is responsible for feature extraction, utilizing C3 modules with residual structures to prevent gradient vanishing and enhance the acquisition of fine-grained features. The neck section employs both up- and downsampling techniques to strengthen feature fusion within the network, preserving richer feature information from the lower layers. The output head employs the network’s extracted features to make predictions. The detailed network structure of YOLOv5s is illustrated in Figure 4.

2.3.2. Introduction of CA Module

The coordinate attention (CA) module is an innovative lightweight attention mechanism that embeds spatial coordinate information into channel attention. This allows the network to gather broader area information with minimal additional computational cost, thus improving the precision of detection in lightweight models [28].
The CA module consists of two operations: embedding coordinate information and generating coordinate attention. In the first step, the input feature map with dimensions of C × H × W (where C is the channel count or the number of feature layers, and H and W are the feature map’s height and width) is subjected to horizontal and vertical pooling, resulting in feature maps Z h and Z w with dimensions of C × H × 1 and C × 1 × W , respectively. The average pixel value of each feature layer in the feature map is computed as follows:
Z c h ( h ) = 1 W 0 i < W x c ( h ,   i ) ,   Z c w ( w ) = 1 H 0 i < H x c ( j ,   w )
where x c ( h ,   i ) and x c ( j ,   w ) represent the pixel values at coordinates ( h ,   i ) and ( j ,   w ) , respectively, for the c-th channel’s feature layer. Z c h h and Z c w ( w ) represent the average pixel value at the ( h , 1 ) and ( 1 ,   w ) positions, respectively, for the pooled feature layers of the c-th channel.
In the second step, the feature maps Z h and Z w are concatenated and fused to capture coordinate information. A nonlinear activation function enhances feature expression capability, yielding an intermediate feature map f with dimensions of C × ( W + H ) × 1 . f is then split along the horizontal and vertical directions into two independent tensors, f h and f w , each with dimensions of C × H × 1 and C × 1 × W , respectively. Finally, f h and f w undergo individual transformations using two 1 × 1 convolutions, denoted as F h and F w , followed by Sigmoid activation to yield attention weights in the horizontal and vertical directions. The equations are as follows:
f = δ F 1 Z h ,   Z w
g h = σ F h f h ,   g w = σ ( F w ( f w ) )
where F 1 ( [ * , * ] ) represents the fusion operation, δ ( * ) is a nonlinear activation function, and σ ( * ) is the Sigmoid activation function.
As illustrated in Figure 4, this study introduces the CA module after the C3 module in the YOLOv5s backbone network. This inclusion enables the network to focus on channel relationships while preserving spatial coordinate information. Consequently, the network’s feature perception is enhanced, improving the detection performance of small target sandalwood trees and reducing false negatives.

2.3.3. Improved Boundary Box Regression Loss Function

The loss function for object detection tasks consists of two components: classification loss and boundary box regression loss. The updated YOLOv5 series employs the complete intersection over union (CIOU) loss [29] as the boundary box regression loss. The expression for the C I O U l o s s is as follows:
C I O U L o s s = 1 I O U + σ c 2 + β v
where σ represents the Euclidean distance between the center points of the predicted and ground truth boxes, and c is the diagonal length of the smallest box that can encompass both the predicted and ground truth boxes. The definitions of I O U , β , and v are as follows:
IOU = B     B gt B     B gt ,   β = v 1   IOU + v ,   v = 4 π 2 tan 1 w gt h gt tan 1 w h 2
where B represents the predicted box, B gt denotes the ground truth box, and w gt and h gt represent the width and height of the ground truth box, respectively, while w and h denote the width and height of the predicted box.
Although the CIOU loss considers factors such as the distance between the predicted and ground truth boxes, overlapping area, and aspect ratios, it does not account for the mismatched orientation between the predicted and ground truth boxes. This deficiency results in a lack of directional constraints on the predicted boxes during regression, leading to training instability and adversely affecting training speed and effectiveness. This study employs the structural similarity intersection over union (SIOU) loss [30] as the boundary box regression loss. This loss introduces the angle between the vector of the predicted box’s regression in the ideal state and the ground truth box as one of the penalty terms. This allows the predicted box to regress along the optimal path, ultimately enhancing the training speed and inference accuracy. The S I O U l o s s comprises four cost functions: distance, angle, shape, and I O U . The expression is as follows:
SIOU   Loss = 1   IOU + Δ + Ω 2
Among them, the cost function expressions for distance ( Δ ), angle ( Λ ), and shape ( Ω ) are shown below:
Δ = t = x ,   y 1 e γ ρ t ,   ρ x = b c x gt b c x c w ,   ρ y = b c y gt   b c y c h ,   γ = 2   Λ
Λ = 1 2 × sin 2 arcsin x π 4 , x = c h σ = sin α
Ω = t = w ,   h 1 e ω t θ ,   ω w = w   w gt max w ,   w gt ,   ω h = h     h gt max h ,   h gt
where b and b gt denote the center points of the predicted and ground truth boxes, respectively, and b c x gt and b c y gt denote the horizontal and vertical coordinates of the ground truth box’s center. b c x and b c y are the corresponding coordinates for the predicted box. θ is an adjustable parameter used to control how much S I O U l o s s focuses on shape cost and was set to 4 in this study.

3. Results and Discussion

3.1. Experimental Platform

The operating system used for training in this study is Windows Service. The CPU model is Intel(R) Core(TM) i9-12900K, and the GPU model is NVIDIA GeForce RTX 3090 24 G. The training framework is PyTorch 1.9.0, and the CUDA 10.1 graphics acceleration library is employed. For testing, the Jetson Nano edge computing device is used with an operating system of Ubuntu 18.04. The CPU model is a 4-core A57 architecture CPU, and the GPU model is NVIDIA’s 128-core integrated GPU. The testing framework is PyTorch 1.10, with the CUDA 10.2 graphics acceleration library.

3.2. Training Settings

When training the StyleGAN model, a transfer learning approach is adopted, utilizing official face generation weights as initial weights to expedite training. The specific training parameters are as follows: the batch size is set to four images, the number of threads is set to three, the Adam optimizer is used with an initial learning rate of 0.002, the training epochs are set to 2500, and the input image size is 1024 × 1024 pixels. For the improved YOLOv5s model, the training parameters are as follows: the batch size is set to 32 images, the number of threads is set to four, the SGD optimizer is used with an initial learning rate of 0.001, the quad functionality is enabled, the training epochs are set to 300, and the input image size is 640 × 640 pixels.

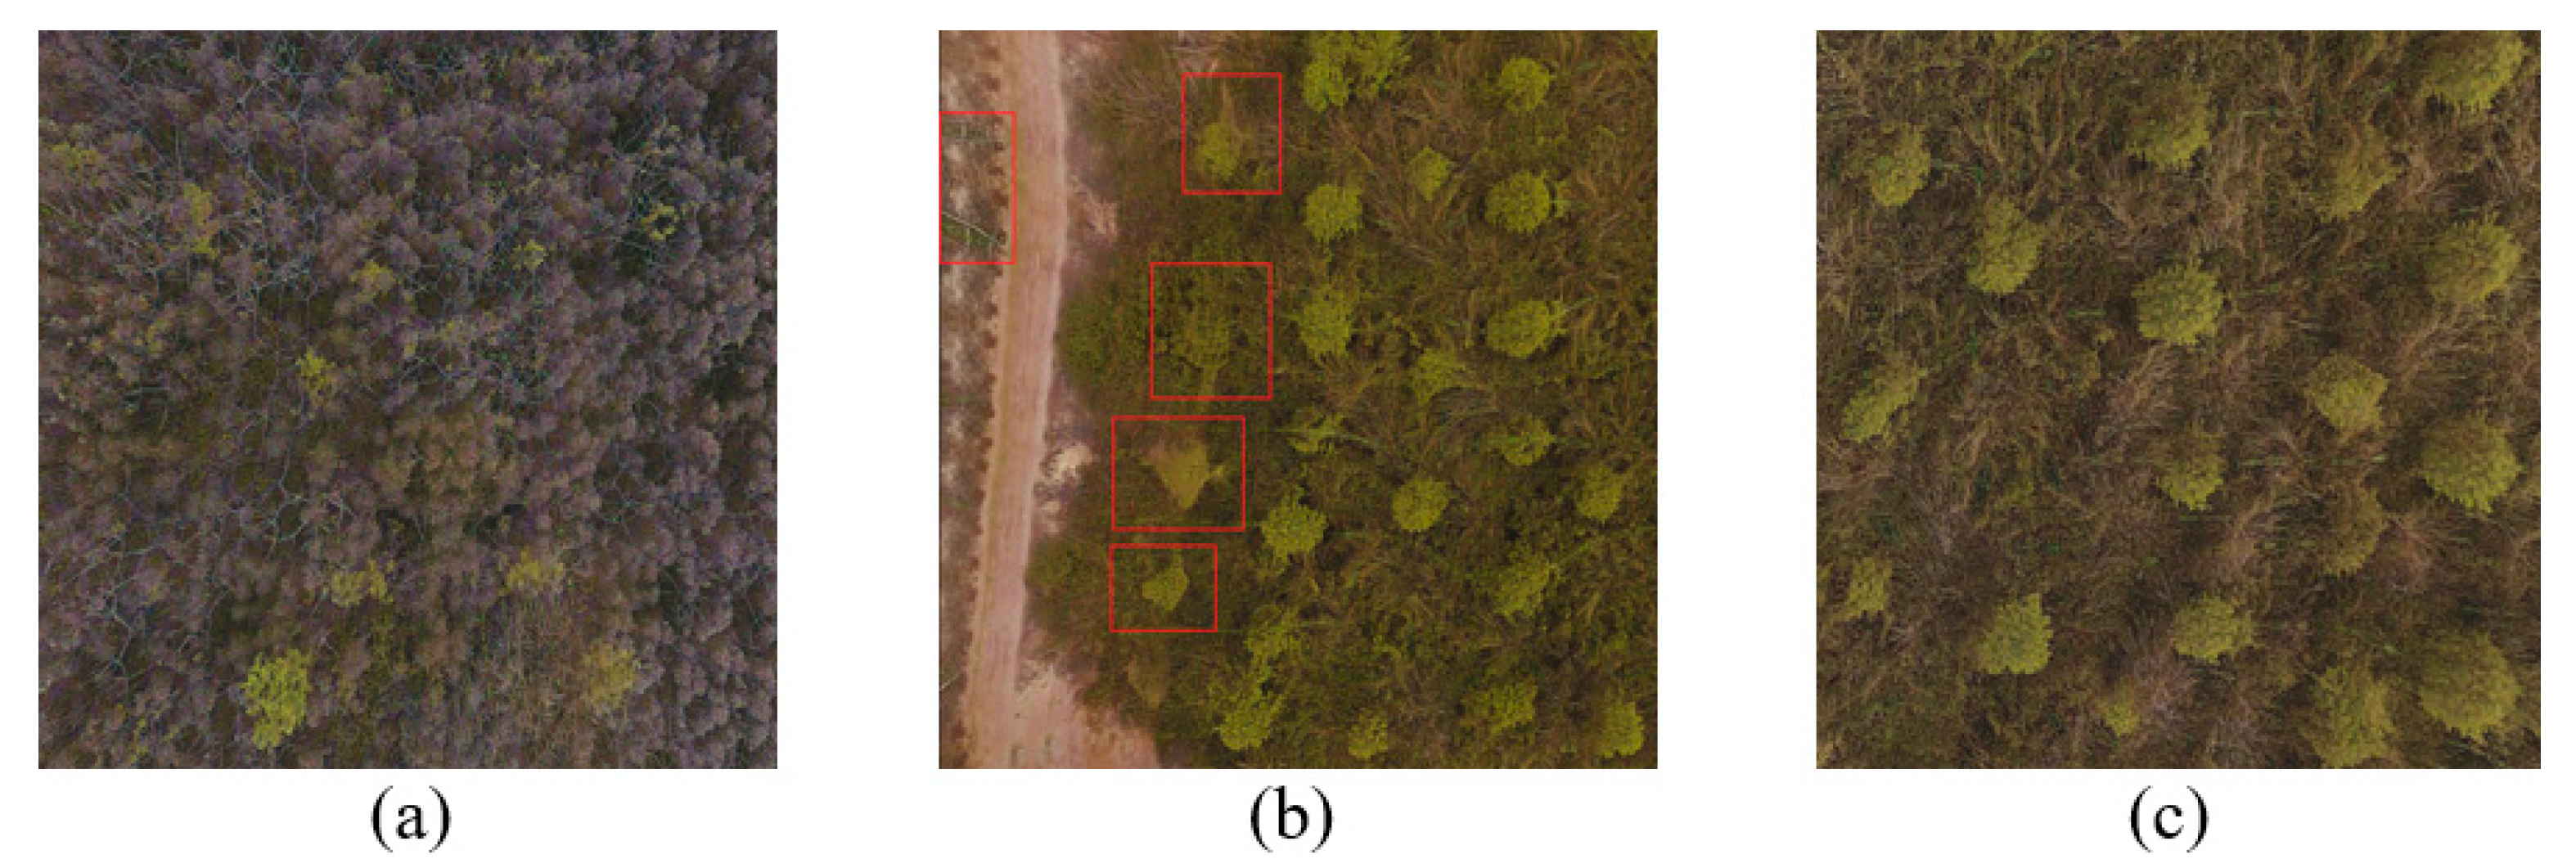
3.3. Generation of Realistic Samples

After training the StyleGAN model, different sandalwood remote sensing images can be generated by inputting various random seed numbers. Figure 5 presents examples of generated samples. It can be observed that the model does not consistently generate high-quality samples. In Figure 5a, the sandalwood trees are sparse and lack authenticity, and noticeable artifacts are present in the background, deviating significantly from reality. In Figure 5b, the sandalwood trees within the red box exhibit evident artifacts as well, manifesting in shape, color, and texture discrepancies compared with reality, along with blurred textures and a lack of details. In contrast, the sandalwood tree in Figure 5c appears more realistic in terms of texture, shape, color, and size, adhering to the standards required for training samples of sandalwood trees.

3.4. Evaluation Metrics

In alignment with operational requirements, the model’s performance is evaluated using key metrics: precision ( P ), average precision ( A P ), recall ( R ), model size, and frames per second ( F P S ).
AP assesses the overall performance, considering precision–recall trade-offs. Precision ( P ) gauges the accuracy of positive predictions, while recall ( R ) evaluates the model’s proficiency in identifying relevant instances.
Practical aspects are considered via model size, reflecting storage needs, and FPS, indicating the real-time processing speed. This thorough evaluation aims to provide a balanced assessment, encompassing predictive accuracy and practical deployment considerations.
The specific calculation formulas for P , R , and A P are as follows:
P = TP TP + FP
R = TP TP + TN
AP = 0 1 P ( R ) dR × 100 %
where T P (true positive) represents correctly detected cases with an intersection over union ( I O U ) greater than 0.5. F P (false positive) accounts for incorrectly identified cases, and FN (false negative) represents cases where sandalwood trees go undetected.

3.5. Experimental Analysis

The precision–recall (P-R) curve of our proposed method on the test set is illustrated in Figure 6. The experimental results indicate that our proposed method achieves a detection accuracy of 89.3%, a recall rate of 98%, and an average precision of 95.6% when detecting sandalwood tree targets in remote sensing images. The model size is 14.9 MB, and it processes frames at a rate of 59.8 frames per second.

3.6. Validating the Effectiveness of Strategies

To validate the effectiveness of strategies, such as StyleGAN data augmentation, CA module, and SIOU loss, in enhancing the model’s detection performance, this study conducted ablation experiments on the original sandalwood training set and the YOLOv5s model. The aforementioned strategies were sequentially applied or omitted. The usage of each strategy is indicated by “√” for applied and “-” for not applied. The same parameter configuration was used during the training process. The results are presented in Table 2.
In the table, comparing Sequences 2 and 4 with the baseline (Sequence 1), it is evident that both StyleGAN data augmentation and the S I O U l o s s function led to an increase of 1.5 percentage points in average precision without affecting the model size and FPS. When comparing Sequence 3 to Sequence 1, it can be seen that the introduction of the CA module resulted in a 3-percentage-point increase in recall and a 2-percentage-point increase in average precision. However, the model size increased by 0.3 Mb, and FPS dropped by 3.9, suggesting that the CA module introduces complexity to the network and affects detection efficiency to some extent. Lastly, Sequence 5 demonstrated a significant 2.6-percentage-point increase in average precision compared to Sequence 1 while maintaining a similar FPS and model size, showcasing the effectiveness of the proposed research approach.
These results collectively highlight the impact and effectiveness of each individual strategy employed in the study on the overall detection performance of the model.

3.7. Experimental Comparison

To demonstrate the effectiveness of the enhanced YOLOv5s model with StyleGAN data augmentation, we conducted a comparative analysis using the original sandalwood dataset. The analysis included widely used lightweight object detection models, such as YOLOv4-tiny, YOLOXs, YOLOv5-mobilenet2, and YOLOv5-ghost, all trained under the same configuration and parameters. The results, presented in Table 3, show that our approach not only retains the lightweight and fast attributes of the original YOLOv5s model but also significantly enhances accuracy in detecting sandalwood trees. This improvement gives our method a distinct advantage over the other models, demonstrating its practical significance and potential in real-world sandalwood plantation monitoring.

3.8. Discussion on Impact of Flight Altitude on Model Accuracy

To investigate the detection results at various altitudes, the original YOLOv5s model and the model proposed in this study were used to detect objects in test datasets at 10 m, 20 m, and 30 m under the same configuration and parameter settings. The results of these detections are shown in Table 4.
The results indicate that the detection accuracy of the baseline YOLOv5s model decreased with an increased flight altitude due to the lower image resolution obtained at higher altitudes. This reduction in resolution led to a loss of detail in the images of sandalwood trees, adversely affecting the accuracy of the detection model. The method proposed in this study achieved superior results at all evaluated altitudes, with a notable improvement observed at 30 m.

3.9. Methodology Discussion

An improved YOLOv5s model and improved training strategy are proposed to detect sandalwood trees, which grow in a complex multi-crop cross-cropping environment. The key features of sandalwood trees are extracted well, and a high-precision model is obtained. At the same time, the size of the improved YOLOv5s model does not change significantly, so the detection speed of the basic YOLOv5s model is maintained. In addition, a generative adversarial network—StyleGAN—is also introduced to resolve imbalanced data caused by incomplete data on sandalwood trees at certain altitudes due to potential UAV restrictions near high-voltage lines. StyleGAN can also be used to solve the problem of sample imbalance caused by other reasons.
The planting environments of most crops are simpler and typically more organized compared to those of sandalwood trees. Therefore, the algorithm proposed in this paper may obtain a detection model with higher accuracy, and it can be applied to most scale planting. However, since this research is based on sandalwood trees that are separated from each other, the detection algorithm may not effectively handle situations where trees intersect or obstruct each other. Further research on a separation strategy for cross-occluding trees needs to be carried out.

4. Conclusions

In this study, the StyleGAN data augmentation technique is combined with an enhanced YOLOv5s detection model to augment remote data at different flight altitudes, which increases accuracy by 1.5%. By improving the backbone network and loss functions, the missed detection rate of sandalwood targets is reduced, and the average accuracy is increased by 2.2%. When StyleGAN and the improvement are both introduced in the YOLOv5s detection model, the detection accuracy is improved to 2.6%. Furthermore, the final algorithm model retains the lightweight characteristics of YOLOv5s, thereby facilitating its deployment on edge devices. These devices are not only cost-effective, but also well suited for applications in agricultural and forestry settings where hardware resources are limited.

Author Contributions

Conceptualization, Y.Z.; Data Curation, J.N. and Z.H.; Funding Acquisition, F.T.; Investigation, C.P. and Y.X.; Methodology, J.N., C.P., Z.H., and Y.X.; Project Administration, Y.Z. and F.T.; Resources, Y.X.; Software, J.N.; Supervision, Y.Z., Y.X., and F.T.; Validation, J.N.; Writing—Original Draft, Y.Z. and J.N.; Writing—Review and Editing, Y.Z., C.P., and Y.X. All authors have read and agreed to the published version of the manuscript.

Funding

This research was funded by two separate projects: the Guangdong Province Enterprise Science and Technology Commissioner Project (GDKTP20210557700) and the Natural Science Foundation of Guangdong Province (2022A1515012015).

Institutional Review Board Statement

This study did not require ethical approval.

Data Availability Statement

The relevant code and test data for this study are available at https://github.com/SCAU-qihang/santlum, accessed on 6 March 2024.

Conflicts of Interest

The authors declare no conflicts of interest.

References

  1. Kumar, A.A.; Joshi, G.; Ram, H.M. Sandalwood: History, Uses, Present Status and the Future. Curr. Sci. 2012, 103, 1408–1416. [Google Scholar]
  2. Das, S.C. Silviculture, Growth and Yield of Sandalwood. In Sandalwood: Silviculture, Conservation and Applications; Springer: Singapore, 2021; pp. 111–138. [Google Scholar]
  3. Liu, X.J.; Xu, D.P.; Zhang, N.N.; Xie, Z.S.; Chen, H.F. Effect of Pot Host Configuration on the Growth of Indian Sandalwood (Santalum album) Seedings in South China. For. Res. 2010, 23, 924–927. [Google Scholar] [CrossRef]
  4. Zhang, Y.; Xu, H.; Niu, J.; Tu, S.; Zhao, W. Missing Seedling Localization Method for Sandalwood Trees in Complex Environment Based on YOLOv4 and Double Regression Strategy. Trans. Chin. Soc. Agric. Mach. 2022, 53, 299–305. [Google Scholar] [CrossRef]
  5. Liu, X.; Xu, D.; Yang, Z.; Zhang, N. Effects of Plant Growth Regulators on Growth, Heartwood Formation and Oil Composition of Young Santalum Album. Sci. Silvae Sin. 2013, 49, 143–149. [Google Scholar]
  6. Yu, X.; Hyyppä, J.; Litkey, P.; Kaartinen, H.; Vastaranta, M.; Holopainen, M. Single-Sensor Solution to Tree Species Classification Using Multispectral Airborne Laser Scanning. Remote Sens. 2017, 9, 108. [Google Scholar] [CrossRef]
  7. Lin, Z.; Ding, Q.; Tu, W.; Lin, J.; Liu, J.; Huang, Y. Vegetation Type Recognition Based on Multivariate HoG and Aerial Image Captured by UAV. J. For. Environ. 2018, 38, 444. [Google Scholar]
  8. Hu, G.; Yin, C.; Zhang, Y.; Fang, Y.; Zhu, Y. Identification of diseased pine trees by fusion convolutional neural network and Adaboost algorithm. J. Anhui Univ. (Nat. Sci. Ed.) 2019, 43, 44–53. [Google Scholar] [CrossRef]
  9. Navarro, A.; Young, M.; Allan, B.; Carnell, P.; Macreadie, P.; Ierodiaconou, D. The Application of Unmanned Aerial Vehicles (UAVs) to Estimate above-Ground Biomass of Mangrove Ecosystems. Remote Sens. Environ. 2020, 242, 111747. [Google Scholar] [CrossRef]
  10. Girshick, R.; Donahue, J.; Darrell, T.; Malik, J. Rich Feature Hierarchies for Accurate Object Detection and Semantic Segmentation. In Proceedings of the IEEE Conference on Computer Vision and Pattern Recognition, Columbus, OH, USA, 23–28 June 2014; pp. 580–587. [Google Scholar]
  11. Girshick, R. Fast R-CNN. In Proceedings of the IEEE International Conference on Computer Vision, Santiago, Chile, 7–13 December 2015; pp. 1440–1448. [Google Scholar]
  12. Ren, S.; He, K.; Girshick, R.; Sun, J. Faster R-Cnn: Towards Real-Time Object Detection with Region Proposal Networks. Adv. Neural Inf. Process. Syst. 2015, 28, 91–99. [Google Scholar] [CrossRef]
  13. Zhu, X.; Ma, H.; Ji, J.; Jin, X.; Zhao, K.; Zhang, K. Detecting and Identifying Blueberry Canopy Fruits Based on Faster R-CNN. J. South. Agric. 2020, 51, 1493–1501. [Google Scholar]
  14. Sun, J.; He, X.; Ge, X.; Wu, X.; Shen, J.; Song, Y. Detection of Key Organs in Tomato Based on Deep Migration Learning in a Complex Background. Agriculture 2018, 8, 196. [Google Scholar] [CrossRef]
  15. Liu, W.; Anguelov, D.; Erhan, D.; Szegedy, C.; Reed, S.; Fu, C.-Y.; Berg, A.C. Ssd: Single Shot Multibox Detector. In Proceedings of the Computer Vision–ECCV 2016: 14th European Conference, Amsterdam, The Netherlands, 11–14 October 2016; Proceedings, Part I 14. Springer: Berlin/Heidelberg, Germany, 2016; pp. 21–37. [Google Scholar]
  16. Jocher, G.; Chaurasia, A.; Stoken, A.; Borovec, J.; Kwon, Y.; Fang, J.; Michael, K.; Montes, D.; Nadar, J.; Skalski, P.; et al. Ultralytics/Yolov5: V6. 1-TensorRT, TensorFlow Edge TPU and OpenVINO Export and Inference. Zenodo 2022. [Google Scholar] [CrossRef]
  17. Jin, Y.; Xu, M.; Zheng, J. A Dead Tree Detection Algorithm Based on Improved YOLOv4-Tiny for UAV Images. Remote Sens. Nat. Resour. 2023, 35, 90. [Google Scholar]
  18. Lin, Y.; Chen, T.; Liu, S.; Cai, Y.; Shi, H.; Zheng, D.; Lan, Y.; Yue, X.; Zhang, L. Quick and Accurate Monitoring Peanut Seedlings Emergence Rate through UAV Video and Deep Learning. Comput. Electron. Agric. 2022, 197, 106938. [Google Scholar] [CrossRef]
  19. Wu, T.; Zhang, Q.; Wu, J.; Liu, Q.; Su, J.; Li, H. An Improved YOLOv5s Model for Effectively Predict Sugarcane Seed Replenishment Positions Verified by a Field Re-Seeding Robot. Comput. Electron. Agric. 2023, 214, 108280. [Google Scholar] [CrossRef]
  20. Perez, L.; Wang, J. The Effectiveness of Data Augmentation in Image Classification Using Deep Learning. arXiv 2017, arXiv:171204621. [Google Scholar]
  21. Cubuk, E.D.; Zoph, B.; Mane, D.; Vasudevan, V.; Le, Q.V. Autoaugment: Learning Augmentation Strategies from Data. In Proceedings of the IEEE/CVF Conference on Computer Vision and Pattern Recognition, Long Beach, CA, USA, 15–20 June 2019; pp. 113–123. [Google Scholar]
  22. Choi, J.; Kim, T.; Kim, C. Self-Ensembling with Gan-Based Data Augmentation for Domain Adaptation in Semantic Segmentation. In Proceedings of the IEEE/CVF International Conference on Computer Vision, Long Beach, CA, USA, 15–20 June 2019; pp. 6830–6840. [Google Scholar]
  23. Tian, Y.; Yang, G.; Wang, Z.; Li, E.; Liang, Z. Detection of Apple Lesions in Orchards Based on Deep Learning Methods of Cyclegan and Yolov3-Dense. J. Sens. 2019, 2019, 7630926. [Google Scholar] [CrossRef]
  24. Wang, C.; Xiao, Z. Lychee Surface Defect Detection Based on Deep Convolutional Neural Networks with Gan-Based Data Augmentation. Agronomy 2021, 11, 1500. [Google Scholar] [CrossRef]
  25. Zeng, M.; Gao, H.; Wan, L. Few-Shot Grape Leaf Diseases Classification Based on Generative Adversarial Network. IOP Publ. 2021, 1883, 012093. [Google Scholar] [CrossRef]
  26. Das, S.C. Cultivation of Sandalwood Under Agro-Forestry System. In Sandalwood: Silviculture, Conservation and Applications; Springer: Singapore, 2021; pp. 139–162. [Google Scholar]
  27. Karras, T.; Aittala, M.; Laine, S.; Härkönen, E.; Hellsten, J.; Lehtinen, J.; Aila, T. Alias-Free Generative Adversarial Networks. Adv. Neural Inf. Process. Syst. 2021, 34, 852–863. [Google Scholar]
  28. Hou, Q.; Zhou, D.; Feng, J. Coordinate Attention for Efficient Mobile Network Design. In Proceedings of the IEEE/CVF Conference on Computer Vision and Pattern Recognition, Nashville, TN, USA, 20–25 June 2021; pp. 13713–13722. [Google Scholar]
  29. Zheng, Z.; Wang, P.; Liu, W.; Li, J.; Ye, R.; Ren, D. Distance-IoU Loss: Faster and Better Learning for Bounding Box Regression. In Proceedings of the AAAI Conference on Artificial Intelligence, New York, NY, USA, 7–12 February 2020; Volume 34, pp. 12993–13000. [Google Scholar]
  30. Gevorgyan, Z. SIoU Loss: More Powerful Learning for Bounding Box Regression. arXiv 2022, arXiv:220512740. [Google Scholar]
Figure 1. Experimental area.
Agriculture 14 00452 g001
Figure 2. Sample images. (ac) are samples taken at altitudes of 10 m, 20 m, and 30 m, respectively; (df) are images generated by StyleGAN at the same altitudes of 10 m, 20 m, and 30 m.
Agriculture 14 00452 g002
Figure 3. The architecture of the StyleGAN network.
Agriculture 14 00452 g003
Figure 4. The architecture of the YOLOv5s network. The red color in the figure indicates the sections that have been improved.
Agriculture 14 00452 g004
Figure 5. Samples generated by StyleGAN. (a,b) depict generated images of lower quality; (c) demonstrates a higher quality generated image. The red boxes in the figure indicates the sections that low quality image of san-dalwood trees.
Agriculture 14 00452 g005
Figure 6. P-R curves.
Agriculture 14 00452 g006
Table 1. Sandalwood dataset.
Type10 m20 m30 mTotal
Original training samples29512082497
Generated samples30290305625
Final training samples4254103871122
Testing samples20202060
Table 2. Ablation experiments.
StyleGANCASIOUP/(%)R/(%)AP/(%)Memory Size/(Mb)FPS
1---94.095.093.014.162.8
2--86.298.094.514.162.1
3--88.998.095.014.458.9
4--89.097.094.514.161.3
590.199.095.614.556.8
Table 3. Results of mainstream algorithms.
Network ModelP/(%)R/(%)AP/(%)FPS
YOLOv4-tiny85.292.288.748.9
YOLOXs85.989.792.073.5
YOLOv5s94.095.093.062.8
YOLOv5-mobilenet285.997.093.364.5
YOLOv5-ghost86.294.892.763.1
GAN-YOLOv5s-CA-SIOU90.199.095.656.8
Table 4. Detection accuracies at different altitudes.
Network Model10 m (AP/%)20 m (AP/%)30 m (AP/%)
YOLOv5s95.193.690.2
GAN-YOLOv5s-CA-SIOU97.394.195.3
Disclaimer/Publisher’s Note: The statements, opinions and data contained in all publications are solely those of the individual author(s) and contributor(s) and not of MDPI and/or the editor(s). MDPI and/or the editor(s) disclaim responsibility for any injury to people or property resulting from any ideas, methods, instructions or products referred to in the content.

