Article

Unveiling Drought-Tolerant Corn Hybrids for Early-Season Drought Resilience Using Morpho-Physiological Traits

by
Charles Hunt Walne
1,
Naflath Thenveettil
1,
Purushothaman Ramamoorthy
2,
Raju Bheemanahalli
1,
Krishna N. Reddy
3 and
Kambham Raja Reddy
1,*
1
Department of Plant and Soil Sciences, Mississippi State University, 117 Dorman Hall, Box 9555, Mississippi State, MS 39762, USA
2
Geosystems Research Institute, Mississippi State University, Starkville, MS 39762, USA
3
USDA-ARS, Crop Production Systems Research Unit, 141 Experiment Station Road, P.O. Box 350, Stoneville, MS 38776, USA
*
Author to whom correspondence should be addressed.
Agriculture 2024, 14(3), 425; https://doi.org/10.3390/agriculture14030425
Submission received: 18 January 2024 / Revised: 15 February 2024 / Accepted: 1 March 2024 / Published: 6 March 2024
(This article belongs to the Section Crop Production)

Abstract

:
The increasing severity of drought has become a significant threat to global crop production. Early season drought in corn produces poor plant stand and grain yield. Thus, identifying corn hybrids for drought tolerance during the early season is important. Nineteen corn hybrids commonly grown in the Midsouthern US were assessed for drought tolerance using mini-hoop structures. Plants grown under non-stress conditions were exposed to three moisture levels at 100% (0.17 m3 m−3 soil; control), 66% (mild drought; DS1), and 33% (moderate drought; DS2) of the control from one to five leaf stages (V1 to V5). The physiological and morphological traits of corn hybrids were measured to assess variability in drought tolerance. When averaged across the hybrids, shoot parameters declined by 51% and 59% under DS1 and DS2 conditions, respectively, compared to the control. A decline in root traits was noticed under drought stress (38% under DS1 and 48% under DS2) compared to the control, revealing the shoot system sensitivity under drought conditions. In the principal component analysis, the first two principal components accounted for 66% of the phenotypic variation among the corn hybrids under drought stress. Total, shoot, leaf dry weights, root surface area, and root volume captured most of the phenotypic variation among the corn hybrids under drought. The results of the principal component analysis and drought stress response indices complimented the identification of ‘A6659’ and ‘D57VP51’ as drought-tolerant hybrids during the early seedling stage. These hybrids can be used as source material in developing drought-tolerant cultivars. Also, the tolerant hybrids will perform best under rainfed environments prone to early-season drought.

1. Introduction

The global climate has changed throughout history and intensified over the past 40 years [1]. Since the industrial revolution, the average surface temperature of the planet has risen by about 1 °C [1], and atmospheric carbon dioxide [CO2] has reached 50% higher than the pre-industrial level [2]. These changes increased the odds of worsening the drought in many parts of the United States and the world. In the early 21st century, various regions in the contiguous US grappled with persistent drought conditions. By 2012, these droughts had intensified into a national-scale event unprecedented in decades, with 66% of the lower 48 states in drought [3]. Presently, 32% of the US and 38% of the lower 48 states are affected by drought, with 127.3 million ha of major crops experiencing drought conditions [4]. The statistics show that 24.8% of Mississippi is affected by exceptional drought [5].
Corn is one of the most widely grown cereal crops in the US, covering 38.4 million ha with a production of 384 million tons and a yield of 10.8 tons per ha [6]. Apart from being used as a staple food, the crop is cultivated for fuel ethanol and livestock feed production. The US is the topmost producer and exporter of corn, with a value of 18.57 billion USD [7]. However, the surpassing area under drought poses a potential threat to the corn industry. Currently, 58% and 62% of the corn produced in the US and Mississippi are within areas experiencing drought [8]. This results in a reduced yield per ha due to the sensitivity of corn plants to moisture stress. Kukal and Irmak [9] reported that corn had the greatest irrigation-limited yield gap globally among the major rainfed crops, with an increase of 2.7 times in yield under irrigated conditions. During critical growth stages, moisture stress severely affects corn plant growth and development, resulting in reduced plant stand, reproductive failure, and yield [10].
Though plants are sensitive to moisture stress throughout the life cycle, the early seedling growth and development stage is the foundation for higher yield potential [11]. On average, 36% of the US corn-growing regions were affected by drought during early spring in 2022, compared to 21% during 2021 [12], revealing increased early season drought during the seedling stage. Drought conditions initiate a sequential process in plants, commencing with an early priming and pre-conditioning stage. This is succeeded by an intermediate stage of acclimation, leading to establishing a new homeostasis with reduced growth [13]. Various plant traits serve as crucial indicators of moisture stress tolerance. A successful seedling emergence with better vigor ensures optimum crop stand and yield [14]. Seedling vigor is primarily attributed to increased biomass production, which leads to rapid canopy closure, thereby preventing soil moisture evaporation and better root establishment anchoring the shoot system. These features of the plants maintain their water balance [15]. Thus, understanding the traits that influence early seedling vigor will affect the final yield.
In addition to visible morphological changes like reduced plant height and biomass, the soil moisture stress also results in cellular and tissue dehydration. As the tissue water potential declines and becomes critical, leaf wilting and premature senescence can occur [16]. Previous studies reported that reduced tissue water potential results in decreased cell expansion rates, increased stomatal closure, reduced photosynthetic rates, and greater biomass partitioning into root systems [17]. The corn plants respond to drought by closing the stomata and folding the leaves to minimize transpiration [18]. Reductions as high as 65% and 59% in stomatal conductance and transpiration rate were reported in corn under drought conditions [11]. Consequently, photosynthetic rates will drop, as will plant growth metrics like leaf area, height, and dry mass [19]. Previous studies have focused on assessing the effects of drought on corn growth and development using one to five hybrids or inbred lines varieties. However, a significant gap exists in understanding how recently developed corn hybrids perform under drought during the early seedling stage. Moreover, the relationship between root and shoot has been largely unexplored. Quantifying the relative performance of different corn hybrids and identifying drought-tolerant hybrids would complement the development of more resilient and adaptive agricultural practices.
While various federal disaster programs and crop insurance provide relief during drought, they often fall short of fully compensating farmers for their losses [20]. Most corn farmers face limited options to mitigate drought effects. However, corn is a water-intensive crop with major production under rainfed conditions; thus, finding superior hybrids with drought resilience will have an implication. The selection of hybrids depending on the early seedling growth stages not only expedites the selection process but also provides insights into the vigor of seedlings under stressful conditions. The purpose of this study was to (i) investigate how the seedlings grow and respond physiologically under mild and moderate drought conditions, (ii) evaluate how different corn hybrids respond to drought stress, and (iii) establish a correlation between the shoot, root, and physiological traits of the seedlings and the overall drought stress response index.

2. Materials and Methods

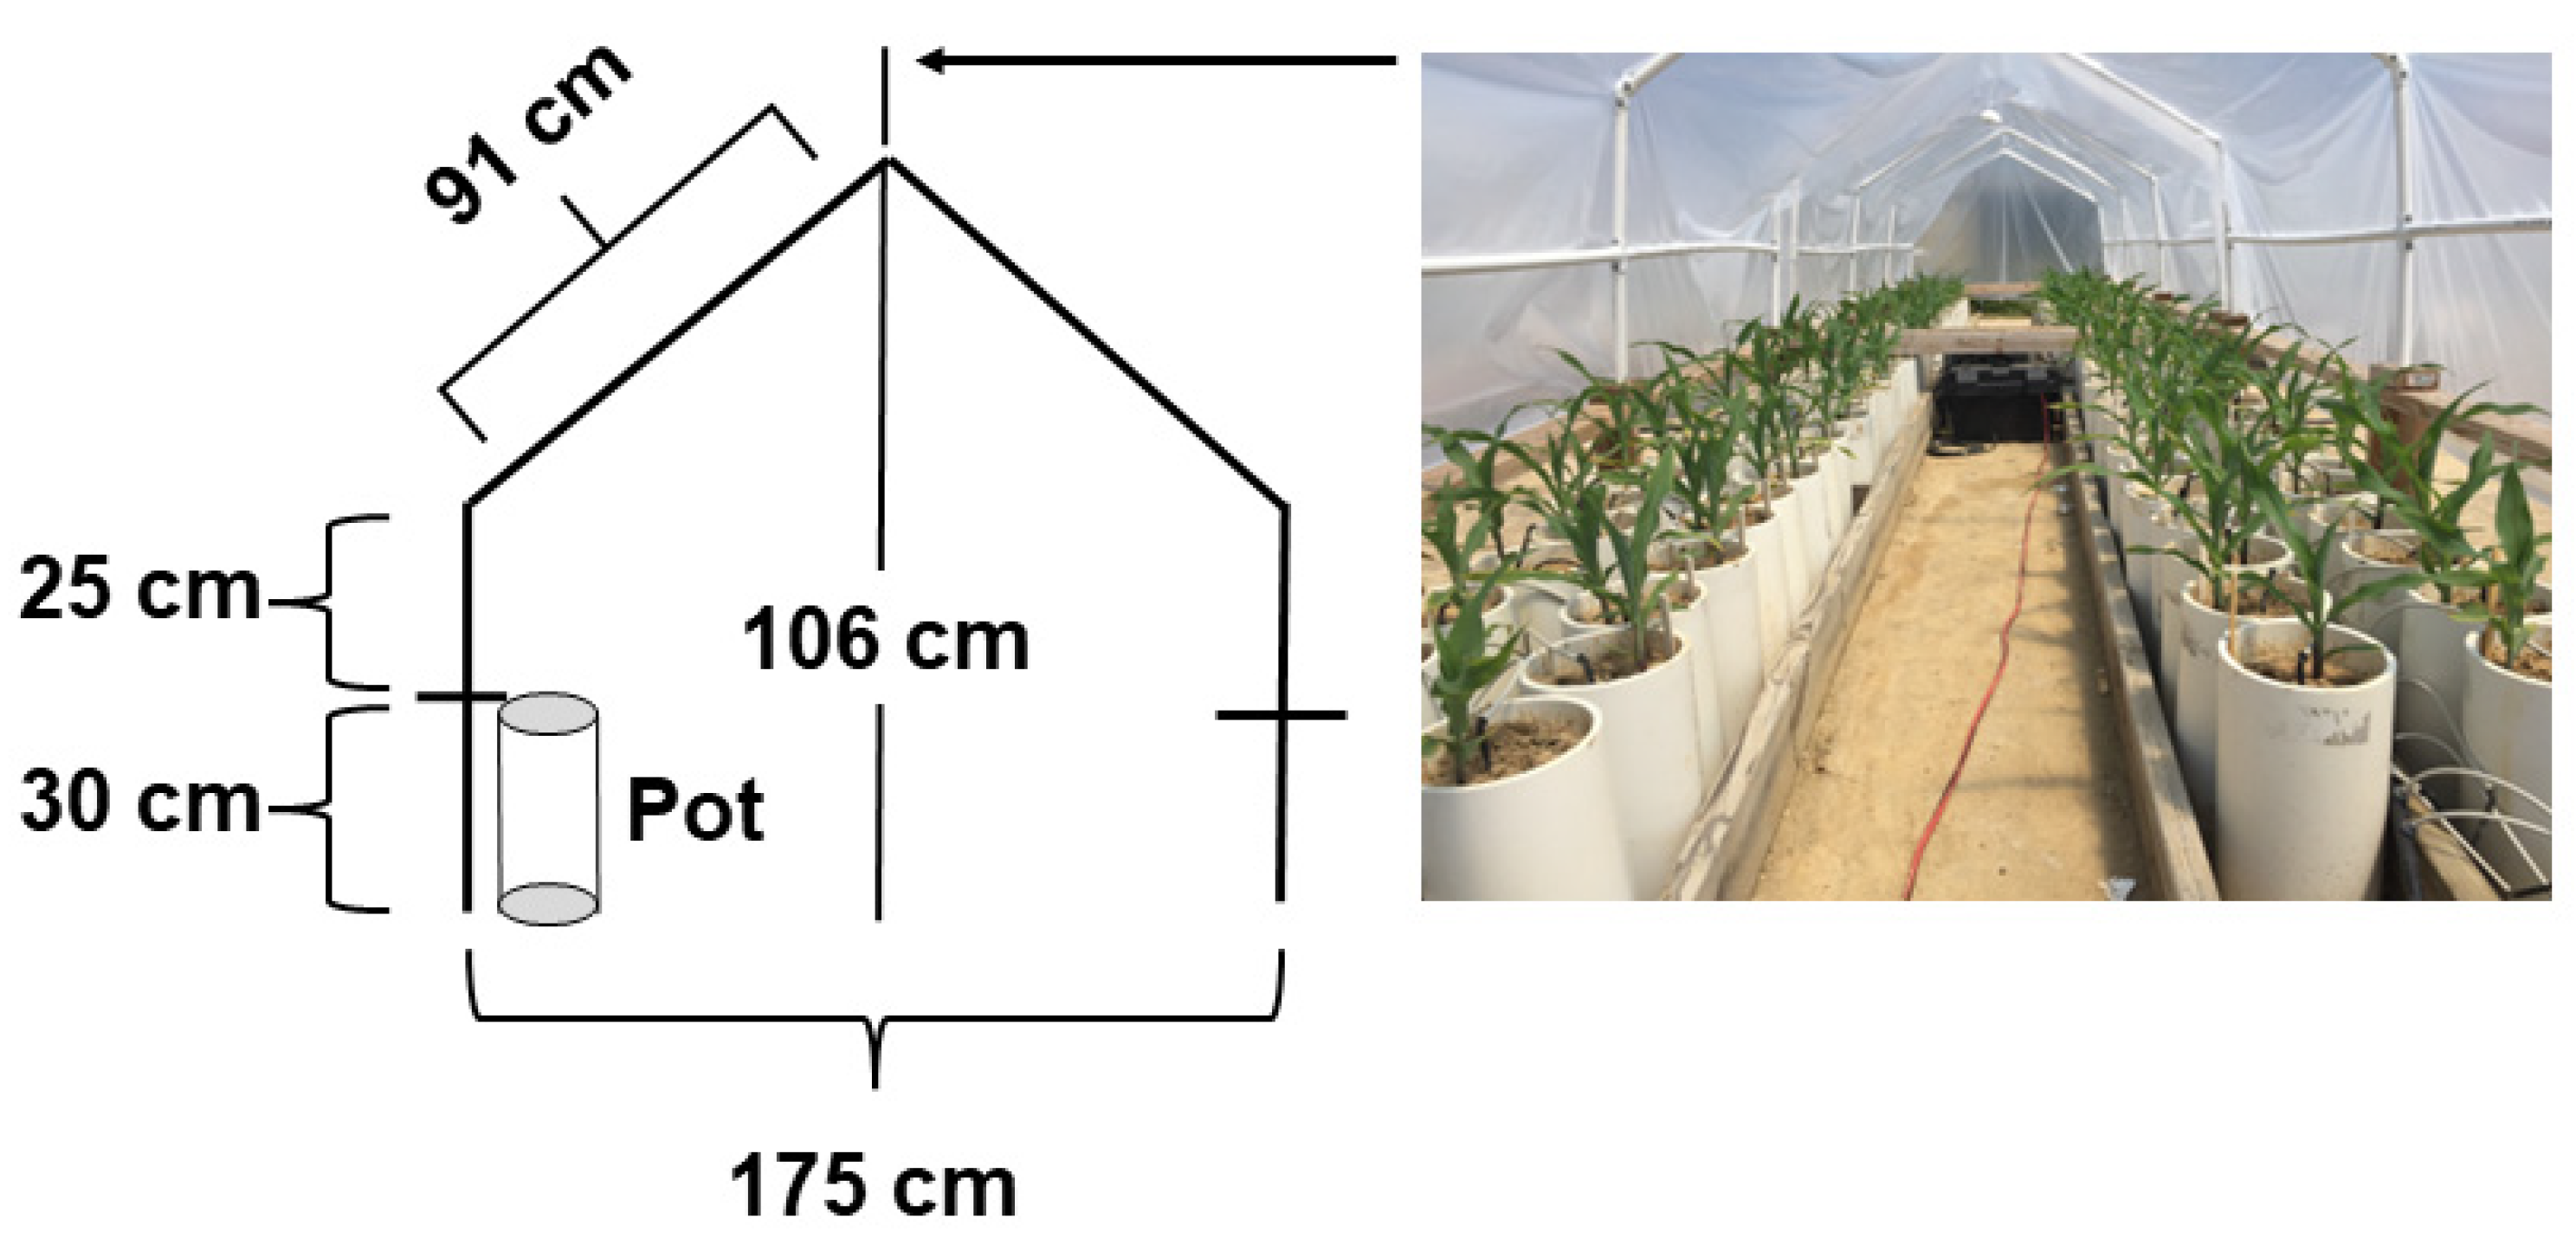
2.1. Experimental Details

The study was conducted at the Environmental Plant Physiology Laboratory, Mississippi State University, MS, USA (33.4701° N and 88.7826° W). Nineteen recently released corn hybrids, primarily grown in Mississippi State, were selected for the study, and their names and origins are presented in Table 1. The experiment was carried out using mini hoop house structures (Figure 1) [21]. Seeds were sown in polyvinylchloride pots (0.15 × 0.3 m) filled with fine sand and topsoil mix (87% sand, 2% clay, and 11% silt) at a 3:1 ratio by volume. Four seeds were sown per pot in five replications at an equal depth. Two hundred and fifty grams of gravel was placed at the bottom of each pot to facilitate adequate drainage. A total of 285 pots were used to accommodate the treatments, with one control and two levels of moisture stress treatments. The pots were arranged in a completely randomized design with 3 × 19 factorial arrangements representing 3 soil moisture treatments and 19 corn hybrids. Initially, all the pots were irrigated three times a day for 90 s per irrigation via an automated computer-controlled drip irrigation system using Hoagland’s solution [22]. The plants were thinned to one healthy seedling per pot before starting the treatment.

2.2. Drought Treatment

After the seed emergence, the seedlings were subjected to three levels of drought treatment, including a control group. The control treatment received irrigation at 100% capacity, maintaining the average soil moisture content of 0.17 m3 m−3 soil throughout the experiment. For the mild drought stress treatment (DS1), the seedlings received 66% (average soil moisture content of 0.11 m3 m−3 soil) of the irrigation provided to the control treatment. In comparison, the moderate drought stress treatment (DS2) received only 33% of the control treatment irrigation with an average soil moisture content of 0.10 m3 m−3. Five Decagon soil moisture sensor probes (ECH2O, EC-5, Decagon Devices, Inc., Pullman, WA, USA) per treatment were placed to monitor soil moisture levels accurately. Data loggers (EM5B Soil Moisture, Meter, Inc., Pullman, WA, USA) were used to monitor daily soil moisture across treatments. The mini-hoophouse was removed daily from 10.00 to 16.00 h to ensure the seedlings received adequate sunlight. The primary goal of the experiment was to investigate alterations in the early seedling root and shoot growth in response to drought treatment involving root scanning. The experiment was concluded precisely 20 days after sowing (DAS) to ensure accurate and comprehensive root scans.

2.3. Measurements

2.3.1. Physiological Parameters

The chlorophyll content (µg cm−2), flavonoid index, anthocyanin index, and nitrogen balance index (NBI) were recorded on the second uppermost fully expanded leaf using a Dualex® scientific instrument (Force A DX16641, Paris, France) at 13 days after stress treatment. The maximum quantum efficiency or yield (Fv/Fm) was also measured with the FluorPen 100 (Photon System Instruments, Brno, Czech Republic).

2.3.2. Shoot Growth Measurements

At 20 DAS, plant height (PH, cm) and leaf number (LN) measurements were taken. The leaf area was determined using a leaf area meter (LI-3100: Li-COR, Lincoln, NE, USA) on the day of harvest. Later, the plants were separated into different components like leaves, stems, and roots to take the dry weights. These components were subjected to the oven (Blue M Electric company, Blue Island, IL, USA), drying at 75 °C for five days, and leaf dry weight (LDW), stem dry weight (StDW), and root dry weight (RDW) were recorded in grams. The shoot dry weight (ShDW) was recorded by adding LDW and StDW, while the total dry weight (TDW) was computed by adding ShDW and RDW. The root-to-shoot ratio (RS) was calculated by dividing RDW with ShDW to determine the resource allocation between the roots and the shoots among hybrids.

2.3.3. Root Image Acquisition and Analysis

Across treatments, the roots from each hybrid were separated from the stem and washed thoroughly and gently on a wire mesh sieve to prevent damage to the root structure. The length of the longest root was measured with a metric ruler to assess root growth. Root samples were individually scanned using a WinRHIZO optical scanner (Regent Instruments, Inc., Quebec, QC, Canada). Initially, the roots were kept on a plexiglass tray measuring 0.3 × 0.4 m, filled with 5 mm of tap water, ensuring the roots were completely submerged. A plastic paintbrush was used to untangle and separate any overlapped roots, providing accurate imaging. The tray was placed on a specialized dual-scan optical scanner connected to a computer system. The image acquisition parameters were configured to ‘high’ resolution, set explicitly at 800 × 800 dots per inch (dpi). The acquired images were analyzed using WinRHIZO Pro software (version 2009c; Regent Instruments, Montreal, QC, Canada). This software was employed to record root surface area (RSA), root volume (RV), root tips (RTs), root forks (RFs), and root crossings (RCs). Total root length (TRL) was measured using a ruler.

2.4. Data Analysis

The experiment was conducted in a two-factorial, completely randomized design by considering corn hybrids and three distinct drought treatments as the primary source of variation. The statistical analysis of variance (ANOVA) was performed in R Studio with the ‘doebioresearch’ package [23]. The percent change was computed relative to the control to understand the impact of DS1 and DS2 on the measured parameters. Box plots were generated using Sigmaplot 13 (Systat Software Inc., San Jose, CA, USA).

2.4.1. Principal Component Analysis (PCA)

To gain deeper insights into the relationships among measured parameters, treatments, and corn hybrids, PCA was performed using fifteen morpho-physiological and biomass traits obtained across the treatments and hybrids. The analysis was carried out using R software (version 4.3.1) with the ‘FactoMineR’ package [24]. Based on the loadings of all parameters at each principal component (PC), the factor vectors were identified for each component and placed in the factor planes. A scatter plot was generated with the identified PCs to better understand each corn hybrid’s performance within these factor planes.

2.4.2. Drought Stress Response Index (DSRI)

Individual drought stress response index (IDSRI) for each morphological and physiological trait (P) was calculated for each hybrid (Pi). This index was determined by dividing the specific value observed for the trait in the given hybrid (i) by the maximum value observed across all studied hybrids (Pm; Equation (1)). The average of IDSRI from both DS1 and DS2 was used for computing the DSRI. Also, the combined shoot, root, and physiological response index was calculated using individual IDSRI for each hybrid. The physiological drought response index (PDSRI) was computed by using IDSRI from chlorophyll content, flavonoid index, anthocyanin index, NBI, and Fv/Fm (Equation (2)). The shoot drought response index (SDSRI) was determined using IDSRI from PH, LN, LA, LDW, StDW, and ShDW (Equation (3)). The root drought stress response index (RDSRI) was estimated using IDSRI from RS, TRL, RSA, RV, RT, RF, and RC (Equation (4)). To obtain the cumulative drought stress response index (CDSRI) for each hybrid, the response indices from physiological, shoot and root parameters were added (Equation (5)). This cumulative index provides a holistic assessment of drought tolerance in each corn hybrid.
I D S R I = P i P m
P D S R I = C h l o r o p h y l l i C h l o r o p h y l l m + F l a v o n o i d i F l a v o n o i d m + A n t h o c y a n i n i A n t h o c y a n i n m + N B I i N B I m + F v F m i F v F m m
S D S R I = P H i P H m + L N i L N m + L A i L A m + L D W i L D W m + S t D W i S t D W m + S h D W i S h D W m
R D S R I = R S i R S m + T R L i T R L m + R S A i R S A m + R V i R V m + R T i R T m + R F i R F m + R C i R C m
C D S R I = P D S R I + S D S R I + R D S R I

2.4.3. Parameter Relationship

To ascertain the respective contribution of shoot, root, or physiological drought stress responses to the CDSRI, a regression analysis was performed using Sigmaplot 14 (Systat Software Inc., San Jose, CA, USA). To visually represent the individual hybrid response to the drought treatments through PDSRI, SDSRI, RDSRI, and CDSRI, a bubble graph was generated using the ‘ggbiplot2’ package within R Studio [24].

3. Results

The soil moisture stress treatments were imposed in three treatment sets, with the control being irrigated with 0.17 m3 m−3 soil. At the same time, DS1 and DS2 were imposed with 66% and 33% moisture content as of the control. However, we could not achieve the desired average soil moisture content in three weeks of the experiment (Figure 2). The soil moisture content across the treatment pots significantly differed during the experiment (Table 2).

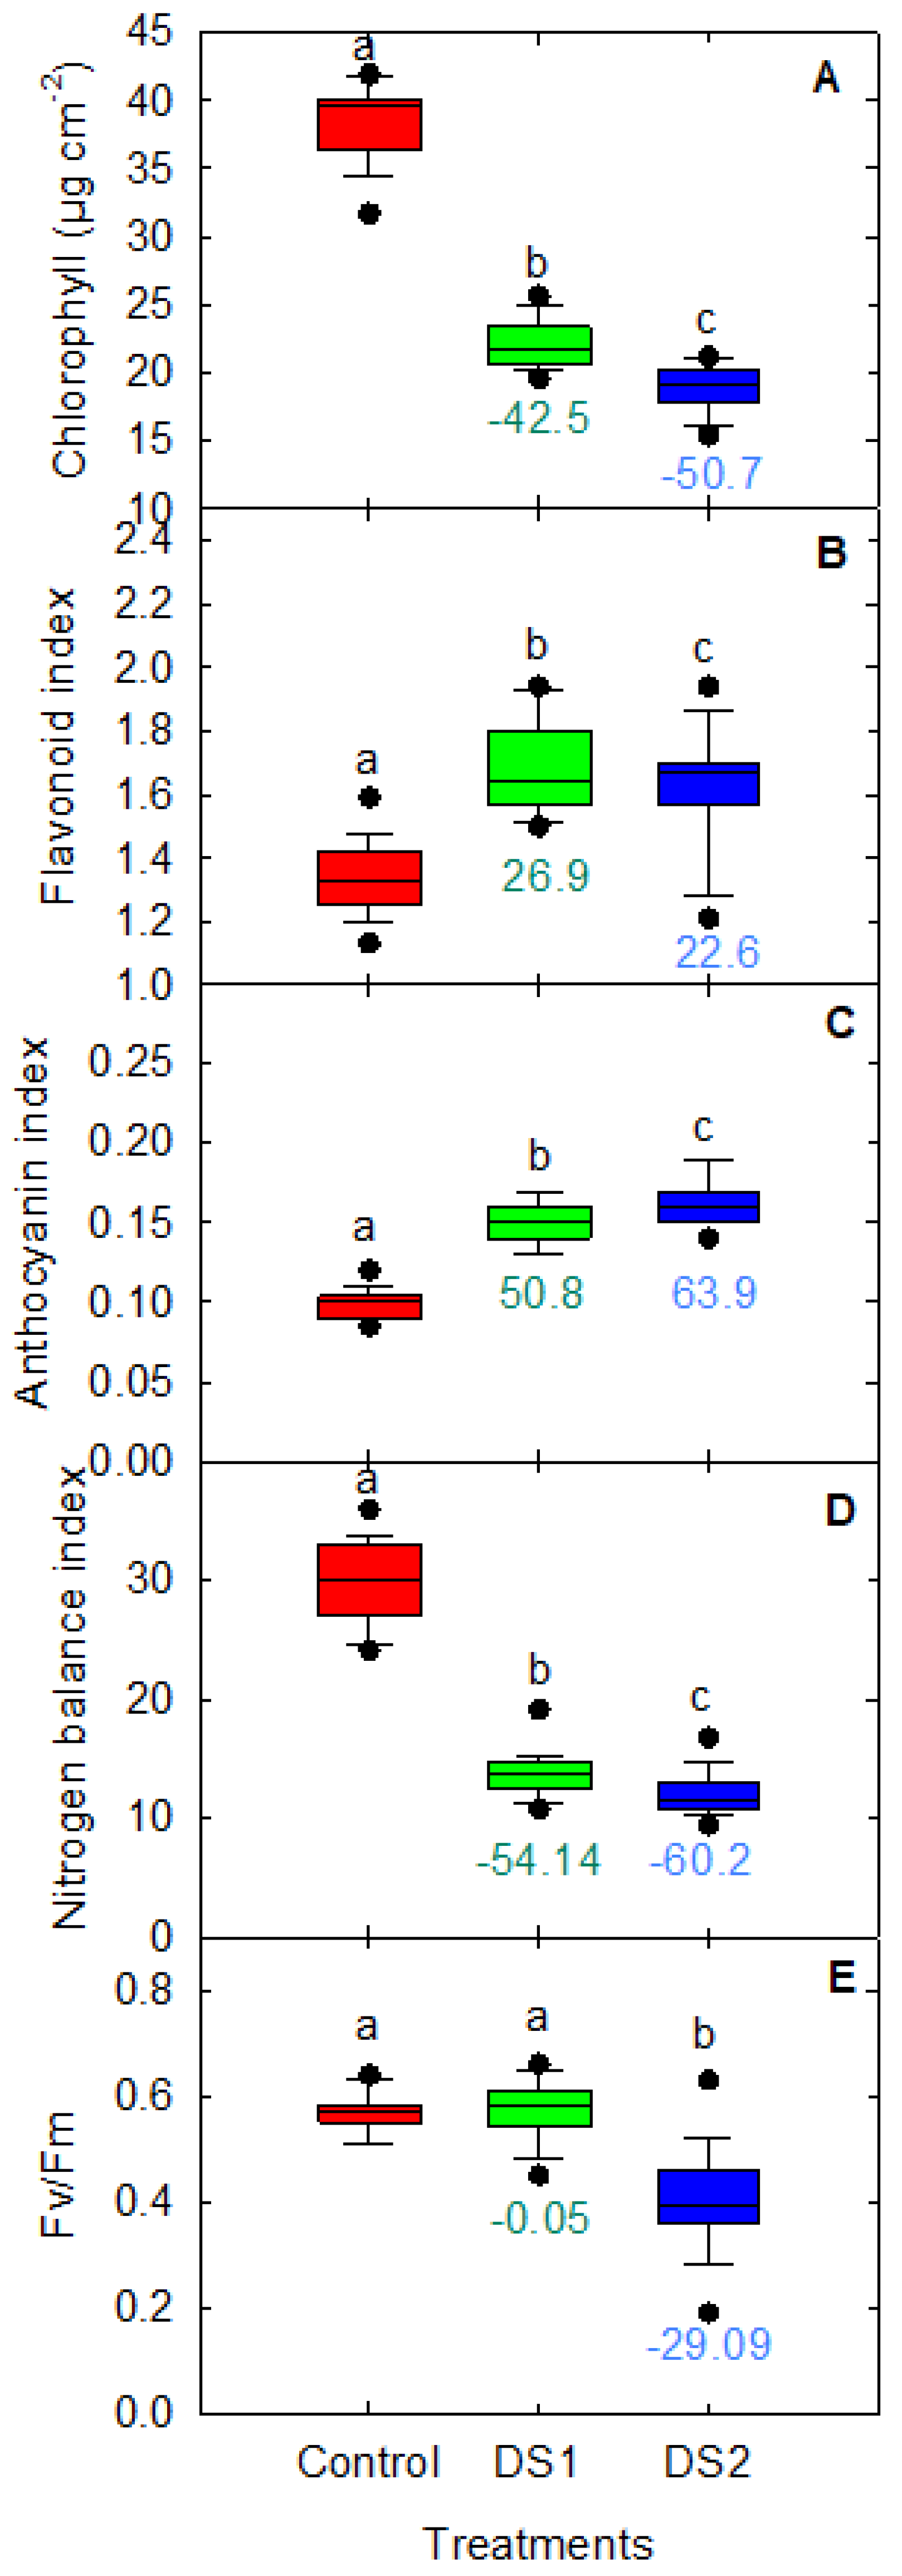
3.1. Physiological Traits in Response to Drought Stress

Drought treatments significantly differed for the measured physiological parameters (Table 2). The DS1 and DS2 conditions altered the plant performance as compared to control with extended impact from later than earlier. The chlorophyll content showed a substantial decrease of 50.7% under DS2 followed by DS1 (42.5%) relative to control (Figure 3A). The highest chlorophyll content was observed in ‘PGY7111’ (25.6 µg cm−2) and ‘6640’ (25.1), while the least was displayed by ‘DKC67-44’ (19.6 µg cm−2) under DS1 (Table S1). At the same time, ‘NK1405’ (21.2 µg cm−2) and ‘P1316’ (21.1 µg cm−2) had higher chlorophyll content, and ‘A6659’ exhibited minimum (15.4 µg cm−2) chlorophyll content under DS2. A similar decrease trend was observed for NBI and Fv/Fm (Figure 3D,E). Under the DS1 condition, the reduction in Fv/Fm was negligible compared to the control, indicating that DS1 did not affect photosystem II. However, the DS2 significantly affected photosystem II, causing a 29.1% reduction compared to the control. The hybrids ‘PGY7111’ and ‘CNX157137’ performed better under DS1 for photosystem reactions (0.7 each), while they were ‘P1316’ (0.6) under DS2 conditions. Among the hybrids, ‘A6659’ had the least Fv/Fm ratio under stress conditions.
The hybrids ‘PGY7111’ (19.1) and ‘D57VP51’ (16.7) had the highest NBI under DS1 and DS2 conditions and were statistically significant compared to other hybrids. In contrast, ‘DKC67-44’ had the least NBI response under DS1 (10.8) and DS2 (9.4) drought stress. On the other hand, the flavonoid and anthocyanin indices were found to increase under stress treatments compared to control (Figure 3B,C). An increase of 26.9 and 22.6% were found in the flavonoid index under DS1 and DS2 conditions, respectively. The average anthocyanin index under DS2 and DS1 was 0.16 and 0.15, respectively. The flavonoid index was significantly higher in ‘P1316’, ‘REV25BHR26’, and ‘NK1405’ (1.9 each) while it was lower in ‘A6659’, ‘PGY7215’, and ‘DKC67-72’ (1.5 each) under DS1 conditions. Under DS2, the least flavonoid index was noted in ‘D57VP51’ (1.2), while ‘NK1405’ and ‘REV25BHR26’ (1.9) exhibited significantly higher indices.

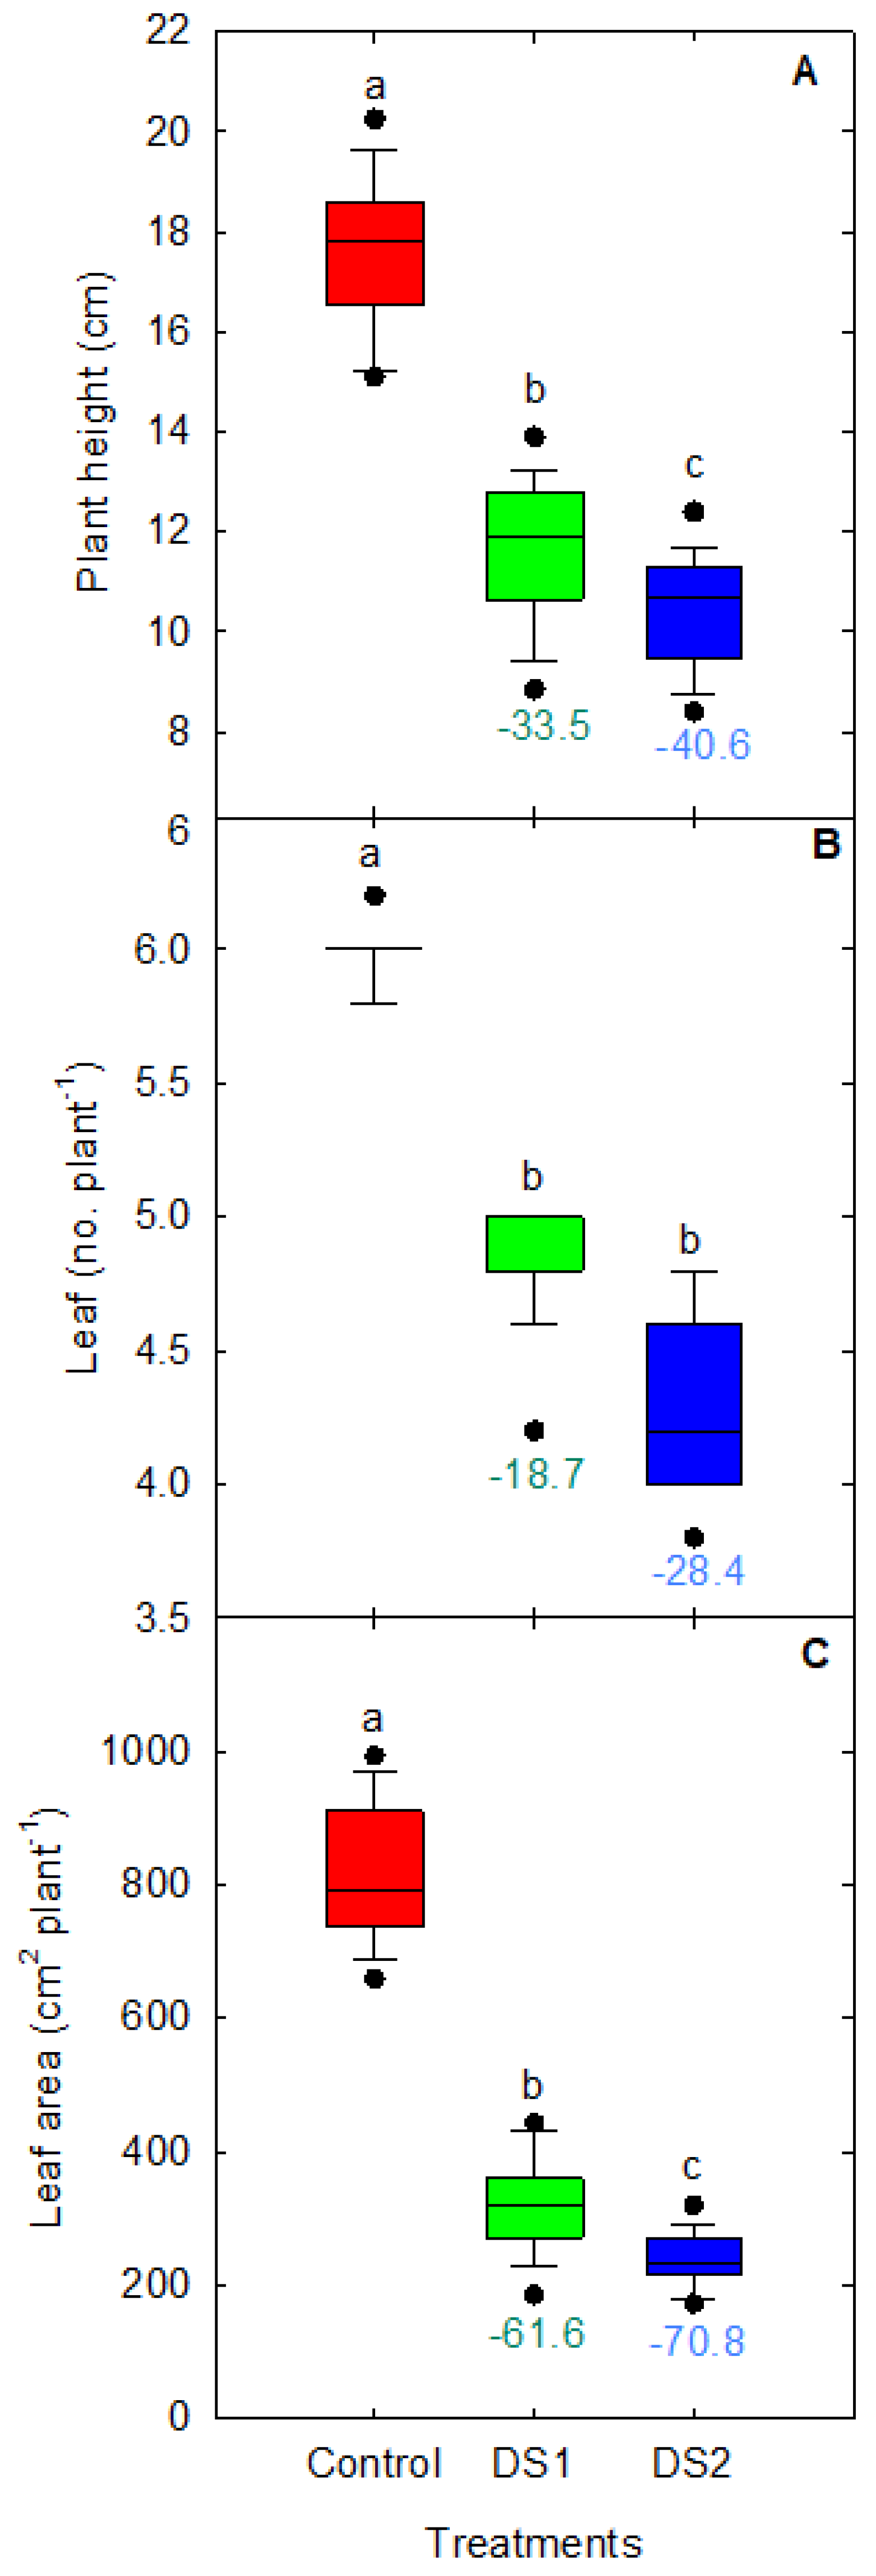
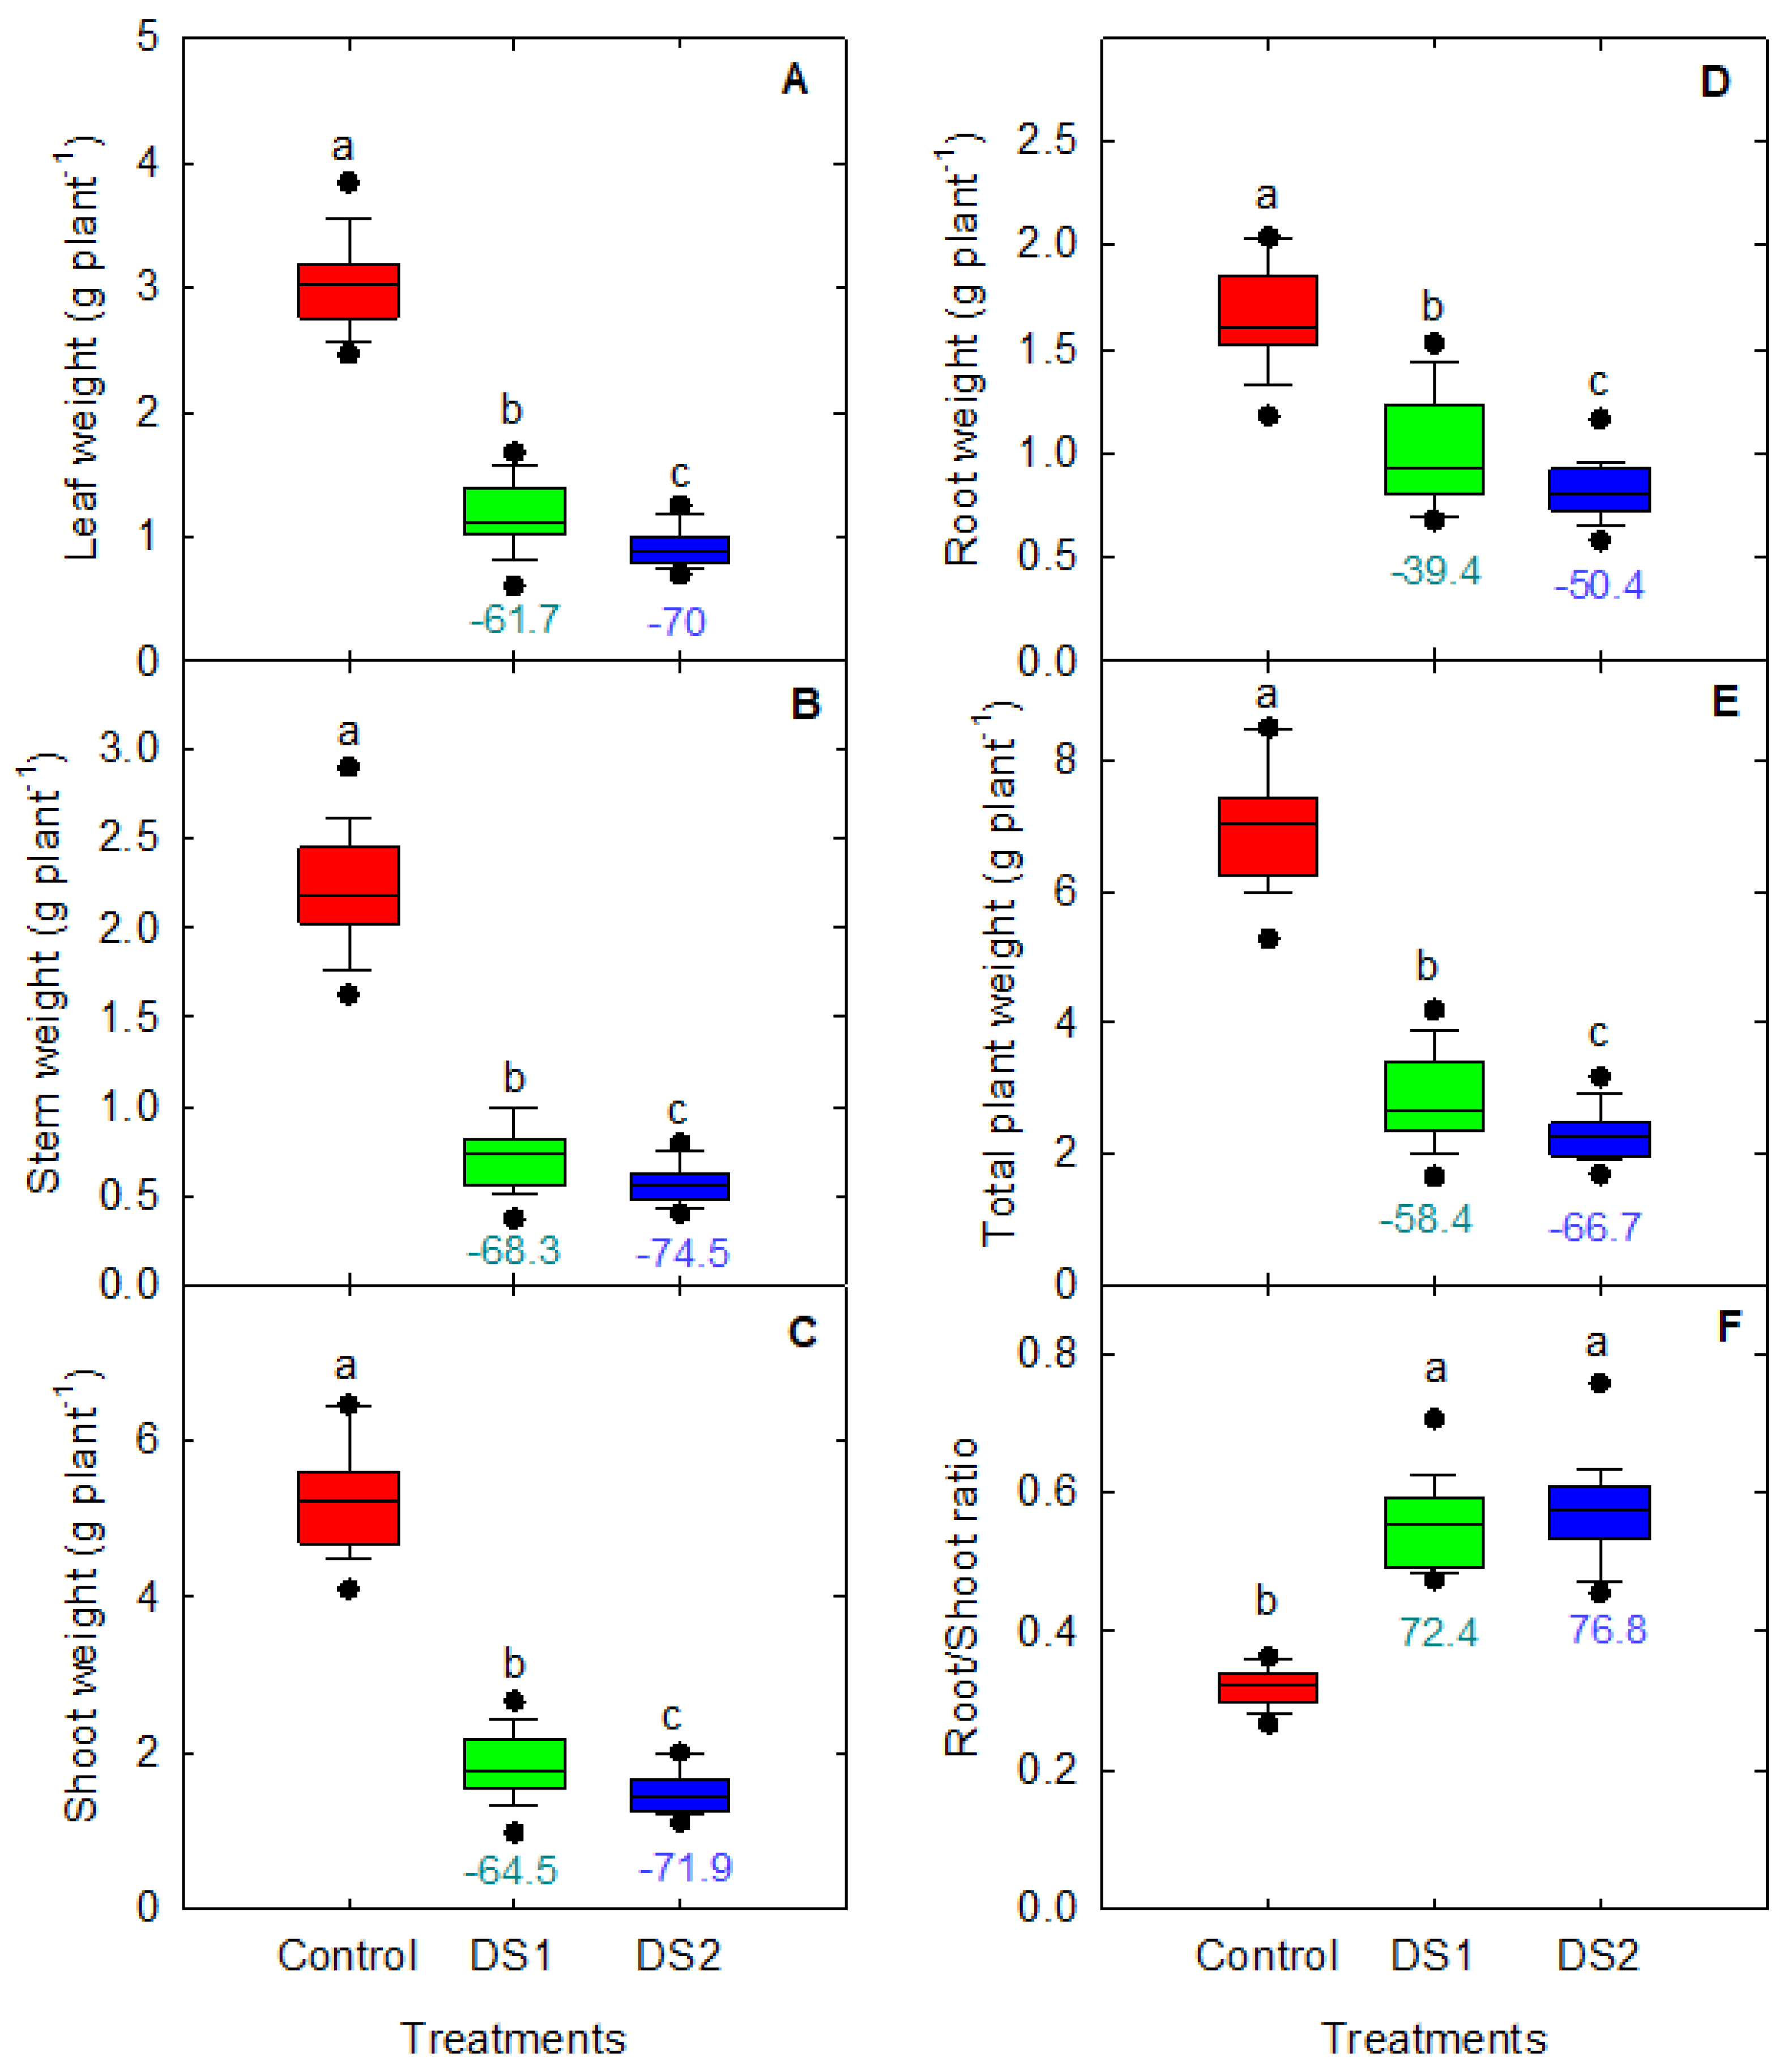
3.2. Shoot Growth and Biomass in Response to Drought Stress

The shoot apical and lateral meristems continuously divide, generating new cells that elongate and produce stems and leaves, leading to shoot growth. The shoot response to DS1 and DS2 stress levels was characterized by reduced shoot growth compared to control conditions (Figure 4). However, the decrease in shoot growth traits was more pronounced in DS2 than DS1. For instance, DS2 resulted in a 70.8% reduction in leaf area, while DS1 caused a 61.6% decrease compared to control. The stress treatments affected leaf numbers less than other shoot growth traits. Additionally, plants subjected to drought stress were generally shorter in stature compared to those grown under control conditions (Figure 4A).
Concerning biomass-related traits, the negative impact of DS1 and DS2 stress was more prominent for both leaf and stem dry weights compared to the control (Figure 5). Moreover, the biomass was compromised slightly higher on the stem, with reductions of 68.3% and 74.5% compared to the leaf, which experienced reductions of 61.7% and 70% under DS1 and DS2 stress treatments, respectively (Figure 5A,B). Among the hybrids, the highest shoot biomass (g plant−1) was recorded in ‘D57VP51’ (2.7), ‘A6659’ (2.4), and PGY7111 (2.4) under DS1, while ‘D57VP51’ exhibited maximum shoot growth in DS2 (2.7 g plant−1) (Table S1). The hybrid ‘D57VP51’ performed consistently better in shoot growth and biomass traits under drought stress than other hybrids. On the other hand, the root growth was found to increase under DS1 (72.4%) and DS2 (76.8%) compared to control. This indicates that plants respond to drought by enhancing root growth and compromising shoot growth.

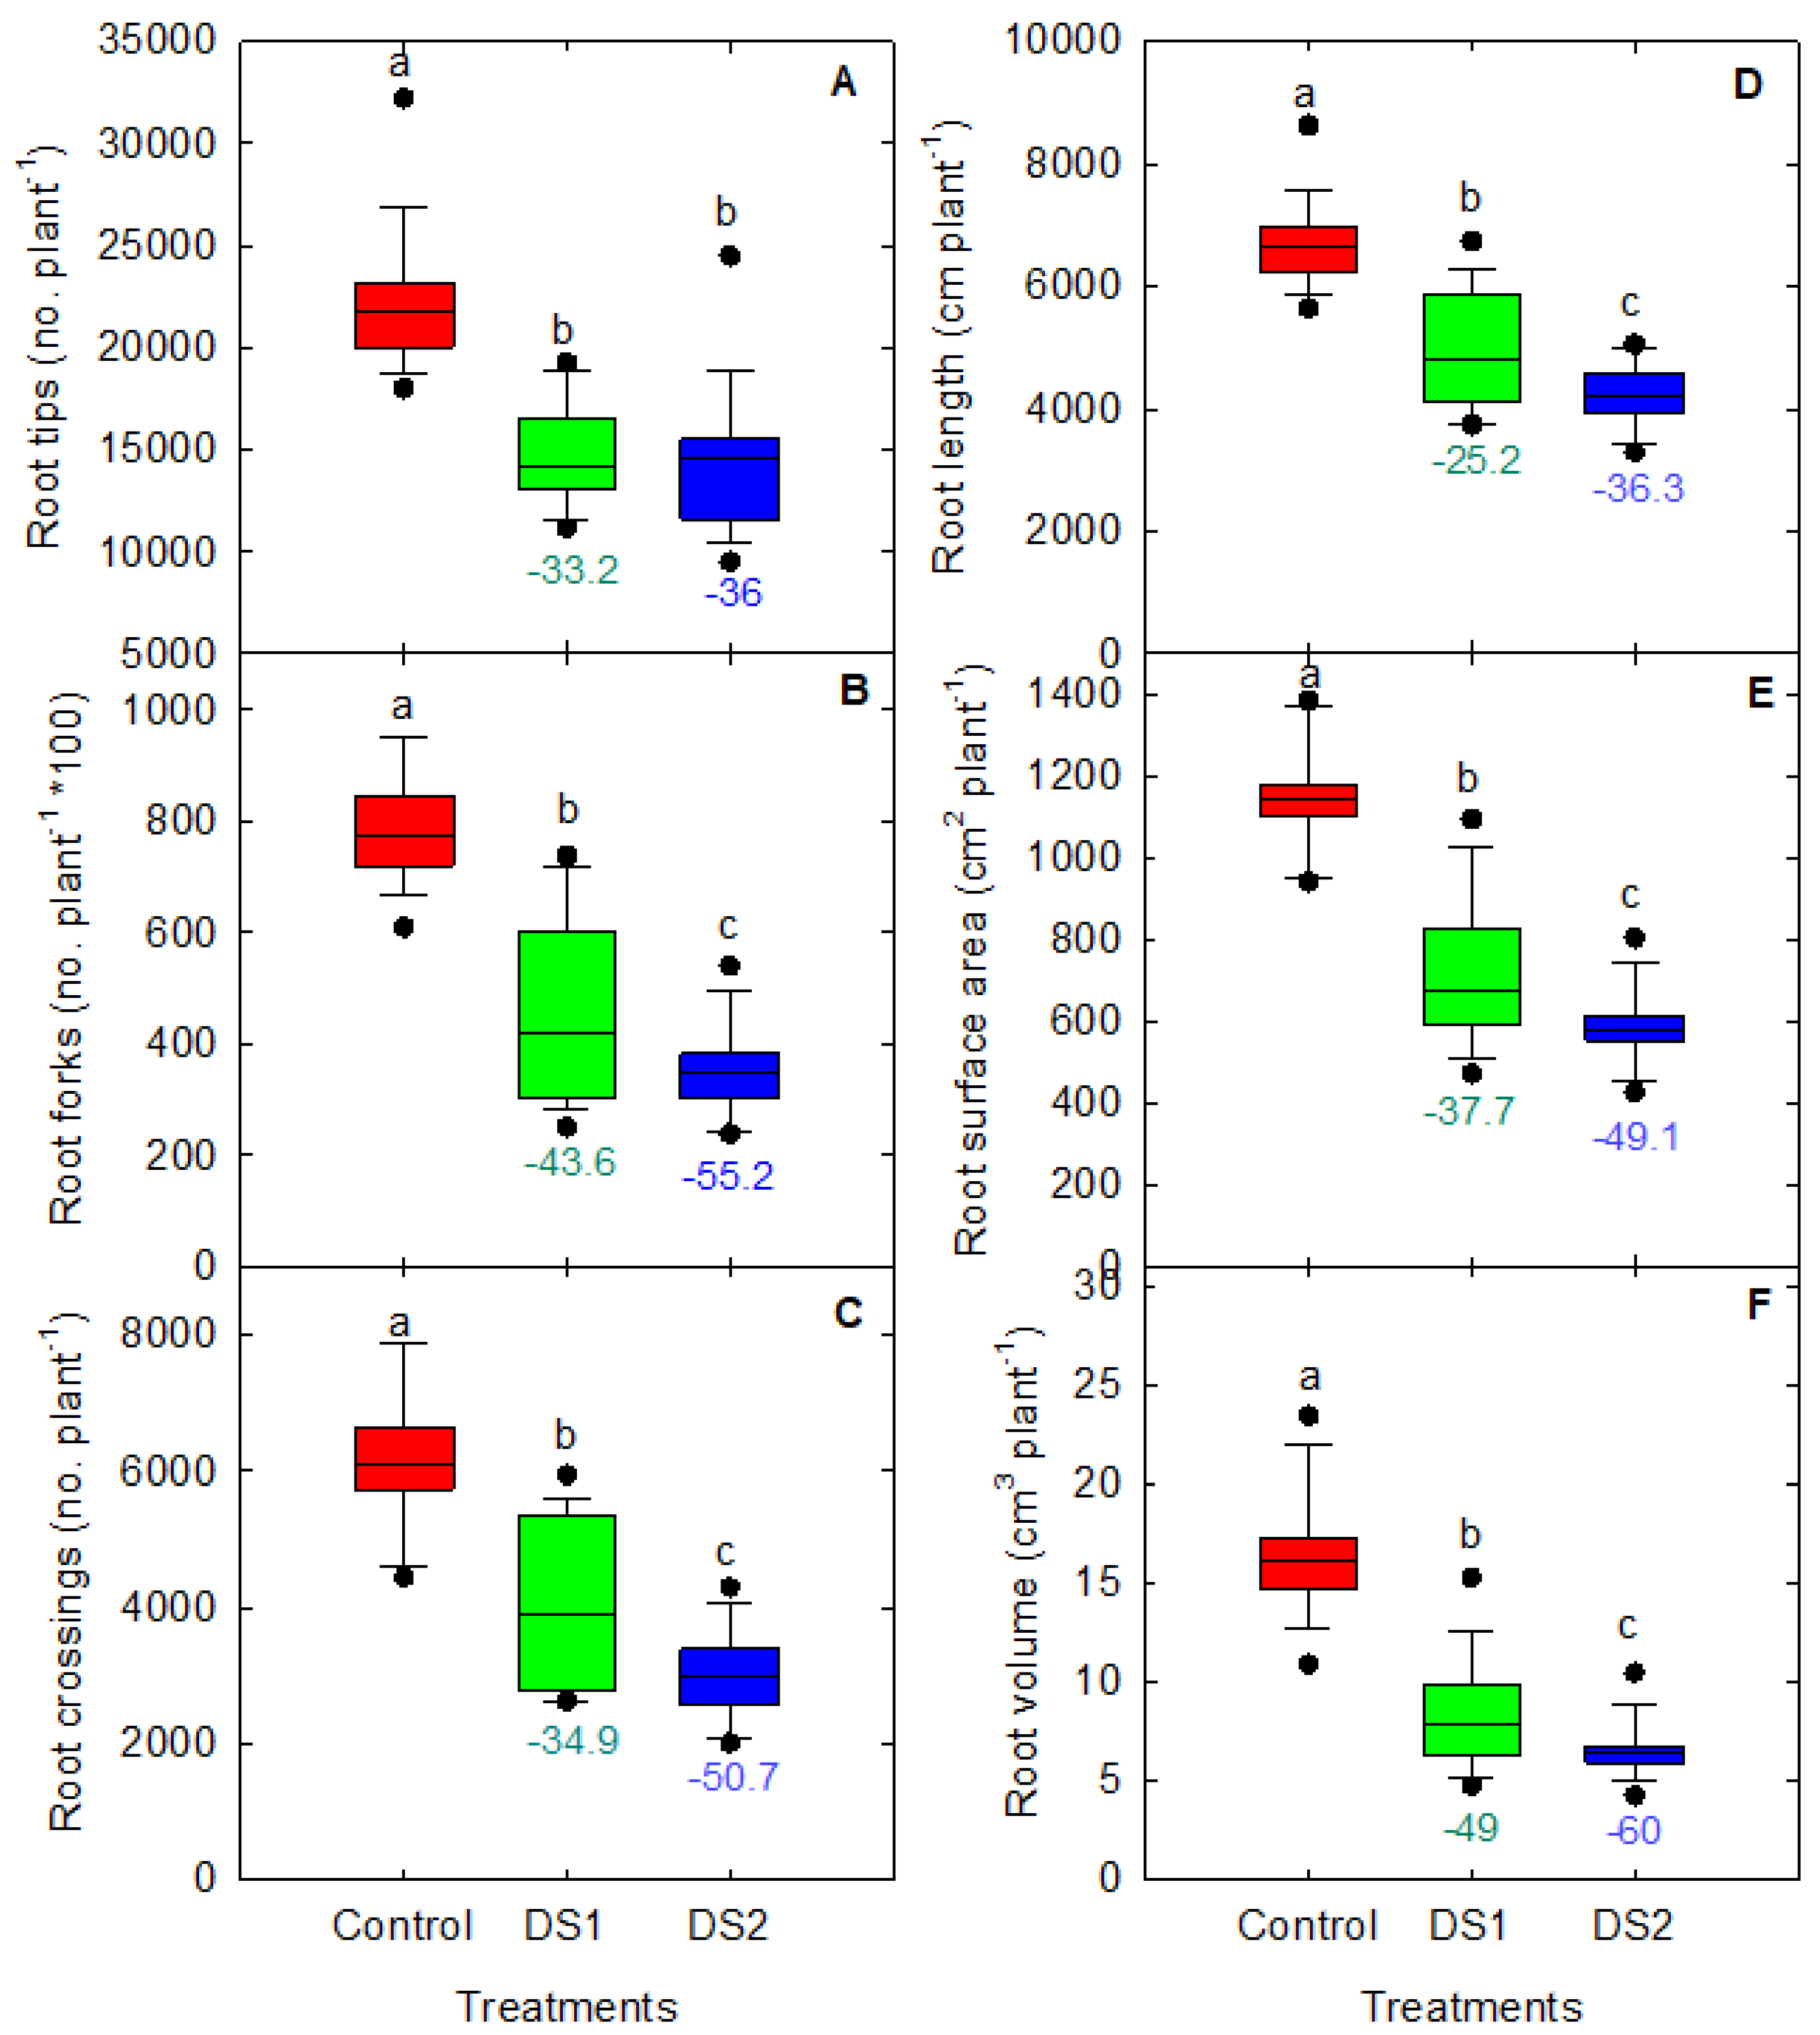
3.3. Root Traits in Response to Drought Stress

Drought stress significantly inhibited the overall root growth compared to the control condition. The level of inhibition was higher under DS2 (40%) than DS1 (50%) treatment (Figure 5 and Figure 6). In response to DS1 and DS2 stresses, root volume decreased by 49.9% and 60%, respectively. The variation in hybrid response to DS1 was higher than DS2, except for the number of root tips (Table S1). For example, the total root length under DS2 ranged between 3297.8 and 5055.1 cm plant−1; under the DS1 condition, it ranged from 3742.3 to 6735.9 cm plant−1 (Figure 6D). Among the hybrids, ‘A6659’ and ‘D57VP51’ exhibited the highest overall root growth parameters under DS1. On the other hand, ‘A6499’ and ‘D57VP51’ displayed the highest root growth under DS2 (Table S1). Root surface area and volume increased similarly to the total root length under drought stress conditions.
The decrease in root developmental traits, such as the number of root tips, number of root forks, and number of root crossings, was more pronounced under DS2 (36, 55.2, and 50.7%) compared to DS1 (33.2, 43.6, and 34.9%) (Figure 6), indicating that the scarcity in soil moisture content enhances the branching capacity in plant roots. The differences among the hybrids for root developmental traits in response to DS1 and DS2 were generally lower than the control condition except for the number of root tips, as the variation was higher (14,974.4 no. plant−1) under DS2 compared to control (14,186.3 no. plant−1) (Figure 6B–F).

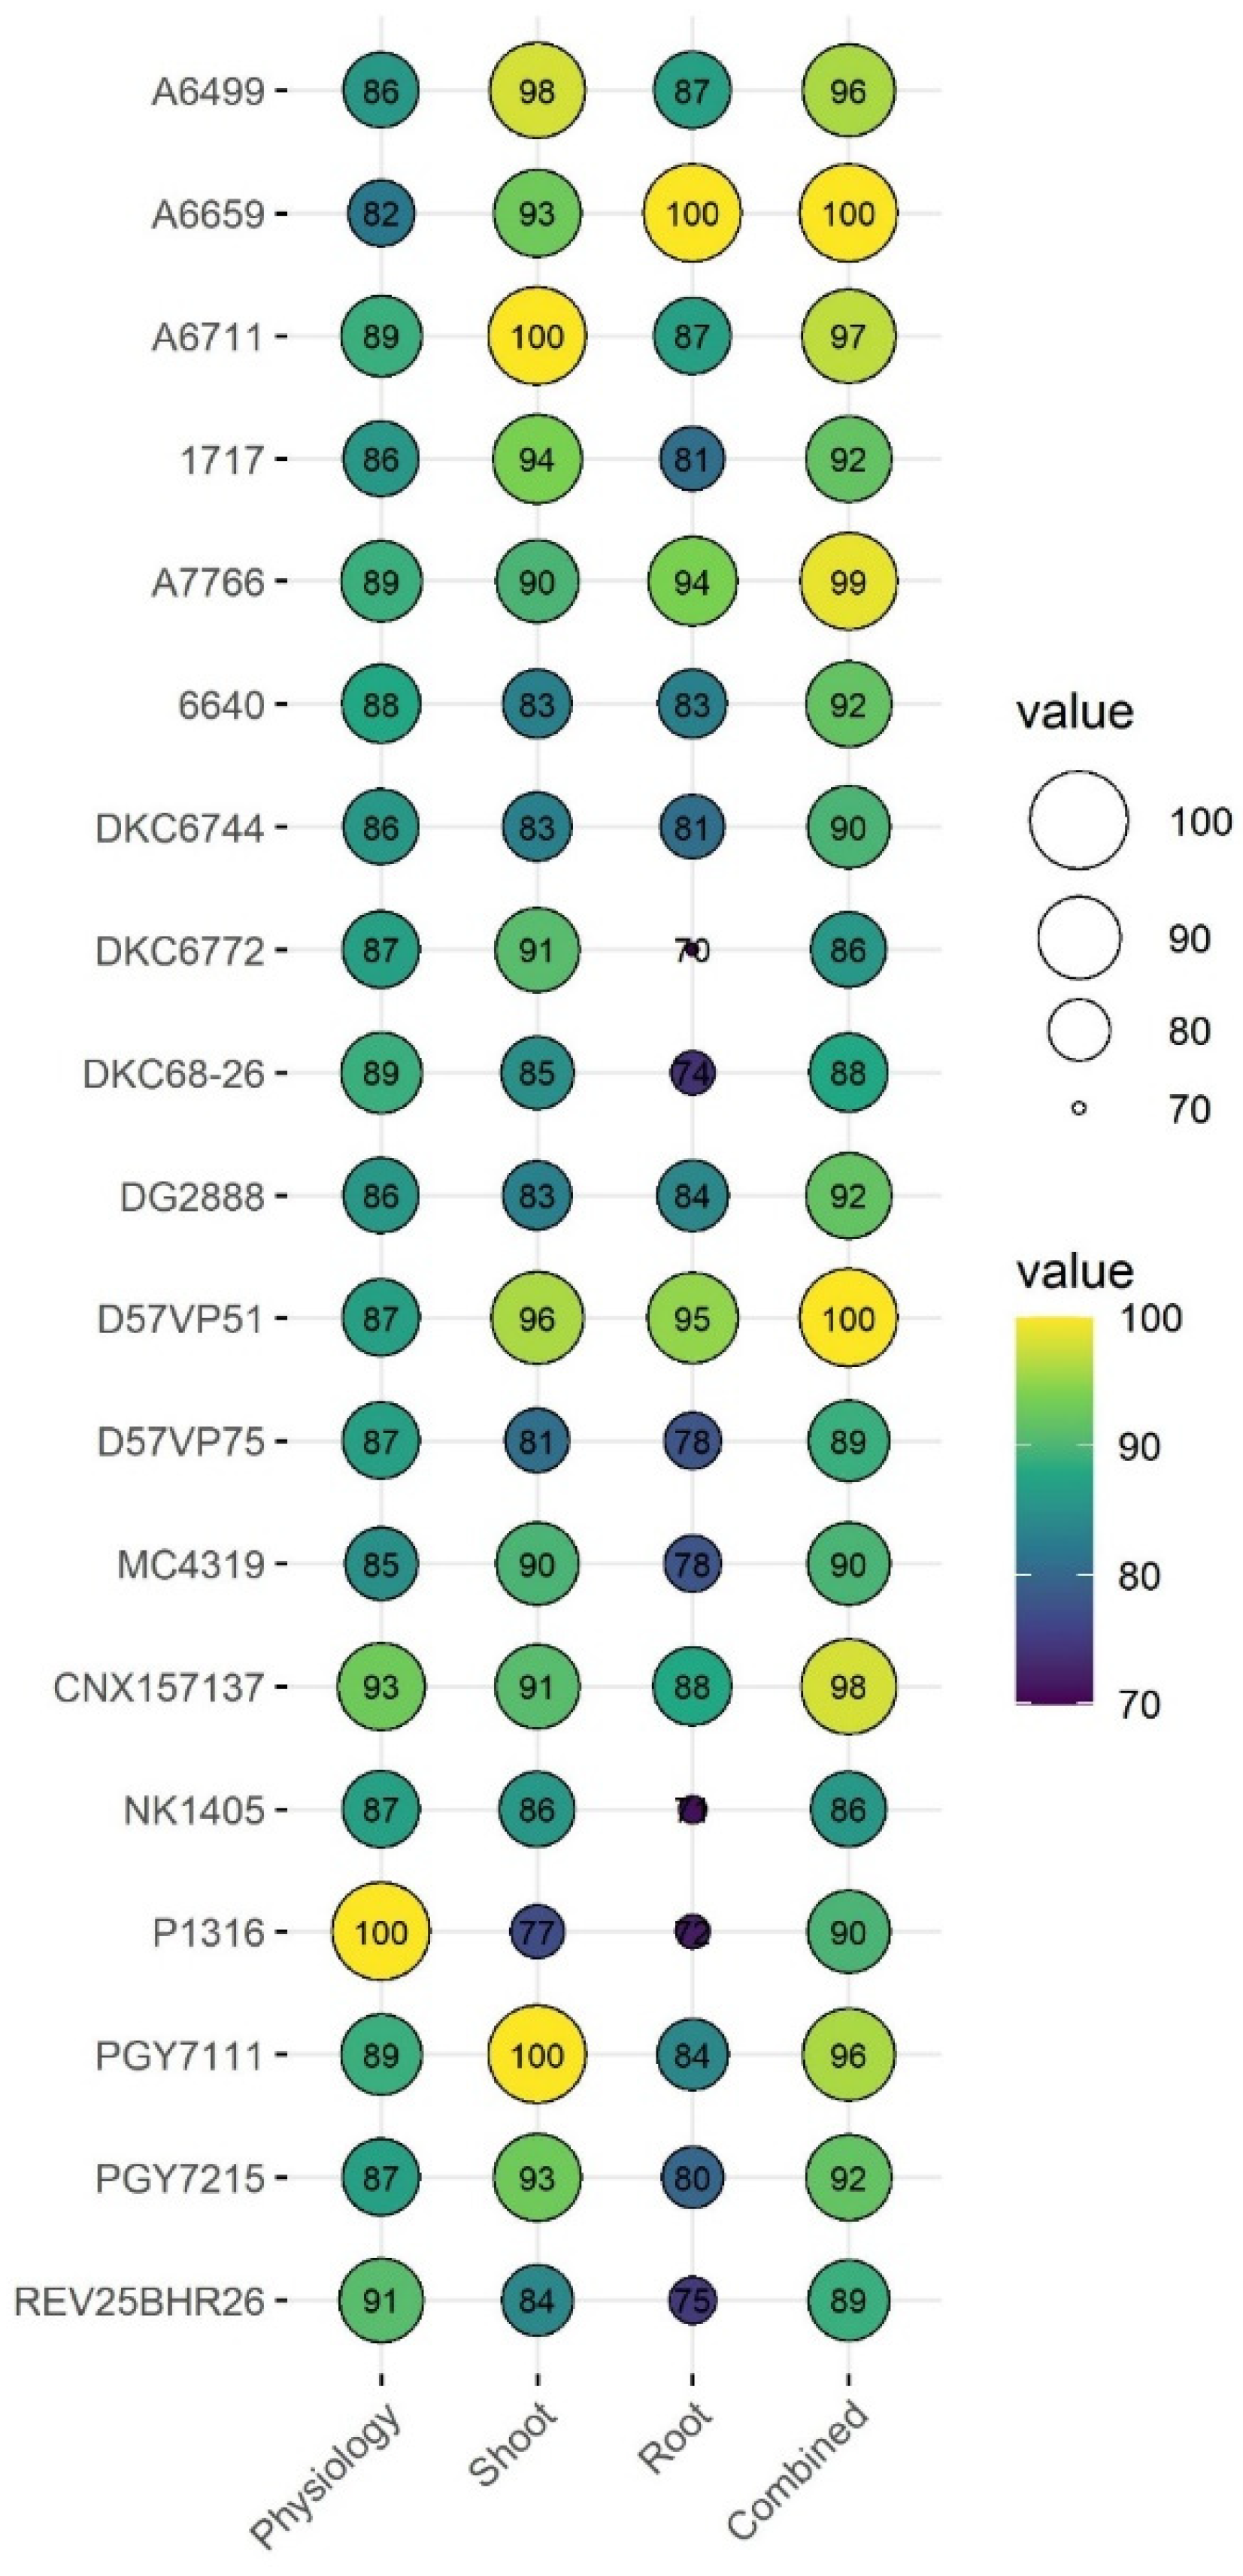
3.4. Hybrid Performance under Drought Stress

PCA was employed to investigate the relationship between shoot and root parameters and the response of corn hybrids to drought stress. PC1 and PC2 collectively accounted for a substantial portion (66.2%) of the phenotypic variance under drought stress (Figure 7C). The top five traits contributing to the variability in PC1 were TDW (0.96), ShDW (0.96), LDW (0.96), RSA (0.94), and RV (0.88). The PC2 explained 15.3% of the variation between hybrids, primarily influenced by RS (0.69) and RC (0.56). The PC3 was majorly associated with RC (−0.55), TRL (−0.45), and anthocyanin index (0.44), with a percent variability of 8.7%. The trait loadings guided the arrangement of vectors on the factor plane (Figure 7A). Traits such as LDW, RDW, RC, TRL, RF, and TDW were positively associated with the first two PCs and placed them in first-factor coordinate. However, the Fv/Fm ratio displayed a negative association with the estimated components, positioning it in the third quadrant. Other physiological parameters were in the second (anthocyanin and flavonoid index) and fourth (NBI and chlorophyll content) quadrants.
A 2D scatter plot of factor loading values separated 19 corn hybrids into four quadrants (Figure 7B). Based on the PC analysis, hybrid ‘A6659’ and ‘D57VP51’ had the highest loading values as compared to other hybrids in PC1, positioning them in the first-factor quadrant. However, ‘P1316’ and ‘D57VP75’ had the lowest loading under PC1, placing them in the negative quadrant of PC1. In PC2, the hybrid ‘A6659’ had the highest favorable loading (4.18), while ‘DKC67-72’ had the lowest loading value (−3.33). This scatter plot suggested that ‘A6659’ and ‘D57VP51’ demonstrated superior plant growth and developmental performance under drought-stress conditions. Conversely, hybrid DKC67-72 appeared sensitive to the applied drought stress treatments.

3.5. Cumulative Drought Stress Response Index

The CDSRI was estimated using the observed parameters to assess the correlation between shoot, root, and physiological traits under drought stress conditions (Figure 8). A strong linear correlation was found between CDSRI and root traits (r2 = 0.88) and shoot traits (r2 = 0.67), underscoring the importance of root and shoot parameters in selecting drought-tolerant corn hybrids during the early establishment stage. Furthermore, this correlation highlights the greater significance of root traits compared to shoot traits in determining drought tolerance during a critical phase. However, the physiological drought stress response index (PDSRI) exhibited a weaker association with the CDSRI (r2 = 0.10), inferring that both root and shoot traits are more crucial for selecting vigorous hybrids for drought stress tolerance at the seedling stage.

3.6. Classification of Corn Hybrids
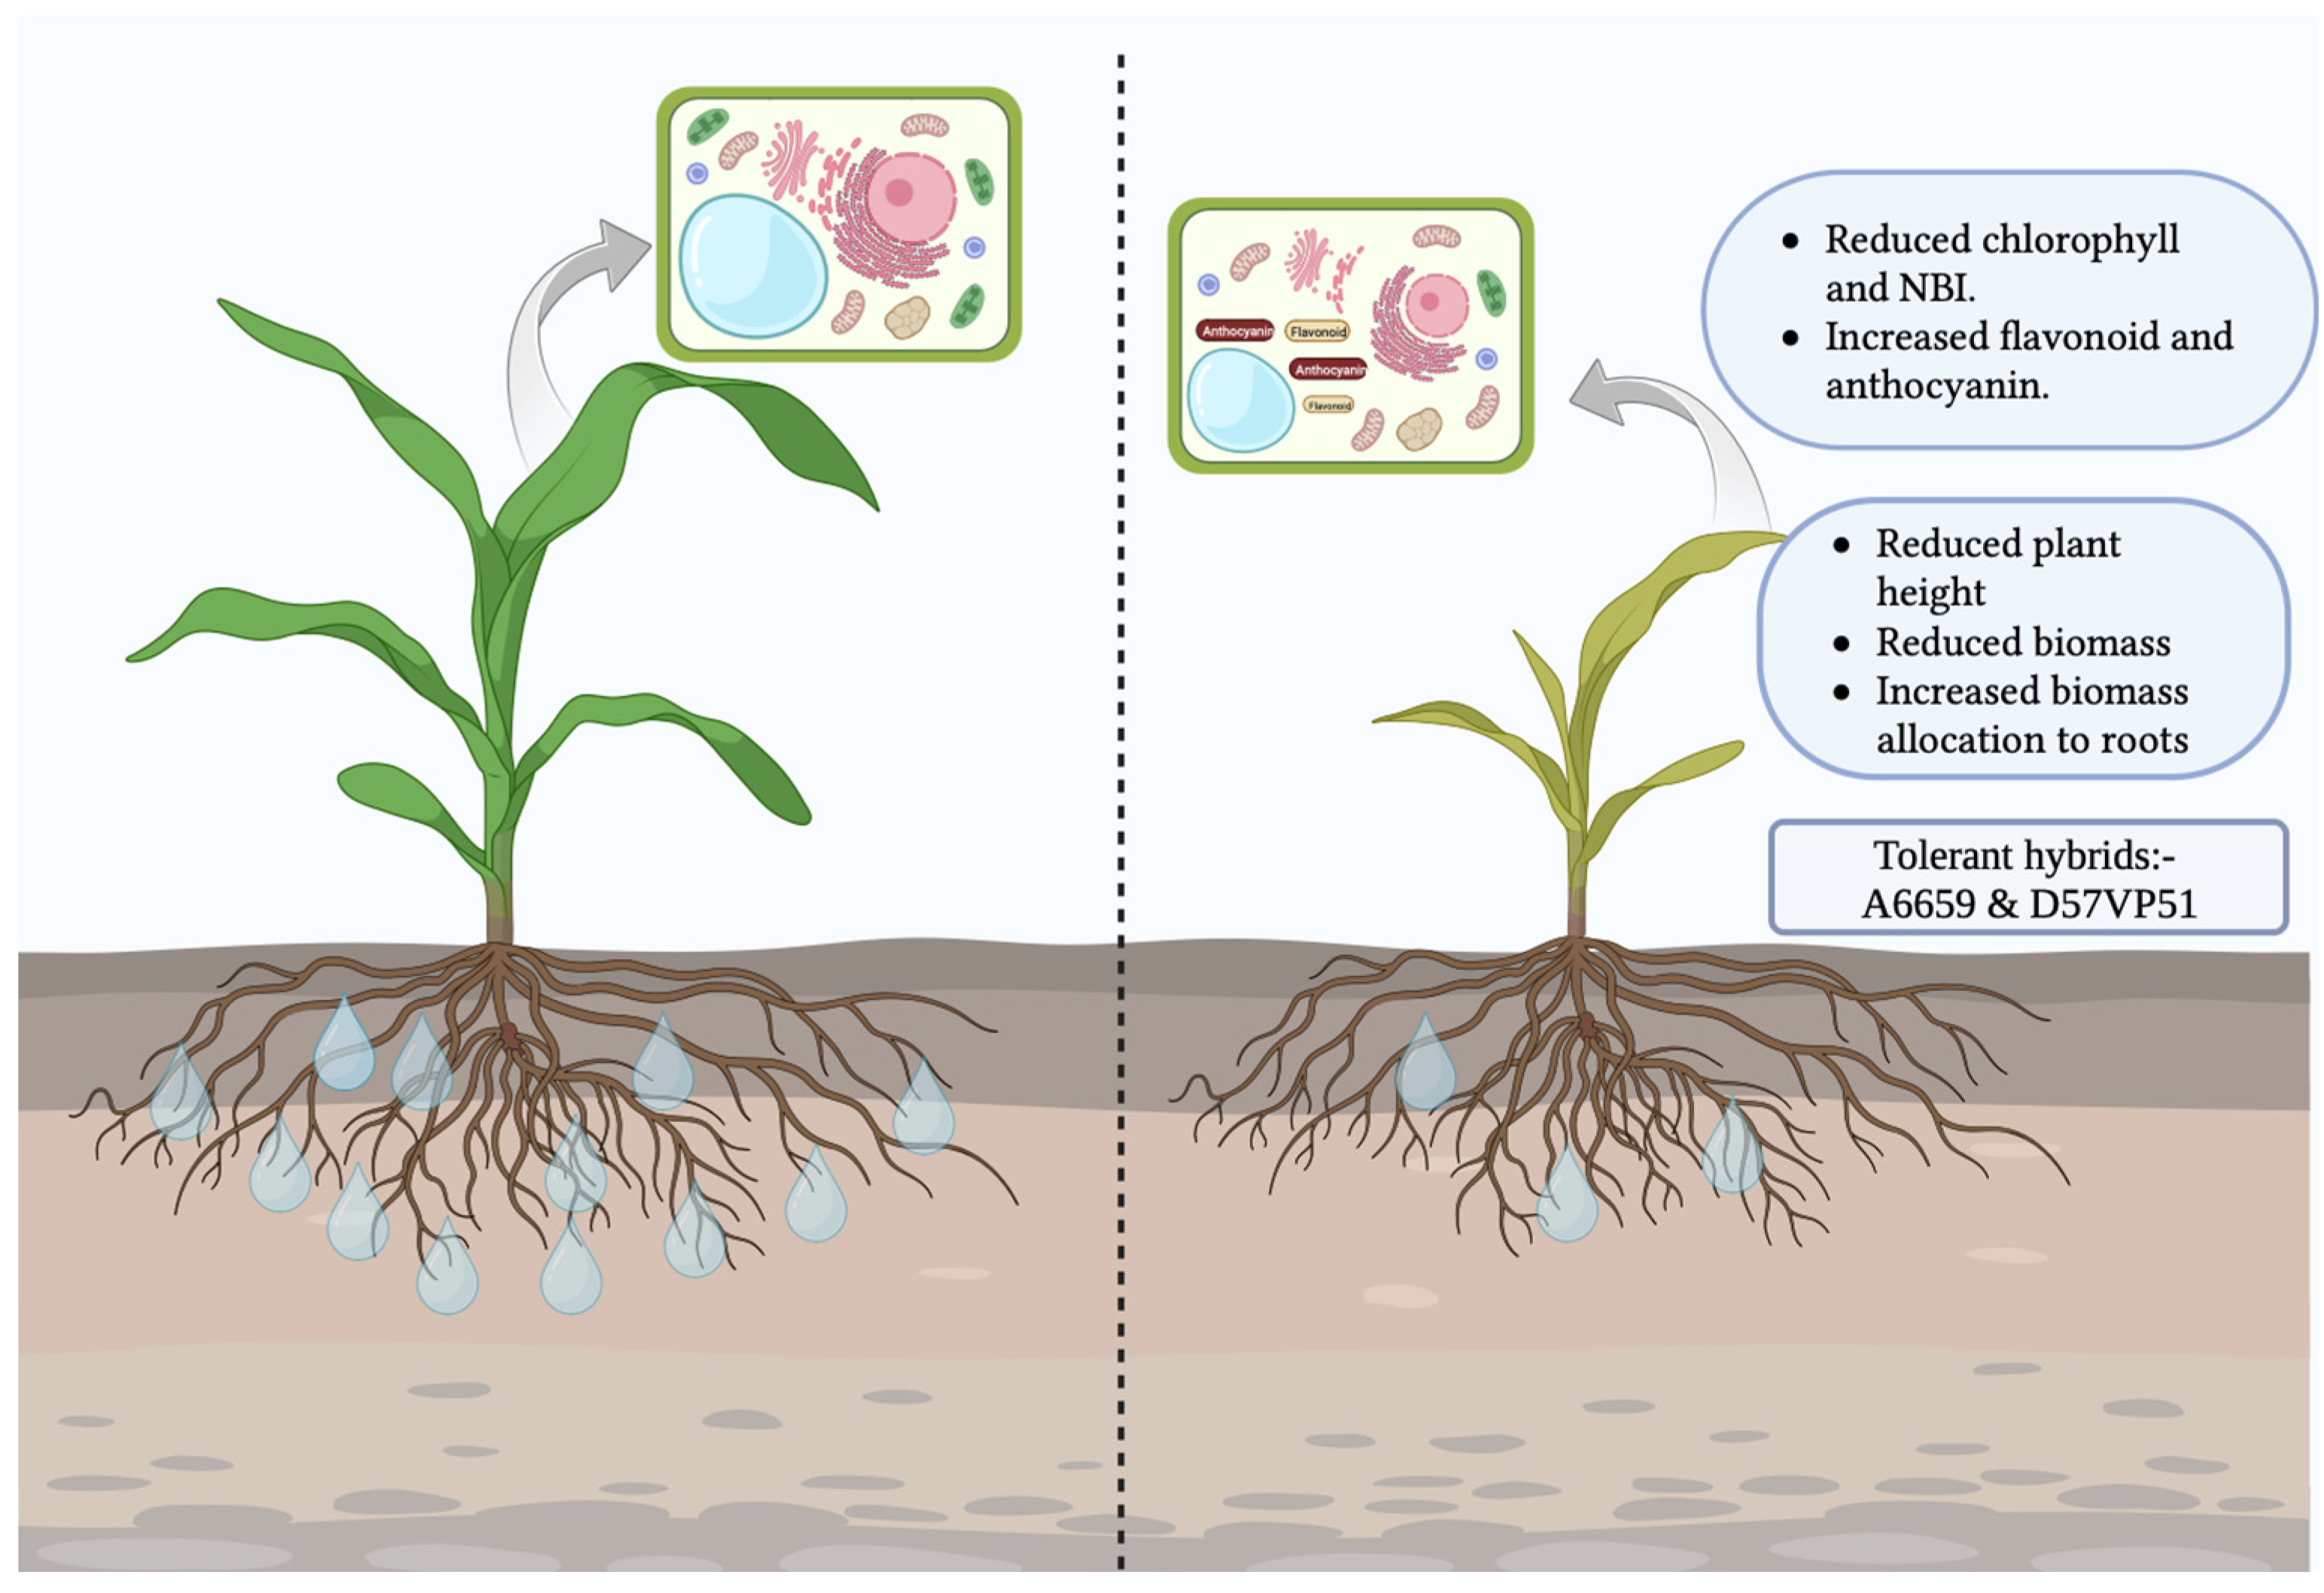
The PDSRI, SDSRI, RDSRI, and CDSRI were utilized to identify corn hybrids with drought stress tolerance among the studied hybrids (Figure 9). The classification using PDSRI revealed that the hybrid, ‘P1316’, exhibited the highest drought stress tolerance among the hybrids, followed by ‘CNX157137’. However, the SDSRI classification suggested that the hybrids, ‘PGY7111’ and ‘A6711’, are tolerant to drought stress, while ‘P1316’ was sensitive to the applied drought stress condition. The RDSRI showed that the ‘A6659’ hybrid was highly tolerant to drought stress. On the contrary, ‘P1316’, ‘NK1405’, and ‘DKC67-72’ had the least tolerance to drought. Thus, to comprehensively identify hybrids with superior drought stress tolerance with better plant growth and development, a cumulative index was employed using PDSRI, SDSRI, and RDSRI. The analysis suggested that ‘A6659’ and ‘D57VP51’ had the highest response index values, signifying the highest drought tolerance. This aligns with the results obtained from the PCA analysis. Conversely, ‘NK1405’ and ‘DKC6772’ were highly sensitive to the applied drought stresses.

4. Discussion

Drought stress is a significant constraint limiting crop production worldwide. Since water is one of the most critical restraining factors in the life cycle of a plant, drought can impair optimal plant growth and metabolism, causing severe yield reduction [25]. Corn is the prime crop in the US agricultural sector, and the surpassing rate of drought-prone areas will drastically decline the yield and seed quality. Thus, identifying hybrids that can avoid or tolerate the adverse effects of drought is meaningful. The early seedling stage is one of the most vulnerable and critical growth stages in the plant life cycle and determines the final plant stand and yield [26]. On this account, the current study was directed to understand corn hybrids’ physiological and morphological responses to distinct sub-optimal moisture levels at the early seedling stage.
The 19 commercial corn hybrids used in the study were diverse in their seedling growth under DS1 and DS2 conditions compared to the control. Drought drastically declines the tissue water potential and impairs many metabolic pathways, as well as plant growth and development [27], justifying the impaired seedling growth observed in this study. The tested hybrids in the study showed a drastic reduction in the measured physiological traits such as chlorophyll content, NBI, and Fv/Fm ratio over control, with the highest decline under DS2. Previous studies also reported the influence of genetic background on the physiological response to drought stress in chickpeas [28], Sorghum [29], and wheat [30]. The chlorophyll in the chloroplast is continuously metabolized in plants and is closely related to biomass formation. The leaf chlorophyll degrades due to the direct effects of drought stress. Yang et al. [31] reported that nutrient absorption under drought stress is retarded, causing deficiency symptoms of various elements, which is also displayed as decreased chlorophyll content and reduced nitrogen balance index. Environmental conditions severely affect photosystem II, hindering reaction centers’ functioning [32]. Under drought stress, the oxidation of electron receptor Q leads to a reduction in variable fluorescence (Fv), causing reduced quantum yield (Fv/Fm) [32], as reported in this study.
Though plants suffer from stress conditions, they find ways to avoid or tolerate its adverse effects. Plants employ osmotic regulation and the accumulation of oxygen-scavenging metabolites to diminish osmotic potential in cells, mitigate damage caused by reactive oxygen species (ROS), and sustain the necessary turgor pressure for optimal cell growth [33,34]. Numerous studies revealed the enzymatic and non-enzymatic regulation of ROS quenching mechanisms under abiotic stress conditions [35]. It has been reported that drought stress induces the accumulation of proline and phenolic contents in corn, which helps in free-radical quenching and maintaining cell redox potential [36,37]. Proline has been identified as a signaling molecule with roles in activating pathways of ROS detoxification and initiating specific gene expression to regulate mitochondrial functions to osmotic stress [38]. Yousaf et al. [39] noticed the increased activity of superoxide dismutase (SOD) and catalase enzymes under drought stress during a pre-anthesis stage in corn. In our study, the resulting increase in antioxidants such as anthocyanins and flavonoids under drought stress are among the other drought coping mechanisms. Flavonoids are secondary metabolites in the phenylpropane pathway, and the hydroxyl groups at 3′ and 4′ positions participate in ROS scavenging [40]. Flavonoids avert the stomatal closure by reducing the hydrogen peroxide level in guard cells [34] by preventing drought stress-induced damage. Under drought stress, the guard cells of a drought overly insensitivity 57 (doi57) corn mutant accumulated more flavonols with a relatively lower amount of hydrogen peroxide than the wild type [34]. Anthocyanins are a subclass of flavonoids, and their increased accumulation was observed under abiotic stress in Arabidopsis thaliana [41]. Antioxidant enzymes like SOD and catalase use anthocyanins as co-substrate in scavenging surplus ROS produced during stress conditions [42]. In this study, all the corn hybrids increased anthocyanin content under drought conditions. The variation among the hybrids for all the measured physiological parameters reflects the genetic differences in seedling response to drought stress [32].
Apart from the alteration in the physiology of plants, drought stress leaves visible morphological damage to the plants. The corn seedling was more severely affected by DS2 than DS1, reflecting the physiological changes. The reduction in chlorophyll content and, thus, photosynthesis yielded a decrease in the dry weights of the plants. Interestingly, PCA revealed that the LDW, ShDW, TDW, and RSA are the highly responsive traits that assist in displaying the difference between hybrids under drought stress. The overall growth of plants is retarded upon exposure to drought, and it has been reported earlier in wheat [43], barley [44], and rice [45]. The plant height and leaf area declined to a larger extent under DS1 (61%) and DS2 (70%). It has been previously reported in corn [36] and rice [46] that reduced cell expansion and increased leaf senescence under drought stress conditions give rise to shorter plants. Decreased leaf growth is another direct visible response of plants’ exposure to drought stress. As an adaptation mechanism, leaves attain a smaller leaf area, increased thickness, and greater leaf tissue density [47], which reduces plant photosynthesis and final yield.
Even though shoot and root growth declined under stress, the reduction rate was higher in shoot growth, resulting in an increased root-to-shoot ratio, and this trait was highly correlated with PC2. The superior hybrids (‘A6659’ and ‘D57VP51’) identified in the CDSRI study had higher root growth than other hybrids. Similar observations were also noticed in rice, wherein the superior root architecture increases water use efficiency, thus regulating plant growth and development [45]. Moreover, a higher root-to-shoot ratio supports soil resource attainment and elevates plant adaptation to drought [48,49]. The study also revealed that the scarcity of soil moisture content enhances the branching capacity of plant roots. The hypothesis was also supported by the strong correlation between RDSRI and CDSRI (r2 = 0.88) and between the SDSRI and PDSRI.
The current study provides insight into early growth changes associated with drought stress (Figure 10) and the response of different hybrids to drought, allowing corn producers to select suitable hybrids depending upon the environmental conditions. Furthermore, directing drought stress-related investigations to root traits could be more effective in crop improvement programs.

Supplementary Materials

The following supporting information can be downloaded at: https://www.mdpi.com/article/10.3390/agriculture14030425/s1. Table S1: Early seedling physiological, shoot, and root growth changes associated with drought stress in corn hybrids.

Author Contributions

C.H.W.: Design, data collection, and analysis, P.R.: Data analysis, writing original draft, visualization, reviewing, and editing, N.T.: Analysis, original draft writing, data interpretation, visualization, reviewing, and editing; R.B.: Analysis, reviewing and editing; K.N.R.: Reviewing and editing; K.R.R.: Conceptualization, methodology, and editing, investigation, supervision, and fund acquisition. All authors have read and agreed to the published version of the manuscript.

Funding

This work is supported by the United States Department of Agriculture, Agricultural Research Service under Agreement No. 58-8042-9-072, the USDA NIFA (2019-34263-30552 and MIS 043050), and USDA-ARS NACA 58-6066-2-030, and the Mississippi Corn Promotion Board (no. 001).

Institutional Review Board Statement

Not applicable.

Data Availability Statement

Data is included in the manuscript.

Acknowledgments

The authors thank David Brand for technical assistance.

Conflicts of Interest

The authors declare no conflicts of interest.

References

  1. NASA. Global Climate Change: The Evidence for Rapid Climate Change is Compelling. 2023. Available online: https://climate.nasa.gov/evidence/ (accessed on 20 September 2023).
  2. NOAA. Greenhouse Gases Continued to Increase Rapidly in 2022. 2022. Available online: https://www.noaa.gov/news-release/greenhouse-gases-continued-to-increase-rapidly-in-2022 (accessed on 20 September 2023).
  3. NOAA-NIDIS. NOAA-National Integrated Drought Information System. Historical Drought. 2023. Available online: https://www.drought.gov/what-is-drought/historical-drought#overview (accessed on 27 November 2023).
  4. NOAA-NIDIS. NOAA-National Integrated Drought Information System. National Current Conditions, 20–26 September 2023. Available online: https://www.drought.gov/current-conditions (accessed on 24 November 2023).
  5. NDMC. National Drought Mitigation Center, U.S. Drought Monitor. 2023. Available online: https://droughtmonitor.unl.edu (accessed on 24 November 2023).
  6. USDA-NASS. USDA-National Agricultural Statistics Service. Corn Production. 2023. Available online: https://www.nass.usda.gov/Charts_and_Maps/Field_Crops/cornprod.php (accessed on 5 January 2024).
  7. USDA-FAS. USDA-Foreign Agricultural Service. U.S. Corn Exports in 2022. 2022. Available online: https://www.fas.usda.gov/data/commodities/corn (accessed on 5 January 2024).
  8. USDA. Agriculture in Drought. 2023. Available online: https://www.usda.gov/sites/default/files/documents/AgInDrought.pdf (accessed on 5 January 2024).
  9. Kukal, M.S.; Irmak, S. Irrigation-limited yield gaps: Trends and variability in the United States post-1950. Environ. Res. Commun. 2019, 1, 061005. [Google Scholar] [CrossRef]
  10. Vennam, R.R.; Poudel, S.; Ramamoorthy, P.; Samiappan, S.; Reddy, K.R.; Bheemanahalli, R. Impact of soil moisture stress during the silk emergence and grain-filling in maize. Physiol. Plant. 2023, 175, e14029. [Google Scholar] [CrossRef]
  11. Vennam, R.R.; Ramamoorthy, P.; Poudel, S.; Reddy, K.R.; Henry, W.B.; Bheemanahalli, R. Developing functional relationships between soil moisture content and corn early-season physiology, growth, and development. Plants 2023, 12, 2471. [Google Scholar] [CrossRef]
  12. Anderson, B. Early Spring Drought Review for US Grain and Oilseed Crops. 2022. Available online: https://www.dtnpf.com/agriculture/web/ag/news/article/2022/03/23/early-spring-drought-review (accessed on 25 November 2023).
  13. Harb, A.; Krishnan, A.; Ambavaram, M.M.; Pereira, A. Molecular and physiological analysis of drought stress in Arabidopsis reveals early responses leading to acclimation in plant growth. Plant Physiol. 2010, 154, 1254–1271. [Google Scholar] [CrossRef]
  14. Vukasovic, S.; Alahmad, S.; Christopher, J.; Snowdon, R.J.; Stahl, A.; Hickey, L.T. Dissecting the genetics of early vigor to design drought-adapted wheat. Front. Plant Sci. 2022, 12, 754439. [Google Scholar] [CrossRef]
  15. Condon, A.G.; Richards, R.A.; Rebetzke, G.J.; Farquhar, G.D. Breeding for high water-use efficiency. J. Exp. Bot. 2004, 55, 2447–2460. [Google Scholar] [CrossRef] [PubMed]
  16. Reddy, K.R.; Hodges, H.F.; Mckinion, J.M. Crop modelling and applications: A cotton example. Adv. Agron. 1997, 59, 225–290. [Google Scholar] [CrossRef]
  17. Lawlor, D.W.; Tezara, W. Causes of decreased photosynthetic rate and metabolic capacity in water-deficient leaf cells: A critical evaluation of mechanisms and integration of processes. Ann. Bot. 2009, 103, 561–579. [Google Scholar] [CrossRef] [PubMed]
  18. Sanchez-Diaz, M.F.; Kramer, P.J. Behavior of corn and Sorghum under water stress and during recovery. Plant Physiol. 1971, 48, 613–616. [Google Scholar] [CrossRef] [PubMed]
  19. Wijewardana, C.; Henry, W.B.; Reddy, K.R. Evaluation of drought tolerant maize germplasm to induced drought stress. J. Miss. Acad. Sci. 2017, 62, 316–329. [Google Scholar]
  20. Mc Fadden, J.; Smith, D.; Wechsler, S.; Wallander, S. Development, Adoption, and Management of Drought-Tolerant Corn in the United States. A Report Summary form the Economic Research Service, USDA. 2019. Available online: https://www.ers.usda.gov/webdocs/publications/91103/eib-204.pdf?v=417 (accessed on 15 January 2024).
  21. Lone, A.A.; Jumaa, S.H.; Wijewardana, C.; Taduri, S.; Redona, E.D.; Reddy, K.R. Drought stress tolerance screening of elite American breeding rice genotypes using low-cost pre-fabricated mini-hoop modules. Agronomy 2019, 9, 199. [Google Scholar] [CrossRef]
  22. Hewitt, E.J. Sand and water culture methods used in the study of plant nutrition. Soil Sci. Soc. Am. J. 1953, 17, 301. [Google Scholar] [CrossRef]
  23. Popat, R.; Banakara, K. Package ‘doebioresearch’: Analysis of Design of Experiments for Biological Research. CRAN Repository, R Studio. 2020. Available online: https://cran.r-project.org/web/packages/doebioresearch/index.html (accessed on 27 November 2023).
  24. Wickham, H. ggplot2: Elegant Graphics for Data Analysis; Springer: New York, NY, USA, 2016; ISBN 978-3-319-24277-4. Available online: https://ggplot2.tidyverse.org (accessed on 25 December 2023).
  25. Seleiman, M.F.; Al-Suhaibani, N.; Ali, N.; Akmal, M.; Alotaibi, M.; Refay, Y.; Dindaroglu, T.; Abdul-Wajid, H.H.; Battaglia, M.L. Drought stress impacts on plants and different approaches to alleviate its adverse effects. Plants 2021, 10, 259. [Google Scholar] [CrossRef] [PubMed]
  26. Wolny, E.; Betekhtin, A.; Rojek, M.; Braszewska-Zalewska, A.; Lusinska, J.; Hasterok, R. Germination and the early stages of seedling development in Brachypodium distachyon. Int. J. Mol. Sci. 2018, 19, 2916. [Google Scholar] [CrossRef] [PubMed]
  27. Verslues, P.E.; Agarwal, M.; Katiyar-Agarwal, S.; Zhu, J.; Zhu, J.K. Methods and concepts in quantifying resistance to drought, salt and freezing, abiotic stresses that affect plant water status. Plant J. 2006, 45, 523–539. [Google Scholar] [CrossRef] [PubMed]
  28. Mafakheri, A.; Siosemardeh, A.; Bahramnejad, B.; Struik, P.C.; Sohrabi, Y. Effect of drought stress on yield, proline and chlorophyll contents in three chickpea cultivars. Aust. J. Crop Sci. 2010, 4, 580–585. Available online: https://edepot.wur.nl/159961 (accessed on 3 January 2024).
  29. Chen, D.; Wang, S.; Xiong, B.; Cao, B.; Deng, X. Carbon/nitrogen imbalance associated with drought-induced leaf senescence in Sorghum bicolor. PLoS ONE 2015, 10, 0137026. [Google Scholar] [CrossRef] [PubMed]
  30. Zaefyzadeh, M.; Quliyev, R.A.; Babayeva, S.M.; Abbasov, M.A. The effect of the interaction between genotypes and drought stress on the superoxide dismutase and chlorophyll content in durum wheat landraces. Turk. J. Biol. 2009, 33, 1–7. [Google Scholar] [CrossRef]
  31. Yang, X.; Lu, M.; Wang, Y.; Wang, Y.; Liu, Z.; Chen, S. Response mechanism of plants to drought stress. Horticulturae 2021, 7, 50. [Google Scholar] [CrossRef]
  32. Paknejad, F.; Nasri, M.; Moghadam, H.R.T.; Zahedi, H.; Alahmadi, M.J. Effects of drought stress on chlorophyll fluorescence parameters, chlorophyll content and grain yield of wheat cultivars. J. Biol. Sci. 2007, 7, 841–847. [Google Scholar] [CrossRef]
  33. Osakabe, Y.; Osakabe, K.; Shinozaki, K.; Tran, L.S. Response of plants to water stress. Front. Plant Sci. 2014, 5, 86. [Google Scholar] [CrossRef] [PubMed]
  34. Li, B.; Fan, R.; Sun, G.; Sun, T.; Fan, Y.; Bai, S.; Guo, S.; Huang, S.; Liu, J.; Zhang, H.; et al. Flavonoids improve drought tolerance of maize seedlings by regulating the homeostasis of reactive oxygen species. Plant Soil 2021, 461, 389–405. [Google Scholar] [CrossRef]
  35. Mishra, N.; Jiang, C.; Chen, L.; Paul, A.; Chatterjee, A.; Shen, G. Achieving abiotic stress tolerance in plants through antioxidative defense mechanisms. Front. Plant Sci. 2023, 14, 1110622. [Google Scholar] [CrossRef] [PubMed]
  36. Anjum, S.A.; Ashraf, U.; Tanveer, M.; Khan, I.; Hussain, S.; Shahzad, B.; Zohaib, A.; Abbas, F.; Saleem, M.F.; Ali, I.; et al. Drought induced changes in growth, osmolyte accumulation and antioxidant metabolism of three maize hybrids. Front. Plant Sci. 2017, 8, 69. [Google Scholar] [CrossRef] [PubMed]
  37. Dash, S.S.S.; Lenka, D.; Sahoo, J.P.; Tripathy, S.K.; Samal, K.C.; Lenka, D.; Panda, R.K. Biochemical characterization of maize (Zea mays L.) hybrids under excessive soil moisture stress. Cereal Res. Commun. 2022, 50, 875–884. [Google Scholar] [CrossRef]
  38. Hossain, M.A.; Hoque, M.A.; Burritt, D.J.; Fujita, M. Proline protects plants against abiotic oxidative stress: Biochemical and molecular mechanisms. In Oxidative Damage to Plants; Academic Press: Cambridge, MA, USA, 2014; pp. 477–522. [Google Scholar]
  39. Yousaf, M.I.; Riaz, M.W.; Shehzad, A.; Jamil, S.; Shahzad, R.; Kanwal, S.; Ghani, A.; Ali, F.; Abdullah, M.; Ashfaq, M.; et al. Responses of maize hybrids to water stress conditions at different developmental stages: Accumulation of reactive oxygen species, activity of enzymatic antioxidants and degradation in kernel quality traits. PeerJ 2023, 11, e14983. [Google Scholar] [CrossRef]
  40. Chen, S.; Wu, F.; Li, Y.; Qian, Y.; Pan, X.; Li, F.; Wang, Y.; Wu, Z.; Fu, C.; Lin, H.; et al. NtMYB4 and NtCHS1 are critical factors in the regulation of flavonoid biosynthesis and are involved in salinity responsiveness. Front. Plant Sci. 2019, 10, 178. [Google Scholar] [CrossRef]
  41. Kovinich, N.; Kayanja, G.; Chanoca, A.; Otegui, M.S.; Grotewold, E. Abiotic stresses induce different localizations of anthocyanins in Arabidopsis. Plant Signal. Behav. 2015, 10, e1027850. [Google Scholar] [CrossRef]
  42. Maritim, T.K.; Korir, R.K.; Nyabundi, K.W.; Wachira, F.N.; Kamunya, S.M.; Muoki, R.C. Molecular regulation of anthocyanin discoloration under water stress and high solar irradiance in pluckable shoots of purple tea cultivar. Planta 2021, 254, 85. [Google Scholar] [CrossRef]
  43. Chen, X.; Zhu, Y.; Ding, Y.; Pan, R.; Shen, W.; Yu, X.; Xiong, F. The relationship between characteristics of root morphology and grain filling in wheat under drought stress. PeerJ 2021, 9, e12015. [Google Scholar] [CrossRef]
  44. Pham, A.T.; Maurer, A.; Pillen, K.; Brien, C.; Dowling, K.; Berger, B.; Eglinton, J.K.; March, T.J. Genome-wide association of barley plant growth under drought stress using a nested association mapping population. BMC Plant Biol. 2019, 19, 134. [Google Scholar] [CrossRef] [PubMed]
  45. Waheed, R.; Deeba, F.; Zulfiqar, F.; Moosa, A.; Nafees, M.; Altaf, M.A.; Arif, M.; Siddique, K.H.M. Physiology and growth of newly bred Basmati rice lines in response to vegetative-stage drought stress. Front. Plant Sci. 2023, 14, 1172255. [Google Scholar] [CrossRef] [PubMed]
  46. Patmi, Y.S.; Pitoyo, A.; Solichatun; Sutarno. Effect of drought stress on morphological, anatomical, and physiological characteristics of Cempo Ireng Cultivar Mutant Rice (Oryza sativa L.) strain 51 irradiated by gamma-ray. J. Phys. Conf. Ser. 2020, 1436, 012015. [Google Scholar] [CrossRef]
  47. Werner, C.; Correia, O.; Beyschlag, W. Two different strategies of Mediterranean macchia plants to avoid photo-inhibitory damage by excessive radiation levels during summer drought. Acta Oecologica 1999, 20, 15–23. [Google Scholar] [CrossRef]
  48. Xu, K.; Yang, D.; Yang, H.; Li, Z.; Qin, Y.; Shen, Y. Spatio-temporal variation of drought in China during 1961–2012: A climatic perspective. J. Hydrol. 2015, 526, 253–264. [Google Scholar] [CrossRef]
  49. Sehgal, A.; Sita, K.; Siddique, K.H.; Kumar, R.; Bhogireddy, S.; Varshney, R.K.; Rao, B.H.; Nair, R.M.; Prasad, P.V.V.; Nayyar, H. Drought or/and heat-stress effects on seed filling in food crops: Impacts on functional biochemistry, seed yields, and nutritional quality. Front. Plant Sci. 2018, 9, 1705. [Google Scholar] [CrossRef]
Figure 1. Pre-fabricated and modular mini-hoop structures are used in this study to assess corn hybrids’ response to drought during the early season.
Agriculture 14 00425 g001
Figure 2. Average daily soil moisture content of three drought treatments: control (100%), mild (DS1, 66%), and moderate (DS2, 33%) stress conditions during the corn experiment.
Agriculture 14 00425 g002
Figure 3. Drought stress effect on physiological parameters, (A) chlorophyll content (µg cm−2), (B) flavonoid index, (C) anthocyanin index, (D) nitrogen balance index, and (E) maximum quantum efficiency or yield (Fv/Fm). Control (100% irrigation), mild (DS1, 66% irrigation), and moderate (DS2, 33% irrigation). The letters above the boxes indicate the mean separation based on LSD. The values below the boxplot indicate the percentage reduction compared to the control.
Agriculture 14 00425 g003
Figure 4. Drought stress effect on plant growth parameters, (A) plant height (cm), (B) leaves (no. plant−1), (C) leaf area (cm2 plant−1). Control (100% irrigation), mild (DS1, 66% irrigation), and moderate (DS2, 33% irrigation). The letters above the boxes indicate the mean separation based on LSD. The values below the boxplot indicate the percentage reduction compared to the control.
Agriculture 14 00425 g004
Figure 5. Drought stress effect on plant growth parameters, (A) leaf weight (g plant−1), (B) stem weight (g plant−1), (C) total plant weight (g plant−1), (D) shoot weight (g plant−1), (E) root weight (g plant−1), and (F) root/shoot ratio. Control (100% irrigation), mild (DS1, 66% irrigation), and moderate (DS2, 33% irrigation). The letters above the boxes indicate the mean separation based on LSD. The values below the boxplot indicate the percentage reduction compared to the control.
Agriculture 14 00425 g005
Figure 6. Drought stress effect on root growth parameters, (A) root tips (no. plant−1), (B) root forks (no. plant−1*100), (C) root crossings (no. plant−1), (D) root length (cm plant−1), (E) root surface area (cm2 plant−1), and (F) root volume (cm3 plant−1). Control (100% irrigation), mild (DS1, 66% irrigation), and moderate (DS2, 33% irrigation). The letters above the boxes indicate the mean separation based on LSD. The values below the boxplot indicate the percentage reduction compared to the control.
Agriculture 14 00425 g006
Figure 7. The principal component analysis (PCA) of 19 corn hybrids, (A) the arrangement of shoot-, root-, and biomass-related traits in the first two principal components (PC1 and PC2) in drought stress, and (B) the classification of corn hybrids based on the factor scores of first (PC1) and second (PC2) principal components. The four quadrants represent corn hybrid grouping, and (C) correlations (Cor) between variables, contribution (Cont) of the variables (%), and factors to the principal components. PH: plant height; LN: leaf number; LA: leaf area; LDW: leaf dry weight; ShDW: shoot dry weight; StDW: stem dry weight; RDW: root dry weight; TDW: total dry weight; RS: root/shoot ratio; TRL: total root length; RSA: root surface area; RV: root volume; RTs: root tips; RFs: root forks; RCs: root crossings; CHL: chlorophyll content; FLA: flavonoid index; Anth: anthocyanin index; NBI: nitrogen balance index; Fv/Fm: maximum quantum efficiency.
Agriculture 14 00425 g007
Figure 8. Relationship between combined drought stress response index and physiology, shoot, or root drought response index.
Agriculture 14 00425 g008
Figure 9. Bubble plot of 19 corn hybrids’ drought-stress response indices; calculated from the physiology-, shoot- and root-drought stress response indices.
Agriculture 14 00425 g009
Figure 10. Corn seedlings’ response to drought stress (the left section shows well-watered seedlings with shoot and root growth with proper cell components, and the right section shows the seedlings grown under water stress conditions). The illustration was created with BioRender.com. The seedlings under drought stress have reduced plant height, leaf number, chlorophyll content, nitrogen balance index (NBI), and total biomass while increasing the cell’s root-to-shoot ratio and antioxidant content.
Agriculture 14 00425 g010
Table 1. List of corn hybrids and their origin.
HybridCompany and Location
A6499AgriGold, AgReliant Genetics, St. Francisville, IL, USA
A6659AgriGold, AgReliant Genetics, St. Francisville, IL, USA
A6711AgriGold, AgReliant Genetics, St. Francisville, IL, USA
1717Armor Seed, Jonesboro, AR, USA
A7766Augusta Seed Corporation, Verona, VA, USA
6640Croplan, Saint Paul, MN, USA
DKC67-44Dekalb Genetics Corporation, DeKalb, IL, USA
DKC67-72Dekalb Genetics Corporation, DeKalb, IL, USA
DKC68-26Dekalb Genetics Corporation, DeKalb, IL, USA
DG2888Delta Grow Seed Co. Inc., England, AR, USA
D57VP51Dyna-Gro Seed, Inc., Geneseo, IL, USA
D57VP75Dyna-Gro Seed, Inc., Geneseo, IL, USA
MC4319MorCorn Hybrids, MFA Incorporated, Columbia, MO, USA
CNX157137Mycogen Hybrids, MFA Incorporated, Columbia, MO, USA
NK1405NK Seeds, Syngenta, St. Gabriel, LA, USA
P1316Pioneer Corporation, Springboro, OH, USA
PGY7111Progeny AG Products, Wynne, AR, USA
PGY7215Progeny AG Products, Wynne, AR, USA
REV25BHR26Terral Seed Inc., Lake Providence, LA, USA
Table 2. Analysis of variance of drought treatments (D), hybrids (H), and their interactions (D × H) for physiological, shoot- and root-related traits of 19 corn hybrids.
ParametersDrought (D)Hybrids (H)D × H
Soil moisture content !***--
Plant height*******
Leaf number*NSNS
Leaf area*****NS
Leaf dry weight******NS
Stem dry weight******NS
Shoot dry weight******NS
Root dry weight******NS
Total dry weight******NS
Root/shoot ratio********
Root length****NS
Root Surface area******NS
Root avg. diameter******NS
Length per volume****NS
Root volume*******
Root tips***NSNS
Root forks******NS
Root crossings*****NS
Chlorophyll*******
Flavonoid index********
Anthocyanin index******NS
NBI********
Fv/Fm****
*, **, and *** indicate significance at p < 0.05, p < 0.01, p < 0.001, respectively. ‘NS’ indicates nonsignificant. ! Soil moisture content was only measured daily from three drought treatments, inserting the moisture probe randomly in five pots per treatment. One-way ANOVA was performed to test the statistical significance of drought (D) treatments. consequently, the consideration of hybrids (H) and D × H interactions was deemed irrelevant in the context of soil moisture content.
Disclaimer/Publisher’s Note: The statements, opinions and data contained in all publications are solely those of the individual author(s) and contributor(s) and not of MDPI and/or the editor(s). MDPI and/or the editor(s) disclaim responsibility for any injury to people or property resulting from any ideas, methods, instructions or products referred to in the content.

