Article

Bacteria Affect the Distribution of Soil-Dissolved Organic Matter on the Slope: A Long-Term Experiment in Black Soil Erosion

1
Heilongjiang Academy of Black Soil Conservation and Utilization, Harbin 150086, China
2
College of Land and Environment, Shenyang Agricultural University, Shenyang 110866, China
3
Institute of Plant Nutrition, Resources and Environment, Beijing Academy of Agricultural and Forestry Sciences, Beijing 100097, China
*
Authors to whom correspondence should be addressed.
Agriculture 2024, 14(3), 352; https://doi.org/10.3390/agriculture14030352
Submission received: 3 January 2024 / Revised: 27 January 2024 / Accepted: 29 January 2024 / Published: 22 February 2024
(This article belongs to the Special Issue Agricultural Soil Health, Erosion and Remediation)

Abstract

:
Soil erosion results in dissolved organic matter (DOM) loss and is one of the main paths of soil carbon loss. Bacteria affect the generation and transformation of DOM. However, the effect of bacteria on the composition and slope distribution of DOM has rarely been investigated under field conditions. Based on a long-term experiment of three gradients (3°, 5°, 8°) in a black soil erosion area of Northeast China, the content, composition, and source of DOM were studied. The results showed that the DOM of the 3° and 5° slope was enriched midslope, and the DOM of the 8° slope was enriched downslope. Parallel factor (PARAFAC) analysis indicated that the main substances in DOM were fulvic-like acid, humic-like acid, tryptophan-like protein, and soluble microbial metabolites. The upslope and downslope soils of 3° and 5° slopes showed high DOM bioavailability, while the downslope soil of the 8° slope showed high DOM bioavailability. The content of new DOM in downslope soil increased with the gradient. Bacteria played an important role in the synthesis and transformation of DOM and affected its composition and slope distribution. Verrucomicrobiota, Firmicutes, Planctomycetota, and Gemmatimonadota were the main factors affecting soil DOM. The results could be helpful in understanding the loss mechanism of DOM in eroded black soil and provide support for soil carbon sequestration.

1. Introduction

Black soils are rich in organic matter and are precious soil resources worldwide. The black soils in Northeast China are one of the four major black lands in the world. However, the erosion area of black soil in Northeast China accounts for over 20% of the total black soil area. The erosion area of sloping farmland accounts for 46% of the total erosion area of black soil in northeast China [1]. Erosion leads to substantial soil carbon loss, resulting in soil degradation [2]. Although dissolved organic matter (DOM) accounts for only a small part of soil organic carbon (SOC), the migration of DOM driven by water erosion is one of the main pathways of SOC loss due to its mobility and dissolvability [3]. Erosion changes the spatial distribution of soil DOM and further dramatically influences soil carbon pool storage [4]. Moreover, the selective adsorption of soil minerals and clay particles to DOM alters DOM composition in the process of erosion, and DOM composition exerts an important influence on SOC stability [5,6]. It has been suggested that protein components in DOM enhance the availability of SOC, while the enrichment of humus-like components in DOM limits the rate of SOC mineralization [7]. The slope gradient is a major factor affecting black soil erosion [8]; the slope gradient and slope position have interactive effects on SOC storage [9]. However, how the slope gradient affects the distribution of soil DOM in different slope positions remains poorly understood.
DOM is the main carbon source of microorganisms, with more than 85.2% of its components being utilized by microorganisms [10]. Soil microorganisms are also an important driving force in DOM formation and transformation [11]. Previous studies have found that bacteria dominate the transformation of DOM [12,13]. Bacteria can convert high-molecular-weight DOM into low-molecular-weight DOM, thereby changing the structural complexity of DOM [14,15]. Bacterial communities with different functions also change the transformation progress of DOM [16]. A previous study found that Proteobacteria and Firmicutes triggered the conversion of the humus-like acid into fulvic-like acid in sediment DOM and then degraded into protein-like substances and soluble microbial metabolites [17]. The humus-like acid and other complex components in DOM can be degraded by Chloroflexi and Bacteroidota [18,19]. Therefore, understanding the relationship between the composition and distribution of DOM and the bacterial community structure can provide insights into the biogeochemistry cycle of DOM in eroded landscapes.
In this study, based on 8-year long-term experiments in eroded black soil in Northeast China, we revealed the distribution characteristics of DOM and identified the interaction between DOM molecular composition and bacterial communities of different slope gradients. Three-dimensional excitation–emission matrix (3D–EEM) spectroscopy technology and parallel-factor (PARAFAC) analysis were used to explore the component information and source of DOM. High-throughput sequencing was used to analyze soil bacterial communities. We hypothesized that (1) erosion would change the distribution characteristics of both DOM content and DOM composition, and these changes induced by erosion would be regulated by slope gradients; and (2) there is a corresponding relationship between bacterial communities and DOM components, with the slope difference of bacterial community compositions and abundance affecting the distribution of DOM.

2. Materials and Methods

2.1. Study Area and Experimental Plot Setup

The study was carried out at a long-term monitoring test station for black soil erosion and cultivated land quality, which was established in 2012 in Keshan County (47°43′–48°18′ N, 126°01′–126°41′ E), Qiqihar City, Heilongjiang Province, China. In the 1°–8°erosion slope gradients, which are the most widely distributed black-soil, cultivated land in Northeast China [20], three gradients (3°, 5°, and 8°) were selected as the experimental setting. Each slope gradient was in a randomized block design with three replications, and the size of each plot was 5 × 20 m. All plots were longitudinal ridge slopes, and the crop system was soybean continuous cropping (one crop per year). Soybeans were planted in early May and harvested in early October each year. The aboveground straw residues were removed after harvest. Chemical fertilizer was applied as basal fertilizer, and each plot was applied with the same amount: 38 kg·hm−2 of urea, 150 kg·hm−2 of diammonium phosphate, and 60 kg·hm−2 of potassium sulfate.

2.2. Sample Collection

Soil samples were collected after soybean harvesting (10 October 2020). Each plot was divided into three slope positions: upslope, midslope, and downslope. Composite samples were obtained by mixing five topsoil subsamples (0–20 cm) from the same position of the same slope gradient. Each soil sample was divided into two subsamples after removing plant residues and stones: (1) soil samples that were air-dried, ground, and screened through a 2 mm sieve before soil DOM extraction [21]; and (2) fresh soil samples that were screened through a 2 mm sieve and stored at −80 °C before microbial sequencing. All analyses were conducted in triplicate.

2.3. DOM Extraction

DOM was extracted following the method described by Jiang et al. [21] and Tang et al. [22]. A total of 3 g of soil samples was mixed with 30 mL of Milli-Q water and then shaken on a horizontal shaking device (180 rpm) for 24 h at 25 °C. The suspension was centrifuged at 4000× g for 20 min and filtered through 0.45 μm filters to isolate the DOM.

2.4. UV–Visible Spectrum Determination

DOM samples were scanned using a UV–visible spectrophotometer (T6, Purkinje, Beijing, China) with 10 mm quartz cell in the scanning wavelength ranging from 200 nm to 700 nm. Milli-Q water was used as a blank. Specific UV–Vis absorbance at 254 nm (SUVA254) was the ratio of UV absorbance at 254 nm to DOC concentration [22]. SUVA254 is used to indicate the carbon content of aromatics. It is directly proportional to the molecular weight of DOM, aromatic carbon content, and aromatization degree [23].

2.5. Fluorescence Spectrum Determination and Analysis

DOM concentration was characterized by DOC and determined using a TOC analyzer (multi N/C3100, Analytikjena, Jena, Germany). The DOC concentration of all samples was diluted to 10 mg·L−1 with Milli-Q water before fluorescence scanning [24]. The three-dimensional excitation–emission matrix (3D–EEM) fluorescence spectrum of DOM was scanned using a fluorescence spectrophotometer (F–7000, HITACHI, Tokyo, Japan) with 10 mm quartz four-pass cell. Excitation wavelength (Ex) of 200–550 nm (every 5 nm), emission wavelength (Em) of 250–600 nm (every 2 nm), and scanning speed of 2400 nm/min. The slit was 5 nm, and the response was 0.5 s. Milli-Q water was used as a blank.
Matlab 2013a V 8.1.0.430 (Math Works, Natick, MA, USA) was used to eliminate Raman scattering of the 3D–EEM fluorescence spectrum. EEM–PARAFAC was performed using the DOMFluor toolbox in MATLAB 2013a. A total of 27 samples (3 slope gradients × 3 positions × triplicate) were processed by EEM; the split half analysis was applied to determine the number of fluorescence components. The dataset was divided into 3 components by PARAFAC. The content of each component in DOM was evaluated with Fmax (maximum fluorescence intensity). The difference in DOM composition was analyzed by the relative percentage of Fmax.
Humification index (HIX) was calculated as the ratio of fluorescence intensity integral in the range of 435–480 nm and 300–345 nm at the excitation wavelength of 254 nm, representing the humification degree of humus [25]. Fn(355) was calculated as the maximum fluorescence intensity of emission wavelength between 440 nm and 470 nm when excitation wavelength was 355 nm, representing the relative concentration level of humic substances [26]. The freshness index (β:α) was calculated as the ratio of the fluorescence intensity at the emission wavelength of 380 nm to the maximum fluorescence intensity in the range of 420–435 nm when the excitation wavelength was 310 nm. β represented fresh DOM, and α represented DOM with high degree of humification [27]. The fluorescence index (FI) was calculated as the ratio of fluorescence intensity at 470 nm and 520 nm when the excitation wavelength was 370 nm. FI was used to identify the source of the DOM; an FI close to or greater than 1.9 indicated microbially derived substances and an FI close to or less than 1.4 indicated terrestrial SOM turnover [28].

2.6. Bacteria Characteristics Analysis

The primers 338F (ACTCCTACGGGAGGCAGCAG) and 806R (GGACTACHVGGGTWTCTAAT) were used to amplify the 16S rRNA gene from bacteria. Sequencing was performed on an Illumina Miseq platform at Majorbio Bio-Pharm Technology Co., Ltd., Shanghai, China. Alpha diversity analysis was performed using Mothur v 1.30.2, and the relative abundance of bacterial phyla was determined using Qiime v 1.9.1.

2.7. Statistical Analysis

Significance at p < 0.05 was analyzed using SPSS v 19.0 software (SPSS, Inc., Chicago, IL, USA). Pearson’s correlation analysis in the corrplot packages of R v 4.0.3 (The R Foundation, Vienna, Austria) was used to test associations between DOM and bacteria. Redundancy analysis (RDA) was used to examine the relationship between the contents of DOC, DOM fluorescence parameters, fluorescent components, bacterial alpha diversity index, and bacterial community abundance using CANOCO v 5.0 software (Microcomputer Power, Ithaca, NY, USA). Other graphs were drawn using Origin v 9 (Origin Lab Corporation, Northampton, MA, USA).

3. Results

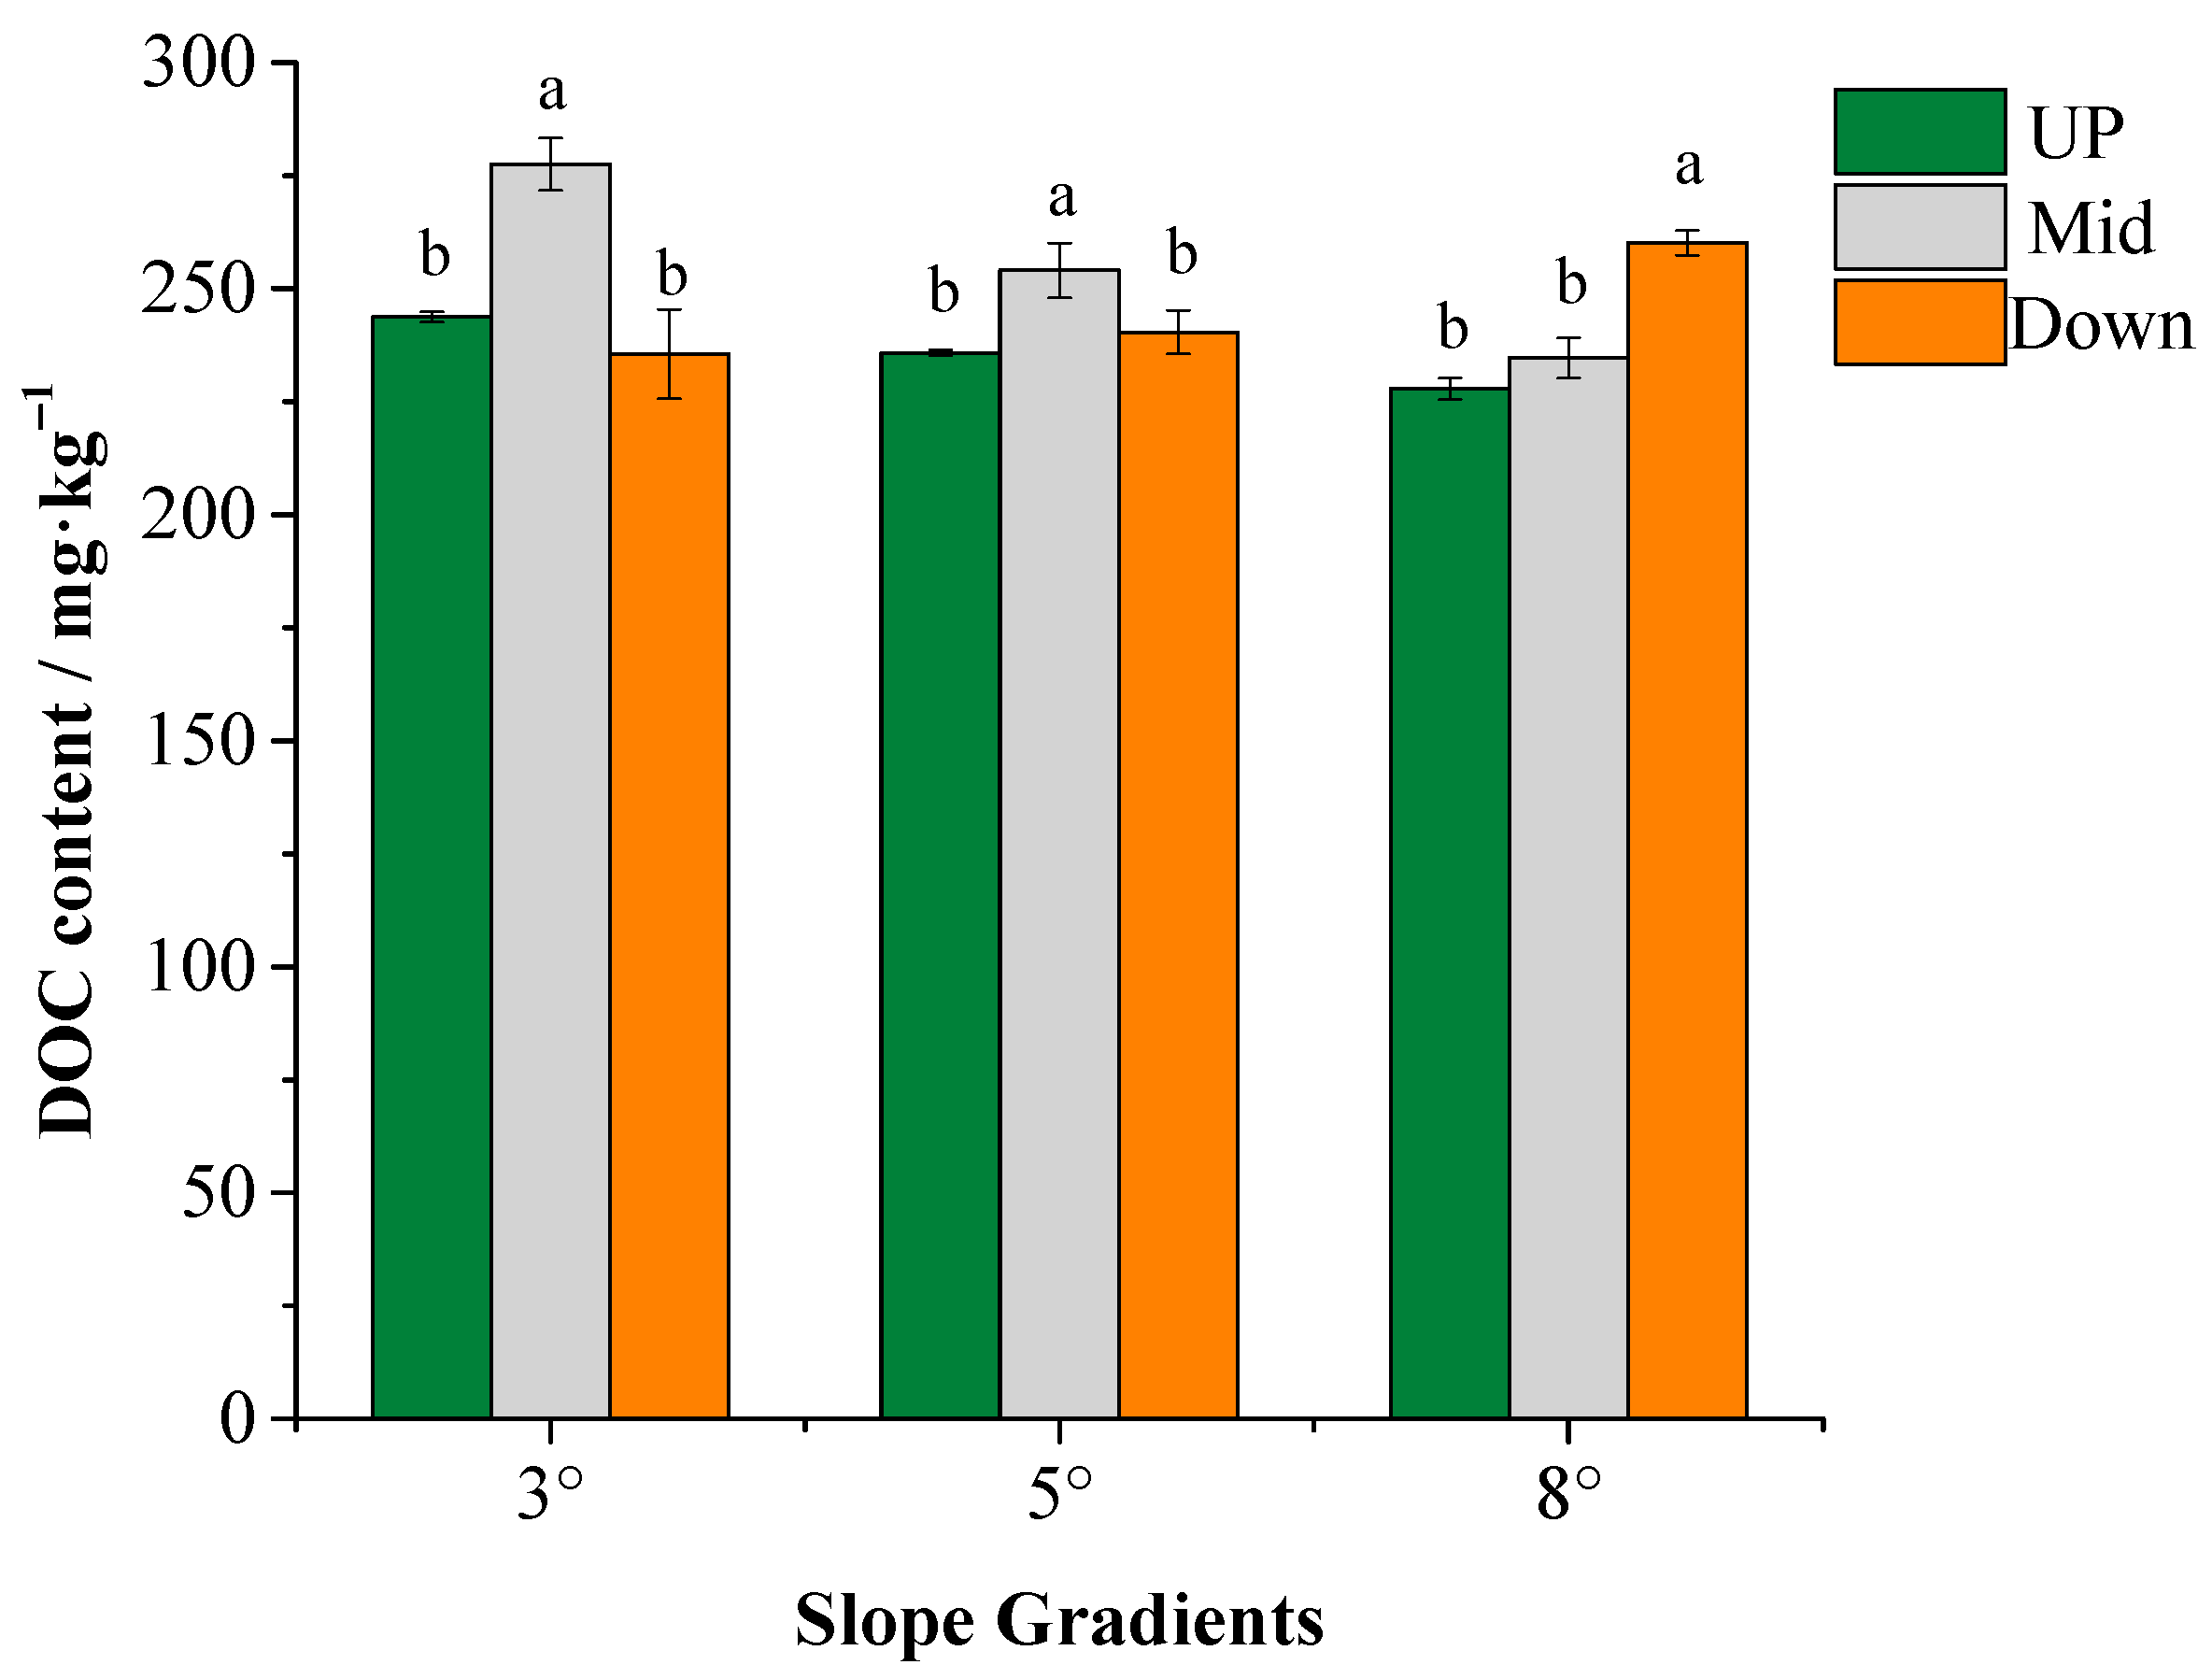
3.1. Characteristics of DOM Content and Composition

DOC was concentrated in the mid-slope on the 3° slope and 5° slope, while it was enriched in the down-slope on the 8° slope (Figure 1). Specifically, on the 3° slope and 5° slope, the mid-slope increased the DOC content by 13.88% and 7.76% compared to the up-slope soil, respectively. The DOC of the 8° slope was concentrated in the down-slope and increased by 14.21% and 10.88% compared to the up-slope and mid-slope, respectively.
The components of DOM were decomposed by PARAFAC analysis, and three fluorescent components were identified (Figure 2). C1 (component 1) was defined as a fulvic-like acid; it was transformed from terrestrial fulvic-like acid substances by microorganisms and composed of polymer protein and low-molecular-weight aromatic acids [29,30]. C2 (component 2) was defined as a humic-like acid and came from organic substances with stable structures and a high humification degree produced by the decomposition of plant residues [29,31,32]. C3 (component 3) was defined as tryptophan-like protein and soluble microbial metabolites produced by soil microbial activities and transformation processes [21,33].
The content and composition of DOM were affected by different slope positions (Figure 3a,b). The Fmax of components was the highest in the mid-slope on 3° and 5° slopes, and this value was the highest in the down-slope on 8° slope. The content and percentage of C2 were the highest in the mid-slope on the 3° slope. The content and percentage of C1 were the highest in the mid-slope on the 5° slope. The content and percentage of C3 were the highest in the down-slope on the 8° slope.

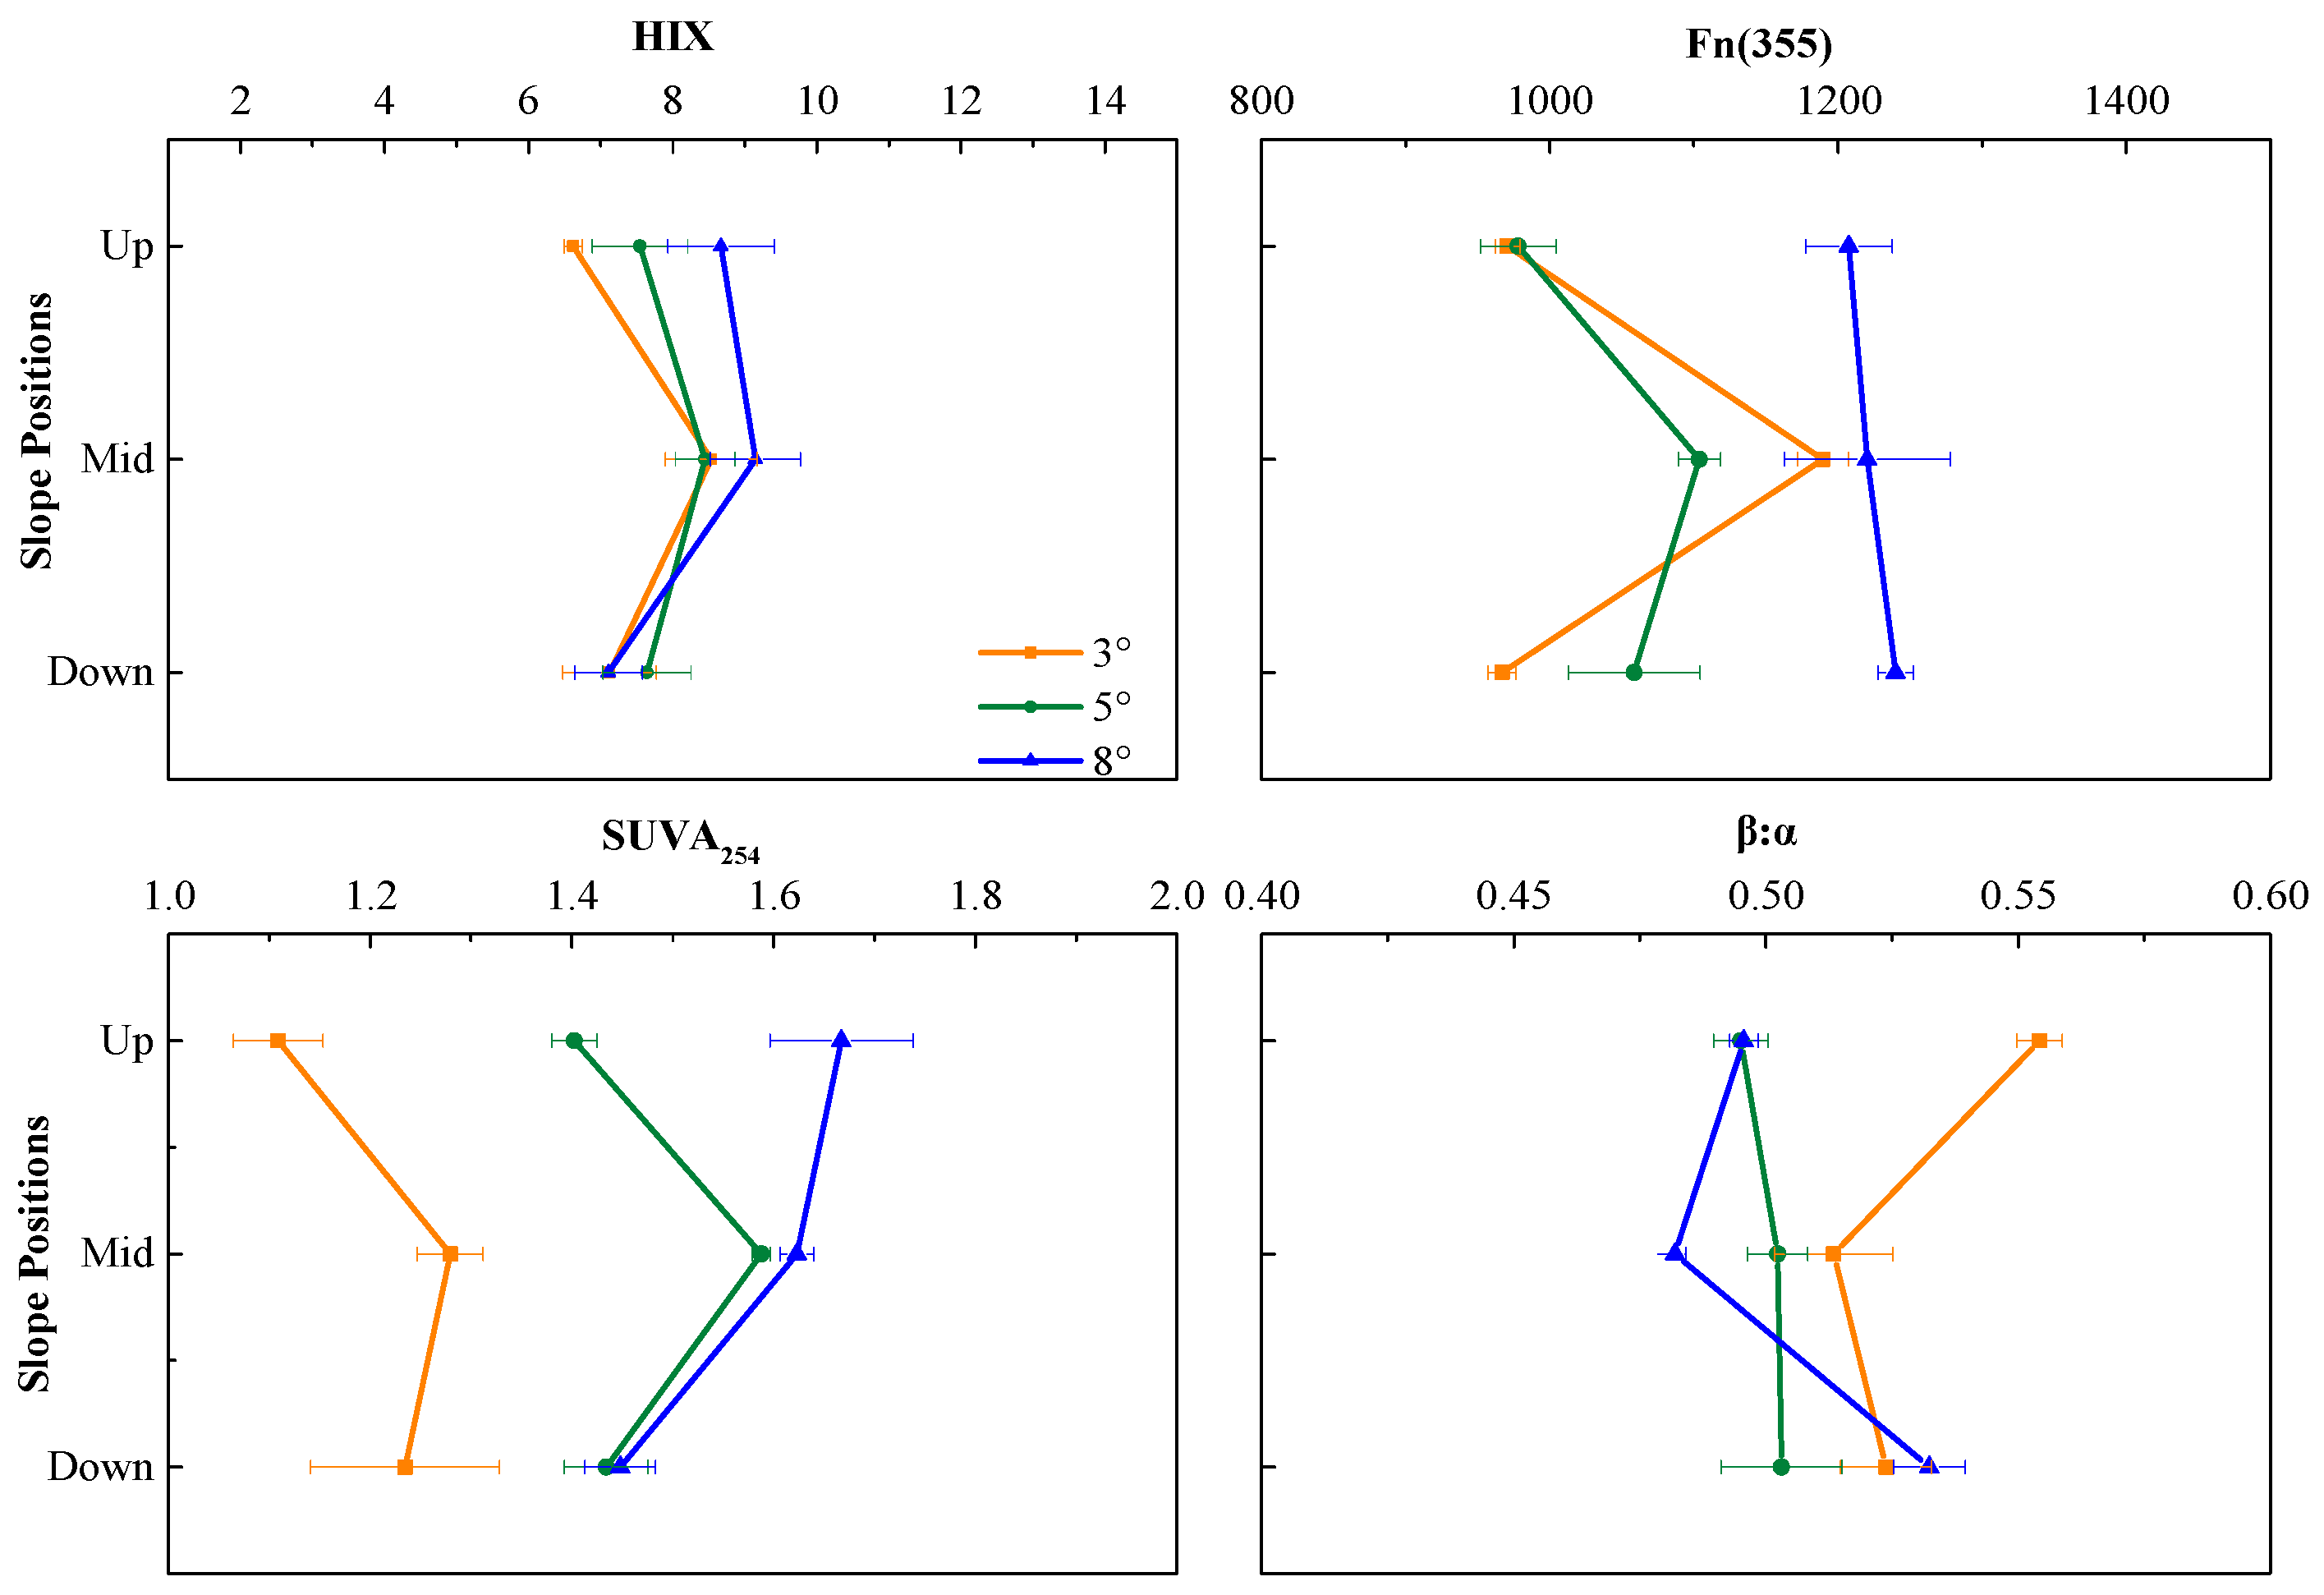
3.2. DOM Bioavailability

The HIX of DOM was the largest in the mid-slope on three slopes (Figure 4). However, the HIX was the lowest in the up-slope of 3° and 5° slopes and in the down-slope of 8° slope. The variation of Fn (355) and SUVA254 was consistent with HIX. The β:α of DOM in the mid-slope of the 3° slope was the lowest. In three positions of the 5° slope, the β:α of DOM were the same. The β:α of DOM in the down-slope of the 8° slope was the largest.

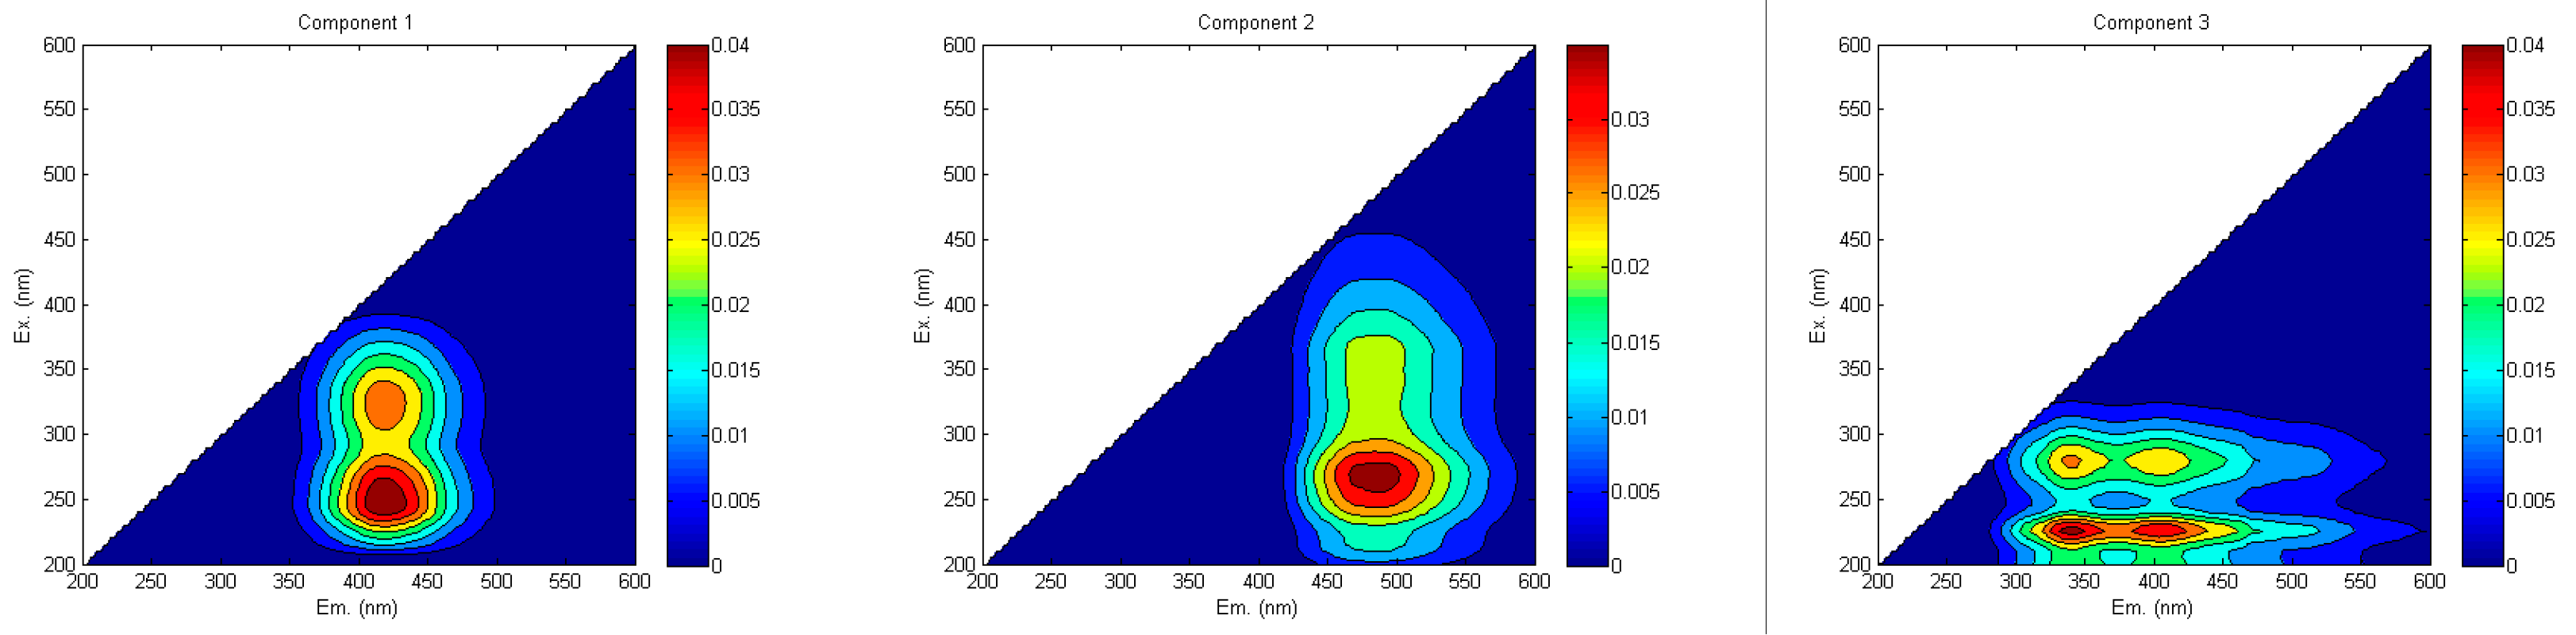
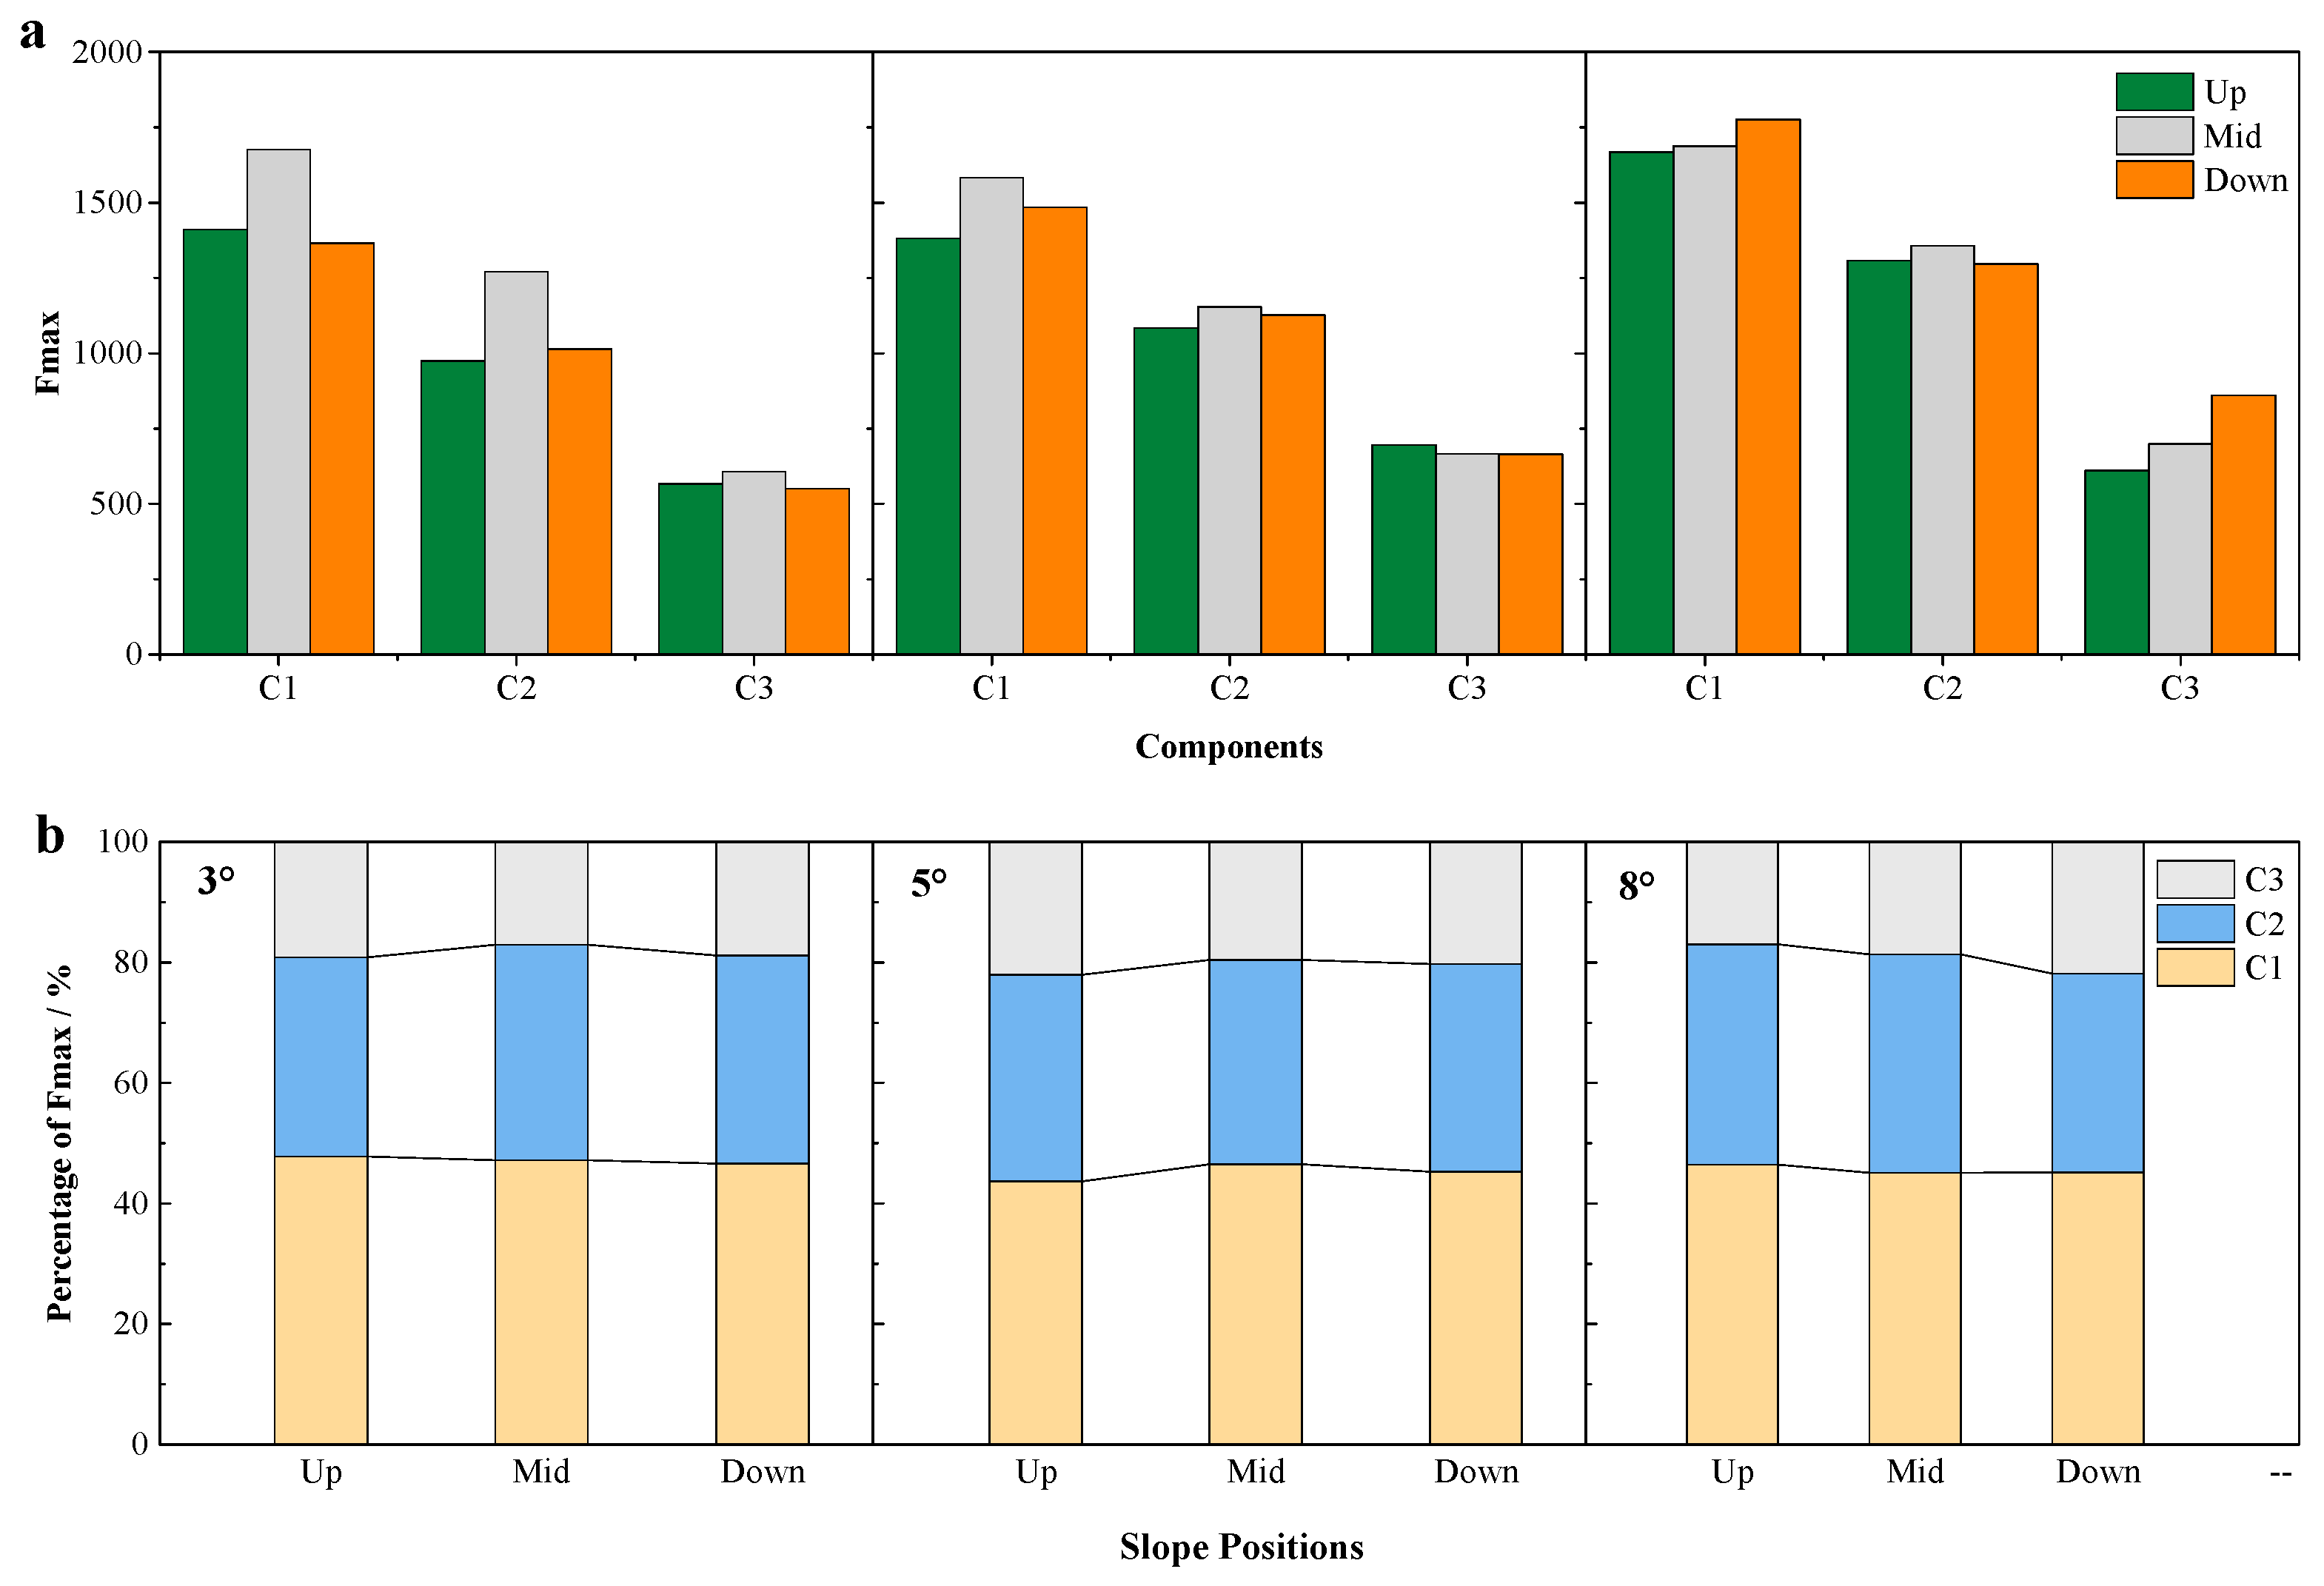
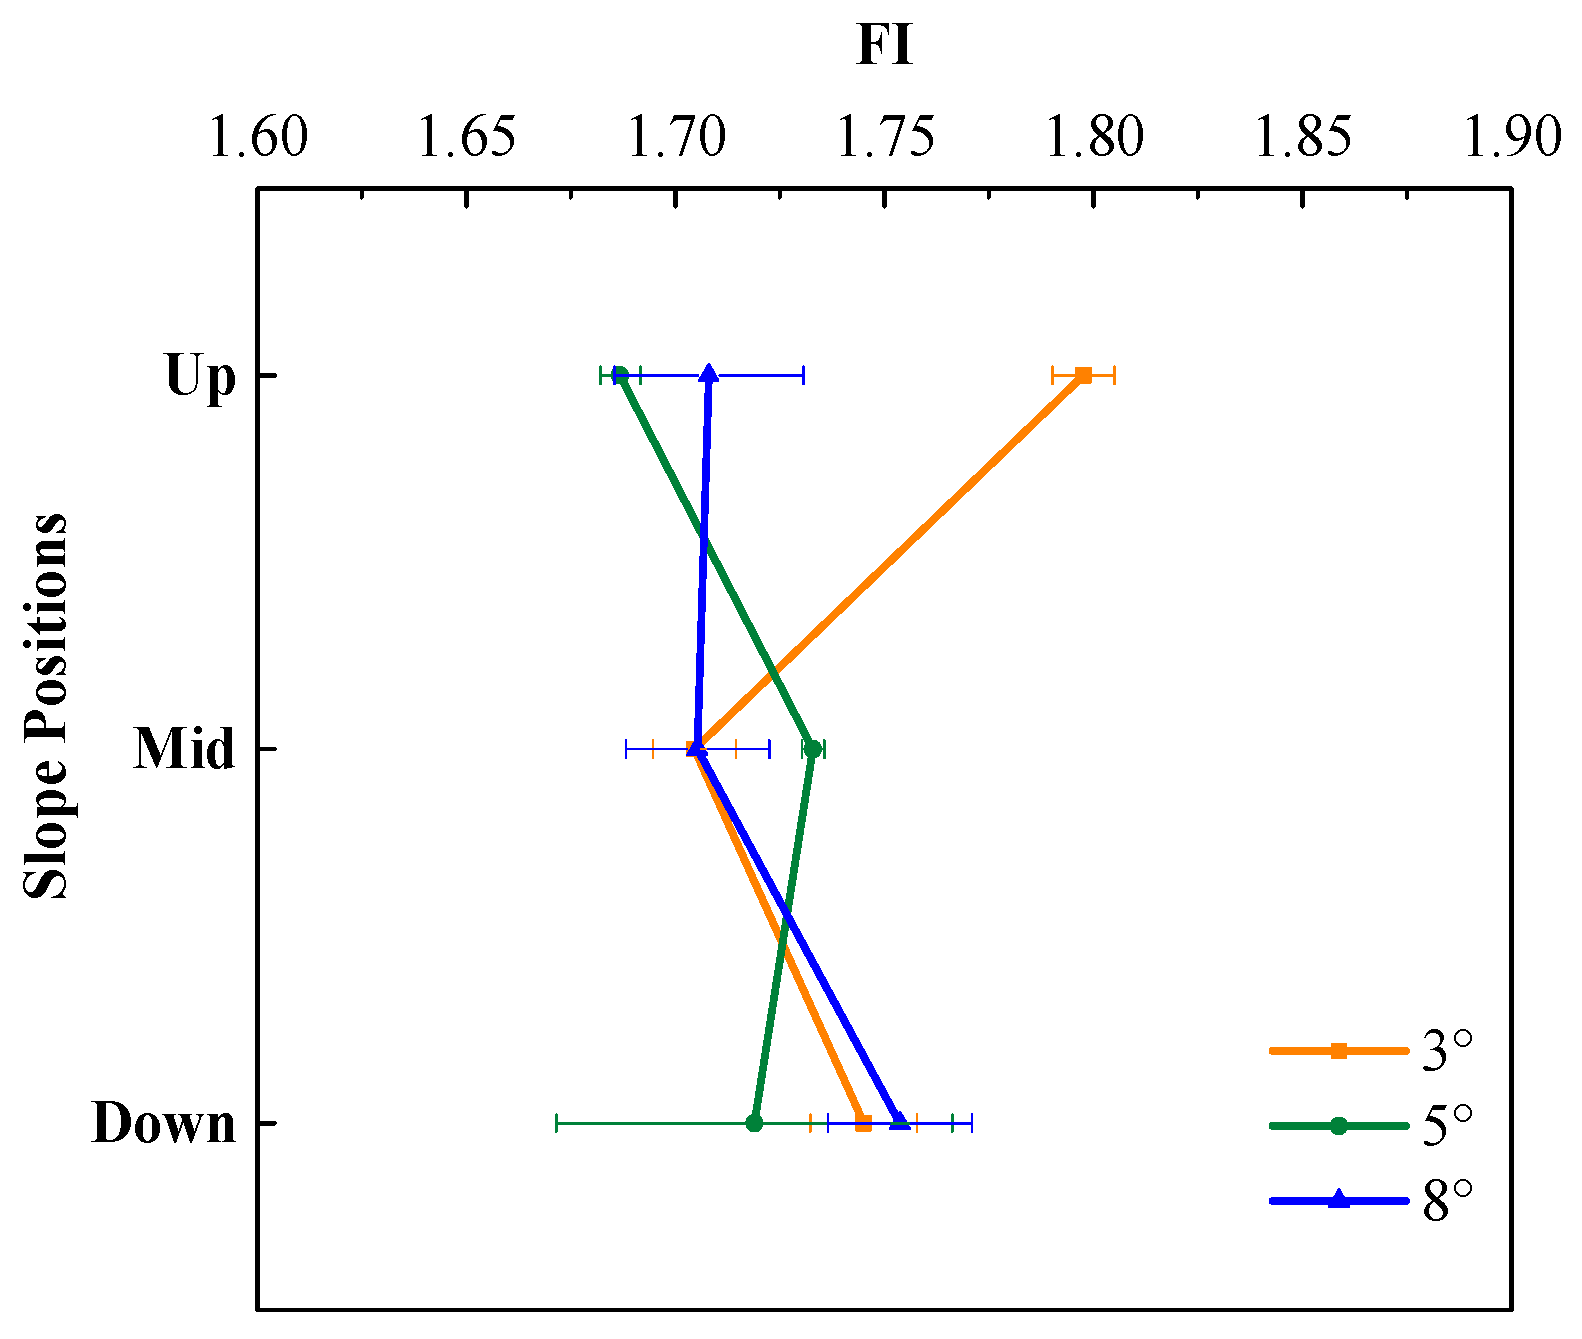
3.3. DOM Source Analysis

The average FI (1.69–1.80) was close to 1.9 (Figure 5), indicating all samples had similar sources. There were endogenous characteristics, mainly derived by microorganism metabolism but also affected by the interaction of microorganisms and terrestrially factors such as surface runoff and crop residues. Microorganisms directly or indirectly influenced the DOM transformation.

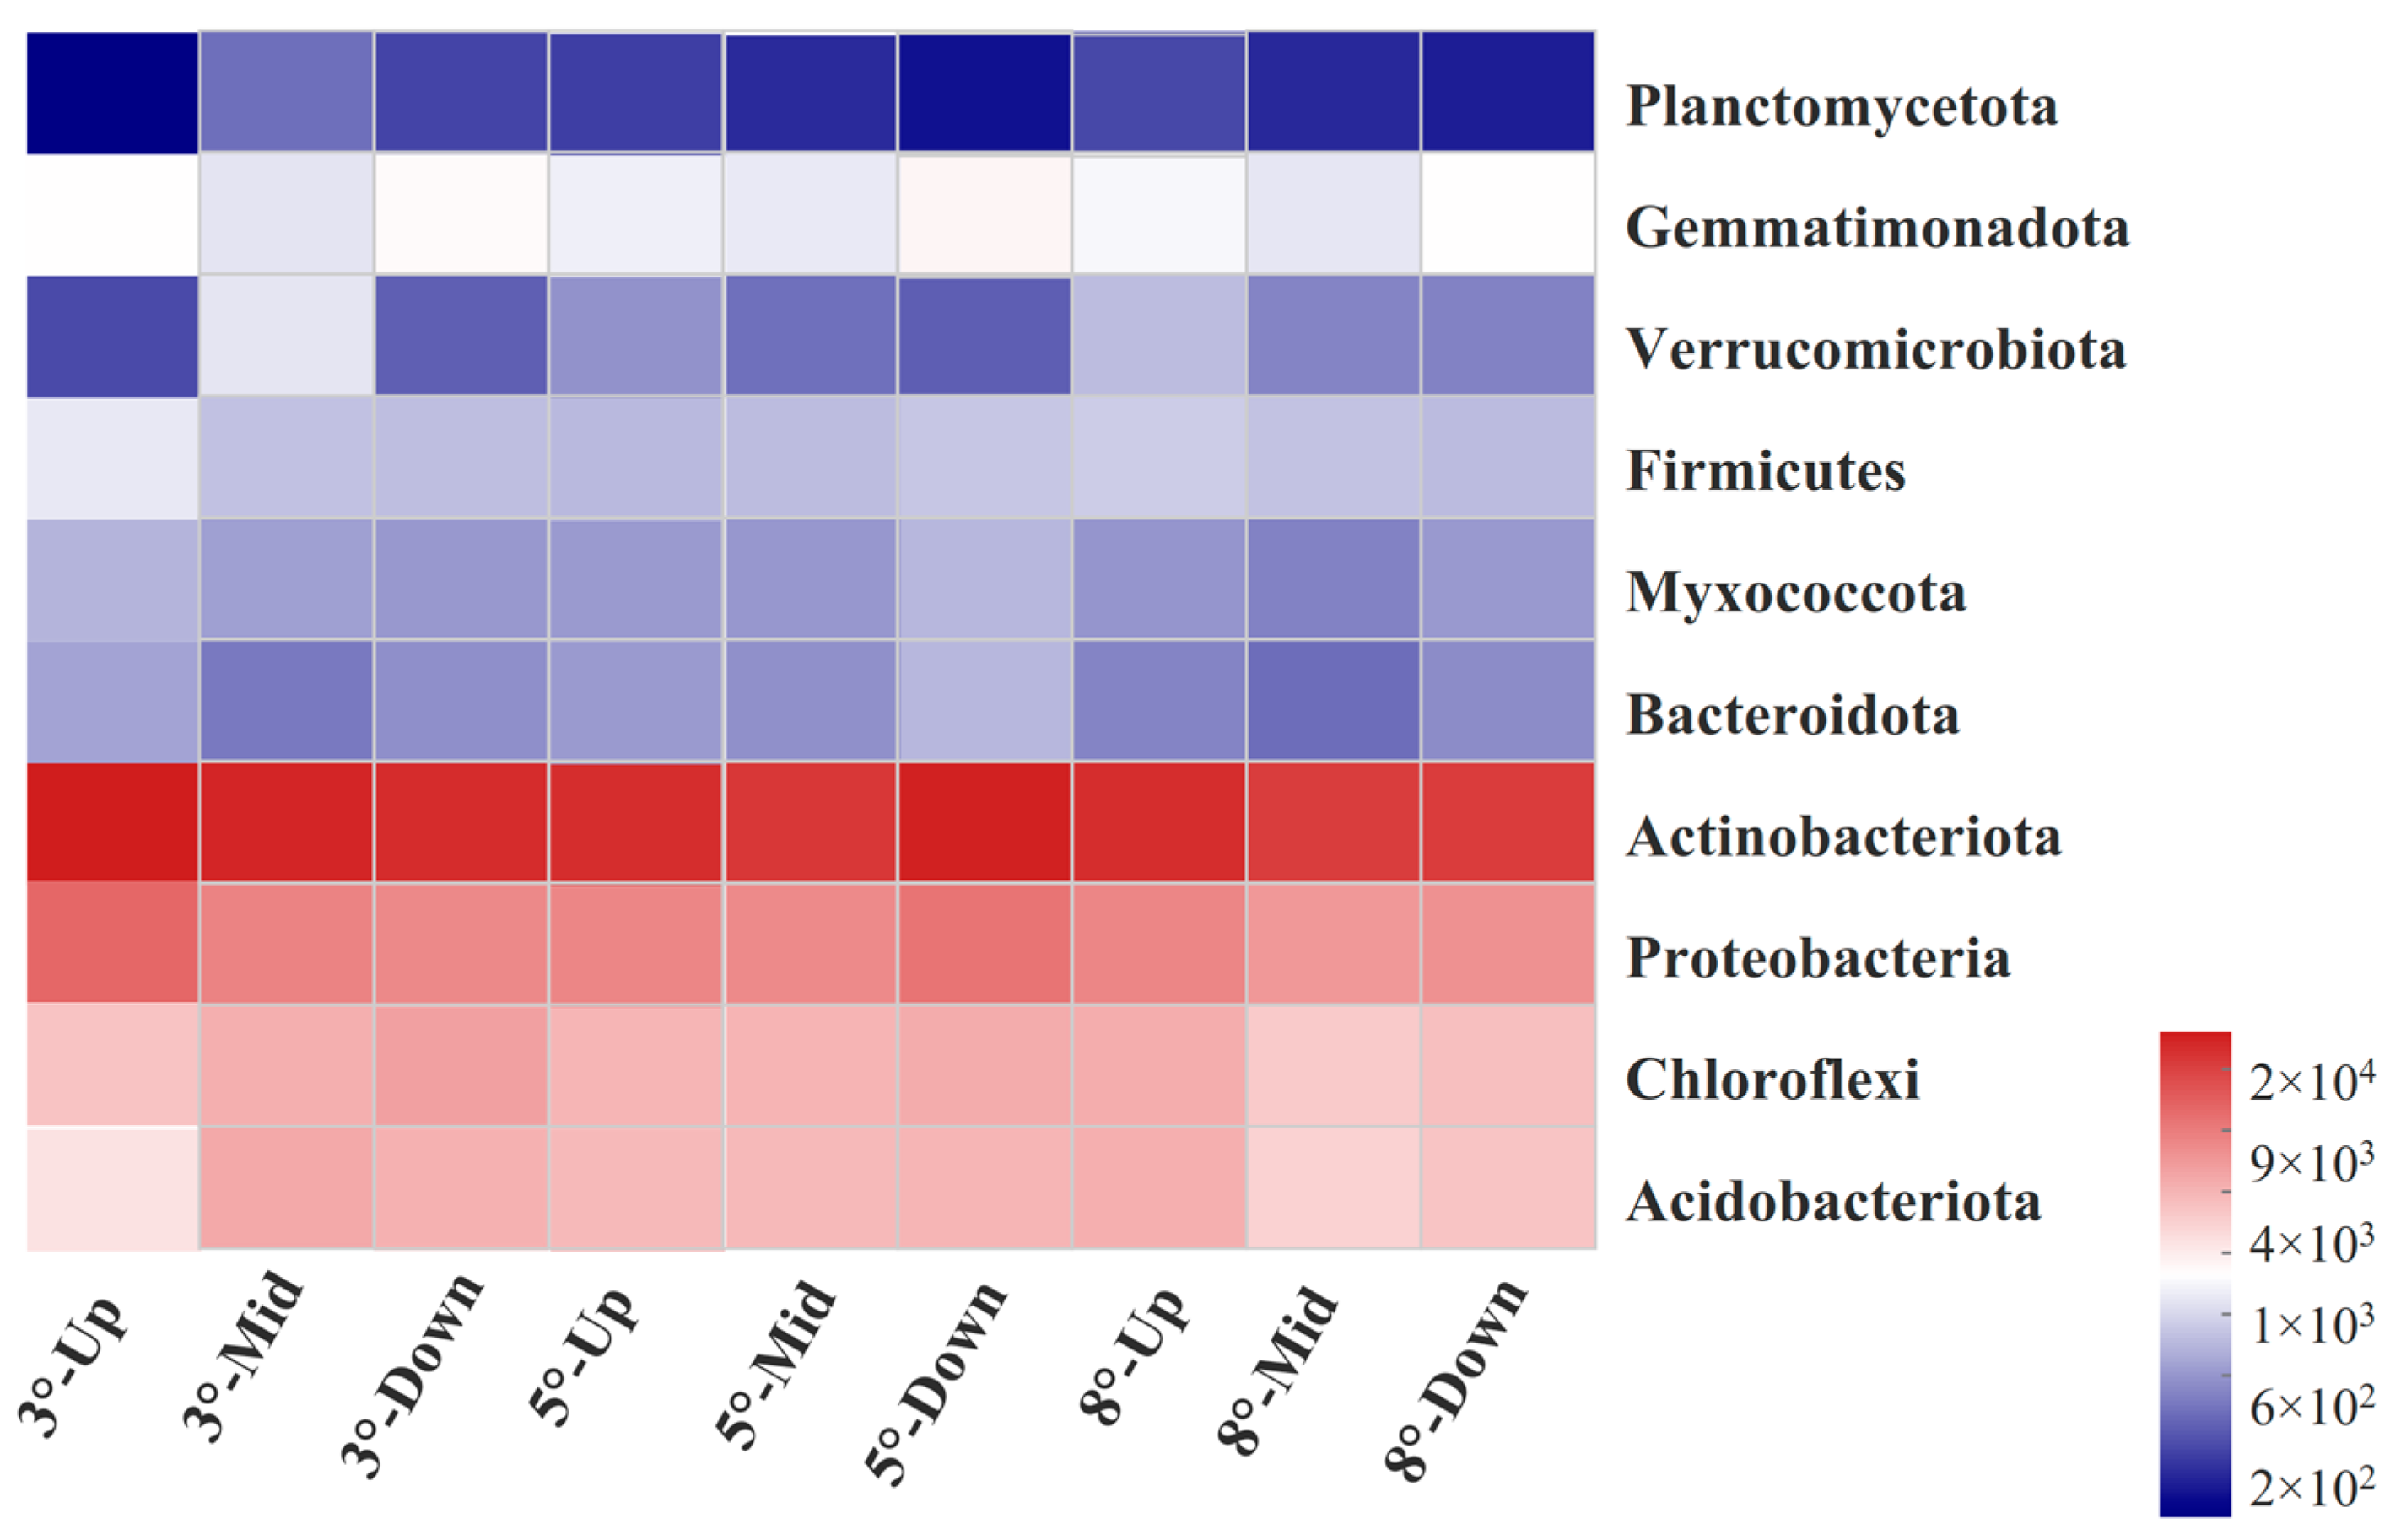
3.4. Soil Bacterial Community of Different Slopes

The coverage of all samples was over 97% (Table 1). The Shannon index and Simpson index showed that the bacterial community diversity was the largest in the mid-slope of the 3° and 5° slopes. The bacterial community diversity was larger in the up-slope and down-slope of the 8° slope. The Ace index and Chao index showed that the bacterial community richness was higher in the up-slope and mid-slope of the three slopes.
Actinobacteriota, Proteobacteria, Chloroflexi, Acidobacteriota, Gemmatimonadota, Firmicutes, Myxococcota, Bacteroidotas, Verrucomicrobiota, and Planctomycetota were the dominant phyla in the black soil (Figure 6). Their average relative abundances were 42.74%, 18.31%, 11.11%, 10.26%, 4.70%, 2.99%, 2.09%, 1.86%, 1.85%, and 0.85%, respectively.

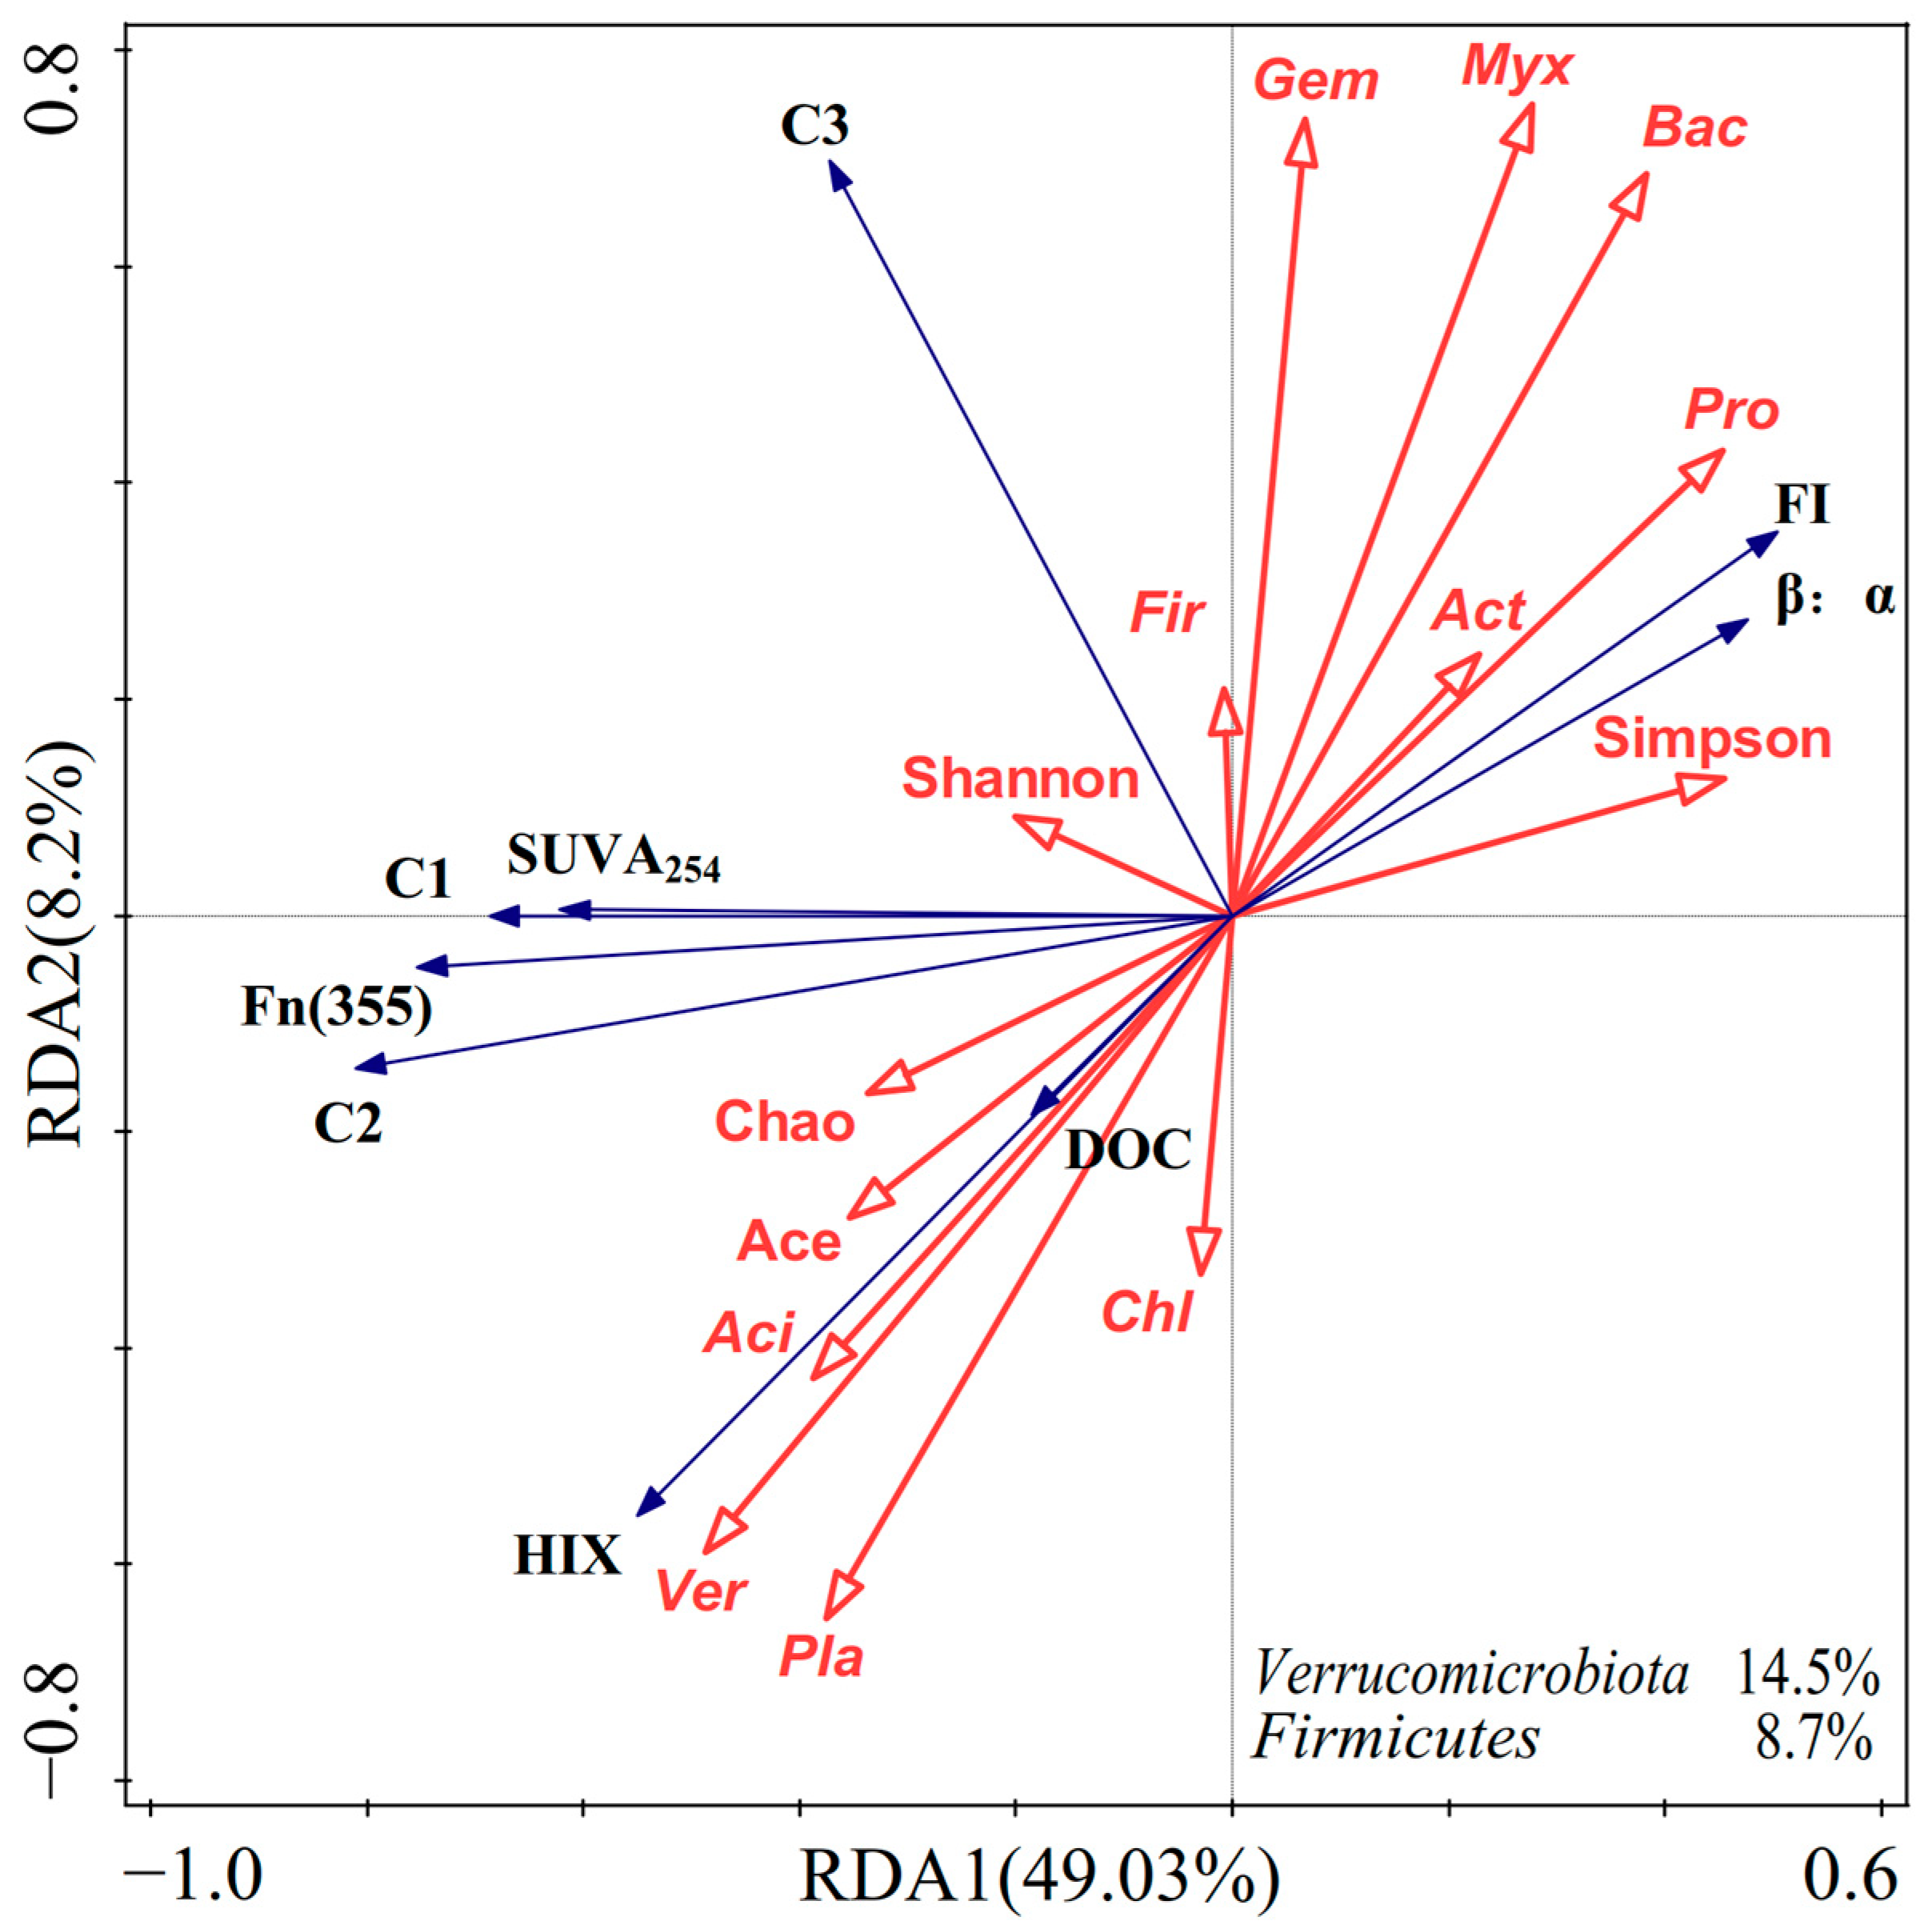
3.5. Relationship between Bacterial Community and DOM

The bacterial community diversity and richness were negatively correlated with the FI and β:α and positively correlated with HIX, Fn(355), and SUVA254 (Figure 7). Bacterial community diversity and community richness were positively correlated with the DOC content. The relative abundance of Actinobacteriota, Proteobacteria, Gemmatimonadota, Firmicutes, Myxococcota, and Bacteroidotas was positively correlated with FI, β:α, and C3 content and negatively correlated with HIX, Fn(355), SUVA254, DOC content, and C1 and C2 contents. The correlations between the relative abundance of Chloroflexi, Acidobacteriota, Verrucomicrobiota, Planctomycetota, and spectral parameters, DOC content, and fluorescence component contents were opposite.
The results of the redundancy analysis (Figure 8) showed that the total interpretation of DOM changed by microbial indicators was 57.23%. Verrucomicrobiota (14.5%) and Firmicutes (8.7%) were the predominant factors that affected soil DOC content and fluorescence structure. Planctomycetota (7%) and Gemmatimonadota (5.6%) also played important roles.

4. Discussion

4.1. Content and Composition of DOM Vary with the Slope Gradients

Erosion drove the migration of SOC fractions and changed the distribution pattern of SOC fractions in the process of soil stripping, transportation, and redistribution [34]. Previous studies have shown that DOC migrated in the down-slope direction under erosion [7]. However, we found that DOC did not completely migrate down the slope with the erosion (Figure 1). The DOC of the 3° and 5° slopes was mainly concentrated in the mid-slope, and the DOC of the 8° slope was concentrated in the down-slope. Novara et al. [35] also found that SOC was enriched in up-slope and mid-slope on the 6° slope under conventional tillage. We inferred that there was a critical slope gradient for the DOM content migration, and 8° was the critical slope gradient in this study. The DOC content of a gentle slope below 8° was concentrated in the mid-slope. The downward migration trend of DOM content increased with the erosion slope gradients.
The migration of soil organic carbon on gentle slopes is relatively slow, and as the slope length increases, more carbon decomposes during the migration process [36]. Wang et al. [37] showed that within the slope length range of 9–72 m, the abrasion of soil aggregates increases with the increase in slope length, which means that more active components in the DOM inside the aggregates are consumed. Under the same slope length, slope gradients affect the distribution of DOM components. The simple DOM components of the 8° slope migrate downward, leaving components with high aromatization degrees on the up-slope (Figure 3b). In the process of erosion, the active components of soil organic matter migrate with runoff preferentially, and the components containing carboxyl and aromatic carbon are retained in the soil preferentially [7,38]. However, although the DOC concentrated in the mid-slope of 3° and 5° slopes, tryptophan-like protein and soluble microbial metabolites (C3) did not accumulate simultaneously. This was different from the trend of synchronous downward migration of DOC and C3 on the 8° slope. C3 was metabolized by microorganisms and had the highest bioavailability [33]. The dynamics of HIX, SUVA254, Fn(355), and β:α also showed the hysteresis of DOM bioavailability component migration on 3° and 5° slopes. The humification degree and aromatization degree of DOM were the largest in the mid-slope of 3° and 5° slopes. In the 8 ° slope, the fresh DOM concentrated in the down-slope, where the DOM bioavailability was the strongest. The condensed polycyclic aromatic hydrocarbons of DOM in up-slope soil increased with slope gradient, and the oxygen-containing functional groups and bioavailability decreased accordingly. Tan et al. [39] found that humic-like acid could be deconstructed and transformed into fulvic-like acid. Yu et al. [40] and Kuzyakov [41] suggested that proteins in soil could be transformed into humic-like acids and fulvic-like acids. Humic-like acids and fulvic-like acids could also be decomposed into proteins when the microbial energy was sufficient. Under erosion, DOM migrated on the slope, accompanied by molecular decomposition and aggregation. The difference in DOM distributions on different slopes might be the result of microbial decomposition and synthesis.

4.2. Bacteria Affected the Slope Distribution of DOM

The sources of DOM can be divided into terrestrial sources and microbial sources. Terrestrial sources referring to DOM mainly come from the degradation of plant residues, surface runoff, and leaching Microbial sources referring to DOM mainly come from microbial metabolism and residue degradation [42]. DOM from microbial sources has fewer oxygen-containing substituents and a lower oxidation rate than terrestrial sources [30].
Bacteria are the dominant microorganisms that affect the formation and transformation of soil DOM. Bacteria decomposed DOM through metabolism and synthesized active components into stable metabolites through anabolism [43,44]. Figure 7 showed that the bacterial community with high diversity and richness was conducive to the formation of stable DOM and promoted the accumulation of DOC. Different bacterial communities had specific selections for the transformation and utilization of DOM components [45], and the process of DOM decomposition and synthesis mediated by them also varied. Therefore, the relative abundance of bacterial communities with DOM showed different correlations (Figure 7). According to the difference in microbial carbon metabolism potential, soil bacteria could be divided into two categories: oligotrophic bacteria and copiotrophic bacteria [46]. In the present study, copiotrophic bacteria, such as Proteobacteria, Actinobacteriota, Firmicutes, Bacteroidotas, and Gemmatimonadota [45], promoted the formation of tryptophan-like proteins and soluble microbial metabolites (C3). Oligotrophic bacteria, such as Chloroflexi, Acidobacteriota, Verrucomicrobiota, and Planctomycetota [47,48], promoted the formation of fulvic-like acid (C1) and humic-like acid (C2). Copiotrophic bacteria were conducive to the improvement in DOM bioavailability. On the contrary, Oligotrophic bacteria increased the humification of DOM and promoted the accumulation of DOC. The decomposition and synthesis of DOM were based on the balance of bacteria interactions with different nutritional strategies.
Verrucomicrobiota, Firmicutes, Planctomycetota, and Gemmatimonadota accounted for small proportions of soil bacteria but had more influence on the DOM (Figure 6 and Figure 8). Bacteria with low abundance were more sensitive to erosion and had greater influences on the change of SOC composition [49]. For these key bacteria (Figure 8), erosion retained the oligotrophic bacteria in up-slope soil and enriched the copiotrophic bacteria in down-slope soil (Figure 6). Verrucomicrobiota played an important role in degrading plant residues and converting greenhouse gases into biomass carbon [50,51]. Planctomycetota was usually associated with carbon fixation [52]. They promoted the synthesis and fixation of DOM. The relative abundance of these two bacteria decreased from the up-slope to the down-slope of 5° and 8° slopes, while it was the highest in the mid-slope of the 3° slope. Firmicutes could transform the active components in organic matter [53]. Gemmatimonadota played a major role in the degradation of soil organic matter and accelerated the metabolic cycle of organic matter [54]. Both of them were conducive to the metabolism and decomposition of DOM. Their distributions on the slopes were opposite to that of Verrucomicrobiota and Planctomycetota. The slope distribution of key bacteria explained the highest humification degree of DOM in the mid-slope of the 3° slope. It also explained that the DOM humification degree of the up-slope and the DOM bioavailability of the down-slope increased with slope gradients. The difference in soil properties caused by erosion provided a corresponding niche for bacterial communities with different nutritional strategies [55], resulting in the slope distribution difference of bacterial communities. The distribution difference of bacterial community structure influenced the change of DOC and DOM composition in different slope positions, forming a bacterial–DOM microenvironment interaction system.

5. Conclusions

The results from a long-term experiment carried out in black soil showed that 8° was a critical slope gradient for the differentiation of DOM. DOC was concentrated in the down-slope of the 8° slope but concentrated in the mid-slope of the 3° and 5° slopes. The high bioavailability components in DOM migrated to the down-slope of the 8° slope. The migration of high bioavailability components showed hysteresis in 3° and 5° slopes. The DOM of black soil under different erosion slope gradients had similar sources, and microorganisms played a key role. Erosion retained the oligotrophic bacteria in up-slope soil and enriched the copiotrophic bacteria in down-slope soil, resulting in differences in DOM composition. Verrucomicrobiota, Firmicutes, Planctomycetota, and Gemmatimonadota were the main factors causing the variety of black soil DOM under erosion.

Author Contributions

Conceptualization, S.C.; Methodology, L.S. and D.W.; Resources, L.S. and W.W.; Software, Z.S. and Z.G.; Supervision, Y.L. (Yumei Li) and J.Z.; Visualization, Y.L. (Yan Li); Writing—original draft, S.C.; Writing—review and editing, S.C., W.W., L.S., Z.S., Y.L. (Yumei Li), Z.G., J.Z., Y.L. (Yan Li) and D.W. All authors have read and agreed to the published version of the manuscript.

Funding

This research was supported by the National Key Research and Development Program of China (2022YFD1500903-1), the Key R&D Plan of Heilongjiang Province (JD22B002), the Program on Industrial Technology System of National Soybean (CARS–04–PS17), and the UNDP Project (cpr/21/401).

Data Availability Statement

Data are contained within the article.

Acknowledgments

We appreciate and thank the anonymous reviewers for their helpful comments that led to an overall improvement in the manuscript. We also thank the Journal Editor Board for their help and patience throughout the review process.

Conflicts of Interest

The authors declare no conflicts of interest.

References

  1. An, J.; Zheng, F.; Wang, B. Using 137Cs technique to investigate the spatial distribution of erosion and deposition regimes for a small catchment in the black soil region, Northeast China. Catena 2014, 123, 243–251. [Google Scholar] [CrossRef]
  2. Lal, R. Accelerated Soil erosion as a source of atmospheric CO2. Soil Tillage Res. 2018, 188, 35–40. [Google Scholar] [CrossRef]
  3. Jin, K.; Cornelis, W.M.; Schiette, W.; Lu, J.J.; Buysse, T.; Baert, G.; Wu, H.J.; Yao, Y.; Cai, D.X.; Jin, J.Y.; et al. Redistribution and loss of soil organic carbon by overland flow under various soil management practices on the Chinese Loess Plateau. Soil Use Manag. 2010, 24, 181–191. [Google Scholar] [CrossRef]
  4. Lal, R. Soil carbon sequestration to mitigate climate change. Geoderma 2004, 123, 1–22. [Google Scholar] [CrossRef]
  5. Guggenberger, G.; Kaiser, K. Dissolved organic matter in soil: Challenging the paradigm of sorptive preservation. Geoderma 2003, 113, 293–310. [Google Scholar] [CrossRef]
  6. Ramos, M.; Martínez-Casasnovas, J. Nutrient losses by runoff in vineyards of the Mediterranean Alt Penedès region (NE Spain). Agric. Ecosyst. Environ. 2006, 113, 356–363. [Google Scholar] [CrossRef]
  7. Zhang, X.; Li, Z.; Nie, X.; Huang, M.; Wang, D.; Xiao, H.; Liu, C.; Peng, H.; Jiang, J.; Zeng, G. The role of dissolved organic matter in soil organic carbon stability under water erosion. Ecol. Indic. 2019, 102, 724–733. [Google Scholar] [CrossRef]
  8. Cui, M.; Cai, Q.; Zhu, A.; Fan, H. Soil erosion along a long slope in the gentle hilly areas of black soil region in Northeast China. J. Geogr. Sci. 2007, 17, 375–383. [Google Scholar] [CrossRef]
  9. Hu, W.; Zhai, X.; Du, S.; Zhang, X. Impacts of Slope and Longitudinal Ridge on Soil Organic Carbon Dynamics in the Typical Mollisols Sloping Farmland (China). Eurasian Soil Sci. 2021, 54, 951–963. [Google Scholar] [CrossRef]
  10. Pang, H.; Chen, Y.; He, J.; Guo, D.; Pan, X.; Ma, Y.; Qu, F.; Nan, J. Cation exchange resin-induced hydrolysis for improving biodegradability of waste activated sludge: Characterization of dissolved organic matters and microbial community. Bioresour. Technol. 2020, 302, 122870. [Google Scholar] [CrossRef] [PubMed]
  11. Azam, F.; Malfatti, F. Microbial structuring of marine ecosystems. Nat. Rev. Microbiol. 2007, 5, 782–791. [Google Scholar] [CrossRef] [PubMed]
  12. Li, Y.; Xu, C.; Zhang, W.; Lin, L.; Wang, L.; Niu, L.; Zhang, H.; Wang, P.; Wang, C. Response of bacterial community in composition and function to the various DOM at river confluences in the urban area. Water Res. 2020, 169, 115293. [Google Scholar] [CrossRef] [PubMed]
  13. Moore, J.; Mccann, K.; Setälä, H.; De Ruiter, P.C. Top-down is bottom-up, Does predation in the rhizosphere regulate aboveground dynamics? Ecology 2003, 84, 846–857. [Google Scholar] [CrossRef]
  14. Chen, Q.; Chen, F.; Gonsior, M.; Li, Y.; Wang, Y.; He, C.; Cai, R.; Xu, J.; Wang, Y.; Xu, D.; et al. Correspondence between DOM molecules and microbial community in a subtropical coastal estuary on a spatiotemporal scale. Environ. Int. 2021, 154, 106558. [Google Scholar] [CrossRef]
  15. Zhang, W.; Zhou, Y.; Jeppesen, E.; Wang, L.; Tan, H.; Zhang, J. Linking heterotrophic bacterioplankton community composition to the optical dynamics of dissolved organic matter in a large eutrophic Chinese lake. Sci. Total Environ. 2019, 679, 136–147. [Google Scholar] [CrossRef]
  16. Kirchman, D.L.; Dittel, A.I.; Findlay, S.E.G.; Fischer, D. Changes in bacterial activity and community structure in response to dissolved organic matter in the Hudson River, New York. Aquat. Microb. Ecol. 2004, 35, 243–257. [Google Scholar] [CrossRef]
  17. Yang, C.; Sun, J.; Chen, Y.; Wu, J.; Wang, Y. Linkage between water soluble organic matter and bacterial community in sediment from a shallow, eutrophic lake, Lake Chaohu, China. J. Environ. Sci. 2020, 98, 39–46. [Google Scholar] [CrossRef] [PubMed]
  18. Zhang, L.; Liu, H.; Peng, Y.; Zhang, Y.; Sun, Q. Characteristics and significance of dissolved organic matter in river sediments of extremely water-deficient basins: A Beiyun River case study. J. Clean. Prod. 2020, 277, 123063. [Google Scholar] [CrossRef]
  19. Traving, S.J.; Rowe, O.; Jakobsen, N.M.; Sørensen, H.; Dinasquet, J.; Stedmon, C.A.; Andersson, A.; Riemann, L. The Effect of Increased Loads of Dissolved Organic Matter on Estuarine Microbial Community Composition and Function. Front. Microbiol. 2017, 8, 351. [Google Scholar] [CrossRef]
  20. He, J.; Li, H.; Kuhn, N.J.; Wang, Q.; Zhang, X. Effect of ridge tillage, no-tillage, and conventional tillage on soil temperature, water use, and crop performance in cold and semi-arid areas in Northeast China. Aust. J. Soil Res. 2010, 48, 737–744. [Google Scholar] [CrossRef]
  21. Jiang, T.; Kaal, J.; Liang, J.; Zhang, Y.; Wei, S.; Wang, D.; Green, N.W. Composition of dissolved organic matter (DOM) from periodically submerged soils in the Three Gorges Reservoir areas as determined by elemental and optical analysis, infrared spectroscopy, pyrolysis-GC–MS and thermally assisted hydrolysis and methylation. Sci. Total Environ. 2017, 603, 461–471. [Google Scholar] [CrossRef]
  22. Tang, J.; Wang, W.; Yang, L.; Cao, C.; Li, X. Variation in quantity and chemical composition of soil dissolved organic matter in a peri-urban critical zone observatory watershed in Eastern China. Sci. Total Environ. 2019, 688, 622–631. [Google Scholar] [CrossRef]
  23. Santos, P.S.; Santos, E.B.; Duarte, A.C. First spectroscopic study on the structural features of dissolved organic matter isolated from rainwater in different seasons. Sci. Total Environ. 2012, 426, 172–179. [Google Scholar] [CrossRef]
  24. Huang, M.; Li, Z.; Huang, B.; Luo, N.; Zhang, Q.; Zhai, X.; Zeng, G. Investigating binding characteristics of cadmium and copper to DOM derived from compost and rice straw using EEM-PARAFAC combined with two-dimensional FTIR correlation analyses. J. Hazard. Mater. 2018, 344, 539–548. [Google Scholar] [CrossRef]
  25. Rodríguez-Vidal, F.J.; García-Valverde, M.; Ortega-Azabache, B.; González-Martínez, Á.; Bellido-Fernández, A. Characterization of urban and industrial wastewaters using excitation-emission matrix (EEM) fluorescence: Searching for specific fingerprints. J. Environ. Manag. 2020, 263, 110396. [Google Scholar] [CrossRef] [PubMed]
  26. Wang, X.; Zhang, F.; Kung, H.-T.; Ghulam, A.; Trumbo, A.L.; Yang, J.; Ren, Y.; Jing, Y. Evaluation and estimation of surface water quality in an arid region based on EEM-PARAFAC and 3D fluorescence spectral index: A case study of the Ebinur Lake Watershed, China. CATENA 2017, 155, 62–74. [Google Scholar] [CrossRef]
  27. Huguet, A.; Vacher, L.; Relexans, S.; Saubusse, S.; Froidefond, J.; Parlanti, E. Properties of fluorescent dissolved organic matter in the Gironde Estuary. Org. Geochem. 2009, 40, 706–719. [Google Scholar] [CrossRef]
  28. McKnight, D.M.; Boyer, E.W.; Westerhoff, P.K.; Doran, P.T.; Kulbe, T.; Andersen, D.T. Spectrofluorometric characterization of dissolved organic matter for indication of precursor organic material and aromaticity. Limnol. Oceanogr. 2001, 46, 38–48. [Google Scholar] [CrossRef]
  29. Li, W.-T.; Chen, S.-Y.; Xu, Z.-X.; Li, Y.; Shuang, C.-D.; Li, A.-M. Characterization of Dissolved Organic Matter in Municipal Wastewater Using Fluorescence PARAFAC Analysis and Chromatography Multi-Excitation/Emission Scan: A Comparative Study. Environ. Sci. Technol. 2014, 48, 2603–2609. [Google Scholar] [CrossRef] [PubMed]
  30. Yu, X.; Zhang, J.; Kong, F.; Li, Y.; Li, M.; Dong, Y.; Xi, M. Identification of source apportionment and its spatial variability of dissolved organic matter in Dagu River-Jiaozhou Bay estuary based on the isotope and fluorescence spectroscopy analysis. Ecol. Indic. 2019, 102, 528–537. [Google Scholar] [CrossRef]
  31. Barker, J.D.; Sharp, M.J.; Turner, R.J. Using synchronous fluorescence spectroscopy and principal components analysis to monitor dissolved organic matter dynamics in a glacier system. Hydrol. Process. 2010, 23, 1487–1500. [Google Scholar] [CrossRef]
  32. Stedmon, C.A.; Bro, R. Characterizing dissolved organic matter fluorescence with parallel factor analysis: A tutorial. Limnol. Oceanogr. Methods 2008, 6, 572–579. [Google Scholar] [CrossRef]
  33. Shutova, Y.; Baker, A.; Bridgeman, J.; Henderson, R.K. Spectroscopic characterisation of dissolved organic matter changes in drinking water treatment: From PARAFAC analysis to online monitoring wavelengths. Water Res. 2014, 54, 159–169. [Google Scholar] [CrossRef]
  34. Jacinthe, P.A.; Lal, R. A mass balance approach to assess carbon dioxide evolution during erosional events. Land Degrad. Dev. 2011, 12, 329–339. [Google Scholar] [CrossRef]
  35. Novara, A.; Minacapilli, M.; Santoro, A.; Rodrigo-Comino, J.; Carrubba, A.; Sarno, M.; Venezia, G.; Gristina, L. Real cover crops contribution to soil organic carbon sequestration in sloping vineyard. Sci. Total Environ. 2019, 652, 300–306. [Google Scholar] [CrossRef] [PubMed]
  36. Berhe, A.A.; Kleber, M. Erosion, deposition, and the persistence of soil organic matter: Mechanistic considerations and problems with terminology. Earth Surf. Process. Landf. 2013, 38, 908–912. [Google Scholar] [CrossRef]
  37. Wang, J.-G.; Li, Z.-X.; Cai, C.-F.; Yang, W.; Ma, R.-M.; Zhang, G.-B. Effects of stability, transport distance and two hydraulic parameters on aggregate abrasion of Ultisols in overland flow. Soil Tillage Res. 2013, 126, 134–142. [Google Scholar] [CrossRef]
  38. Schiettecatte, W.; Gabriels, D.; Cornelis, W.M.; Hofman, G. Enrichment of Organic Carbon in Sediment Transport by Interrill and Rill Erosion Processes. Soil Sci. Soc. Am. J. 2008, 72, 50–55. [Google Scholar] [CrossRef]
  39. Tan, W.; Jia, Y.; Huang, C.; Zhang, H.; Li, D.; Zhao, X.; Wang, G.; Jiang, J.; Xi, B. Increased suppression of methane production by humic substances in response to warming in anoxic environments. J. Environ. Manag. 2018, 206, 602–606. [Google Scholar] [CrossRef]
  40. Yu, G.-H.; Wu, M.-J.; Wei, G.-R.; Luo, Y.-H.; Ran, W.; Wang, B.-R.; Zhang, J.; Shen, Q.-R. Binding of Organic Ligands with Al(III) in Dissolved Organic Matter from Soil: Implications for Soil Organic Carbon Storage. Environ. Sci. Technol. 2012, 46, 6102–6109. [Google Scholar] [CrossRef]
  41. Kuzyakov, Y. Priming effects: Interactions between living and dead organic matter. Soil Biol. Biochem. 2010, 42, 1363–1371. [Google Scholar] [CrossRef]
  42. Zhuo, J.-F.; Guo, W.-D.; Deng, X.; Zhang, Z.-Y.; Xu, J.; Huang, L.-F. Fluorescence excitation-emission matrix spectroscopy of CDOM from Yundang Lagoon and its indication for organic pollution. Spectrosc. Spectr. Anal. 2010, 30, 1539–1544. [Google Scholar] [CrossRef]
  43. Cotrufo, M.F.; Wallenstein, M.D.; Boot, C.M.; Denef, K.; Paul, E. The Microbial Efficiency-Matrix Stabilization (MEMS) framework integrates plant litter decomposition with soil organic matter stabilization: Do labile plant inputs form stable soil organic matter? Glob. Chang. Biol. 2013, 19, 988–995. [Google Scholar] [CrossRef]
  44. Liang, C.; Schimel, J.P.; Jastrow, J.D. The importance of anabolism in microbial control over soil carbon storage. Nat. Microbiol. 2017, 2, 17105. [Google Scholar] [CrossRef]
  45. Fierer, N.; Bradford, M.A.; Jackson, R.B. Toward an ecological classification of soil bacteria. Ecology 2007, 88, 1354–1364. [Google Scholar] [CrossRef] [PubMed]
  46. I Kuznetsov, S.; A Dubinina, G.; A Lapteva, N. Biology of Oligotrophic Bacteria. Annu. Rev. Microbiol. 1979, 33, 377–387. [Google Scholar] [CrossRef] [PubMed]
  47. Guo, Y.; Chen, X.; Wu, Y.; Zhang, L.; Cheng, J.; Wei, G.; Lin, Y. Natural revegetation of a semiarid habitat alters taxonomic and functional diversity of soil microbial communities. Sci. Total Environ. 2018, 635, 598–606. [Google Scholar] [CrossRef] [PubMed]
  48. Hartmann, M.; Brunner, I.; Hagedorn, F.; Bardgett, R.D.; Stierli, B.; Herzog, C.; Chen, X.; Zingg, A.; Graf-Pannatier, E.; Rigling, A.; et al. A decade of irrigation transforms the soil microbiome of a semi-arid pine forest. Mol. Ecol. 2016, 26, 1190–1206. [Google Scholar] [CrossRef] [PubMed]
  49. Davinic, M.; Fultz, L.M.; Acosta-Martinez, V.; Calderón, F.J.; Cox, S.B.; Dowd, S.E.; Allen, V.G.; Zak, J.C.; Moore-Kucera, J. Pyrosequencing and mid-infrared spectroscopy reveal distinct aggregate stratification of soil bacterial communities and organic matter composition. Soil Biol. Biochem. 2012, 46, 63–72. [Google Scholar] [CrossRef]
  50. Tveit, A.; Schwacke, R.; Svenning, M.M.; Urich, T. Organic carbon transformations in high-Arctic peat soils: Key functions and microorganisms. ISME J. 2013, 7, 299–311. [Google Scholar] [CrossRef] [PubMed]
  51. He, S.; Stevens, S.L.R.; Chan, L.-K.; Bertilsson, S.; del Rio, T.G.; Tringe, S.G.; Malmstrom, R.R.; McMahon, K.D. Ecophysiology of Freshwater Verrucomicrobia Inferred from Metagenome-Assembled Genomes. mSphere 2017, 2, e00277-17. [Google Scholar] [CrossRef] [PubMed]
  52. A Hug, L.; Castelle, C.J.; Wrighton, K.C.; Thomas, B.C.; Sharon, I.; Frischkorn, K.R.; Williams, K.H.; Tringe, S.G.; Banfield, J.F. Community genomic analyses constrain the distribution of metabolic traits across the Chloroflexi phylum and indicate roles in sediment carbon cycling. Microbiome 2013, 1, 22. [Google Scholar] [CrossRef] [PubMed]
  53. Trivedi, P.; Rochester, I.J.; Trivedi, C.; Van Nostrand, J.D.; Zhou, J.; Karunaratne, S.; Anderson, I.C.; Singh, B.K. Soil aggregate size mediates the impacts of cropping regimes on soil carbon and microbial communities. Soil Biol. Biochem. 2015, 91, 169–181. [Google Scholar] [CrossRef]
  54. Fu, J.; Xiao, Y.; Wang, Y.-F.; Liu, Z.-H.; Yang, K.-J. Trichoderma affects the physiochemical characteristics and bacterial community composition of saline–alkaline maize rhizosphere soils in the cold-region of Heilongjiang Province. Plant Soil 2019, 436, 211–227. [Google Scholar] [CrossRef]
  55. Lin, Y.; Ye, G.; Kuzyakov, Y.; Liu, D.; Fan, J.; Ding, W. Long-term manure application increases soil organic matter and aggregation, and alters microbial community structure and keystone taxa. Soil Biol. Biochem. 2019, 134, 187–196. [Google Scholar] [CrossRef]
Figure 1. Content of dissolved organic carbon (DOC) on different slope gradients and slope positions. Different letters mean significant differences (p < 0.05) among different positions of the same slope gradient.
Agriculture 14 00352 g001
Figure 2. Fluorescent components of DOM calculated by parallel factor analysis. Component 1: C1, fulvic-like acid; Component 2: C2, humic-like acid; Component 3: C3, tryptophan-like protein and soluble microbial metabolites.
Agriculture 14 00352 g002
Figure 3. Fmax of three fluorescence components. (a), Fmax; (b), percentage of Fmax. Fmax, maximum fluorescence intensity. C1, fulvic-like acid; C2, humic-like acid; C3, tryptophan-like protein and soluble microbial metabolites.
Agriculture 14 00352 g003
Figure 4. Spectral parameters of DOM. HIX, humification index; Fn(355), the relative concentration level of humic substances; SUVA254, specific UV–Vis absorbance at 254 nm; β:α, freshness index.
Agriculture 14 00352 g004
Figure 5. Fluorescence index of DOM. FI, fluorescence index.
Agriculture 14 00352 g005
Figure 6. Heat map of bacterial community (Phylum).
Agriculture 14 00352 g006
Figure 7. Correlation between the soil DOM, Alpha diversity index, and relative abundance of soil bacterial community at the phylum levels. FI, fluorescence index. HIX, humification index; Fn(355), the relative concentration level of humic substances; SUVA254, specific UV–Vis absorbance at 254 nm; β:α, freshness index; DOC: dissolved organic carbon content; C1, Fmax (maximum fluorescence intensity) of fulvic-like acid; C2, Fmax of humic-like acid; C3, Fmax of tryptophan-like protein and soluble microbial metabolites. Shannon and Simpson, community diversity; Ace and Chao, community richness. Italic letters represent the relative abundance of different bacteria at the phylum level: Act, Actinobacteriota; Pro, Proteobacteria; Chl, Chloroflexi; Aci, Acidobacteriota; Gem, Gemmatimonadota; Fir, Firmicutes; Myx, Myxococcota; Bac, Bacteroidotas; Ver, Verrucomicrobiota; Pla, Planctomycetota. The blue circle indicates positive correlation; the red circle indicates negative correlation. * Indicates significant correlation at the 0.05 level. ** Indicates significant correlation at the 0.01 level.
Agriculture 14 00352 g007
Figure 8. Redundancy analysis of the soil DOM content and composition, bacterial Alpha diversity index, and community abundance. FI, fluorescence index. HIX, humification index; Fn(355), the relative concentration level of humic substances; SUVA254, specific UV–Vis absorbance at 254 nm; β:α, freshness index; DOC: dissolved organic carbon content; C1, Fmax (maximum fluorescence intensity) of fulvic-like acid; C2, Fmax of humic-like acid; C3, Fmax of tryptophan-like protein and soluble microbial metabolites. Shannon and Simpson, community diversity; Ace and Chao, community richness. Italic letters represent the relative abundance of different bacteria at the phylum level: Act, Actinobacteriota; Pro, Proteobacteria; Chl, Chloroflexi; Aci, Acidobacteriota; Gem, Gemmatimonadota; Fir, Firmicutes; Myx, Myxococcota; Bac, Bacteroidotas; Ver, Verrucomicrobiota; Pla, Planctomycetota.
Agriculture 14 00352 g008
Table 1. Alpha diversity index of soil bacterial communities.
SlopePositionsCommunity DiversityCommunity RichnessCoverage %
ShannonSimpsonAceChao
Up6.36 ± 0.09a0.0060 ± 0.0007a4125.09 ± 103.86ab4119.12 ± 155.41b97.96 ± 0.08a
Mid6.43 ± 0.06a0.0046 ± 0.0002b4526.52 ± 89.53a4376.90 ± 70.86a97.77 ± 0.06a
Down6.41 ± 0.04a0.0048 ± 0.0003b3844.54 ± 88.53b3779.67 ± 138.27c98.01 ± 0.08a
Up6.50 ± 0.05a0.0047 ± 0.0004a4292.00 ± 28.79a4276.69 ± 54.35a97.59 ± 0.02b
Mid6.55 ± 0.03a0.0043 ± 0.0003a4260.00 ± 155.17a4256.46 ± 186.33a97.50 ± 0.14b
Down6.46 ± 0.08a0.0047 ± 0.0005a4097.66 ± 92.45a4070.79 ± 120.16a98.03 ± 0.06a
Up6.48 ± 0.05a0.0046 ± 0.0004a4225.74 ± 51.70a4179.96 ± 82.36a97.72 ± 0.05a
Mid6.41 ± 0.06a0.0049 ± 0.0005a4282.93 ± 505.60a4075.77 ± 192.85a97.24 ± 0.12b
Down6.46 ± 0.03a0.0048 ± 0.0003a4082.75 ± 48.74a4083.34 ± 28.91a97.42 ± 0.04ab
Different Letters Mean Significant Differences (p < 0.05) on the Same Slope.
Disclaimer/Publisher’s Note: The statements, opinions and data contained in all publications are solely those of the individual author(s) and contributor(s) and not of MDPI and/or the editor(s). MDPI and/or the editor(s) disclaim responsibility for any injury to people or property resulting from any ideas, methods, instructions or products referred to in the content.

