Article

Phenotypic Diversity of Quinoa Landraces Cultivated in the Ecuadorian Andean Region: In Situ Conservation and Detection of Promising Accessions for Breeding Programs

by
Hipatia Delgado
1,
César Tapia
2,
Elsa Helena Manjarres-Hernández
3,
Edwin Borja
4,
Edwin Naranjo
2 and
Juan Pedro Martín
1,*
1
Departamento de Biotecnología-Biología Vegetal, Escuela Técnica Superior de Ingeniería Agronómica, Alimentaria y de Biosistemas, Universidad Politécnica de Madrid, Avda, Puerta de Hierro 2-4, 28040 Madrid, Spain
2
Instituto Nacional de Investigaciones Agropecuarias, Santa Catalina, Panamericana Sur Km, 1 vía Tambillo, Quito 170201, Ecuador
3
Facultad de Ciencias, Universidad Pedagógica y Tecnológica de Colombia, Tunja 150003, Colombia
4
Facultad de Ciencias Biológicas, Universidad de Valencia, C/Doctor Moliner 50, Burjassot, 46100 Valencia, Spain
*
Author to whom correspondence should be addressed.
Agriculture 2024, 14(3), 336; https://doi.org/10.3390/agriculture14030336
Submission received: 11 January 2024 / Revised: 9 February 2024 / Accepted: 19 February 2024 / Published: 21 February 2024
(This article belongs to the Section Crop Genetics, Genomics and Breeding)

Abstract

:
Quinoa (Chenopodium quinoa Willd.) is an ancestral crop in the Ecuadorian Andean region, and its landraces have always been of great social and food importance for the native population. Currently, there is no updated information about their phenotypic diversity and conservation status nor about the changes that have occurred in the last decades. A total of 268 accessions of quinoa landraces collected at two different times (1978–1988 and 2014–2015) in three representative Ecuadorian Andean provinces (Imbabura, Cotopaxi and Chimborazo) were evaluated for forty agro-morphological (17 quantitative and 23 qualitative) traits. Most of the quantitative traits showed high variability, some of them with great importance for commercialization and germplasm selection for breeding programs (e.g., panicle width, grain width, 1000-grain weight or seed yield per plant). Ten quantitative and eleven qualitative descriptors were significantly different between both collections. Regarding the presence/absence of saponin, all the accessions collected four decades ago had saponin, while it was found in only 18% of accessions collected more recently. The phenotypic relationships in the dendrogram did not show clustered accessions by their geographical origin or by collection. A selection index allowed us to detect a few accessions recently collected in Chimborazo with high promises for future breeding programs, with high seed yields per plant values and a reduced or no saponin content. The agro-morphological information obtained may be very useful for the suitable management and conservation of this ancestral plant genetic resource, both on the farm by indigenous farming communities and ex situ by the Germplasm Bank of the Ecuadorian National Institute for Agricultural Research (INIAP).

1. Introduction

Quinoa (Chenopodium quinoa Willd.) is an allotetraploid species (2n = 4x = 36) native to South America, with its centre of origin located in the Andes of Bolivia and Peru [1]. This plant genetic resource has been classified by the Food and Agriculture Organization of the United Nations (FAO) as a “future smart food”, i.e., a food with excellent nutritional properties that improves soil health by requiring fewer chemical fertilisers, as well as being a crop that has adapted to adverse climatic and agronomic conditions [2]. Thus, quinoa farming offers alternative ways to produce nutritious food on marginal lands unsuitable for other conventional crops [3].
The first evidence of quinoa cultivation in Ecuador dates back to 300–500 BC [4]. It was cultivated and widely used by pre-Hispanic civilizations and was replaced by cereals after the arrival of the Spanish, despite being a staple food for the Indigenous populations at the time [5]. The geographical distribution of the crop in South America extends from 5° N latitude to 43° S latitude (in Colombia, Ecuador, Peru, Bolivia, Argentina and Chile), and its altitudinal distribution varies from sea level to 4000 m a.s.l. [6]. Thus, due to the existence of particular adaptations in quinoa from different areas throughout Andean region, up to five ecotypes are recognised with their different phenotypic and genetic characteristics: Inter-Andean valleys (Colombia, Ecuador and Peru), Highlands (Peru and Bolivia), Yungas (Bolivia), Salares (Bolivia, Chile and Argentina) and Coastal or sea level areas (Chile) [7,8,9]. Ecuador is considered a sub-centre of quinoa diversification in the Inter-Andean valleys [5,10]. Local varieties in the Ecuadorian Andean region are characterised by taller plants than those from other Inter-Andean valleys, as well as being late to mature and showing a high potential for biomass formation and grain yield [10,11].
Tapia and Rosas [12] point out that the in situ conservation of Ecuadorian Andean crops has been mostly carried out by the indigenous communities, with reduced and scattered efforts by governments or private entities. However, in recent years, conservation has been led by farmers and non-governmental organizations (NGOs), which have promoted the seed exchange processes, the local fairs, the strengthening of conservationist farmers and the increase in ancestral practices for the management and conservation of local diversity [13]. In the province of Chimborazo, where native quinoa accessions are best conserved [14], the in situ conservation of local accessions has been carried out by the farmers themselves. Generation after generation, they have cultivated them in family gardens or chakra, since the native germplasm holds a high cultural and nutritional significance for them [14]. Likewise, in most of Andean provinces, Bio-knowledge and Agricultural Development Centres (BADCs) and Seed Exchange Fairs also contribute to the agrobiodiversity conservation of the Andean crops [14].
On the other hand, the first improved quinoa varieties obtained in Ecuador were released in 1992 by the National Institute for Agricultural Research (INIAP; Pichincha, Ecuador), of which practically only the INIAP-Tunkahuan variety is still cultivated today. This commercial variety is characterised by a lower saponin content and greater precocity than native accessions, in addition to producing up to 3 t/ha in favourable environments [15].
Currently, only two recognised varieties are grown on a large scale in the Ecuadorian Highlands. In Chimborazo, the so-called “Chimborazo” variety is grown (a native variety), while in the rest of the Andean provinces, the commercial INIAP-Tunkahuan variety is grown [16], along with different landraces on a minor scale [5].
Different agro-morphological evaluation studies of the quinoa germplasm have shown that it has a great phenotypic diversity [17,18,19]. However, in Ecuador, there are only few studies available on the phenotypic diversity of quinoa landraces. The first study was carried out by Gandarillas et al. [11], on 270 accessions collected in different provinces of the Andean region and conserved in the INIAP Germplasm Bank. This study made it possible to classify these accessions into six different morphological races. Mazón et al. [20] carried out the agro-morphological characterisation of about 600 accessions from the quinoa collection conserved in the INIAP Germplasm Bank, of which about 280 were collected in the Andean region of Ecuador, and the rest came from other countries through germplasm exchange, with the aim of selecting promising lines for future breeding programs. Subsequently, Tapia et al. [9] attempted to establish a core collection of quinoa accessions conserved in the germplasm bank, using the phenotypic diversity information obtained by Mazón et al. [20].
The information obtained from the phenotypic and genetic studies of native quinoa accessions is essential for the proper selection of promising genotypes, which are the basis of genetic breeding programs, as well as for the correct conservation of these valuable plant genetic resources. For this purpose, it would first be necessary to carry out an extensive agro-morphological characterisation of the quinoa landraces cultivated in the Ecuadorian Highlands. Therefore, the aim of the present study was to evaluate the agro-morphological characteristics of 268 accessions of quinoa landraces from the three most relevant Andean provinces in the cultivation of local accessions (Imbabura, Cotopaxi and Chimborazo), which were collected at two different times. The results obtained would allow us to determine the possible phenotypic differences between collection times and provinces in order to know the current state of in situ conservation of these accessions. Likewise, we used a selection index to find the accessions with better agronomic characteristics in order to optimise the use of diverse phenotypes of this Andean crop in future genetic breeding programs.

2. Materials and Methods
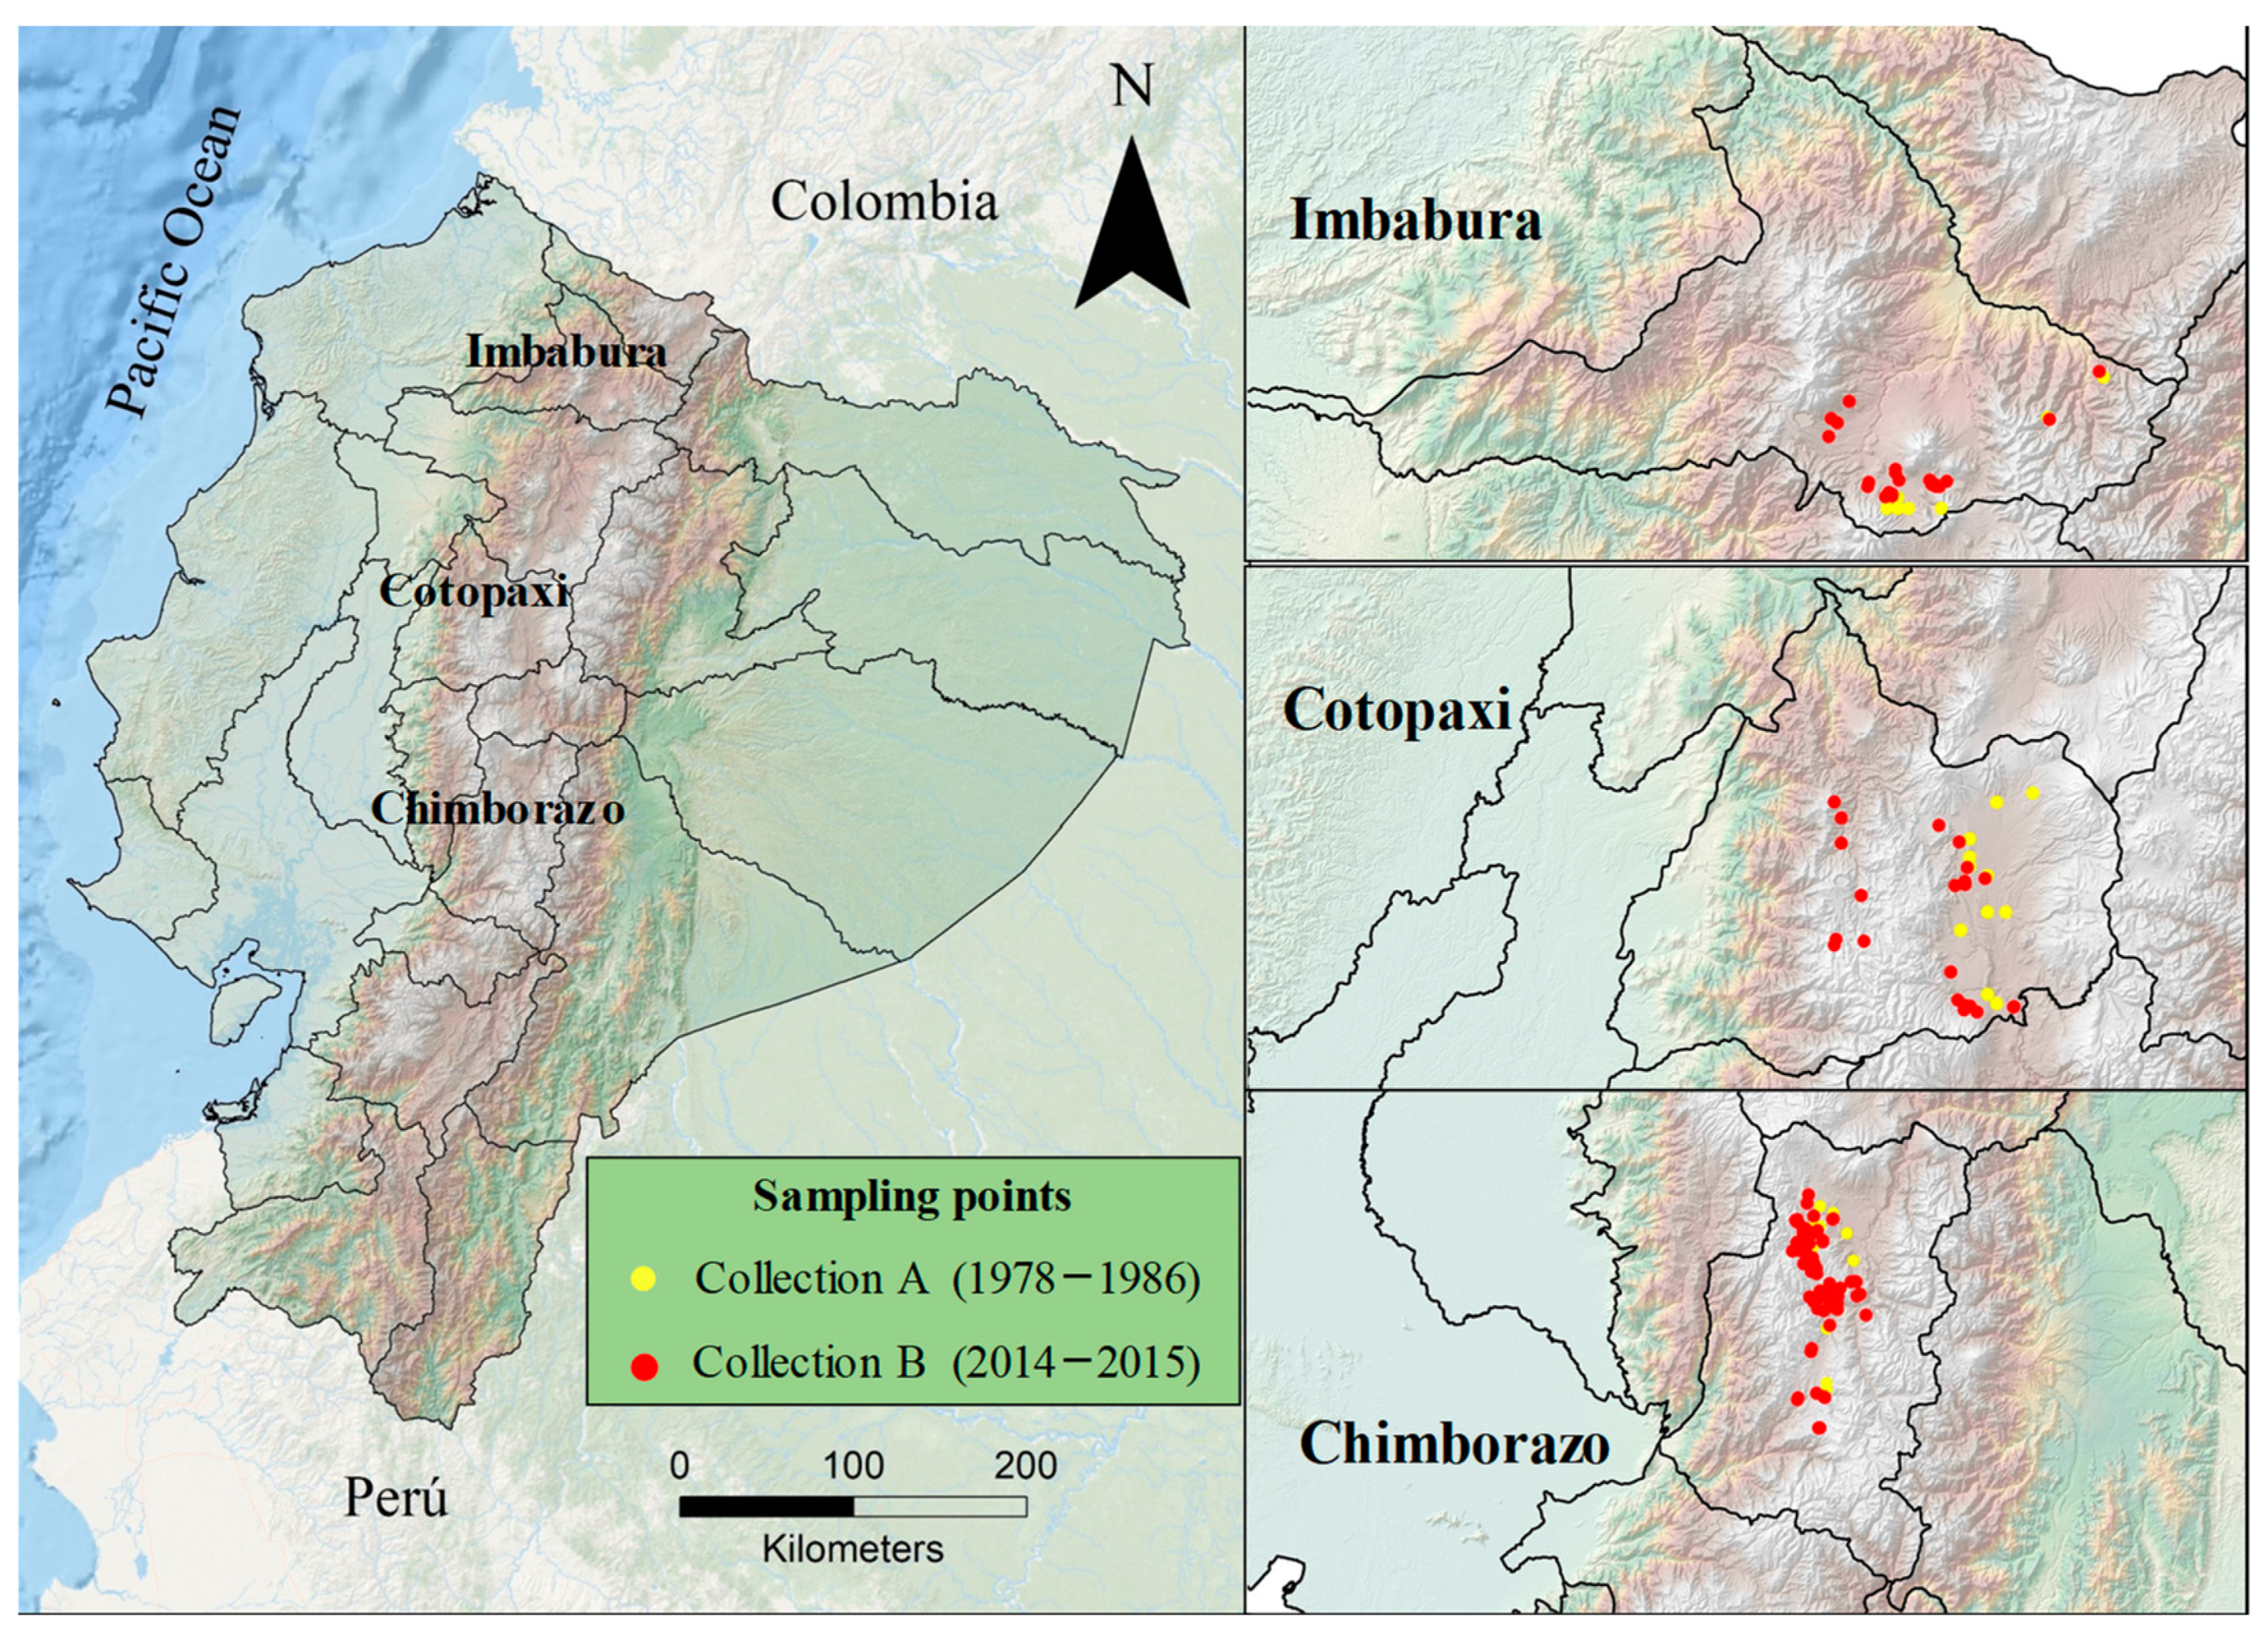
2.1. Plant Material

Two hundred and sixty-eight quinoa (Chenopodium quinoa Willd.) landrace accessions were analysed. These accessions were collected at two different times, both in three provinces of the Ecuadorian Andean region that are representative of this crop in terms of the cultivated area, production, consumption and economic importance [20,21]: Chimborazo, Cotopaxi and Imbabura. The first collection phase (“Collection A”) took place between 1978 and 1988, and 109 accessions were collected, of which only the 61 with complete passport data (20 from Chimborazo, 20 from Cotopaxi and 21 from Imbabura) were selected and designated as Q1 to Q61. The second collection (“Collection B”) was carried out in 2014 and 2015, and 207 accessions (143 from Chimborazo, 28 from Cotopaxi and 36 from Imbabura) were collected and designated as Q62 to Q268 (Figure 1 and Supplementary Table S1). These accessions were donated to be preserved in the Germplasm Bank (GB) of the National Institute for Agricultural Research (INIAP), located in the province of Pichincha, Ecuador, with the exception of six samples that were not donated by farmers for conservation in the GB. The INIAP–GB codes and all passport data are indicated in Supplementary Table S1. The high number of accessions collected in the province of Chimborazo is due to the fact that it was possible to prospect in a greater number of sites, since the cultivation of native quinoa here is much more abundant than in the rest of the Andean provinces. In addition, the farmers of this province usually separate the cultivation of their quinoa landraces according to the colour of the panicle (lighter colours—yellow or green—on the one hand and darker colours—pink, purple or red—on the other [5]), so that in most sites, two accessions were collected per donor farmer.

2.2. Agro-Morphological Evaluation

The field establishment of 268 accessions was carried out at the BADC (Bio-knowledge and Agricultural Development Centre) “Las Abras”, located in the province of Chimborazo (01°34′46″ South latitude and 78°42′53″ West longitude; altitude 3100 m a.s.l.) on plots of loamy–sandy soils with a pH of 7.1. During the crop growth period (January-August 2016), the average temperature was 13.8 °C, with a maximum of 15.6 °C and a minimum of 12.3 °C. The average precipitation during that period was 46.3 mm per month, with a maximum of 124.4 mm and a minimum of 6.8 mm, giving a cumulative precipitation of 370.1 mm.
The soil preparation was mechanised with a single pass of the plough followed by harrowing. Subsequently, 6 m long furrows were made. In each furrow, 14 plants of the same accession were distributed, with a distance of 0.40 m between plants and 0.80 m between furrows. Approximately 20 g of seeds were sown in each of the 14 positions of the furrow. After 30 days, the furrows were thinned to leave only one seedling in each position and simultaneously, weeding was carried out. Two rounds of hilling (an agricultural technique that consists of accumulating soil at the base of the trunk or stem of a plant) were performed at 45 and 60 days after sowing. In addition, rye (Secale cereale L.) was planted as a living barrier between accessions furrows. Agronomic tasks were performed uniformly across all furrows. Likewise, crop management practices commonly used by farmers in the Andean region were applied (manual thinning, weeding and hilling, agro-ecological pest and disease control and manual harvesting and post-harvesting).
A total of forty descriptors described by Bioversity International et al. [22] and commonly used by the National Department of Plant Genetic Resources (DENAREF) of INIAP–Ecuador for quinoa were selected for the characterisation of the 268 quinoa accessions. A total of 17 of these descriptors were quantitative (D1 to D17), and the other 23 were qualitative (D18 to D40) (Table 1). Data collection was carried out on 10 randomly selected plants from each accession and from the same furrow.

2.3. Selection Index

To find quinoa accessions with traits related to agronomic productivity that are promising for future breeding programs, we selected few descriptors according to the priorities of farmers in the region, as suggested by Gómez and Aguilar [24]. Variables related to the yield, precocity, presence/absence of saponin and other variables associated with the agronomic management of the crop (i.e., plant height) were the most important to establish a selection index (S.I.) based on the linear equations proposed by Delgado et al. [25] and Manjarres-Hernández et al. [18]. Thus, a weighted value was assigned to the variables of seed yield per plant, plant height, weight of 1000 seeds, days to physiological maturity (precocity) and presence of saponin. This last variable was included because the level of saponin has a significant effect on quinoa consumption and is therefore of great interest for breeding programs.
S.I. = yield (0.30) − plant height (0.15) + 1000-grain weight (0.15) − number of days to 50% physiological maturity (0.20) − presence of saponin (0.20)
The variables seed yield per plant and weight of 1000 seeds were expressed positively, since farmers prefer good-sized grain and higher seed weights per plant. The precocity, plant height and the presence of saponin were negatively expressed, as earlier accessions with lower plant heights and a low saponin content are sought to facilitate harvesting.

2.4. Data Analysis

A descriptive statistical analysis was conducted for the quantitative variables (D1 to D17). Subsequently, assumptions for the parametric analysis were verified, and an analysis of variance (ANOVA) was performed using InfoStat program version 2020 [26]. To detect possible significant differences between different sets of accessions (collections and provinces), a comparison of means was carried out using Fisher’s least significant difference (LSD) test [27]. Spearman’s correlation [28] between variable pairs was estimated, and corresponding graphs were generated using the R package “corrplot”: Visualization of a Correlation Matrix (version 0.84) [29]. For the multivariate analysis, a hierarchical clustering on principal components (HCPC) was performed using algorithms included in the factoextra package of the program R [30], and these were visualised in a two-dimensional plot using the FactoMineR package [31]. A frequency analysis and multiple correspondence analysis were performed on the qualitative variables (D18 to D40). All these traits were uniform for the 10 plants of each accession, so that the total absolute frequencies by province or by collection were calculated as the number of accessions showing each trait. The Chi-squared test (X2; [32]) and Pearson’s (C; [33]) and Cramér’s (V; [34]) contingency coefficients were used to identify significantly distinct polymorphic qualitative variables between sets of accessions.
The data from quantitative and polymorphic qualitative variables were subjected to a multivariate analysis using Gower’s distance [35] and Ward’s hierarchical clustering method [36] to construct a dendrogram to show the phenotypic relationships among quinoa accessions using InfoStat program version 2020. A cophenetic matrix was derived from the Gower distance matrix to test the goodness of fit of the clusters by comparing the two matrices using the Mantel matrix correspondence test in the MxComp program of NTSYS-pc package version 2.2 [37], using 10,000 random permutations. Also, a statistical analysis to assess more distinguishable quantitative and qualitative traits among clusters defined in the dendrogram was carried out. Means of quantitative traits from different groups were compared using the Fisher’s LSD test. Qualitative traits from different clusters were compared using the Chi-square test.

3. Results

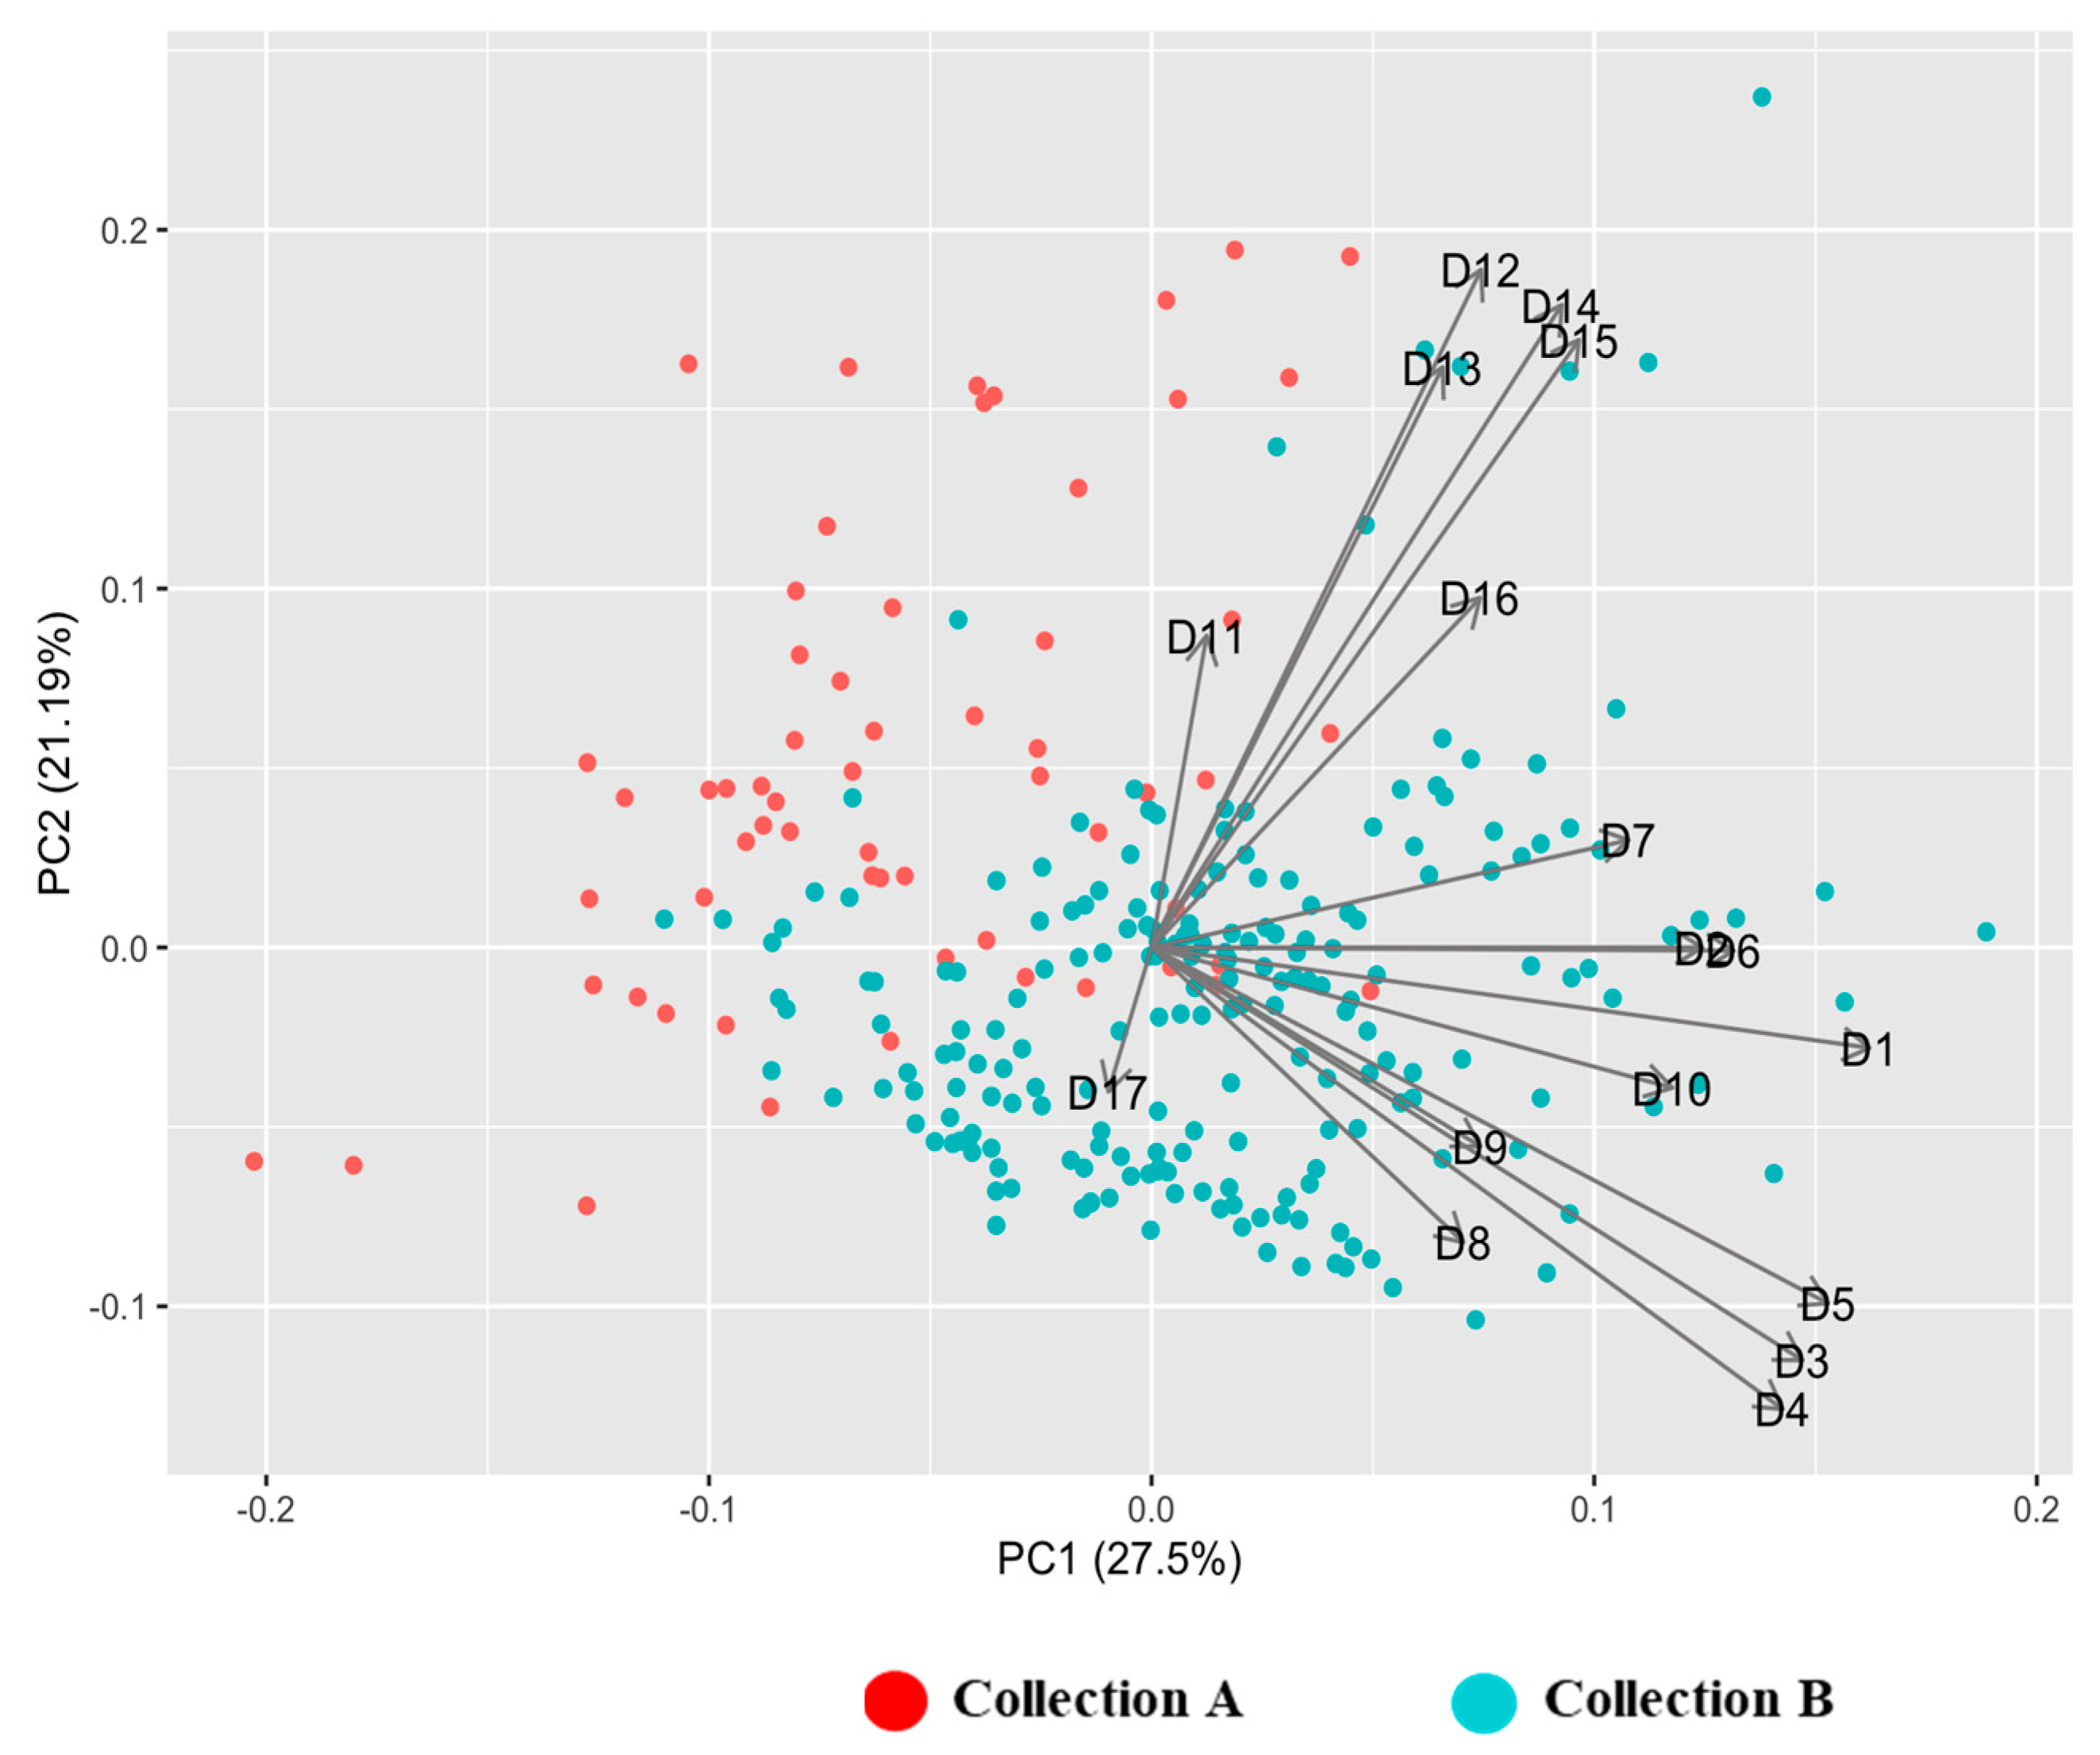
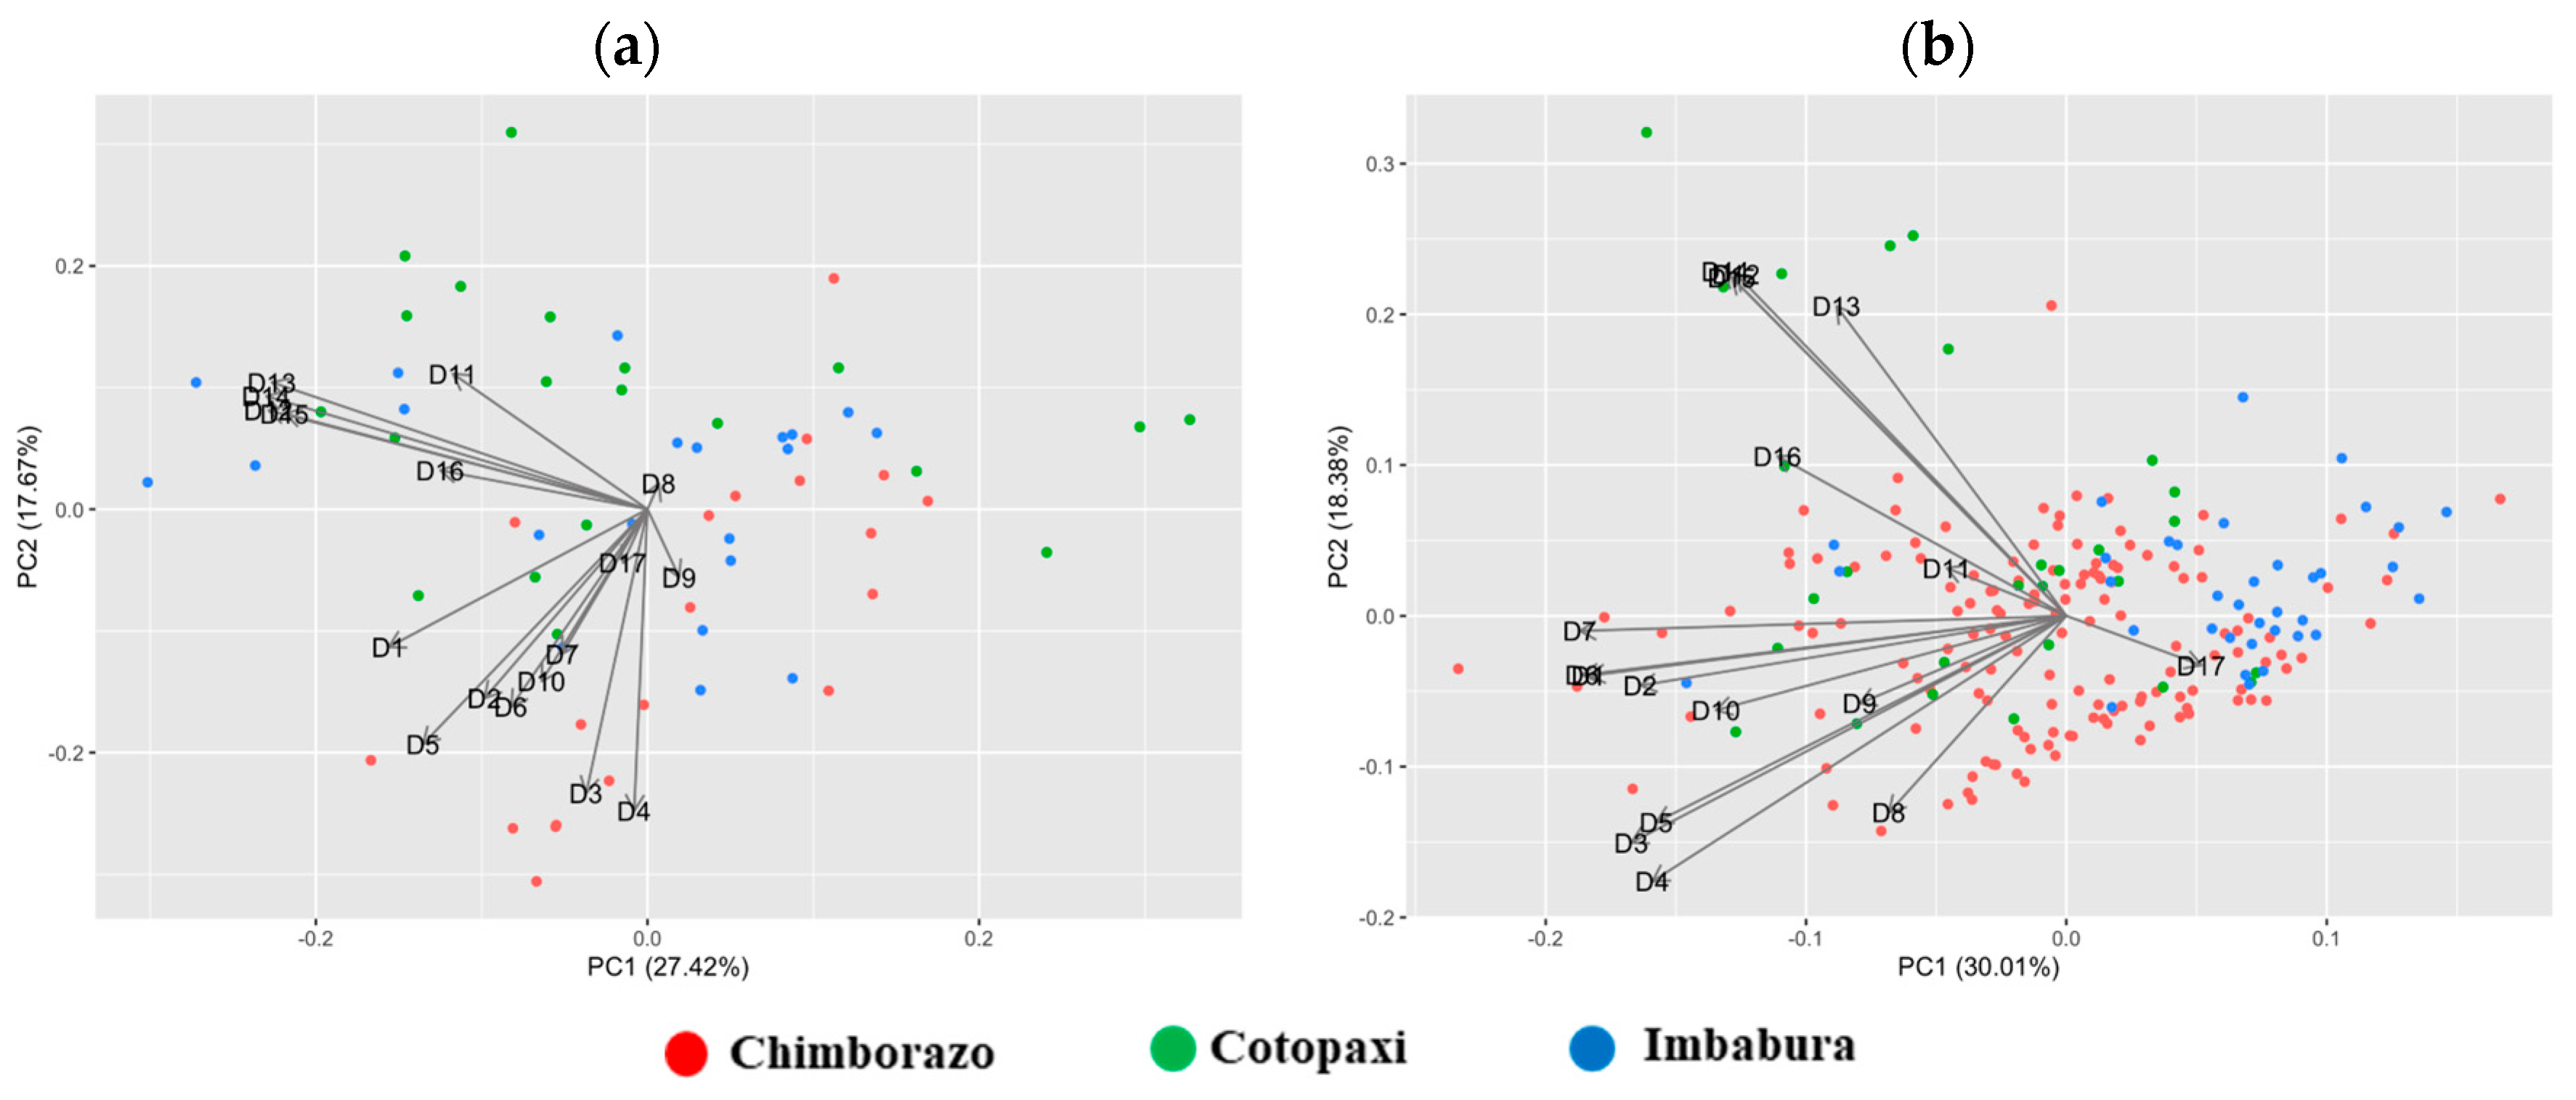
3.1. Diversity in Quantitative Traits

The quantitative descriptors evaluated in the quinoa accessions from both collections showed a wide range of variation, with most of them having coefficients of variation (CV) greater than 10% (Table 2). In both collections, the characters with the highest variations were the panicle width (Collection A = 66.48% and Collection B = 40.58%) and seed yield per plant (Collection A = 48.99% and Collection B = 40.86%). The grain width showed the lowest coefficient of variation (5.39% and 4.92%, respectively). When comparing the two collections, significant differences (p < 0.05) were detected for 10 out of the 17 analysed descriptors. These differences were highly significant (p < 0.0001) for the plant height, leaf size, grain width and seed yield per plant, so in all cases, higher values were obtained for Collection B (Table 2).
The mean values of the quantitative descriptors in the different provinces for Collection A showed significant differences (p < 0.01) only for the characteristics related to the leaf size, days to physiological maturity (days to harvest) and harvest index. It should be noted that the Chimborazo and Cotopaxi accessions were harvested significantly earlier (showed fewer days to physiological maturity) and had a higher harvest index than those from Imbabura (Table 2). On the other hand, in Collection B, significant differences were found between the provinces for 16 of the 17 characters analysed, being highly significant (p < 0.0001) in those related to the plant height, petiole length, leaf length and width, 1000-grain weight, days to 50% flowering, days to end of flowering, days to physiological maturity and harvest index. In this collection, the Imbabura accessions required fewer days to flowering and were harvested earlier than those from the two other provinces (Table 2).
When comparing the mean values obtained for different collections from the same province, highly significant differences were observed in the three provinces for the variables plant height and those related to leaf size, with taller plants and a larger leaf size always being from Collection B accessions (Table 2). Furthermore, in Chimborazo the accessions of Collection B showed higher values for the grain width, seed yield per plant and number of days to physiological maturity. In Cotopaxi, Collection B accessions also showed significantly higher values for the panicle width, grain width, 1000-grain weight and seed yield per plant. In Imbabura, significant differences were found for the variables related to days to flowering and physiological maturity, such that the accessions of Collection B flowered earlier and were more precocious (Table 2).
The Spearman correlation analysis (p < 0.05) between the quantitative variables showed an agreement with the previously observed correlations, both in Collections A and B (see Supplementary Figure S1). In both cases, high and significant correlations were found among the variables related to leaf size (D3, D4 and D5), as well as among the descriptors associated with floral bud formation and flowering duration (D12, D13, D14 and D15).
When the two collections were compared using a principal component analysis, it was found that 48.69% of the total variance could be explained by the first two components (PC1 = 27.50% and PC2 = 21.19%; Figure 2). The variables that best defined the accessions of Collection B were related to the plant height (D1), leaf length and width (D4 and D5), petiole length (D3) and panicle length (D6), with values higher than those of the Collection A accessions. Meanwhile, the variables associated with different phenological stages (D11 to D17), which preferentially grouped the accessions from Collection A, showed that they were generally earlier maturing quinoas than those from Collection B.
On the other hand, the principal component analysis showed that 45.09% of the total variance in the accessions in Collection A was explained by the first two components (PC1 = 27.42% and PC2 = 17.67%), while in Collection B, the first two components explained 48.39% (PC1 = 30.01% and PC2 = 18.38%) of the total variance (Figure 3a,b). The variables that contributed most to the variation of PC1 in Collection A were those associated with days to flowering and physiological maturity (D12 to D16), which differentiated the accessions of Cotopaxi and Imbabura from those of Chimborazo. Likewise, the variables grain width (D8) and 1000-grain weight (D9) also contributed significantly to the distinction between accessions. In Collection B, a high correlation was also observed between the variables related to flowering and physiological maturity, which in this case, helped to separate some Cotopaxi accessions from the rest. On the other hand, the petiole length (D3), leaf length and width (D4 and D5) and grain width (D8) were the ones that best grouped the Chimborazo accessions, while the harvest index (D17) was the trait that best distinguished the Imbabura accessions. In general, there is no clear differentiation in the accessions according to their geographical origin in both collections.

3.2. Diversity in Qualitative Traits

Most of the 23 qualitative characters studied showed a high variability in the accessions of both collections (Table 3), and only 5 of them were uniform for all 268 accessions: herbaceous growth type (D18), presence of striae (D23), entire leaf margin (D27), absence of colour in leaf granules (D31) and cylindrical grain shape (D39). In addition, the accessions from Collection A were also uniform for three other characters: simple growth habit (D19), cylindrical main stem shape (D20) and absence of saponin (D40) (Table 3).
The discriminant values obtained for the qualitative characters in the differentiation of accessions collected at different times (Collection A vs. Collection B) are shown in Table 4. Eleven of the eighteen polymorphic characters were significantly distinct between the two collections. It should be noted that six of them were related to the pigmentation of different plant parts: main stem colour (D21), presence of pigmented axils (D22), striae colour (D24), panicle colour at physiological maturity (D33), pericarp colour (D37) and episperm colour (D38). For the pericarp colour, a cream colour was predominant in both collections, but there were also accessions with other colours in Collection A, such as pink, brown or purple, which were not observed in accessions from Collection B (Table 3). On the other hand, highly significant differences were observed for the character presence of saponin (Table 4), since all accessions from Collection A presented saponin, while in Collection B, only 37 accessions (17.9%) were found with saponin and a great majority (82.1%; 170/207) lacked it (Table 3).
When the results obtained for the different provinces within the same collection were compared, it was observed that 9 of the 15 polymorphic qualitative characters in Collection A and 12 of the 18 polymorphic characters in Collection B were significantly different between provinces (Table 4). In Collection A, five of those nine distinguishing characters between provinces were again related to the coloration of different plant parts (D22, D24, D32, D33 and D38; see Table 3 and Table 4). In Collection B, most of the differences were highly significant (p < 0.0001), and eight of them were also related to the pigmentation of different plant parts (D21, D22, D24, D29, D30, D32, D33 and D38; see Supplementary Table S3 and Table 4). When comparing the accessions collected in the same province but at different times, significant differences were observed for a different number of characters depending on the province: 12 characters differentiated the collections in Chimborazo, 10 in Imbabura, and only 6 in Cotopaxi (Table 4).
The multiple correspondence analysis, considering only the accessions grouped by collections (A and B), showed that 33.0% of the total variance is explained by the first two dimensions, Dim1 (22.6%) and Dim2 (10.4%). The analysis separated the accessions into two groups, which do not correspond to the collections, as each group contains a mixture of accessions from both collections (Figure 4). The largest group of accessions was defined by the characteristics of a yellow main stem colour (D21), green leaf lamina colour (D30), green panicle colour at flowering (D32), yellow panicle colour at physiological maturity (D33) and cream pericarp colour (D37). The other group was defined by showing a purple main stem colour (D21), the presence of indeterminate axils (D22), a yellow striae colour (D24), purple panicle colour at flowering (D32), purple panicle colour at physiological maturity (D33) and purple pericarp colour (D37) (Figure 4, Table 3).

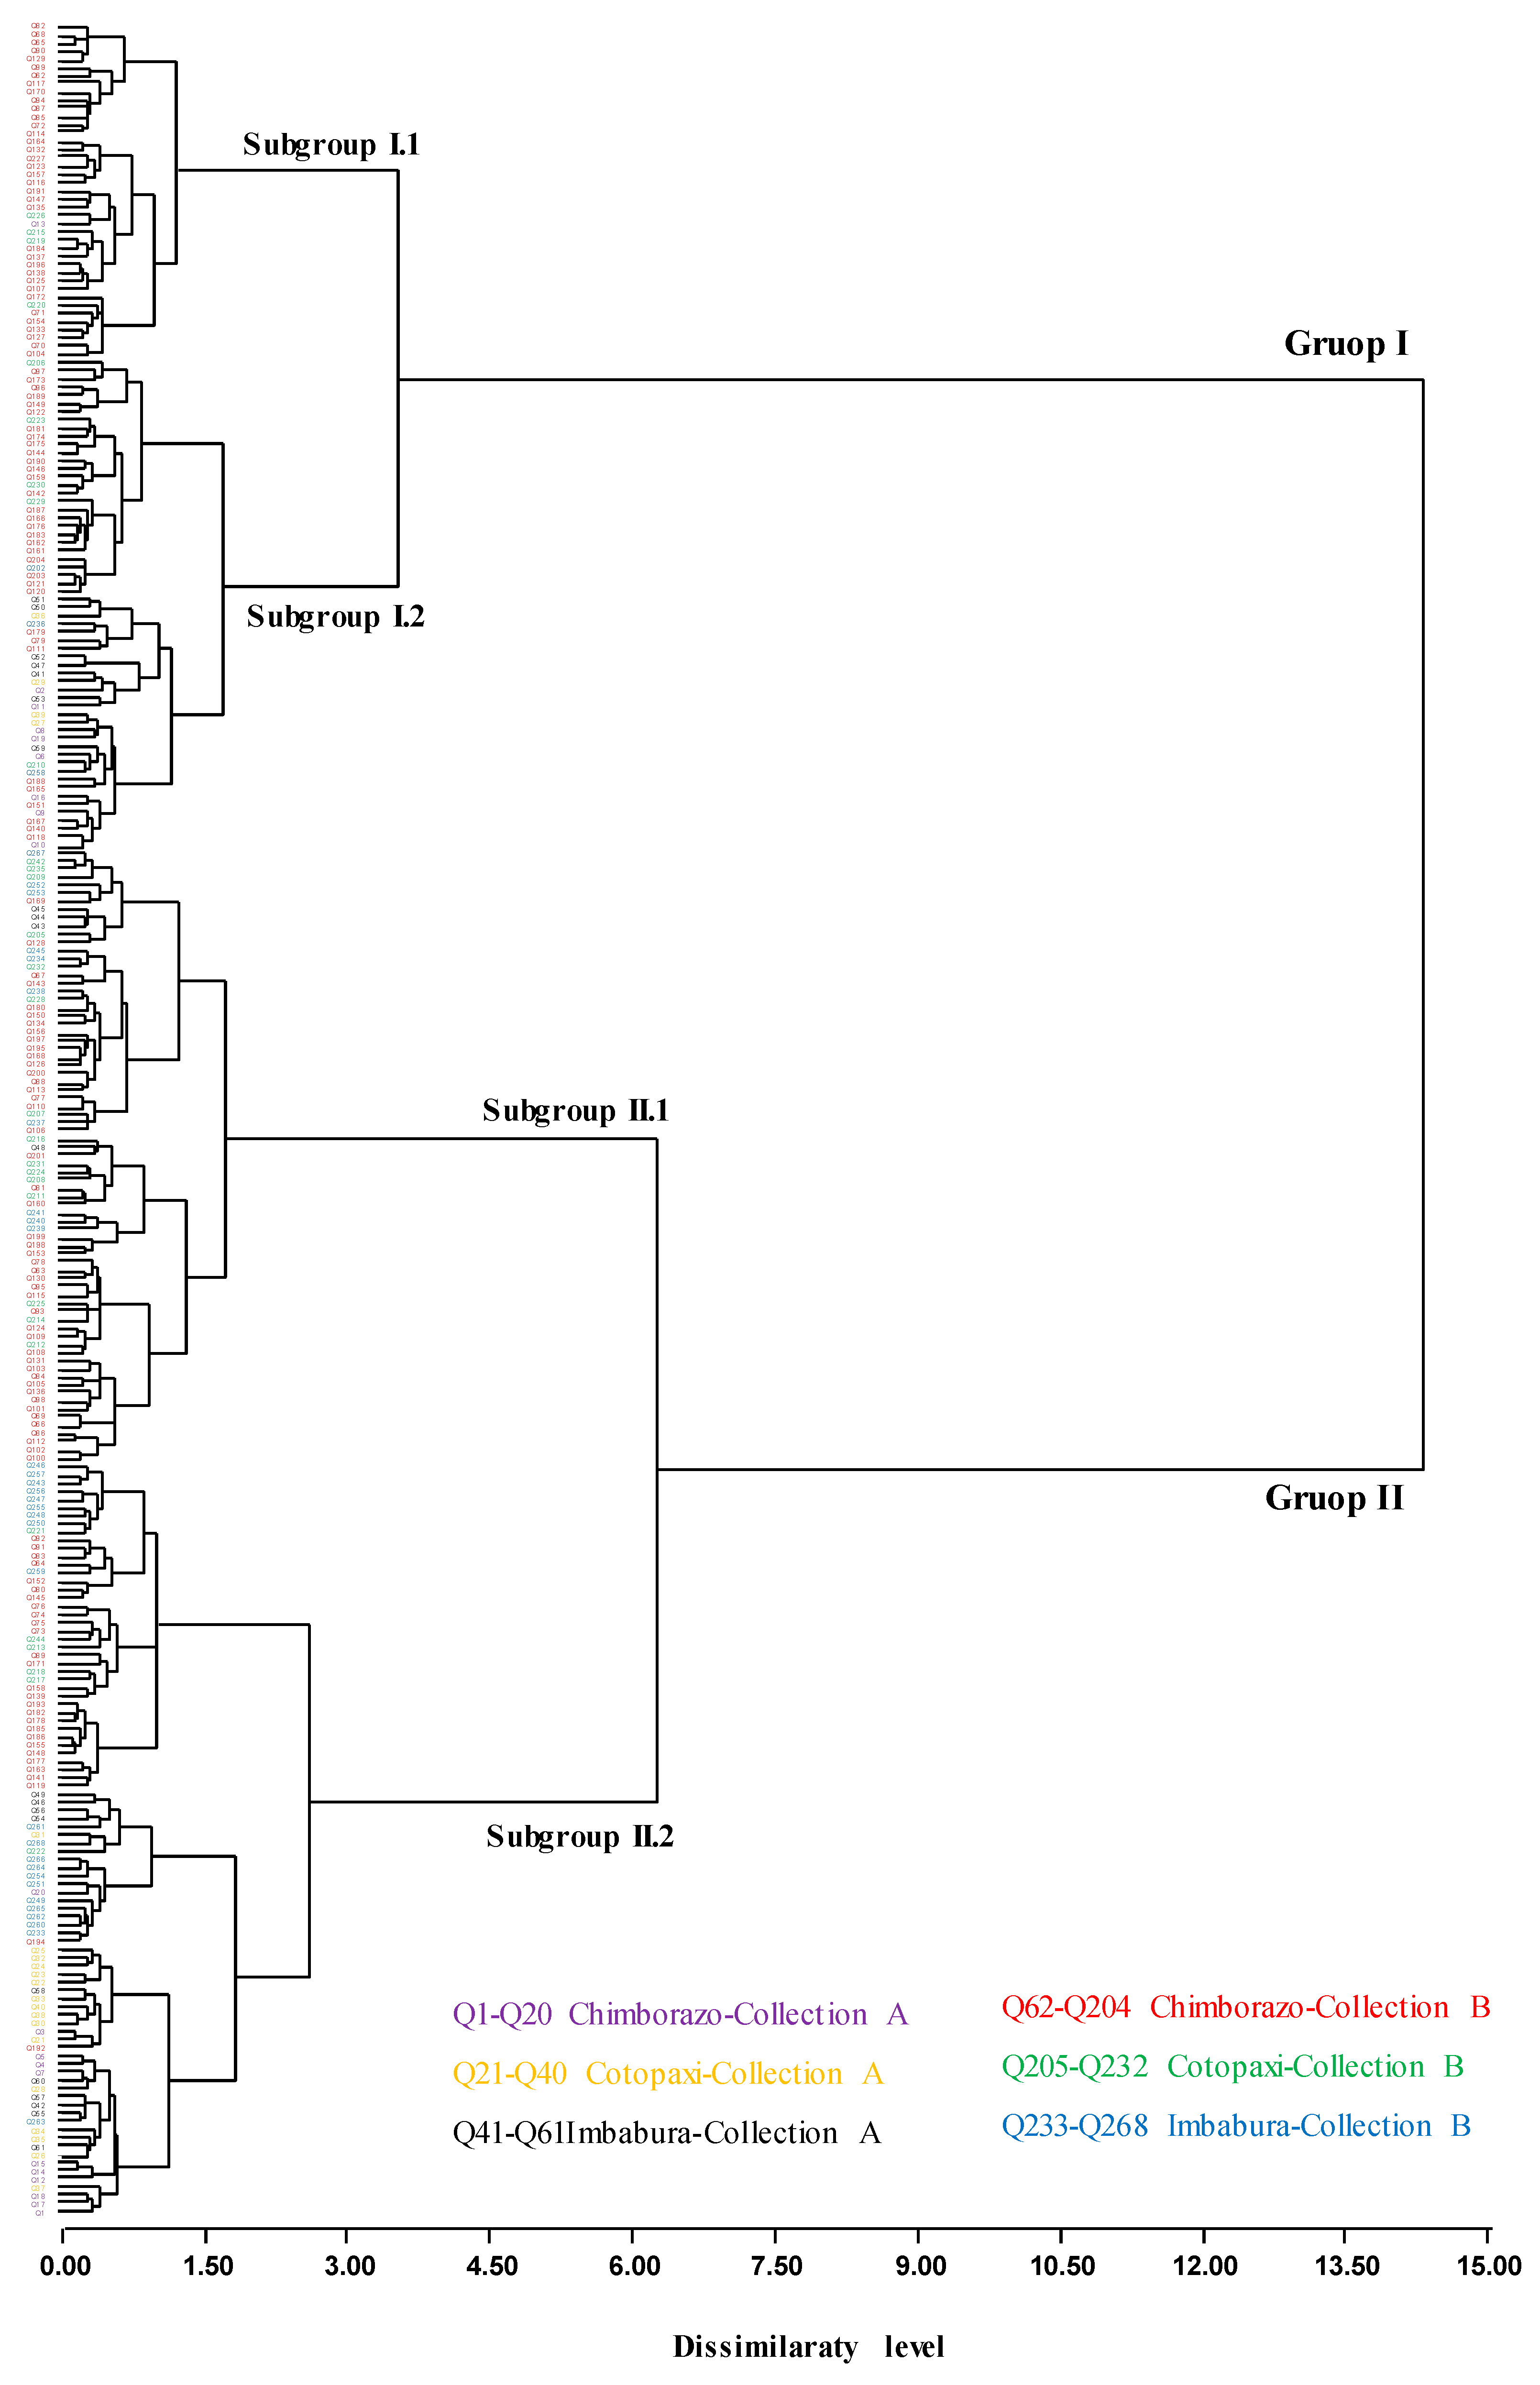
3.3. Cluster Analysis Based on Phenotypic Characters

The dendrogram in Figure 5 shows the phenotypic relationships between the 268 quinoa accessions obtained from the data of the 17 quantitative and the 18 polymorphic qualitative characters analysed. Mantel’s test revealed a good and highly significant cophenetic correlation (r = 0.683; p = 0.0001), which indicates the existence of a good fit between the relationships established in the dendrogram and the distance matrix used to construct it [36].
The 268 accessions were clustered into two large groups (I and II) at a dissimilarity level of 14.32 (Figure 5). Group I contains 101 accessions, with 20 from Collection A and 81 from Collection B, while Group II contains the remaining 167 accessions, with 41 from Collection A and 126 from Collection B. In each of the two groups, we found a mixture of accessions from the three provinces and the two collections. Five quantitative descriptors were found to be significantly different between Groups I and II (see Supplementary Table S2): plant height, petiole length, maximum leaf length, maximum leaf width and 1000-grain weight. Highly significant differences were also found between both groups for seven qualitative descriptors, all of them related to the pigmentation of different plant parts (see Supplementary Table S3). In general, the Group I accessions showed significantly higher mean values for the plant height, leaf size and grain weight than the Group II accessions (see Supplementary Table S2). Also, most Group I accessions showed more intensely pigmented plants (usually with a purple main stem and panicle) than Group II accessions (usually with a yellow main stem and yellow or green panicle).
On the other hand, in Group I, two subgroups (I.1 and I.2) were differentiated at a dissimilarity level of 3.52 (Figure 5). Subgroup I.1 includes 41 accessions, while Subgroup I.2 contains 60 accessions. Again, the quantitative descriptors of plant height, petiole length, maximum leaf length and maximum leaf width, in addition to those of grain width and seed yield per plant, were significantly different between the two subgroups (see Supplementary Table S2). Regarding the qualitative characters, significant differences were detected between the two subgroups for the main stem shape, leaf shape, number of teeth on leaf blade, petiole colour, leaf lamina colour and presence of saponin (see Supplementary Table S3). Subgroup I.1 accessions presented higher mean values for plant height, leaf size, grain width and seed yield per plant (see Supplementary Table S2). Also, most of Subgroup I.1 accessions showed triangular leaves with more than 12 teeth, while those of Subgroup I.2 showed mainly rhomboidal leaves with few teeth.
In Group II, two subgroups (II.1 and II.2) were also defined at a dissimilarity level of 6.25 (Figure 5). Subgroup II.1 contains 75 accessions, while Subgroup II.2 comprises 92 accessions. In this case, the quantitative descriptors plant height, main stem diameter, petiole length, maximum leaf length, maximum leaf width, grain width, 1000-grain weight and number of days to the end of flowering were significantly different between both subgroups (see Supplementary Table S2). For qualitative descriptors, significant differences were found between both subgroups in the growth habit, main stem colour, presence of pigmented axils, striae colour, presence of branching, leaf shape, number of teeth on leaf blade, dehiscence degree, episperm colour and presence of saponin (see Supplementary Table S3). Subgroup II.1 accessions presented mean values for the plant height, main stem diameter, leaf size, grain width and 1000-grain weight that were significantly higher than those obtained for Subgroup II.2 accessions. Furthermore, Subgroup II.2 clustered the accessions that finished flowering earlier than Subgroup II.1 accessions (see Supplementary Table S2). Also, most of the accessions in Subgroup II.1 had triangular leaves with more than 12 teeth, while those of Subgroup II.2 had rhomboidal leaves with few teeth.

3.4. Selection Index

The selection index values ranged from 45.68 to 86.89. Significantly high values were considered to be those equal to or higher than 80. With these S.I. values, 14 accessions were found (see Supplementary Table S1), all of them recently collected (2014–2015; Collection B), with 13 in Chimborazo and 1 in Cotopaxi. These 14 accessions had plant heights ranging from 155 to 228 cm, with a mean of 196.79 cm, 1000-grain weights ranging from 2.8 to 3.6 g, with a mean of 3.1 g, and yields ranging from 28.4 to 59.71 g/plant, with a mean of 38.87 g/plant. In contrast, the accessions with the lowest selection index values were mostly found in Collection A. The five accessions with the lowest S.I. values (45.68–55.88) were collected four decades ago, with four of them from the province of Cotopaxi (Q23, Q34, Q35 and Q36; see Supplementary Table S1). These accessions had plants with an average height of 1.10 m, an average 1000-seed weight of 2.7 g and an average yield of less than 10 g/plant, and also, all of them contained saponin.
Finally, three accessions (Q89, Q153 and Q198) showed the highest values for yield and 100-grain weight and did not contain saponin (see Table S1). These accessions also had plants with a significant height range (1.5–2 m), although they were late accessions, with values of 211 days to physiological maturity.

4. Discussion

The phenotypic evaluation of the biodiversity present in neglected and underutilised traditional crop varieties is essential for the proper management and conservation of these plant genetic resources [18,38,39]. Furthermore, the quinoa germplasm grown by local farmers may contain native accessions with some interesting phenotypes or genotypes for future breeding programs [3,38]. On the other hand, the comparison of the agronomic behaviours of accessions collected during two different time periods, separated by about four decades, has allowed us to know the biodiversity, productivity and current conservation status of quinoa accessions from the Ecuadorian Andean region. In addition, this comparison has also provided information on the changes in biodiversity that have occurred in recent decades.
The agro-morphological characterisation of quinoa accessions showed that most of the studied quantitative characters showed a high variability, with the panicle width and seed yield per plant showing the highest variations in both collections. The seed yield per plant is a widely studied variable, in which high variation is usually observed in the quinoa genotypes [10,18,40,41]. In the present study, higher yields were observed in quinoa accessions from Collection B as well as an increase in the plant heights. Both characteristics are usually positively correlated [41,42,43]. However, Manjarres-Hernández et al. [18] and De Santis et al. [40] have reported a negative correlation between the yield and plant height, which is probably because plants lengthen their vegetative period by expending energy on plant growth rather than grain maturation [18].
When comparing the results obtained between provinces within the same collection, it was observed that the accessions of Collection A were more homogeneous in their quantitative characteristics, while the accessions of Collection B showed a high and significant heterogeneity between the provinces. These data would indicate that in the three provinces and over the last four decades, it does not seem that the same pattern of behaviour has been followed with regard to the management and conservation of native quinoa accessions [5,14].
Furthermore, a high variability was observed in the three provinces studied for characters such as the panicle width, grain width, 1000-grain weight and seed yield per plant, with the values significantly higher in accessions from Collection B. These descriptors are usually important for quinoa commercialisation and are widely used as selection criteria for germplasms in breeding programs [18]. Some of these variables are often highly correlated, such as the panicle width and yield [44,45]. On the other hand, it is worth noting that in both collections and for the three provinces, an inverse relationship between earliness and seed yield per plant was observed, which has already been observed in the evaluation of different quinoa germplasms [10,40,42]. Meanwhile the quantitative descriptors related to flowering showed a highly positive and significant correlation with each other in both collections. Similarly, the descriptors related to the leaf size also showed the same behaviour with each other, which has been reported in quinoa accessions from the Chilean Highlands [46] and in varieties cultivated in the department of Boyacá, Colombia [47].
In this study, the qualitative characters also showed a high diversity in the accessions analysed in both collections. This heterogeneity in the qualitative variables is of great importance, because it allows plants to adapt more quickly to changing environmental conditions [18]. The most significantly distinct characteristics, both between collections and between provinces for the same collection, were related to the pigmentation of different parts of the plant (stem, axils, striae, panicle and grain). The variations in plant pigmentation can be influenced by environmental conditions, but these characteristics are often used to differentiate and identify quinoa varieties/accessions [18,43,44,45]. The colour of the pericarp has been shown to be a highly distinguishing characteristic among the accessions conserved in the INIAP Germplasm Bank [10]. Its use was proposed to detect differences among genetic groups, and it was one of the characteristics considered for the selection of genotypes in future quinoa breeding programs in Ecuador.
On the other hand, we observed qualitative characters, which in the older accessions (Collection A), showed some states that were not found in the most recently collected accessions (Collection B), such as the variables colour of the striae and colour of the pericarp. Regarding the latter, although a cream colour was the predominant in both collections, other darker colours (pink, coffee or purple) present in some accessions of Collection A were not observed in any accession of Collection B. This loss of pericarp colour could be because those dark colours in the grain are not so appetizing for consumers, as they are usually associated with bitter flavours due to the presence of saponin [45]. In addition, the market trend in recent decades in countries such as Colombia and Ecuador has been to market light-coloured grains, which are generally associated with a low saponin content and therefore, with a sweeter taste [45], while countries such as Bolivia and Peru prefer dark-coloured grains, since they are more desired by the Indigenous population as well as for use in gourmet cuisine [45,48].
We also found qualitative characters with states detected in accessions from Collection B that were not observed in those from Collection A, such as the variables of growth habit, main stem shape and presence/absence of saponin. The appearance of new characteristics could be due to the exchange of the germplasm with other regions and/or introgression from improved varieties [3,14]. Seed exchange has been very common in these Andean provinces in the last decades, especially since 1998, when the so-called “Seed Exchange Fairs” emerged, in which the exchange of germplasms of traditional varieties of different native crops is usually carried out [14]. Furthermore, since the first improved varieties were released in the early 1990s [49] as part of a government-financed initiative to increase quinoa production and consumption nationwide [5], the seeds of these varieties (especially INIAP-Tunkahuan) have also been introduced into informal seed exchange networks, particularly by low-income farmers [3].
Regarding the presence/absence of saponin, all accessions collected four decades ago had saponin, while saponin was detected only in 18% of those collected more recently. This could be related to the fact that to eliminate the bitter taste due to the presence of saponin in the seeds, it is necessary to perform numerous washes with water or carry out strong scarification before consuming them or putting them up for sale, leading to increased production costs [50]. Consequently, in recent decades, farmers have been selecting quinoa accessions with a low or nearly no saponin content, obtained through seed exchange with other regions or by a possible introgression from commercial varieties [3,14].
On the other hand, during the last four decades, farmers have been able to carry out a differential selection process according to the province. This would have been achieved according to the needs of each region [5], which would have contributed to generating a greater differentiation in the agro-morphological characteristics of local accessions among the different Andean provinces. The existence of different selection criteria depending on the region and/or farmers is common in other crops, as occurs in corn grown in different areas of the state of Morelos, Mexico [51]. Similarly, when comparing accessions collected in the same province but at different times, significant differences were also observed for the number and type of qualitative characters depending on the province. In the provinces of Chimborazo and Imbabura, high numbers of qualitative characters were detected that significantly differed between the two collections, while in Cotopaxi, the significant differences between the collections were smaller. This could be due to the fact that in the first two provinces, it is very common to hold numerous seed exchange fairs per year (up to 15 in Imbabura and 8 in Chimborazo [14]), while in the province of Cotopaxi, these fairs do not take place [14], and the quinoa that is grown for commercial purposes is of the INIAP-Tunkahuan variety [16], with the cultivation of traditional varieties being a minority and for self-consumption. For this reason, it is logical to think that the local varieties grown in Cotopaxi have been able to conserve most of their agro-morphological characteristics over the last 40 years.
Regarding the phenotypic relationships established in the dendrogram, the accessions were not grouped by their geographical origin or by the collection, since admixed accessions from the three provinces and from both collections were found in the defined groups and subgroups. This same behaviour has been observed in other studies, where accessions were not clustered according to the origin place of the germplasm [18], suggesting that these groupings could be more related to the agroclimatic conditions of the area where the quinoa accessions are usually grown [43,47]. Curti et al. [52] also found a high phenotypic diversity in quinoa germplasms from different areas of northwest Argentina, which would reflect the variations found in the environmental conditions of the origin area of each of the accessions.
The most different quantitative characters between the groups and subgroups of accessions established in the dendrogram were the plant height, yield and those related to the leaf and grain size. Morillo et al. [43,44] reported that accessions collected in the department of Boyacá were also grouped mainly by the morphological characteristics related to the plant height and leaf size. Similarly, Mhada et al. [42], when evaluating agro-morphological diversity of Andean quinoa accessions introduced in Morocco, found that traits related to the plant height and seed size contributed significantly to the associations obtained in the cluster analysis. On the other hand, the most different qualitative characters between the two main groups of the dendrogram were those related to the pigmentation of different parts of the plant, especially the colour of the main stem, leaf blade and panicle, while the leaf shape and number of teeth on the leaf were highly differentiating between subgroups within each main group.
The highest selection index values were found in some accessions of Collection B from Chimborazo, which could indicate that in the recent decades, the Chimborazo farmers have carried out a selection process on their traditional quinoa accessions to obtain a higher yield and reduce the saponin content. In this sense, although farmers in the province of Chimborazo have always essentially cultivated the so-called “Chimborazo” variety [14], conserving the seeds of these accessions as an important part of their family heritage [10], in the last decades, they seem to have carried out the selection processes necessary to adapt to the consumer requirements of the national and international markets [24]. On the other hand, some of these accessions collected in the province of Chimborazo (especially Q89, Q153 and Q198) can be considered promising for future genetic breeding projects of quinoa in the Andean region of Ecuador, mainly focused on obtaining a greater yield of this crop in this region. Similarly, Manjarres-Hernández et al. [18] and Delgado et al. [25] also used the selection index in Colombian quinoa accessions to identify promising materials for breeding programs in terms of the yield.
Finally, it should be noted that although quinoa is a highly autogamous plant [24,53,54], we have detected a high phenotypic variability, confirming what has been reported in other studies carried out by Tapia et al. [10] and Gandarillas et al. [11] in Ecuadorian quinoa accessions. This high variability could be because farmers exchange and mix germplasms from different origins in the same sowing, due to a lack of information when selecting the seeds and/or because they do not have enough land to sow seeds of different origins separately [18]. Likewise, the agro-morphological evaluation carried out in the present study has generated valuable information that should be taken into account in future breeding programs, as well as in a more efficient management of the collection of native quinoas conserved in the germplasm bank of the INIAP.

5. Conclusions

A high phenotypic variability was detected, both with the quantitative and qualitative characters, in quinoa landraces from the Ecuadorian Andean region. The descriptors commonly used for both quinoa commercialization and germplasm selection for breeding programs, such as the panicle width, grain width, 1000-grain weight, panicle and grain colour and seed yield per plant, showed a high variability. Also, the accessions collected four decades ago were phenotypically more homogeneous between different provinces than those collected more recently, probably due to the existence of different selection criteria depending on the province and farmers. In recent decades, we have observed both the loss of some characteristics, probably due to farmer adaptations to quinoa market trends, and the appearance of some new ones, in this case, due to germplasm exchange between regions and/or the introgression of commercial varieties. Finally, the selection index has allowed us to detect accessions recently collected in Chimborazo that are highly promising for future breeding programs in Ecuador.

Supplementary Materials

The following supporting information can be downloaded at: https://www.mdpi.com/article/10.3390/agriculture14030336/s1, Table S1. Passport data of 268 quinoa (Chenopodium quinoa Willd.) accessions analysed, from the National Institute of Agricultural Research (INIAP) Germplasm Bank (GB) collection in Pichincha, Ecuador. Q1 to Q61, accessions from Collection A (1979 to 1986); Q62 to Q268, accessions from Collection B (2014 and 2015). The selection index for each accession is also shown. Figure S1. Spearman correlations between 17 polymorphic quantitative traits analysed in the 61 quinoa accessions from Collection A (a) and 207 accessions from Collection B (b). Table S2. Comparison of mean values of quantitative descriptors (D1 to D17) obtained for the quinoa accessions groups defined in the dendrogram (see Figure 5): Group I (G I) vs. Group II (G II); Subgroup I.1 (SG I.1) vs. Subgroup I.2 (SG I.2); Subgroup II.1 (SG II.1) vs. Subgroup II.2 (SG II.2), p-values obtained for each descriptor are indicated; significant differences (p < 0.05) between the means are shown in bold. Table S3. Distinguishing values obtained through the Chi-square (X2) test for the polymorphic qualitative descriptors in the agro-morphological differentiation of the quinoa accession groups defined in the dendrogram (see Figure 5): Group I (G I), Group II (G II), Subgroup I.1 (SG I.1), Subgroup I.2 (SG I.2), Subgroup II.1 (SG II.1), and Subgroup II.2 (SG II.2). Significant different values (p < 0.05) are shown in bold.

Author Contributions

Conceptualization by H.D., C.T. and J.P.M.; collection of plant materials, essay implementation of the field and data acquisition by H.D., E.B. and E.N.; methodology and data analysis by H.D., E.H.M.-H. and J.P.M.; writing—original draft preparation by H.D., E.H.M.-H. and J.P.M.; writing final draft—reviews and editing by H.D., E.H.M.-H., C.T., E.N., E.B. and J.P.M. All authors have read and agreed to the published version of the manuscript.

Funding

We acknowledge funding from the Global Environment Facility (GEF) under the project “Main-streaming the use and conservation of agrobiodiversity in public policy through integrated strategies and in situ implementation in four Andean Highlands provinces” GCP/ECU/086/GFF GEF. We acknowledge also the financial support from the “Universidad Politécnica de Madrid” through the projects VAGI18JPMC, VAGI19JPMC and VAGI20JPMC.

Institutional Review Board Statement

Not applicable.

Data Availability Statement

The data presented in this study are available on request from the corresponding author.

Acknowledgments

We acknowledge to Department of Plant Genetic Resources of the National Institute for Agricultural Research (DENAREF-INIAP, Ecuador) for allowing us to study a part of their quinoa collection (Chenopodium quinoa Willd.). We would like to thank Selena Annette Gómez English for her help with the English revision and the anonymous reviewers for their comments, which helped to improve previous versions of this manuscript.

Conflicts of Interest

The authors declare no conflicts of interest.

References

  1. Ain, Q.T.; Siddique, K.; Bawazeer, S.; Ali, I.; Mazhar, M.; Rasool, R.; Mubeen, B.; Ullah, F.; Unar, A.; Jafar, T.H. Adaptive mechanisms in quinoa for coping in stressful environments. PeerJ 2022, 11, 31–32. [Google Scholar] [CrossRef]
  2. FAO; Future Smart Food. Rediscovering Hidden Treasures of Neglected and Underutilized Species for Zero Hunger in Asia, Executive Summary; Food & Agriculture Organization: Bangkok, Tailandia, 2018; p. 36. [Google Scholar]
  3. Salazar, J.; De Lourdes Torres, M.; Gutierrez, B.; Torres, A.F. Molecular characterization of Ecuadorian quinoa (Chenopodium quinoa Willd.) diversity: Implications for conservation and breeding. Euphytica 2019, 215, 60. [Google Scholar] [CrossRef]
  4. Yugcha, T. Zonificación Potencial del Cultivo de la Quinua en el Callejón Interandino del Ecuador; Ministerio de Agricultura y Ganadería (MAG): Quito, Ecuador, 1996; p. 10.
  5. Peralta, E.; Mazón, N. La Quinua en Ecuador. Capítulo 5.3. En Estado del Arte de la Quinua en el Mundo en 2013; Bazile, D., Bertero, D., Nieto, C., Eds.; FAO (Santiago de Chile) y CIRAD: Montpillier, Francia, 2014; pp. 462–746. [Google Scholar]
  6. Hinojosa, L.; González, J.A.; Barrios-Masias, F.H.; Fuentes, F.; Murphy, K. Quinoa Abiotic Stress Responses: A Review. Plants 2018, 7, 106. [Google Scholar] [CrossRef]
  7. Risi, J.C.; Galwey, N.W. The Chenopodium grains of the Andes: Inca crops for modern agriculture. Adv. Appl. Biol. 1984, 10, 145–216. [Google Scholar]
  8. Bazile, D.; Jacobsen, S.E.; Verniau, A. The global expansion of quinoa: Trends and Limits. Front. Plant Sci. 2016, 7, 622. [Google Scholar] [CrossRef]
  9. Alandia, G.; Rodriguez, J.P.; Jacobsen, S.E.; Bazile, D.; Condori, B. Global expansion of quinoa and challenges for the Andean region. Glob. Food Sec. 2020, 26, 100429. [Google Scholar] [CrossRef]
  10. Tapia, C.; Peralta, E.; Mazón, N. Colección núcleo de quinua (Chenopodium quinoa Willd.) del Banco de Germoplasma del INIAP, Ecuador. Axioma 2015, 12, 5–9. [Google Scholar]
  11. Gandarillas, H.; Nieto, C.; Castillo, R. Razas de Quinua en Ecuador. Boletín Técnico No.67. Estación Experimental Santa Catalina; Instituto Nacional de Investigaciones Agropecuarias: Quito, Ecuador, 1989; p. 22. [Google Scholar]
  12. Tapia, E.; Rosas, A. Agrobiodiversidad en La Encañada. Sistematización de las Experiencias de Conservación in Situ de los Recursos Fitogenéticos, Cajamarca; Condesan, Aspaderuc, CIP, GTZ: Cajamarca, Perú, 1998; p. 26. [Google Scholar]
  13. INABIO (Instituto Nacional de Biodiversidad). Metas AICHI. 13: Diversidad Genética Mantenida. 2019. Available online: http://inabio.biodiversidad.gob.ec/2019/01/30/13-diversidad-genetica-mantenida/ (accessed on 15 July 2022).
  14. DENAREF (Departamento Nacional de Recursos Fitogenéticos); Banco Nacional de Germoplasma. Estación Experimental Santa Catalina; INIAP: Quito, Ecuador, 2016; p. 34. [Google Scholar]
  15. Peralta, E.; Mazón, N.; Murillo, Á.; Villacrés, E.; Rivera, M. Catalogó de Variedades Mejoradas de Granos Andino: Chocho, Quinua, Amaranto, Sangorache, Para la Sierra Ecuatoriana. Publicación Miscelánea No. 151. Tercera Edición. Programa Nacional de Leguminosas y Granos Andinos; Estación Experimental Santa Catalina INIAP: Quito, Ecuador, 2013; p. 63. [Google Scholar]
  16. Monteros, A. Rendimientos de Quinua en el Ecuador. In Dirección de Análisis y Procesamiento de la Información Coordinación General del Sistema de Información Nacional Ministerio de Agricultura; Ganadería, Acuacultura y Pesca: Quito, Ecuador, 2016; p. 9. [Google Scholar]
  17. El-Harty, E.H.; Ghazy, A.; Alateeq, T.K.; Al-Faifi, S.A.; Khan, M.A.; Afzal, M.; Alghamdi, S.S.; Migdadi, H.M. Morphological and Molecular Characterization of Quinoa Genotypes. Agriculture 2021, 11, 286. [Google Scholar] [CrossRef]
  18. Manjarres-Hernández, E.H.; Arias-Moreno, D.M.; Morillo, A.C.; Ojeda-Pérez, Z.Z.; Cárdenas-Chaparro, A. Phenotypic Characterization of Quinoa (Chenopodium quinoa Willd.) for the Selection of Promising Materials for Breeding Programs. Plants 2021, 10, 1339. [Google Scholar] [CrossRef]
  19. Romero, M.; Mujica, A.; Pineda, E.; Ccamapaza, Y.; Zavalla, N. Genetic identity based on simple sequence repeat (SSR) markers for Quinoa (Chenopodium quinoa Willd.). Cienc. Inv. Agric. 2019, 46, 166–178. [Google Scholar] [CrossRef]
  20. Mazón, N.; Rivera, M.; Peralta, E.; Estrella, J.; Tapia, C. Catálogo del Banco de Germoplasma de Quinua (Chenopodium quinoa Willd.); de INIAP-Ecuador: Quito, Ecuador, 2001; p. 97. [Google Scholar]
  21. Peralta, E. Amaranto y Ataco: Preguntas y Respuestas. Boletín Divulgativo No. 359. Programa Nacional de Leguminosas y Granos Andinos. Estación Experimental Santa Catalina; INIAP: Quito, Ecuador, 2009; p. 8. [Google Scholar]
  22. Bioversity International; FAO; PROINPA; INIAF; FIDA. Descriptores Para Quinua (Chenopodium quinoa Willd.) y Sus Parientes Silvestres; Bioversity International: Roma, Italy; Organización de las Naciones Unidas para la Agricultura y la Alimentación: Roma, Italy; Fundación PROINPA: La Paz, Bolivia; Instituto Nacional de Innovación Agropecuaria y Forestal: La Paz, Bolivia; Fondo Internacional de Desarrollo Agrícola: Roma, Italy, 2013; p. 52. [Google Scholar]
  23. Koziol, M.J. Afrosimetric estimation of threshold saponin concentration for bitterness in quinoa (Chenopodium quinoa Willd). J. Sci. Food Agric. 1991, 54, 211–219. [Google Scholar] [CrossRef]
  24. Gómez, L.; Aguilar, E. Guía de Cultivo de la Quinua; Organización de las Naciones Unidas para la Alimentación y la Agricultura, Universidad Nacional Agraria La Molina, Programa de Investigación y Proyección Social de Cereales y Granos Nativos Facultad de Agronomía: Lima, Peru, 2016; p. 130. [Google Scholar]
  25. Delgado, A.I.; Palacios, J.H.; Betancourt, C. Evaluation of 16 genotypes of sweet quinoa (Chenopodium quinoa Willd.) in the municipality of Iles, Nariño (Colombia). Agron. Colomb. 2009, 27, 159–167. [Google Scholar]
  26. INFOSTAT. Grupo InfoStat, Versión 2020; Software Estadístico; Universidad Nacional de Córdoba (FCA): Córdoba, Argentina, 2020; Available online: http://www.infostat.com.ar (accessed on 15 April 2020).
  27. Fisher, R.A. The Use of Multiple Measurements in Taxonomy Problems. Ann. Eugen. 1936, 7, 179–188. [Google Scholar] [CrossRef]
  28. Spearman, C. The proof and measurement of association between two things. Am. J. Psychol. 1904, 15, 72–101. [Google Scholar] [CrossRef]
  29. Taiyun, W.; Simko, V. R package “corrplot”: Visualization of a Correlation Matrix (version 0.84). Statistician 2017, 56, e24. [Google Scholar]
  30. Kassambara, A.; Mundt, F. Factoextra: Extract and Visualize the Results of Multivariate Data Analyses. R Package Version 2020, 1, 337–354. [Google Scholar]
  31. Le, S.; Josse, J.; Husson, F. FactoMineR: An R Package for Multivariate Analysis. J. Stat. Softw. 2008, 25, 1–18. [Google Scholar] [CrossRef]
  32. Cochran, W.G. Some methods of strengthening the common X2 tests. Biometrics 1954, 10, 417–451. [Google Scholar] [CrossRef]
  33. Pearson, K. On the X2 test of goodness of fit. Biometrika 1922, 14, 186–191. [Google Scholar] [CrossRef]
  34. Cramér, H. Mathematical Methods of Statistics; Princeton University Press: Princeton, NJ, USA, 1946. [Google Scholar]
  35. Gower, J.A. Comparison of some methods of cluster analysis. Biometrics 1967, 23, 623–627. [Google Scholar] [CrossRef]
  36. Ward, J.H. Hierarchical grouping to optimize an objective function. J. Am. Stat. Assoc. 1963, 58, 236–244. [Google Scholar] [CrossRef]
  37. Rohlf, F.J. NTSYS-pc: Numerical Taxonomy System (ver. 2.2); Exeter Publishing, Ltd.: Setaukert, NY, USA, 2008. [Google Scholar]
  38. Nguyen, D.C.; Tran, D.S.; Tran, T.T.H.; Ohsawa, R.; Yoshioka, Y. Genetic diversity of leafy amaranth (Amaranthus tricolor L.) resources in Vietnam. Breed. Sci. 2019, 69, 640–650. [Google Scholar] [CrossRef]
  39. Nyasulu, M.; Sefasi, A.; Chimzinga, S.; Maliro, M. Agromophological characterisation of Amaranth Accessions from Malawi. Am. J. Plant Sci. 2021, 12, 1528–1542. [Google Scholar] [CrossRef]
  40. De Santis, G.; Ronga, D.; Caradonia, F.; D Ambrosio, D.; Troisi, J.; Rascio, A.; Fragasso, M.; Pecchioni, N.; Rinaldi, M. Evaluation of two groups of quinoa (Chenopodium quinoa Willd.) accessions with different seed colours for adaptation to the Mediterranean environment. Crop. Pasture Sci. 2018, 69, 1264–1275. [Google Scholar] [CrossRef]
  41. Maliro, M.F.A.; Guwela, V.F.; Nyaika, J.; Murphy, K.M. Preliminary Studies of the Performance of Quinoa (Chenopodium quinoa Willd.) Genotypes under Irrigated and Rainfed Conditions of Central Malawi. Front. Plant Sci. 2017, 8, 1268014. [Google Scholar] [CrossRef]
  42. Mhada, M.; Jellen, E.N.; Jacobsen, S.E.; Benlhabib, O. Diversity Analysis of a Quinoa (Chenopodium quinoa Willd.) Germplasm during Two Seasons. Int. J. Agric. Biol. Eng. 2014, 8, 273–276. [Google Scholar] [CrossRef]
  43. Morillo, A.C.; Manjarres-Hernández, E.H.; Morillo, Y. Evaluación morfoagronómica de 19 materiales de Chenopodium quinoa en el Departamento de Boyacá. Biotecnol. Sect. Agropecu. Agroind. 2020, 8, 84–96. [Google Scholar]
  44. Morillo, A.C.; Manjarres-Hernández, E.H.; Reyes, W.L.; Morillo, Y. Intrapopulation phenotypic variation in Piartal (Chenopodium quinoa Willd.) from the Departament of Boyacá, Colombia. Afr. J. Agric. Res. 2020, 16, 1195–1203. [Google Scholar] [CrossRef]
  45. Morillo, A.C.; Manjarres-Hernández, E.H.; Morillo, Y. Phenotypic diversity of agromorphological characteristics of quinoa (Chenopodium quinoa Willd.) germplasm in Colombia. Sci. Agric. 2022, 79, 4. [Google Scholar] [CrossRef]
  46. Fuentes, F.F.; Bhargava, A. Morphological analysis of quinoa germplasm grown under lowland desert conditions. J. Agron. Crop. Sci. 2011, 197, 124–134. [Google Scholar] [CrossRef]
  47. Infante, I.; Albesiano, S.; Arrienta, L.; Gomez, N. Morphological characterization of varieties of Chenopodium quinoa cultivated in the department of Boyacá, Colombia. Rev. U.D.C.A. Actual. Divulg. Cient. 2018, 21, 329–339. [Google Scholar]
  48. Bonifacio, A.; Aroni, G.; Villca, M. Catálogo Etnobotánico de la Quinua Real; PROINPA: Cochabamba, Bolivia, 2012; p. 63. [Google Scholar]
  49. Monteros, C.; Nieto, C.; Caicedo, C.; Rivera, M.; Vimos, C.; INIAP-ALEGRÍA. Primera Variedad Mejorada de Amaranto Para la Sierra Ecuatoriana. Boletín Divulgativo No.246. Programa de Cultivos Andinos. Estación Experimental Santa Catalina; INIAP: Quito, Ecuador, 1994; p. 24. [Google Scholar]
  50. Peralta, E.; Mazón, N.; Murillo, Á.; Rivera, M.; Rodríguez, D.; Lomas, L.; Monar, C. Manual Agrícola de Granos Andinos: Chocho, Quinua, Amaranto y Ataco. Cultivos, variedades y costos de producción, 3rd ed.; INIAP: Quito, Ecuador, 2012; p. 68. [Google Scholar]
  51. McLean-Rodríguez, F.D.; Costich, D.E.; Camacho-Villa, T.C.; Pé, M.E.; Dell´Acqua, M. Genetic diversity and selection signatures in maize landraces compared across 50 years of in situ and ex situ conservation. Heredity 2021, 126, 913–928. [Google Scholar] [CrossRef]
  52. Curti, R.N.; Andrade, A.J.; Bramardi, S.; Velásquez, B.; Bertero, H.D. Ecogeographic structure of phenotypic diversity in cultivated populations of quinoa from Northwest Argentina. Ann. Appl. Biol. 2012, 160, 114–125. [Google Scholar] [CrossRef]
  53. Nieto, C.; Castillo, R.; Peralta, E. Guía Para la Producción de Semilla de Quinua. Boletín Divulgativo No. 186. Estación Experimental Santa Catalina; INIAP: Quito, Ecuador, 1986; p. 120. [Google Scholar]
  54. Zurita-Silva, A.; Fuentes, F.; Zamora, P.; Jacobsen, S.E.; Schwember, A.R. Breeding quinoa (Chenopodium quinoa Willd.): Potential and perspectives. Mol. Breed. 2014, 34, 13–30. [Google Scholar] [CrossRef]
Figure 1. Geographical map of Ecuador indicating the collection sites of quinoa (Chenopodium quinoa Willd.) landraces in three provinces (Imbabura, Cotopaxi and Chimborazo) of the Ecuadorian Andean region and at two different times (Collection A and Collection B).
Agriculture 14 00336 g001
Figure 2. Principal component analysis biplot for 268 quinoa accessions (Collections A and B) using the quantitative descriptors (D1 to D17).
Agriculture 14 00336 g002
Figure 3. Principal component analysis biplots using the quantitative descriptors (D1 to D17) for (a) 61 quinoa accessions from the three provinces in Collection A and (b) 207 accessions from the same provinces in Collection B.
Agriculture 14 00336 g003
Figure 4. Multiple correspondence analysis biplot for the 268 quinoa accessions and the two collections (A and B) using the qualitative descriptors (D18 to D40).
Agriculture 14 00336 g004
Figure 5. Ward’s hierarchical clustering dendrogram showing the phenotypic relationships among the 268 quinoa accessions (Q1 to Q268) collected in the provinces of Chimborazo, Cotopaxi and Imbabura, from Collection A and Collection B. It is based on data from 17 quantitative and 18 qualitative descriptors using the Gower’s distance.
Agriculture 14 00336 g005
Table 1. Quantitative and qualitative descriptors [22] used for agro-morphological characterisation of 268 quinoa accessions.
Quantitative Descriptors (Unit of Measure) Qualitative Descriptors
D1-Plant height (cm)D18-Type of growth
D2-Main stem diameter (cm)D19-Growth habit
D3-Petiole length (cm)D20-Main stem shape
D4-Maximum leaf length (cm)D21-Main stem colour
D5-Maximum leaf width (cm)D22-Presence of pigmented axils
D6-Panicle length (cm)D23-Presence of striae
D7-Panicle width (cm)D24-Striae colour
D8-Grain width (mm)D25-Presence of branching
D9-1000-grain weight (g)D26-Leaf shape
D10-Seed yield per plant (g)D27-Leaf margin
D11-Days to emergence (#)D28-Number of teeth on leaf blade
D12-Number of days to floral bud formation (#)D29-Petiole colour
D13-Number of days to start of flowering (#)D30-Leaf lamina colour
D14-Number of days to 50% of flowering (#) D31-Leaf granules colour
D15-Number of days to end of flowering (#)D32-Panicle colour at flowering
D16-Number of days to 50% physiological maturity (#)D33-Panicle colour at physiological maturity
D17-Harvest indexD34-Panicle shape
D35-Panicle density
D36-Dehiscence degree
D37-Pericarp colour
D38-Episperm colour
D39-Grain shape
D40-Presence of saponin *
* An afrosimetric method was used [23].
Table 2. Means and coefficients of variation (CVs) obtained for the 17 quantitative descriptors analysed in the 268 quinoa accessions from different collections (A and B), from different provinces for the same collection and within the same province for different collections.
Code—DescriptorCollection ACollection B Collection A (Means/Province) Collection B (Means/Province) Collection A vs. Collection B
(p-Values/Province)
MeanCV (%)MeanCV (%)p-ValueChimborazoCotopaxiImbaburap-ValueChimborazoCotopaxiImbaburap-ValueChimborazoCotopaxiImbabura
D1—plant height151.8415.60176.4810.27<0.0001154.65152.20148.810.7364177.62 A186.96 B163.81 C<0.0001<0.0001<0.00010.0025
D2—main stem diameter1.1815.671.2514.460.04621.131.131.310.17701.231.331.240.05180.01980.00020.1532
D3—petiole length3.0528.374.8913.37<0.00013.79 B2.57 A2.79 A<0.00015.05 B4.87 B4.23 A<0.0001<0.0001<0.0001<0.0001
D4—maximum leaf length5.6720.597.9311.09<0.00016.78 B5.08 A5.17 A<0.00018.18 B7.56 A7.22 A<0.0001<0.0001<0.0001<0.0001
D5—maximum leaf width4.0523.016.5315.58<0.00014.193.754.210.20676.91 C6.18 B5.33 A<0.0001<0.0001<0.0001<0.0001
D6—panicle length62.9020.1765.4217.000.133066.5862.6759.620.215965.44 AB69.48 B62.18 A0.03260.67760.06230.3813
D7—panicle width14.6566.4813.6540.580.668214.3210.7117.020.094413.16 A17.00 B13.01 A0.00230.39380.00020.1056
D8—grain width1.925.391.994.92<0.00011.921.941.900.50612.00 B1.99 B1.93 A0.00060.00070.02440.2552
D9—1000-grain weight2.749.832.9011.350.00072.842.672.700.10582.95 B2.93 B2.67 A<0.00010.18460.00070.6073
D10—seed yield per plant16.6548.9922.0140.86<0.000117.9113.7218.240.145823.20 B22.00 AB17.33 A0.00200.01410.00180.6678
D11—days to emergence7.3030.097.9219.590.01357.00 A8.75 B8.00 AB0.06387.007.757.780.00760.59730.19830.7304
D12—days to floral bud formation73.1411.6576.118.260.002974.1578.0576.140.386472.83 A77.25 B71.22 A0.00020.28820.78150.0131
D13—days to start of flowering83.5010.8484.9712.710.328981.40 A88.70 B84.81 AB0.040483.15 A88.93 B80.64 A0.00590.48630.94620.0341
D14—days to 50% of flowering93.7310.7094.529.660.558390.7096.9595.950.130993.01 A102.43 B89.83 A<0.00010.18010.13730.0165
D15—days to end of flowering105.989.99106.257.430.8335105.00105.9107.000.8369105.70 A114.25 B102.19 A<0.00010.57110.05220.0296
D16—days to 50% physiological maturity181.5011.35182.399.350.7326176.15 A173.15 A197.14 B<0.0001184.25 B181.39 B170.67 A<0.00010.03080.1509<0.0001
D17—harvest index0.5430.940.5621.010.15890.62 B0.56 B0.44 A0.00110.59 B0.53 B0.49 A<0.00010.22260.50980.1585
The p-values obtained in the analysis of variance for each of the studied descriptors are indicated; significant differences (p < 0.05) between means are shown in bold. For each descriptor, different letters indicate significant differences (p < 0.05) between provinces within the same collection.
Table 3. Total and by province frequencies for the polymorphic qualitative descriptors analysed in the 61 (Collection A) and 207 (Collection B) quinoa accessions.
Code—DescriptorStateCollection ATotalCollection B Total
ChimborazoCotopaxiImbaburaFrequenciesChimborazoCotopaxiImbaburaFrequencies
D19—growth habit1 simple202021611382832198
2 branched to bottom third----2--2
3 branched to second third----3-47
D20—main stem shape1 cylindrical20202161461-47
2 angular----972736160
D21—main stem colour2 purple847196710178
4 pink533111-45
5 yellow7131131751831124
D22—presence of pigmented axils0 absent61614368153356
1 present5--5684-72
2 undetermined94720679379
D24—striae colour1 green13191547681934121
2 yellow71210759286
4 purple--44----
D25—presence of branching0 absent191712481082529162
1 present13913353745
D26—leaf shape1 rhomboidal1919145261122497
2 triangular1179821612110
D28—number of teeth on leaf blade5 seven to twelve teeth1919145259102392
7 more than twelve teeth1179841813115
D29—petiole colour1 green12171645771034129
2 green-red (ridged/variegated)835166618278
D30—leaf lamina colour1 green12171645771034129
2 green-red (ridge/variegated)835166618278
D32—panicle colour at flowering1 green716932731418105
2 purple936186810280
4 mixture (purple and red)41611241622
D33—panicle colour at physiological maturity2 purple3339566163
4 pink6-172237
5 yellow71482947101269
12 red and yellow4391638102068
D34—panicle shape1 glomerulate201810481232835186
2 intermediate-2101219-120
3 amarantiform--111--1
D35—panicle density1 lax2--23614656
2 intermediate10171744841319116
3 compact834152311135
D36—dehiscence degree1 light14141341781424116
2 regular6682065141291
D37—pericarp colour1 cream172017541422836206
2 yellow----1--1
4 pink1--1----
7 coffee1-23----
10 purple1-23----
D38—episperm colour1 transparent51031893719
2 white151018431342529188
D40—presence of saponin0 absent----1172429170
1 present20202161264737
Table 4. Discriminant values obtained for the polymorphic qualitative descriptors in the agro-morphological differentiation of quinoa accession groups collected from different collections (see Collection A vs. Collection B), in different provinces for the same collection (see Collection A; see Collection B) and in the same province for different collections.
Code—DescriptorCollection A vs. Collection BCollection ACollection BChimborazoCotopaxiImbabura
X² (p-Value)X² (p-Value)X² (p-Value)X² (p-Value)X² (p-Value)X² (p-Value)
D19—growth habit2.74(0.2536)0.03(0.9837)9.14(0.0578)0.72(0.6972)1.33(0.2482)2.51(0.1132)
D20—main stem shape16.80(<0.0001)0.03(0.9837)23.71(<0.0001)8.96(0.0028)0.73(0.3931)3.95(0.0469)
D21—main stem colour20.48(<0.0001)3.92(0.4164)34.09(<0.0001)29.39(<0.0001)5.19(0.0747)10.98(0.0041)
D22—presence of pigmented axils25.98(<0.0001)16.71(0.0022)27.22(<0.0001)14.17(0.0008)4.75(0.0928)5.73(0.0167)
D24—striae colour24.49(<0.0001)15.33(0.0041)119.51(<0.0001)2.14(0.1438)5.21(0.0224)7.97(0.0186)
D25—presence of branching0.01(0.9432)9.46(0.0088)27.22(<0.0001)3.87(0.0492)0.20(0.6580)3.60(0.0578)
D26—leaf shape28.12(<0.0001)8.79(0.0123)2.74(0.2540)19.24(<0.0001)13.87(0.0002)0.00(>0.9999)
D28—number of teeth on leaf blade31.55(<0.0001)8.79(0.0123)6.96(0.0307)20.31(<0.0001)17.15(<0.0001)0.04(0.8321)
D29—petiole colour2.71(0.0995)3.33(0.1895)20.24(<0.0001)0.27(0.6046)2.53(0.1114)4.10(0.0428)
D30—leaf lamina colour2.71(0.0995)3.33(0.1895)20.24(<0.0001)0.27(0.6046)2.53(0.1114)4.10(0.0428)
D32—panicle colour at flowering3.20(0.2017)10.70(0.0301)63.76(<0.0001)17.44(0.0002)4.49(0.1057)6.01(0.0494)
D33—panicle colour at physiological maturity3.48(0.0037)15.75(0.0151)26.31(0.0002)32.39(<0.0001)6.28(0.0989)3.25(0.3546)
D34—panicle shape5.47(0.0649)19.18(0.0007)7.64(0.1058)0.14(0.2031)2.92(0.0874)19.67(0.0001)
D35—panicle density15.84(0.0004)9.09(0.0590)14.76(0.0052)7.24(0.0267)14.61(0.0007)5.83(0.0541)
D36—dehiscence degree2.42(0.1194)0.41(0.8149)2.19(0.3338)1.70(0.1917)1.92(0.1659)0.13(0.7163)
D37—pericarp colour24.64(0.0001)6.29(0.3914)0.45(0.7986)21.96(0.0002)1.33(0.2482)7.37(0.0250)
D38—episperm colour16.36(0.0001)6.57(0.0374)6.06(0.0484)7.82(0.0052)9.12(0.0025)0.24(0.6213)
D40—presence of saponin37.00(<0.0001)0.03(0.9837)0.32(0.8541)--34.24(<0.0001)34.44(<0.0001)
The p-values obtained in the Chi-square test for each descriptor are indicated in parentheses; significant differences (p < 0.05) between accession groups are shown in bold.
Disclaimer/Publisher’s Note: The statements, opinions and data contained in all publications are solely those of the individual author(s) and contributor(s) and not of MDPI and/or the editor(s). MDPI and/or the editor(s) disclaim responsibility for any injury to people or property resulting from any ideas, methods, instructions or products referred to in the content.

