Article

Multi-Stage Sensitivity Analysis of the Energy Demand for the Cooling of Grain Warehouses in Cold Regions of China

1
School of Architecture, Henan University of Technology, Zhengzhou 450001, China
2
Henan Key Laboratory of Grain and Oil Storage Facility & Safety, HAUT, Zhengzhou 450001, China
3
Department of General Layout Plan and Architecture, Henan University of Technology Design and Research Academy, Zhengzhou 450001, China
4
State Key Laboratory of Subtropical Building and Urban Science, South China University of Technology, Guangzhou 510641, China
5
School of Architecture, South China University of Technology, Guangzhou 510641, China
6
Energy Saving Technology Research Institute, South China University of Technology, Guangzhou 510641, China
7
Architectural Design & Research Institute Co., Ltd., South China University of Technology, Guangzhou 510641, China
*
Author to whom correspondence should be addressed.
Agriculture 2024, 14(2), 193; https://doi.org/10.3390/agriculture14020193
Submission received: 15 December 2023 / Revised: 17 January 2024 / Accepted: 24 January 2024 / Published: 26 January 2024

Abstract

:
The early design parameters exert a considerable influence on the cooling energy demand of a granary building in operation. In order to investigate the impact of various parameters on energy use, a grain warehouse energy model was constructed using the Ladybug + Honeybee tools on the Grasshopper platform. Three global energy sensitivity methods were used to analyze the model, and the sizes of the influential parameters were determined and ranked. The study uncovered that the cooling energy demand of the grain warehouse was primarily influenced by factors such as the cooling set-point temperature, roof solar absorptance, roof and exterior wall insulation thickness, window type, and orientation. On this basis, a local sensitivity analysis was conducted for the highly sensitive parameters to identify their influence trend and optimal design range. The results showed that the cooling energy demand of the grain warehouse increases faster as the cooling set-point temperature decreases, with the highest growth rate occurring at a temperature below 18 °C. Lower solar absorptance of the roof is conducive to reducing the cooling energy demand of the grain warehouse. When the thickness of the roof thermal insulation is less than 120 mm and the thickness of the external wall thermal insulation is less than 60 mm, energy use decreases more quickly with greater insulation thickness. It is advisable to use traditional or new windows with thermal insulation and shuttered windows. Furthermore, the optimal position of the long side of the granary was between 10° west and 10° east of north. This research could provide guidance for the energy-saving design and renovation of granary buildings in cold regions of China.

1. Introduction

Given the size of China’s vast population, the production and storage of grain play a crucial role in national security. According to the white paper of “Food Security in China” published by the State Council of the People’s Republic of China [1], China’s annual grain production has exceeded 650 × 106 t since 2015. Nonetheless, improper storage can lead to a loss of over 20 × 109 kg of grain each year in China, which is sufficient to feed 100 million people for a year [2]. Therefore, it is crucial to improve storage conditions to maintain grain quality and reduce losses. Low-temperature grain storage is an effective measure to slow the deterioration of grain quality and inhibit the growth of pest populations [3,4,5]. This measure can usually be achieved through mechanical ventilation or air conditioning [6]. However, this method consumes an enormous amount of energy. According to statistics, the cooling of mechanical equipment accounts for 22.05% of the total carbon emissions during grain storage in the granary [7].
Early building design parameters have a significant impact on the energy use of buildings [8,9]. Many scholars have adopted the sensitivity analysis method to quantitatively evaluate the influence size of various design parameters on energy use. By screening out the key parameters affecting energy use and taking reasonable values for these parameters, the energy-saving effect of the building can be significantly improved [10,11]. Zhang [12] and Deng [13] analyzed the energy sensitivity of residential buildings and an old residential neighborhood in Beijing. Infiltration and thermal performance of exterior windows and walls were found to have a significant effect on energy use. Chen [14] performed a global sensitivity analysis using high-rise office buildings in the Guangzhou area as an example. The results demonstrated that core tube area ratio, floor height and south window-to-wall ratio have a significant effect on the energy use of high-rise residential buildings. Zhang [15] used a global sensitivity method based on meta-modeling to investigate the influence of building envelope design parameters on the cooling energy demand of granaries in regions with hot summers and cold winters. The results demonstrated that building scale and roof heat transfer coefficient have the greatest impact on cooling energy demand.
A sensitivity analysis can be divided into global sensitivity analysis (GSA) and local sensitivity analysis (LSA) [16]. Most scholars use a multi-stage sensitivity analysis method combining GSA and LSA, or at least two different GSA methods, to ensure more realistic and credible sensitivity results. Li [17] proposed a multi-stage sensitivity analysis approach to identify the key design parameters for design performance and used a zero-energy office building in Hong Kong as an example to study the sensitivity of energy consumption. The outcomes demonstrated that orientation, the window-to-wall ratio, and radiation absorption coefficients of external walls and roofs are significant parameters that affect energy consumption in office buildings located in subtropical regions. Taking the sunroom attached to a Tibetan Buddhist building in the Gannan region as an example, Zhang [18] found that the thickness of roof insulation and the roof had the most significant effect on thermal comfort and energy use through GSA and LSA. Saurbayeva [19] conducted the multi-stage sensitivity analysis to investigate the factors affecting the energy consumption of phase change material-integrated residential buildings in the savannah climate zone. The results show that window visible transmittance, roof and wall solar absorptance, and phase change material thickness are the most sensitive parameters affecting energy consumption. Chen [20] and Gagnon [21] used two global sensitivity methods (regression and variance-based methods) and observed that the set-point temperature, the number of air changes, and the thermal parameters of roofs and windows were the most influential factors on the energy use of office buildings.
In summary, most studies of building energy sensitivity analyses focused on civil buildings, and fewer studies examined the sensitivity of energy use in granary buildings. In this study, a multi-stage sensitivity method was used to investigate the factors influencing energy use in grain warehouses. The design parameters with the greatest impact on the performance of granaries were determined. This study investigates the relationship between granary cooling energy consumption and design variables, aiming to identify key factors that influence energy consumption through sensitivity analysis. This will provide precise guidance for adjusting the granary design to reduce energy consumption and minimize environmental impact.

2. Materials and Methods

2.1. Multi-Stage Sensitivity Analysis Method

Sensitivity analysis is a technique for examining the effect of input parameters on the output results to determine the significance of input parameters and the patterns of their influence [22,23]. This method can be divided into GSA and LSA. GSA evaluates the impact of a single parameter on the model output with all design parameters changed [24]. LSA analyzes the impact of changes in a single parameter on model output without changing other design parameters [25]. The multi-stage sensitivity analysis allows the identification of the most important early building design stage parameters by combining global and local sensitivity methods [17]. It usually consists of two phases: ranking the sensitivities of the design parameters using one or more global sensitivity analysis methods and comparing the results to screen out the key impact parameters; analyzing the impact trends of the screened-out key parameters and the optimal design ranges using local sensitivity analysis methods. Although both the building sensitivity approach and the granary building sensitivity approach use similar methods of analysis, the factors considered are different because of the different objects of their analyses. In the sensitivity analyses, civil buildings need to consider a number of factors such as the comfort of the human environment, lighting, ventilation, and thermal insulation, while granaries need to consider the temperature and humidity of the grain storage environment, thermal insulation, and other factors. In this study, three global sensitivity analysis methods, standardized regression coefficient (SRC), partial rank regression coefficient (PRRC), and Sobol method, were used to conduct a sensitivity analysis study of the granary building. The SRC and PRRC methods are computationally efficient, easy to understand, and suitable for linear, nonlinear, and monotonic models [21]. The Sobol method considers the interactions among the input parameters and is applicable to nonlinear or nonmonotonic models [26].

2.1.1. Standardized Regression Coefficient (SRC) and Partial Rank Regression Coefficient (PRRC)

SRC and PRCC can determine the sensitivity of each design parameter. SRC analysis is a linear regression model providing the correlation strength between the output results and input parameters. The absolute value of the SRC indicates the sensitivity of the parameter, and the positive/negative symbol indicates the positive/negative correlation between the input parameter and the output results [27]. The multiple linear regression model and the SRC can be expressed as follows:
y ( x 1 , x 2 , , x n ) = β 0 + i = 1 n β i x i   + ε
S R C i ( x i , y ) = β i σ i σ y
where y is the model output (cooling energy consumption of grain warehouse); β0 is the intercept; βi represents the regression coefficient of the i-th parameter; xi denotes the i-th parameter; n is the number of parameters; SRCi is the SRC of the i-th parameter; σy represents the total standard deviation of the model output; σi is the standardized deviation of the i-th parameter.
PRCC is a global sensitivity analysis method that utilizes “rank-order differences” to measure the degree of linear or nonlinear correlation between inputs and outputs and control for the effects of other parameters. The relative correlation of the input parameters can be readily assessed by comparing the PRCC. In this study, PRCC was calculated for each input and output parameter, and the method is illustrated for a single outcome parameter [28,29]. Initially, the outcome vector was treated as an extra column in the K + 1 columns in addition to the input values. The set (r1i, r2i, …, rki, Ri) represents the serial number of each column, where i = run number. The average rank μ = (1 + N)/2. The symmetric matrix (C) of K + 1 by K + 1 was determined with elements Cij:
C i j = t = 1 N ( r i t μ ) ( r j t μ ) t = 1 N ( r i t μ ) 2 s = 1 N ( r j s μ ) 2     i , j = 1,2 . . . , K .
Ri substitutes rjt and rjs in the ci, K + 1 elements. All leading diagonal components of C are 1. The inverse of C is defined as matrix B.
B = [bij] = C−1
Between the i-th input parameter and the y-th output parameter, the PRCC (γiy) is defined as:
γ i y = b i , k + 1 b i i b k + 1 , k + 1

2.1.2. Sobol Sensitivity Analysis Approach

The Sobol method assesses parameter sensitivity by calculating the contribution of single and multiple parameters to the variance of model outputs [30]. The results of the Sobol analysis include the first-order effect indices and the total effect indices of the parameters, which can be calculated by the following equations:
Y = f 0 + i Y ( X i ) + i < j Y ( X i , X j ) + + Y ( X 1 , X 2 , X k )
V ( Y )   = i V i   + i < j V i j + + V 12 k
S i = V i V ( Y )
i S i + i < j S i j + + S 12 k = 1
Ti = Si + Sij +…+ S12…k
where Y is the model output; Xi is the i-th input parameter; Xj is the j-th input parameter; V(Y) denotes the total variance of the model output; Vi is the variance of the i-th input parameter to the model output; Vij is the variance of the interaction between parameter Xi and parameter Xj on the model output; Si indicates the contribution of the parameter Xi to the variance of the model output; Ti represents the contribution of the parameter Xi and its interactions with other parameters to the variance of the model output.

2.1.3. Local Sensitivity Analysis (LSA)

LSA analyzes the effect of changes in a single parameter on the model output with other design parameters remaining constant [31,32]. This method had the advantages of simplicity and ease of understanding, facilitating the comparison of the relative importance of different design parameters. The process of LSA can be expressed as follows:
S l o c a l , i = y m a x , i y m i n , i Y m a x ,
where Slocal,i is the local sensitivity index; Ymax,i and Ymin,i are the maximum and minimum values of the output of the i-th input parameter, respectively; and Ymax,* denotes the maximum global output of all inputs for all parameters.

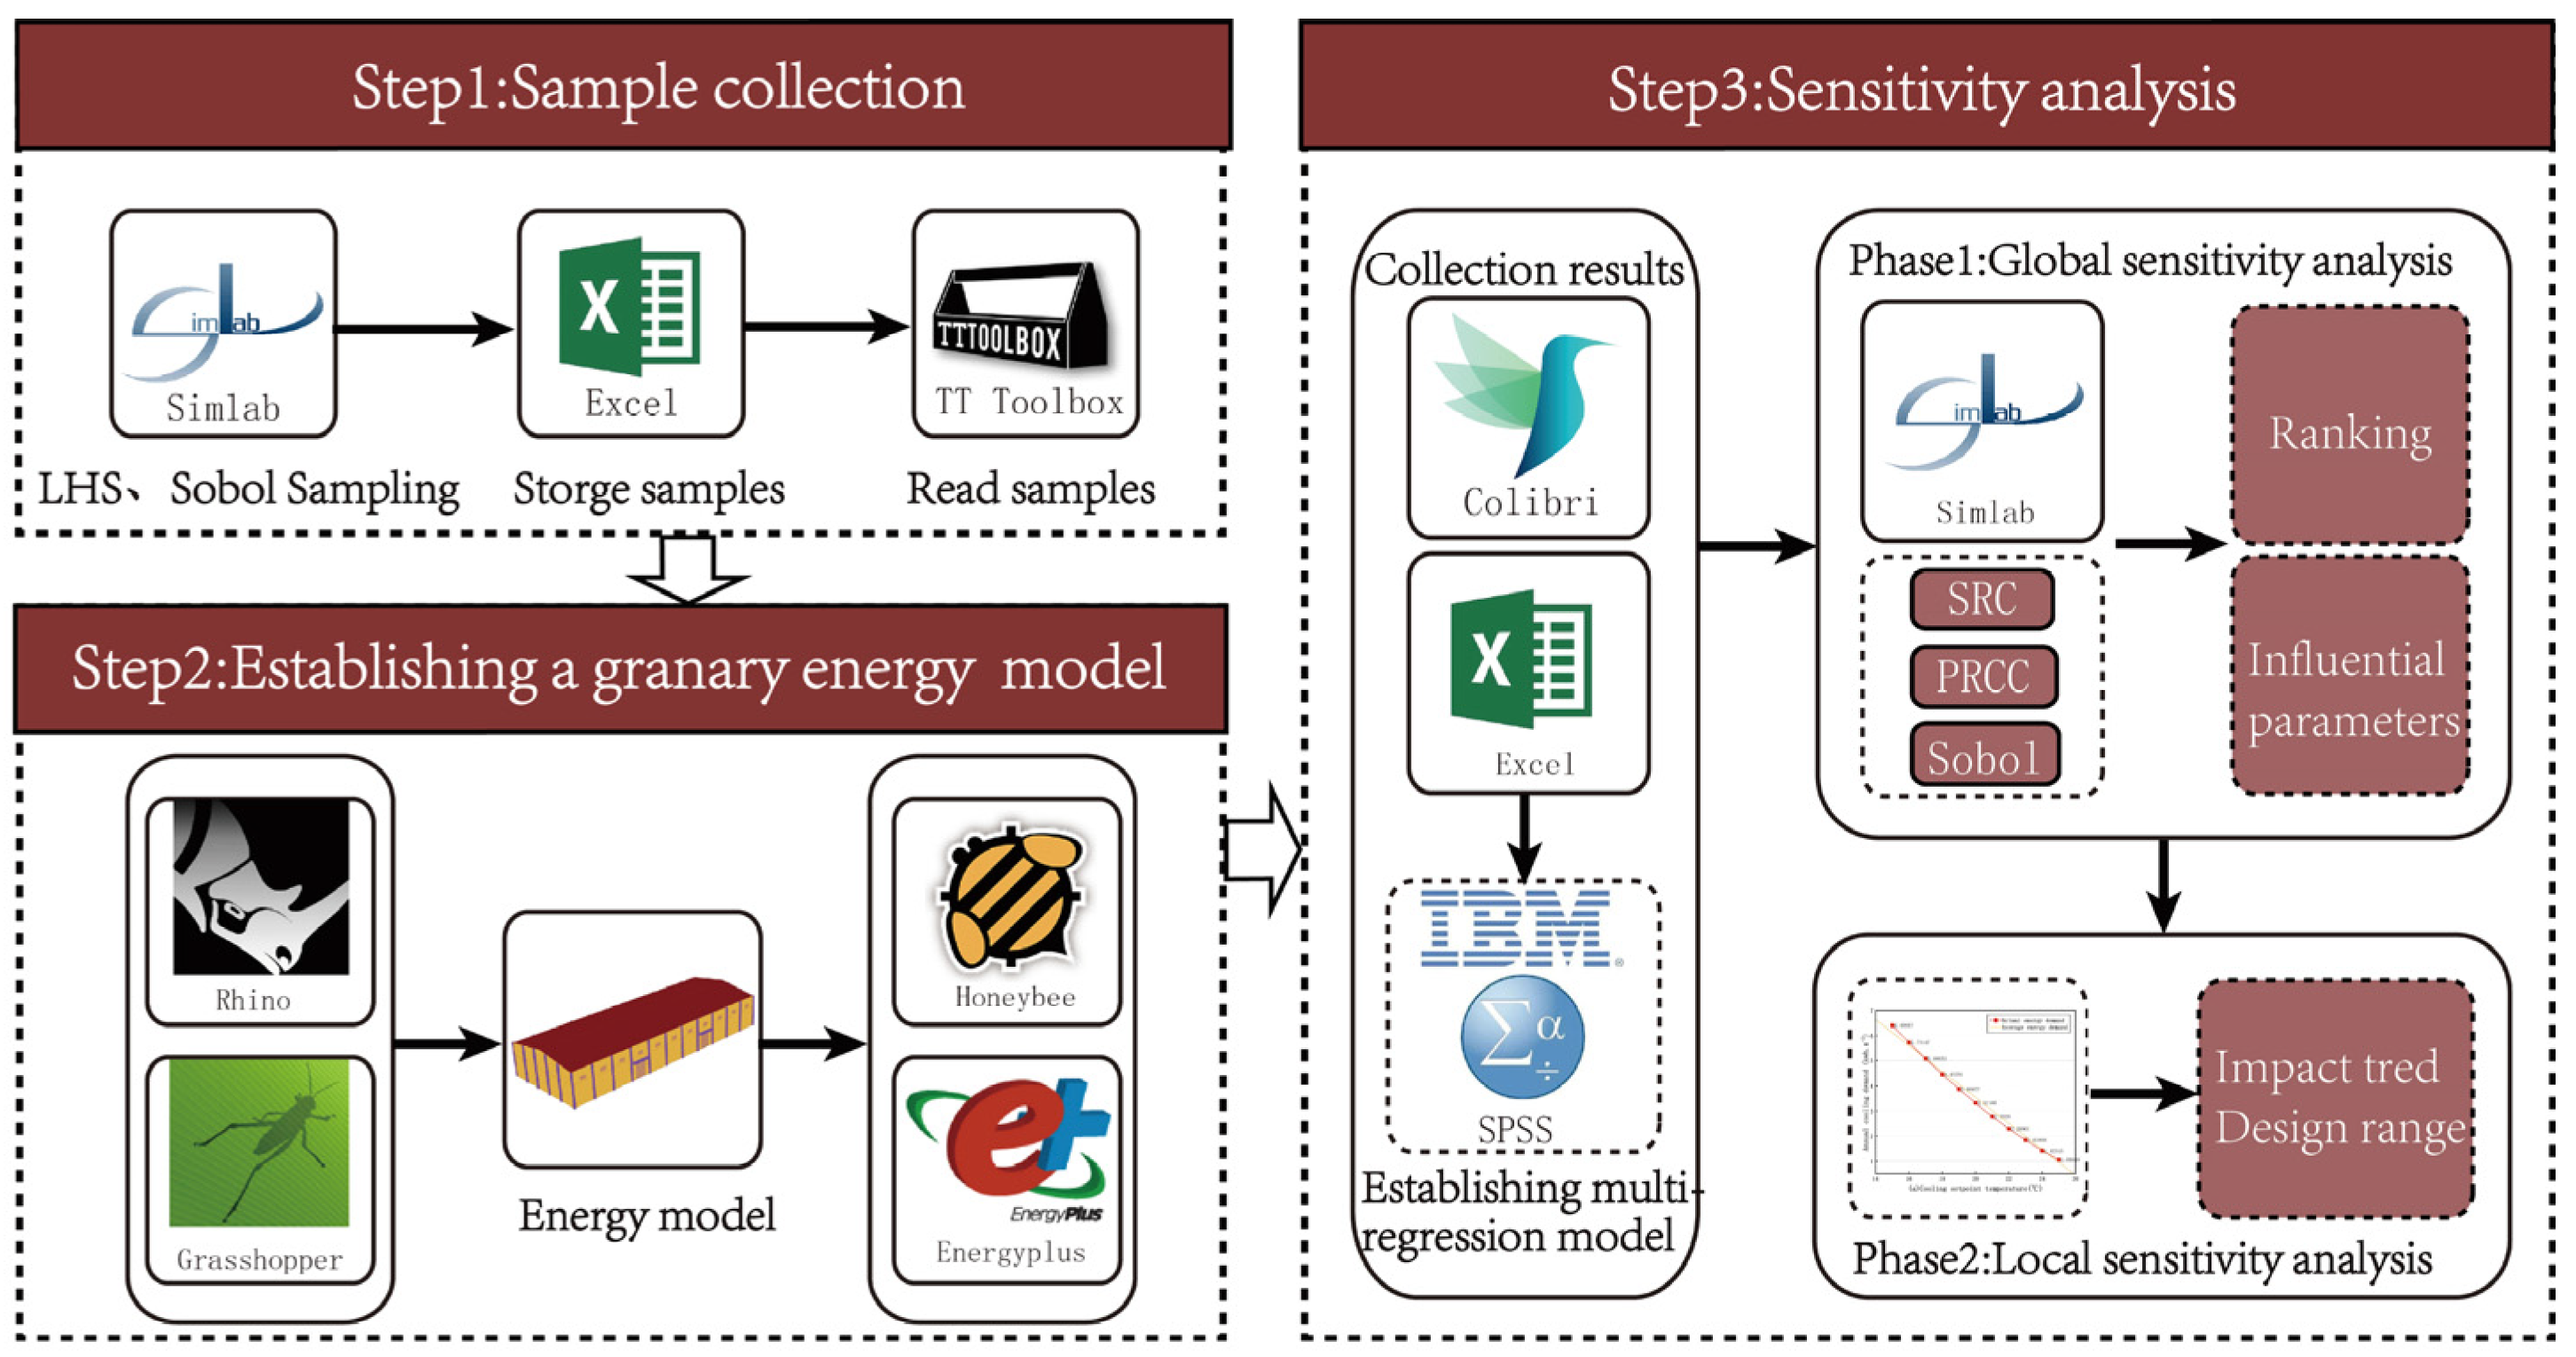
2.2. Sensitivity Analysis Process

The sensitivity analysis of the energy use in the grain warehouse is divided into three primary steps, and the workflow is shown in Figure 1.
Step 1
Sample collection: Simlab 2.2, a free statistical software for uncertainty and sensitivity analyses [33,34], will be used to sample variables via Sobol and LHS (Latin hypercube sampling). The collected sample data were stored in Excel, and the sample input files were read through the Toolbox plug-in.
Step 2
Establishment of a grain warehouse energy model: The Grasshopper plug-in for the Rhino platform was used to construct a grain warehouse energy model. This visual programming environment provides an intuitive interface and flexible components, enabling effortless parametric design and simulation analysis through plug-ins [35,36]. Honeybee [37], a plug-in, was adopted to simulate the grain warehouse energy.
Step 3
Sensitivity analysis: Another plug-in, Colibri, exports simulation results to Excel for further data processing and analysis [38]. LHS samples and output results were imported into SPSS 22 to establish a multiple regression model for regression analysis. In addition, LHS and Sobol samples and corresponding energy use results were entered into Simlab for sensitivity analysis. The sensitivity analysis was conducted in two steps. First, three GSA methods, namely SRC, PRCC, and Sobol method, were employed to rank the sensitivity of energy use of granary cooling. The results were compared to identify the main influence parameters. Then, LAS was performed on the top-ranked design parameters to determine the influence trend of the parameters.

3. Model Construction

3.1. Sample Collection

The grain warehouse is the most typical granary building, accounting for more than 85% of the total grain storage capacity in China [39]. In this study, 15 design parameters related to the energy use of grain warehouses (including three major categories of form parameters, envelope structure parameters, and equipment parameter) were summarized, with the specific parameter names and the ranges of variation shown in Table 1. The geometry model of the grain warehouse is constructed using Grasshopper based on the parameters obtained, as shown in Figure 2. In the range of orientation shown in Table 1, 0° means that the long side of the building is oriented north–south and rotated counterclockwise, and 90° indicates that the long side is rotated to face east–west. In the cooling set-point temperature, the low-temperature storage of the granary requires average grain pile temperatures below 15 °C, and the quasi-low-temperature storage requires a local temperature below 25 °C [40]. Therefore, the range of the temperature is [15 °C, 25 °C].
Different sensitivity analysis methods require sampling methods based on different principles: regression-based sensitivity analysis methods require super-Latin-square sampling, whereas the Sobol method requires Sobol sampling to build the dataset. Moreover, different sensitivity analysis methods require different sample sizes. For the regression-based sensitivity approach, no firm rule seems to exist for selecting the number of samples n with LHS [44]. According to previous studies, the sample size is typically set at about 10 times the number of input parameters [45,46]. Therefore, a sample size of n = 200 has been utilized in this work. The minimum sample size for the Sobol method is 2n(k + 1), where n is the smaller number of model estimates used to estimate an individual effect (16, 32, 64...) [47]. In the study, 1024 sets of samples were collected.

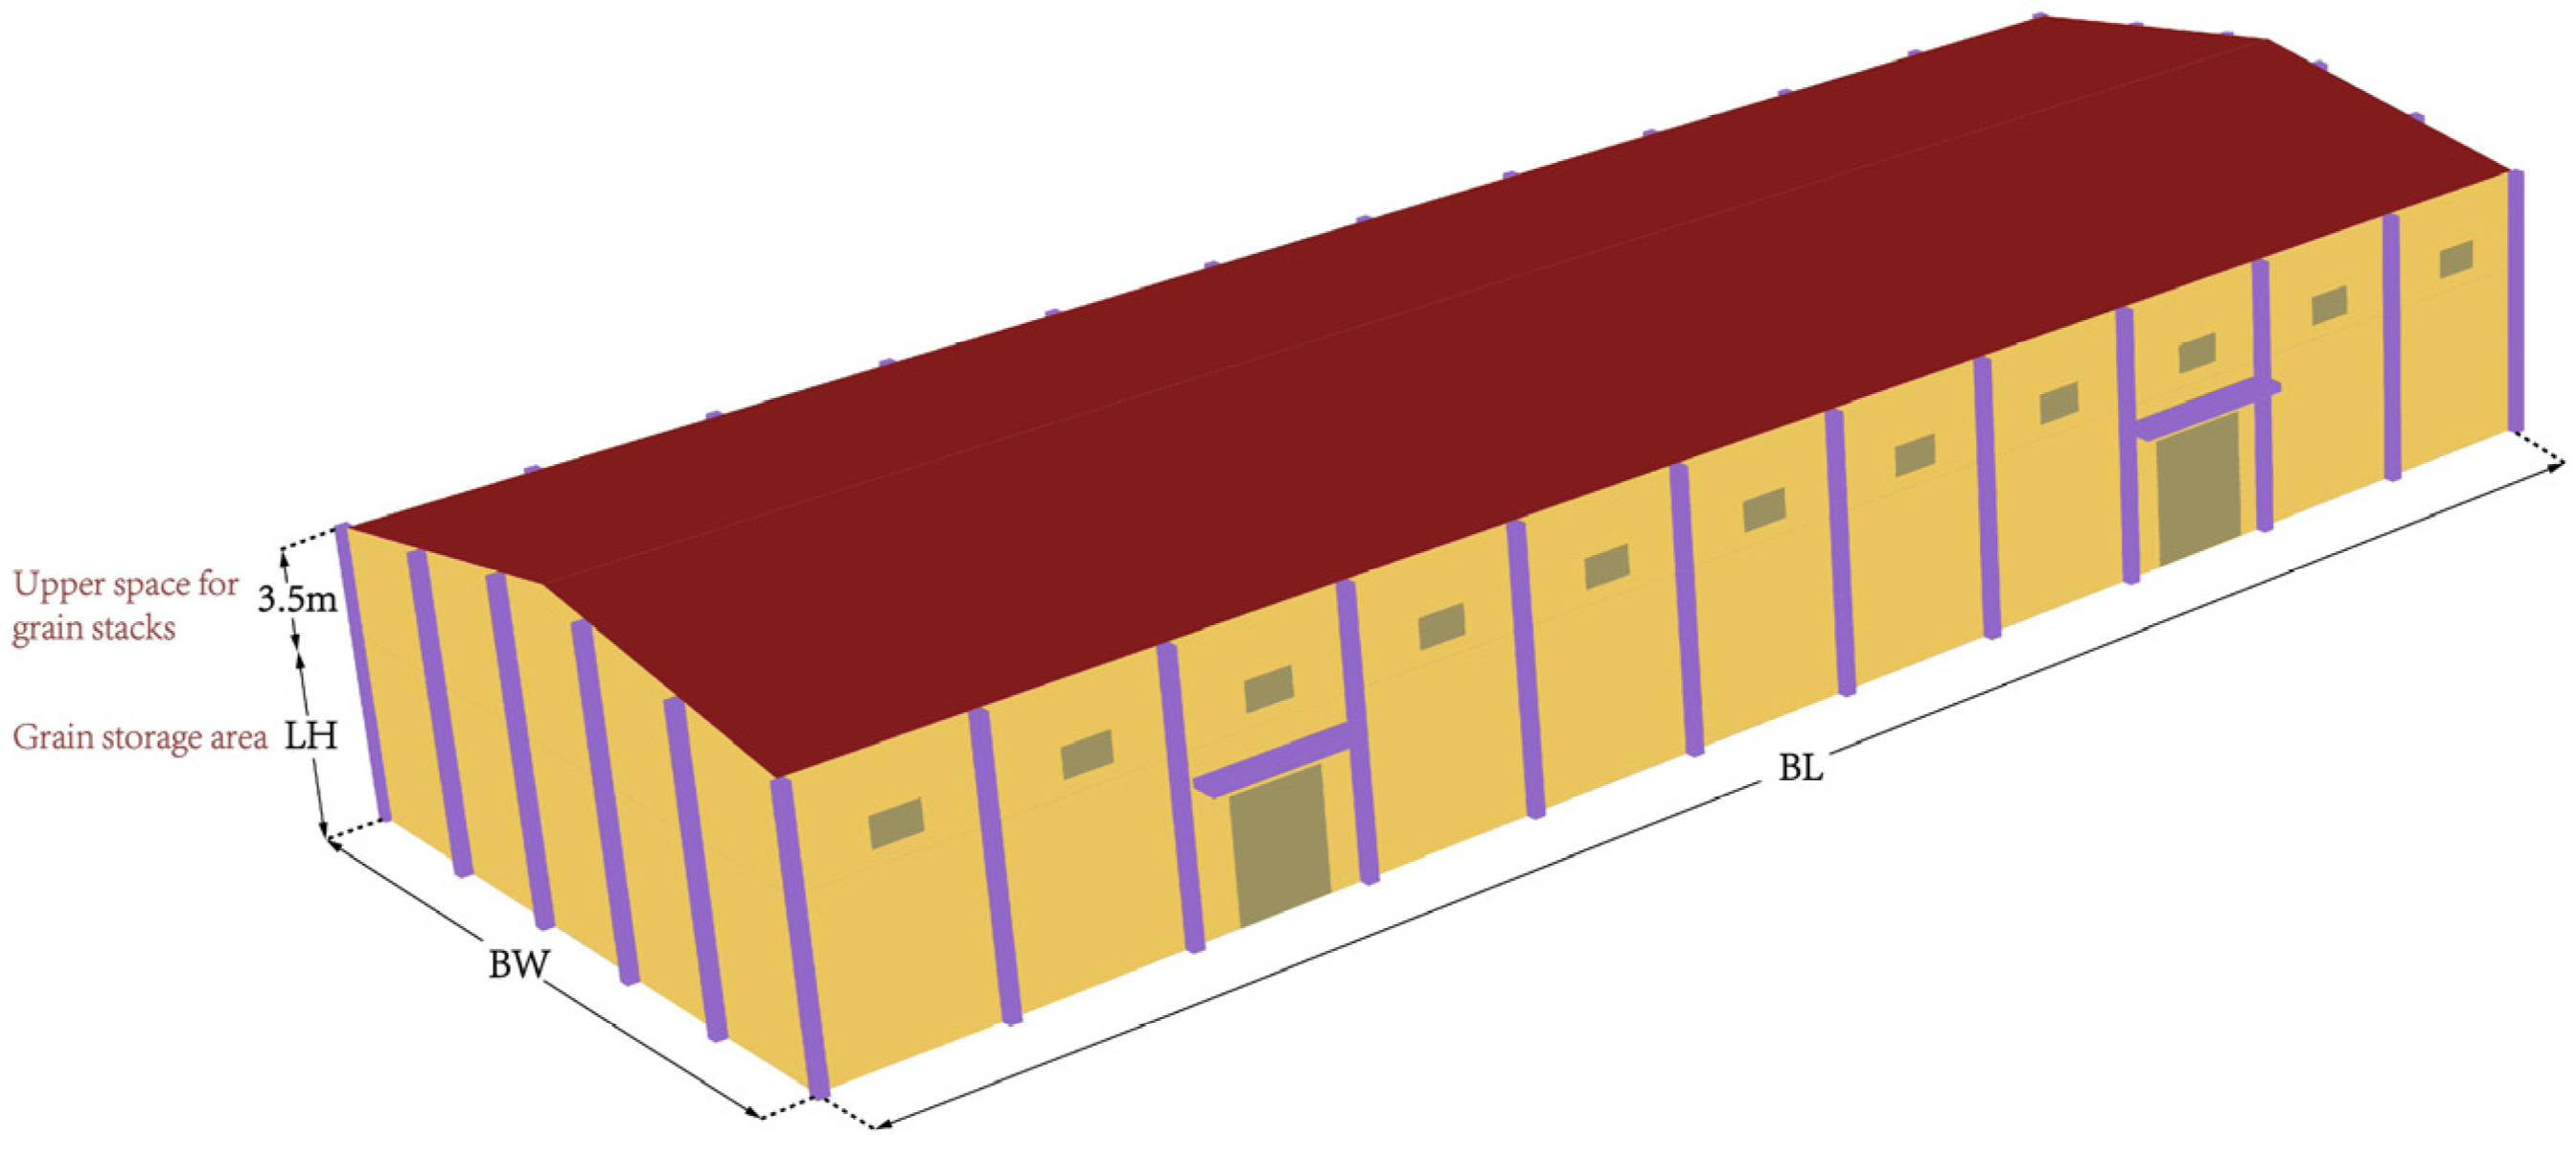
3.2. Building the Energy Use Model for the Grain Warehouse

In order to calculate energy consumption, the geometric model of the granary building needs to be set up according to the working conditions and other parameters and transformed into an energy consumption model. The plug-in Honeybee of the Grasshopper platform is used to model the energy consumption and divide the building into two thermal zones. The upper thermal zone is the space above the grain loading line, with a height of mostly 3.5 m, and the lower thermal zone is the grain stacking area. The common type of grain stored in grain warehouses in the Henan region is wheat. In the modeling process, it was assumed that the grain in the granary had a huge heat storage (i.e., the internal mass is used in Honeybee to represent wheat) with the same thermal characteristics and volume settings as wheat [48]. In addition, the typical meteorological annual data of Zhengzhou provided by EnergyPlus were selected for simulation. The number of air changes (ACH) was set to 0 because of the high airtightness requirement of the granary during storage, as it is subjected to fumigation and other processes. In terms of personnel and lighting, the custodian was required to check in and out once or twice a week for about half an hour each time, and the lighting was negligible as it was only switched on when the personnel entered. During the low-temperature grain storage, heat production of grain was also negligible because grain respiration was suppressed.

4. Results and Discussion

4.1. GSA Results

In this study, the energy use of grain warehouse cooling was analyzed using three global sensitivity methods: SRC, PRCC, and the Sobol method. Both the SRC and Sobol methods require independent input parameters to avoid parameter interaction. Before using the sensitivity methods, the correlation of 15 uncertain parameters needs to be analyzed [49,50].

4.1.1. Correlation Analysis Results

Pearson’s correlation coefficient can be used to analyze the correlation between multiple parameters [51,52]. The absolute value of the correlation coefficient determines the degree of correlation between two parameters, which is generally classified into four degrees: no correlation (0–0.1), low correlation (0.1–0.3), medium correlation (0.3–0.5), and significant correlation (0.5–1). As shown in Figure 3, the correlation coefficients for most of the 15 parameters influencing the energy use of the grain granary are less than 0.1, and few parameters have correlation coefficients greater between 0.1 and 0.18. Consequently, it is assumed that there is no linear correlation between these 15 parameters (i.e., the parameters are independent). SRC and Sobol sensitivity analysis methods can be used.

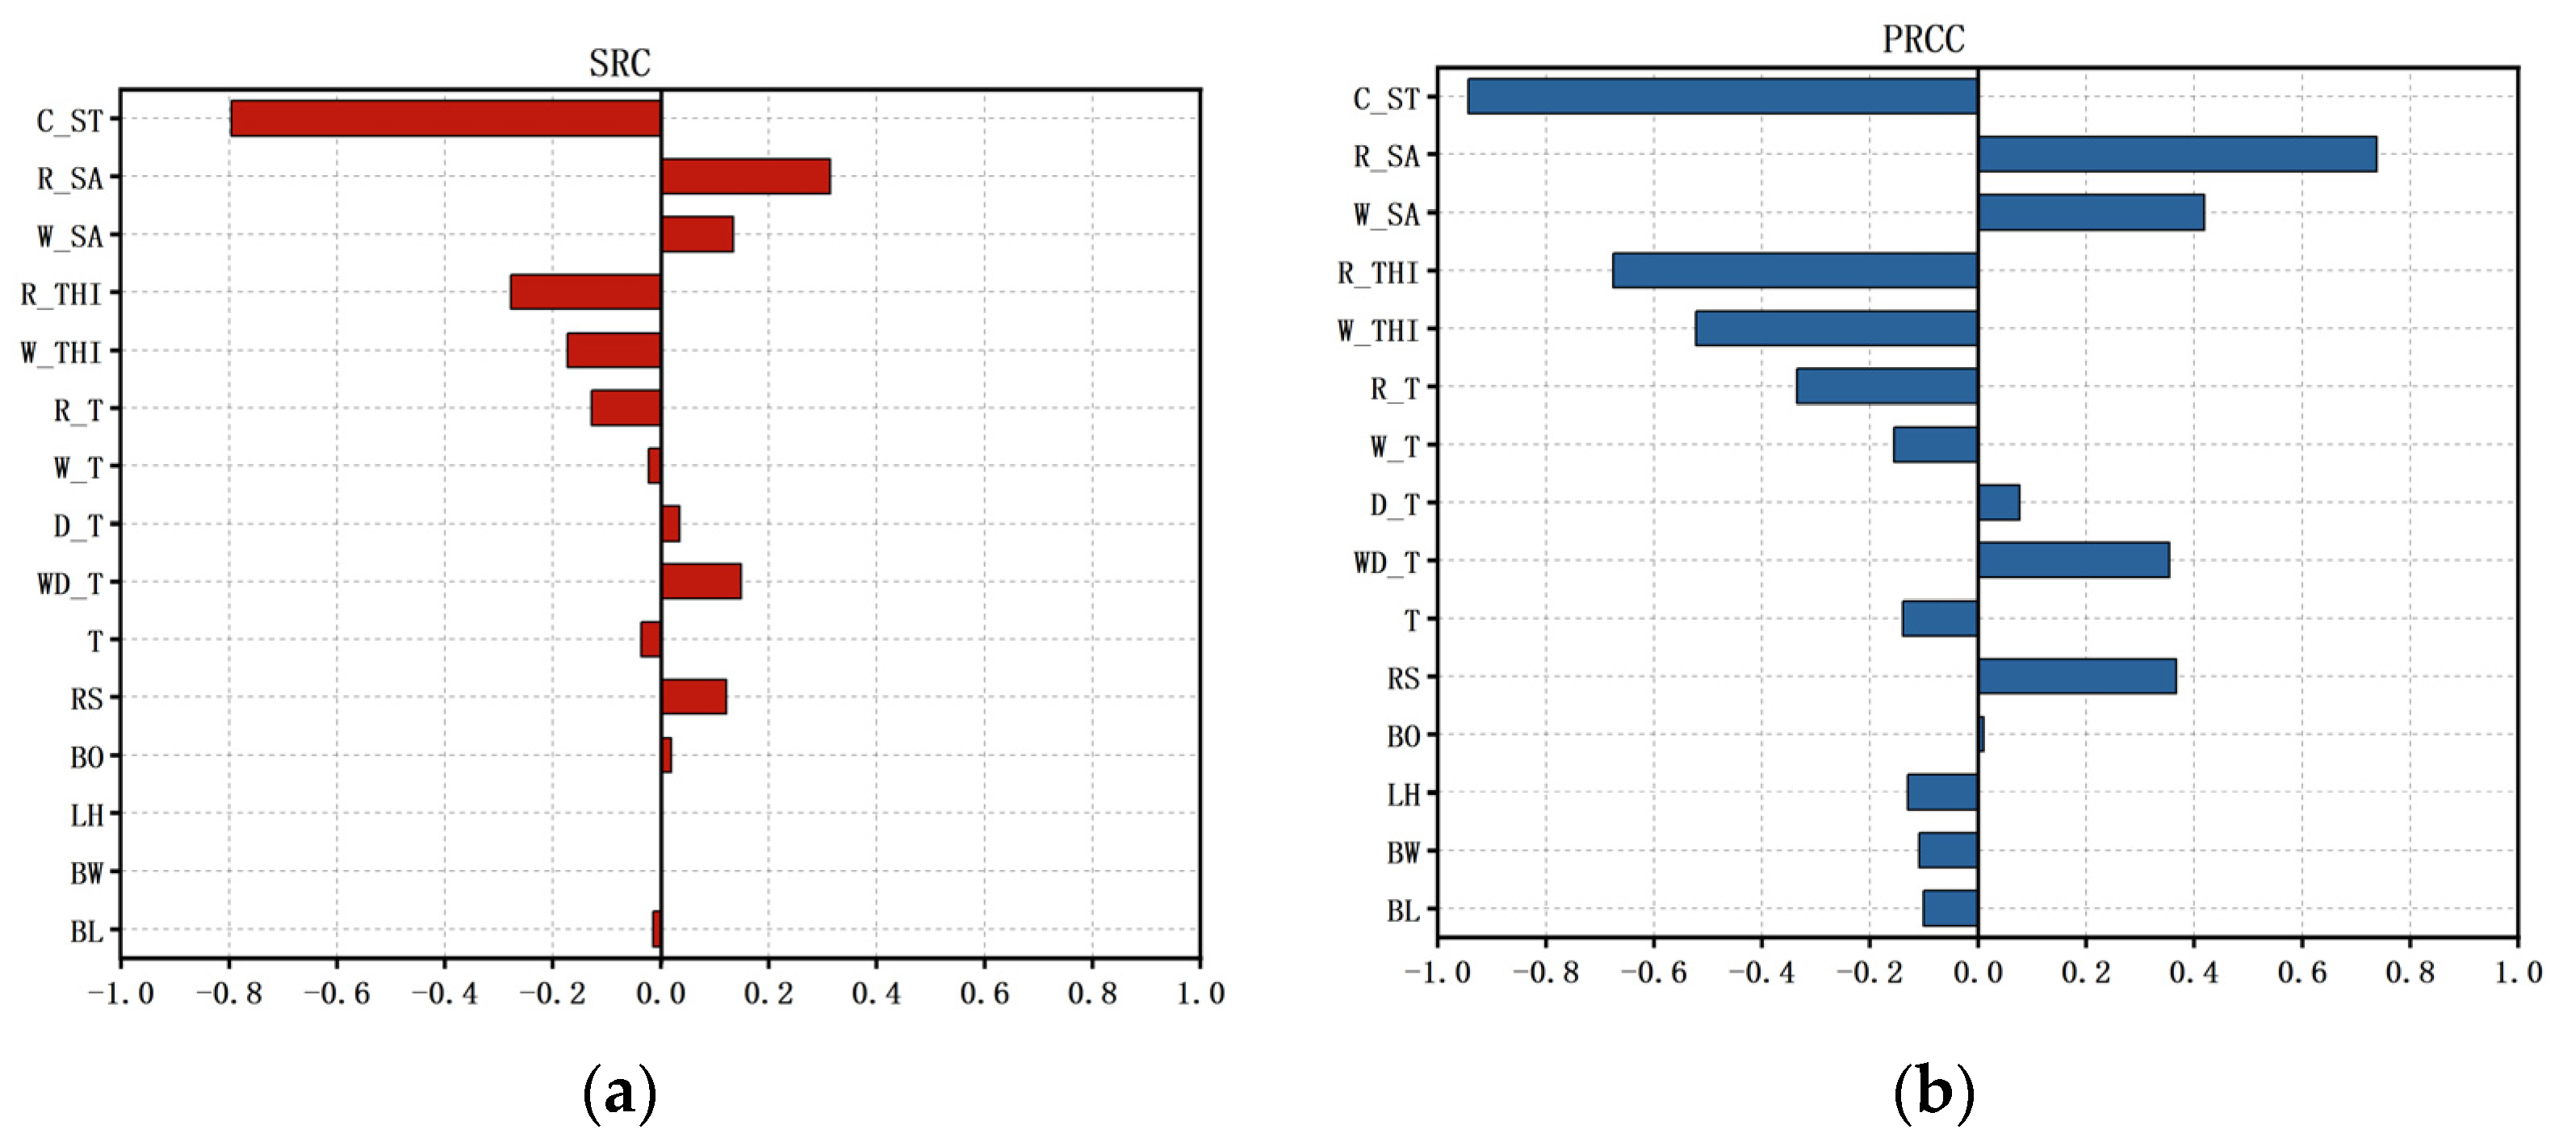
4.1.2. Sensitivity Analysis Results by SRC and PRCC

The 200 sets of energy use data were obtained by simulating the 200 sets of samples extracted from the LHS. Afterward, regression analyses for the 15 parameters and the data on cooling energy demand for the granary were performed using SPSS. The modified determination coefficient R2 of the regression model for the cooling energy demand of the granary was 0.917, and the p-value was less than 0.05, indicating a significant linear relationship between the selected parameters and the granary cooling energy demand.
Figure 4a is the histogram of the cooling energy demand distribution. The overall cooling energy demand is normally distributed, with energy use values concentrated between 1.33 and 5.84 kWh/m2, and the geometric mean (μg) is 4.11 ± 0.49 kWh/m2. Figure 4b is the Q-Q plot, which confirms the normal distribution of the cooling energy demand. By fitting the histogram, it was determined that the mean value of cooling energy demand (μ) was 3.92 kWh/m2, the standard deviation (σ) was 1.71, and the difference between the highest and lowest values was 8.31 kWh/m2. The influence of the 15 parameters on the variation granary cooling energy demand reached 211.45% (8.31/3.93), reflecting a significant correlation between them.
The regression sensitivity analysis adopted SRC and PRCC methods. Figure 5a depicts the SRC sensitivity ranking for cooling energy demand, and Figure 5b depicts the PRCC sensitivity ranking. The absolute value of the parameter sensitivity index represents the impact of the parameter on the results, with a positive value indicating a positive correlation and a negative value indicating a negative correlation. It can be seen that the cooling set-point temperature (C_ST), roof solar absorptance (R_SA), roof insulation thickness (R_THI), and exterior wall insulation thickness (W_THI) have a significant effect on cooling energy demand, while the exterior wall solar absorptance (W_SA), window type (W_T), and length (BL) has the least impact. The results also reveal that the roof solar absorbance (R_SA) and wall solar absorbance (W_SA) are positively correlated with cooling energy demand. In contrast, the cooling set-point temperature (C_ST), roof insulation thickness (R_THI), and exterior wall insulation thickness (W_THI) exhibit a negative correlation with cooling energy demand.

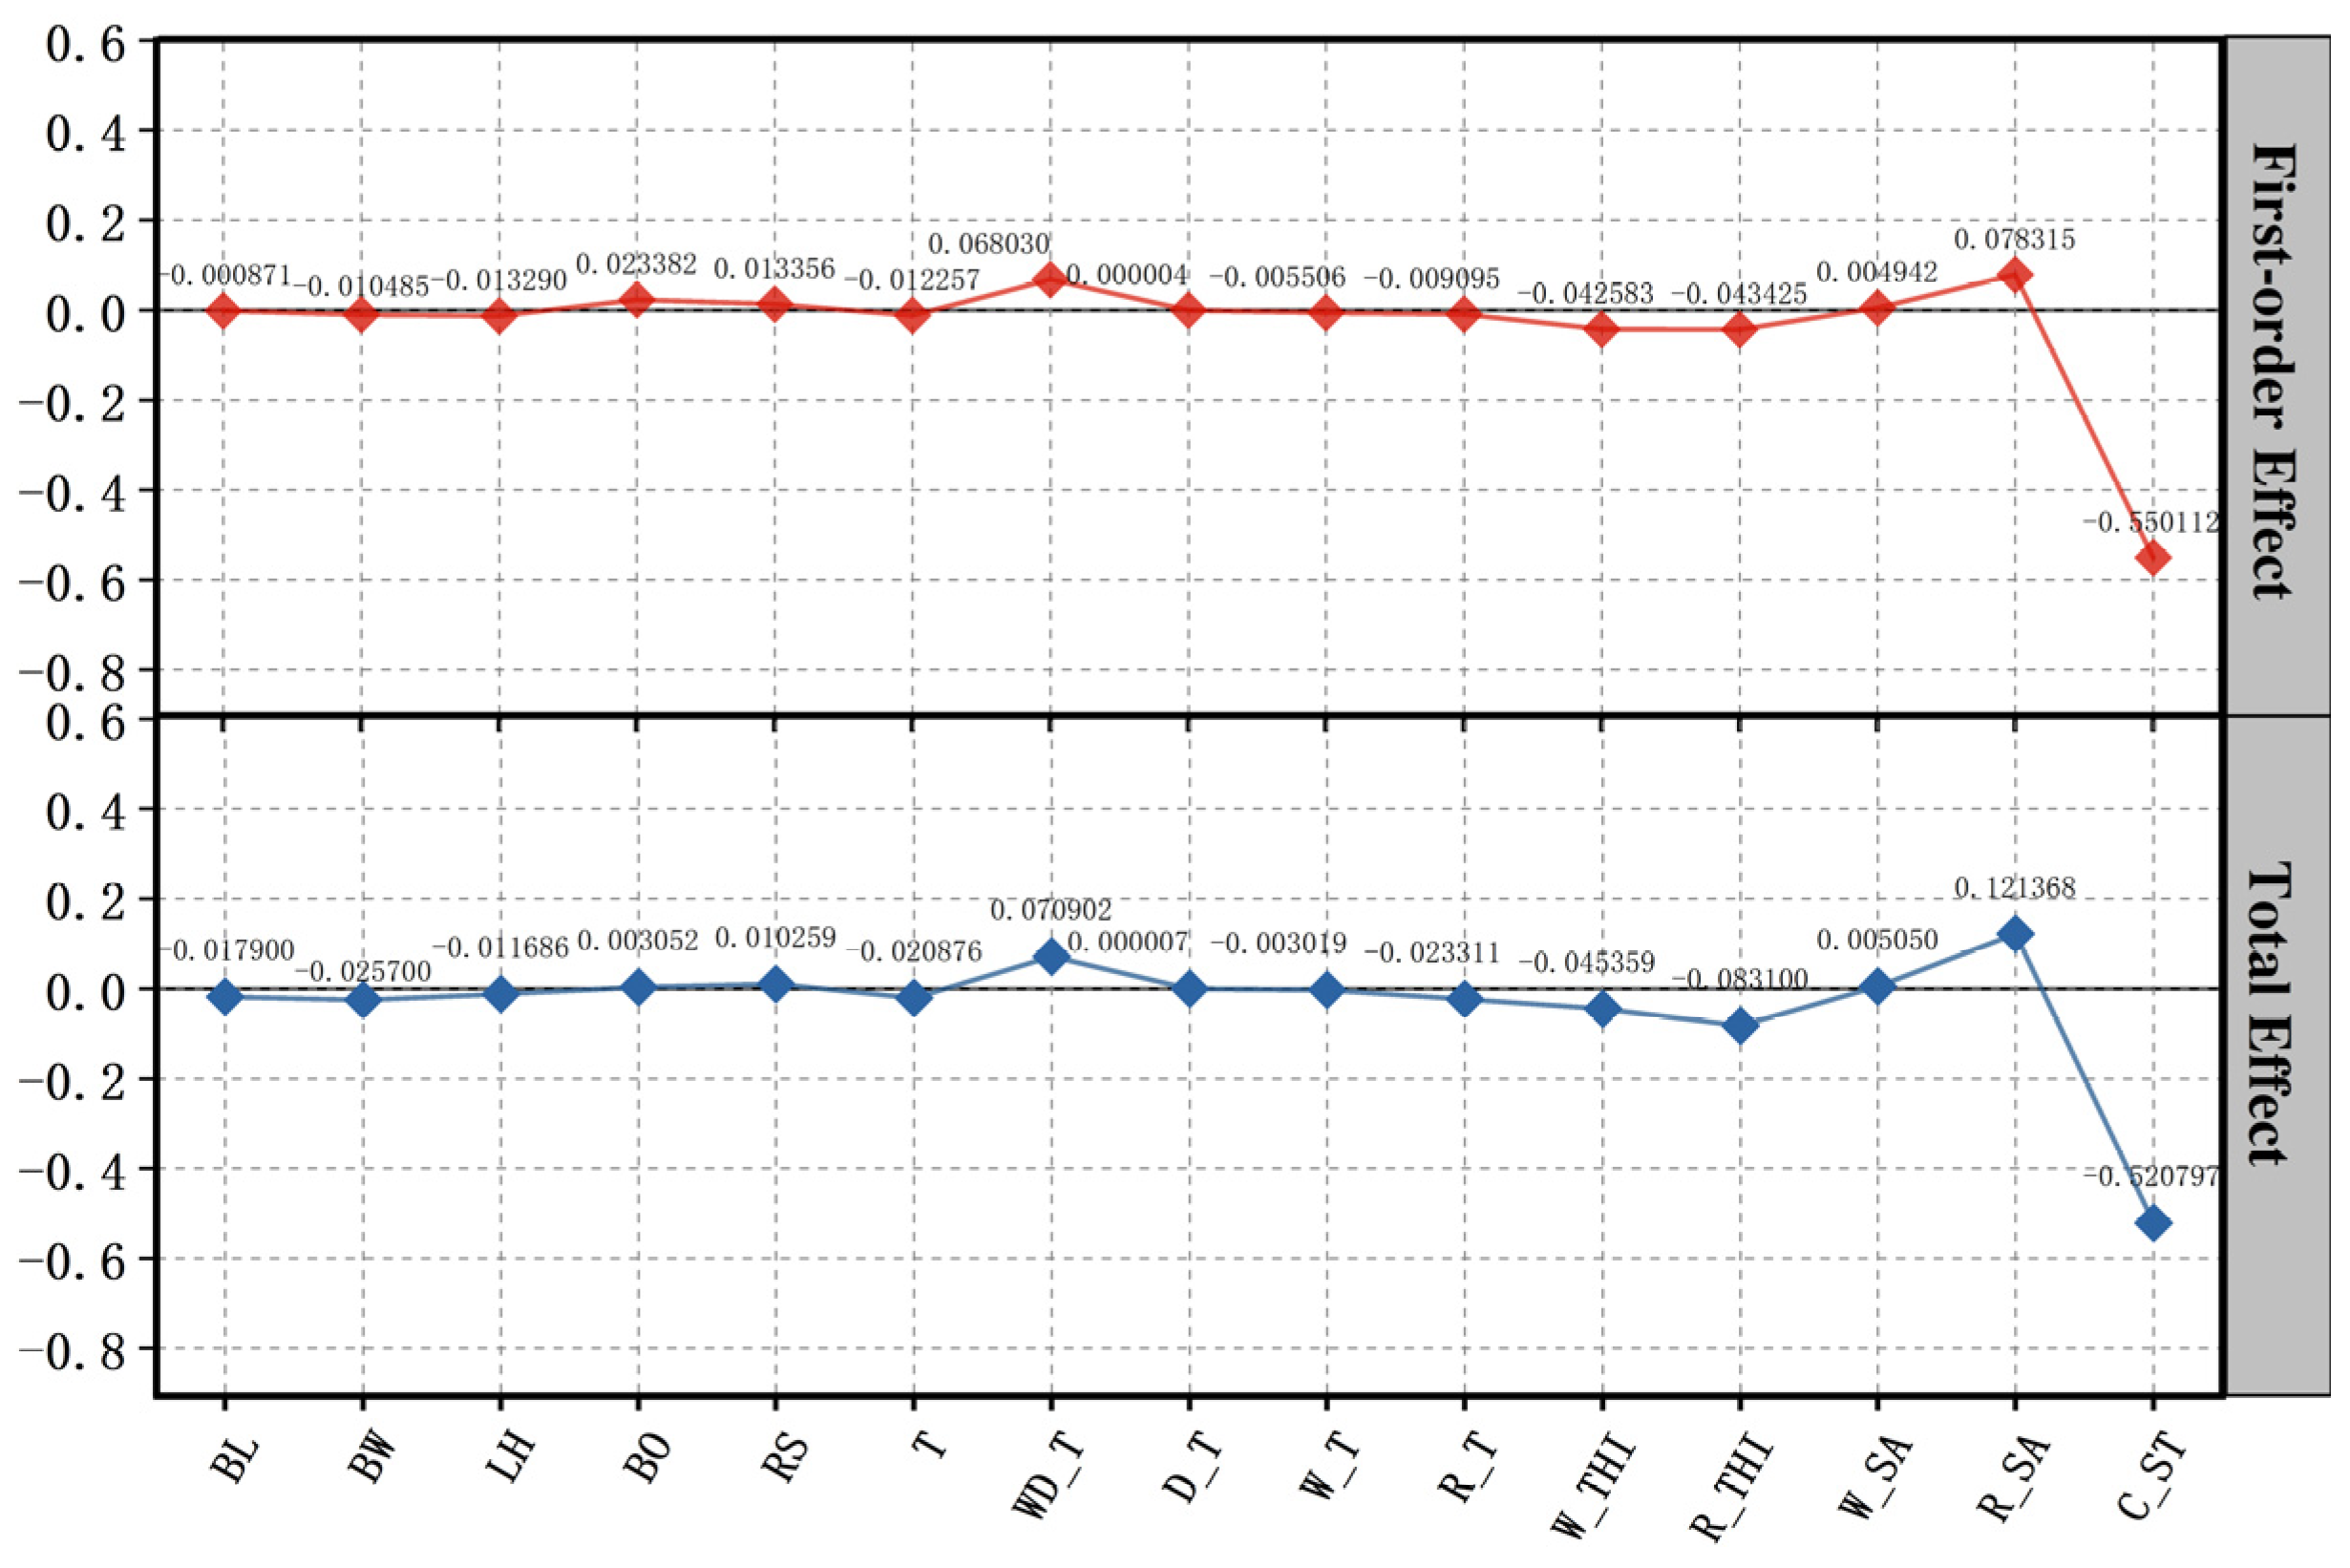
4.1.3. Sensitivity Analysis Results Based on the SOBOL Method

The 1024 sets of samples extracted by the Sobol method yielded 1024 sets of energy use data. In addition, the sensitivity analysis was conducted using the Sobol method with the first-order effect coefficients and the total effect coefficients as output indicators. The first-order effect coefficient refers to the significance of the parameter sensitivity, which has a direct effect on the output of energy use. A larger first-order effect coefficient suggests stronger sensitivity and a greater impact on the results. The total effect coefficient refers to the impact of the parameter interaction on energy use.
Figure 6 illustrates the sensitivity ranking of design parameters based on the Sobol method. In terms of the parameter order, the first-order effect index and the full effect index are nearly identical. Based on the degree of the parameter effects, the total effects of almost all parameters are more significant than the main effects, suggesting that the cooling energy demand is significantly affected by the interactions between the parameters. From the first-order effect, the cooling set-point temperature (C_ST), the roof solar absorptance (R_SA), the type of window (WD_T), and the thickness of the roof insulation (R_THI) have the greatest impact on the cooling energy demand of the grain granary, followed by the thickness of the exterior wall insulation and the orientation (BO). The least influential parameters are the type of the door (D_T) and the length (BL).

4.1.4. Comparison of Three GSA Results

The results of the two regression methods differed from those of the Sobol method. The sensitivity analyses were highly consistent for the top-ranked variables, but the ordering of the intermediate and final design variables varied across the three GSA methods (Table 2). Comparisons revealed that the cooling set-point temperature (C_ST) and the roof solar absorptance (R_SA) were the two parameters with the highest ranking of importance among all three methods. The ranking of the top 30% of the parameters in terms of importance was identical, including the roof insulation thickness (R_THI), the exterior wall insulation thickness (W_THI), and the type of window (WD_T). It is worth noting that when using the SRC method, the external wall solar absorptance (W_SA) and orientation (BO) were ranked sixth and twelfth, respectively, whereas they were ranked thirteenth and sixth in terms of the Sobol main effect, respectively. This result indicates that orientation (BO) is an important parameter in the pre-design of the granary, which was neglected by the regression methods. After comparing the three methods, the top five high-sensitivity parameters and orientation (BO) were selected for LSA.

4.2. LSA Results

Based on the results of the GSA, an LSA of the six design parameters with high sensitivity was conducted to determine the trend and optimal parameter ranges.

4.2.1. Comprehensive Local Sensitivity Analysis

Based on the results of Honeybee cooling energy consumption calculation, the local sensitivities of the cooling set-point temperature, roof solar absorptivity, roof and wall insulation thickness, and the window type and orientation were analyzed according to Equation (11). The calculation results are shown in Table 3. It can be seen that the local sensitivities are ranked in the following order: cooling set-point temperature > roof solar absorption rate > thickness of external wall insulation > thickness of roof insulation > type of window > orientation. This result is basically consistent with the results of the global sensitivity analysis.

4.2.2. Local Sensitivity Factor Analysis

Each of the six main parameters was analyzed, and the optimal range was determined according to the changes in their inflection points or slopes. The results of the local sensitivity factor analysis are shown in Figure 7. The red or blue line in the figure represents the actual cooling energy demand, which is the actual simulated energy consumption value of the granary obtained by varying each influencing factor within its value range. The yellow line represents the average cooling energy demand, which is a smooth curve generated by averaging the actual energy demand values.
Figure 7a shows a negative correlation between the cooling set-point temperature and annual cooling energy demand. The overall slope is close to 1, indicating the significant effect of the cooling set-point temperature on the cooling energy demand. Under the requirement of low-temperature or quasi-low-temperature storage, the increase in energy use gradually accelerates as the temperature decreases and the inclination changes. When the cooling set-point temperature is above 21 °C, the energy use increases by 0.34 kWh/m2 for every 1 °C decrease; when it is below 18 °C, the energy use increases by 0.49 kWh/m2 for every 1 °C decrease, which is the highest increase rate.
As shown in Figure 7b, the annual cooling energy demand increases linearly as roof solar absorptance increases. The overall slope is close to 1, suggesting that the solar absorptance of the roof has a significant effect on the cooling energy demand. Therefore, a lower solar absorptance of the roof indicates a better energy use efficiency within a reasonable range.
Figure 7c,d show a significant nonlinear relationship between the thickness of the roof and exterior wall insulation and the annual cooling energy demand. As the thickness of the insulation increases, the cooling energy demand first increases and then levels off. When the roof insulation thickness is less than 120 mm and the wall insulation thickness is less than 60 mm, the slope of the curve is steeper, suggesting that energy use decreases more rapidly as insulation thickness increases. When the roof insulation thickness exceeds 120 mm and the exterior wall insulation thickness exceeds 60 mm, the decreasing rate of energy use gradually slows with the increase in insulation thickness. However, increasing the insulation thickness to reduce energy use can lead to significant increases in costs.
As displayed in Figure 7e, the window type has a significant impact on cooling energy demand. Compared to the color steel window, the cooling energy demands are reduced by 9.49% and 10.05% for traditional and new thermal insulation closed windows, respectively. In addition, the new thermal insulation closed window reduces energy use by 0.62% compared to the traditional thermal insulation closed window.
Figure 7f shows an important impact of orientation on cooling energy demand per unit area. The energy use is lowest when the long side of the building faces north and south and gradually increases as the building rotates to the east and west. The slope increases when buildings are oriented more than 10 degrees. When laying out the granary, the long side should be oriented within 10° of the northwest and northeast.

4.3. Limitations and Future Works

The limitations of this study are listed below.
  • This study primarily examines granaries in cold regions, and the factors influencing the energy-efficient design of granary buildings in other climatic regions need to be further investigated. However, the proposed sensitivity analysis methodology is still applicable to other climate zones.
  • Although sensitivity analyses have been conducted for grain warehouses, the factors influencing the energy-efficient design of other granary building types have not yet been studied, such as squat silos and silos. Given the different granary building types, the sensitivity analyses results should be different.
  • The current work is based on the energy performance of granary buildings and overlooks other performance indicators. It is important to balance multiple performance criteria in practical applications [53,54,55,56]. Future research may need to consider additional performance indicators for granary buildings, such as cost and grain storage environment.

5. Conclusions

This study establishes the energy use model of a granary and performs a multi-stage sensitivity analysis of the design parameters of a granary using the GH platform. The primary findings from this analysis are elucidated below:
(1)
The GAS results indicate that the most influential parameters on cooling energy demand are cooling set-point temperature, roof solar absorptance, roof insulation thickness, exterior wall insulation thickness, window type, and orientation. Parameters such as roof and exterior wall solar absorptance are positively correlated with the cooling energy demand of the granary. In contrast, parameters including the cooling set-point temperature, roof thickness, and exterior wall insulation thickness are negatively correlated with the cooling energy demand of the granary.
(2)
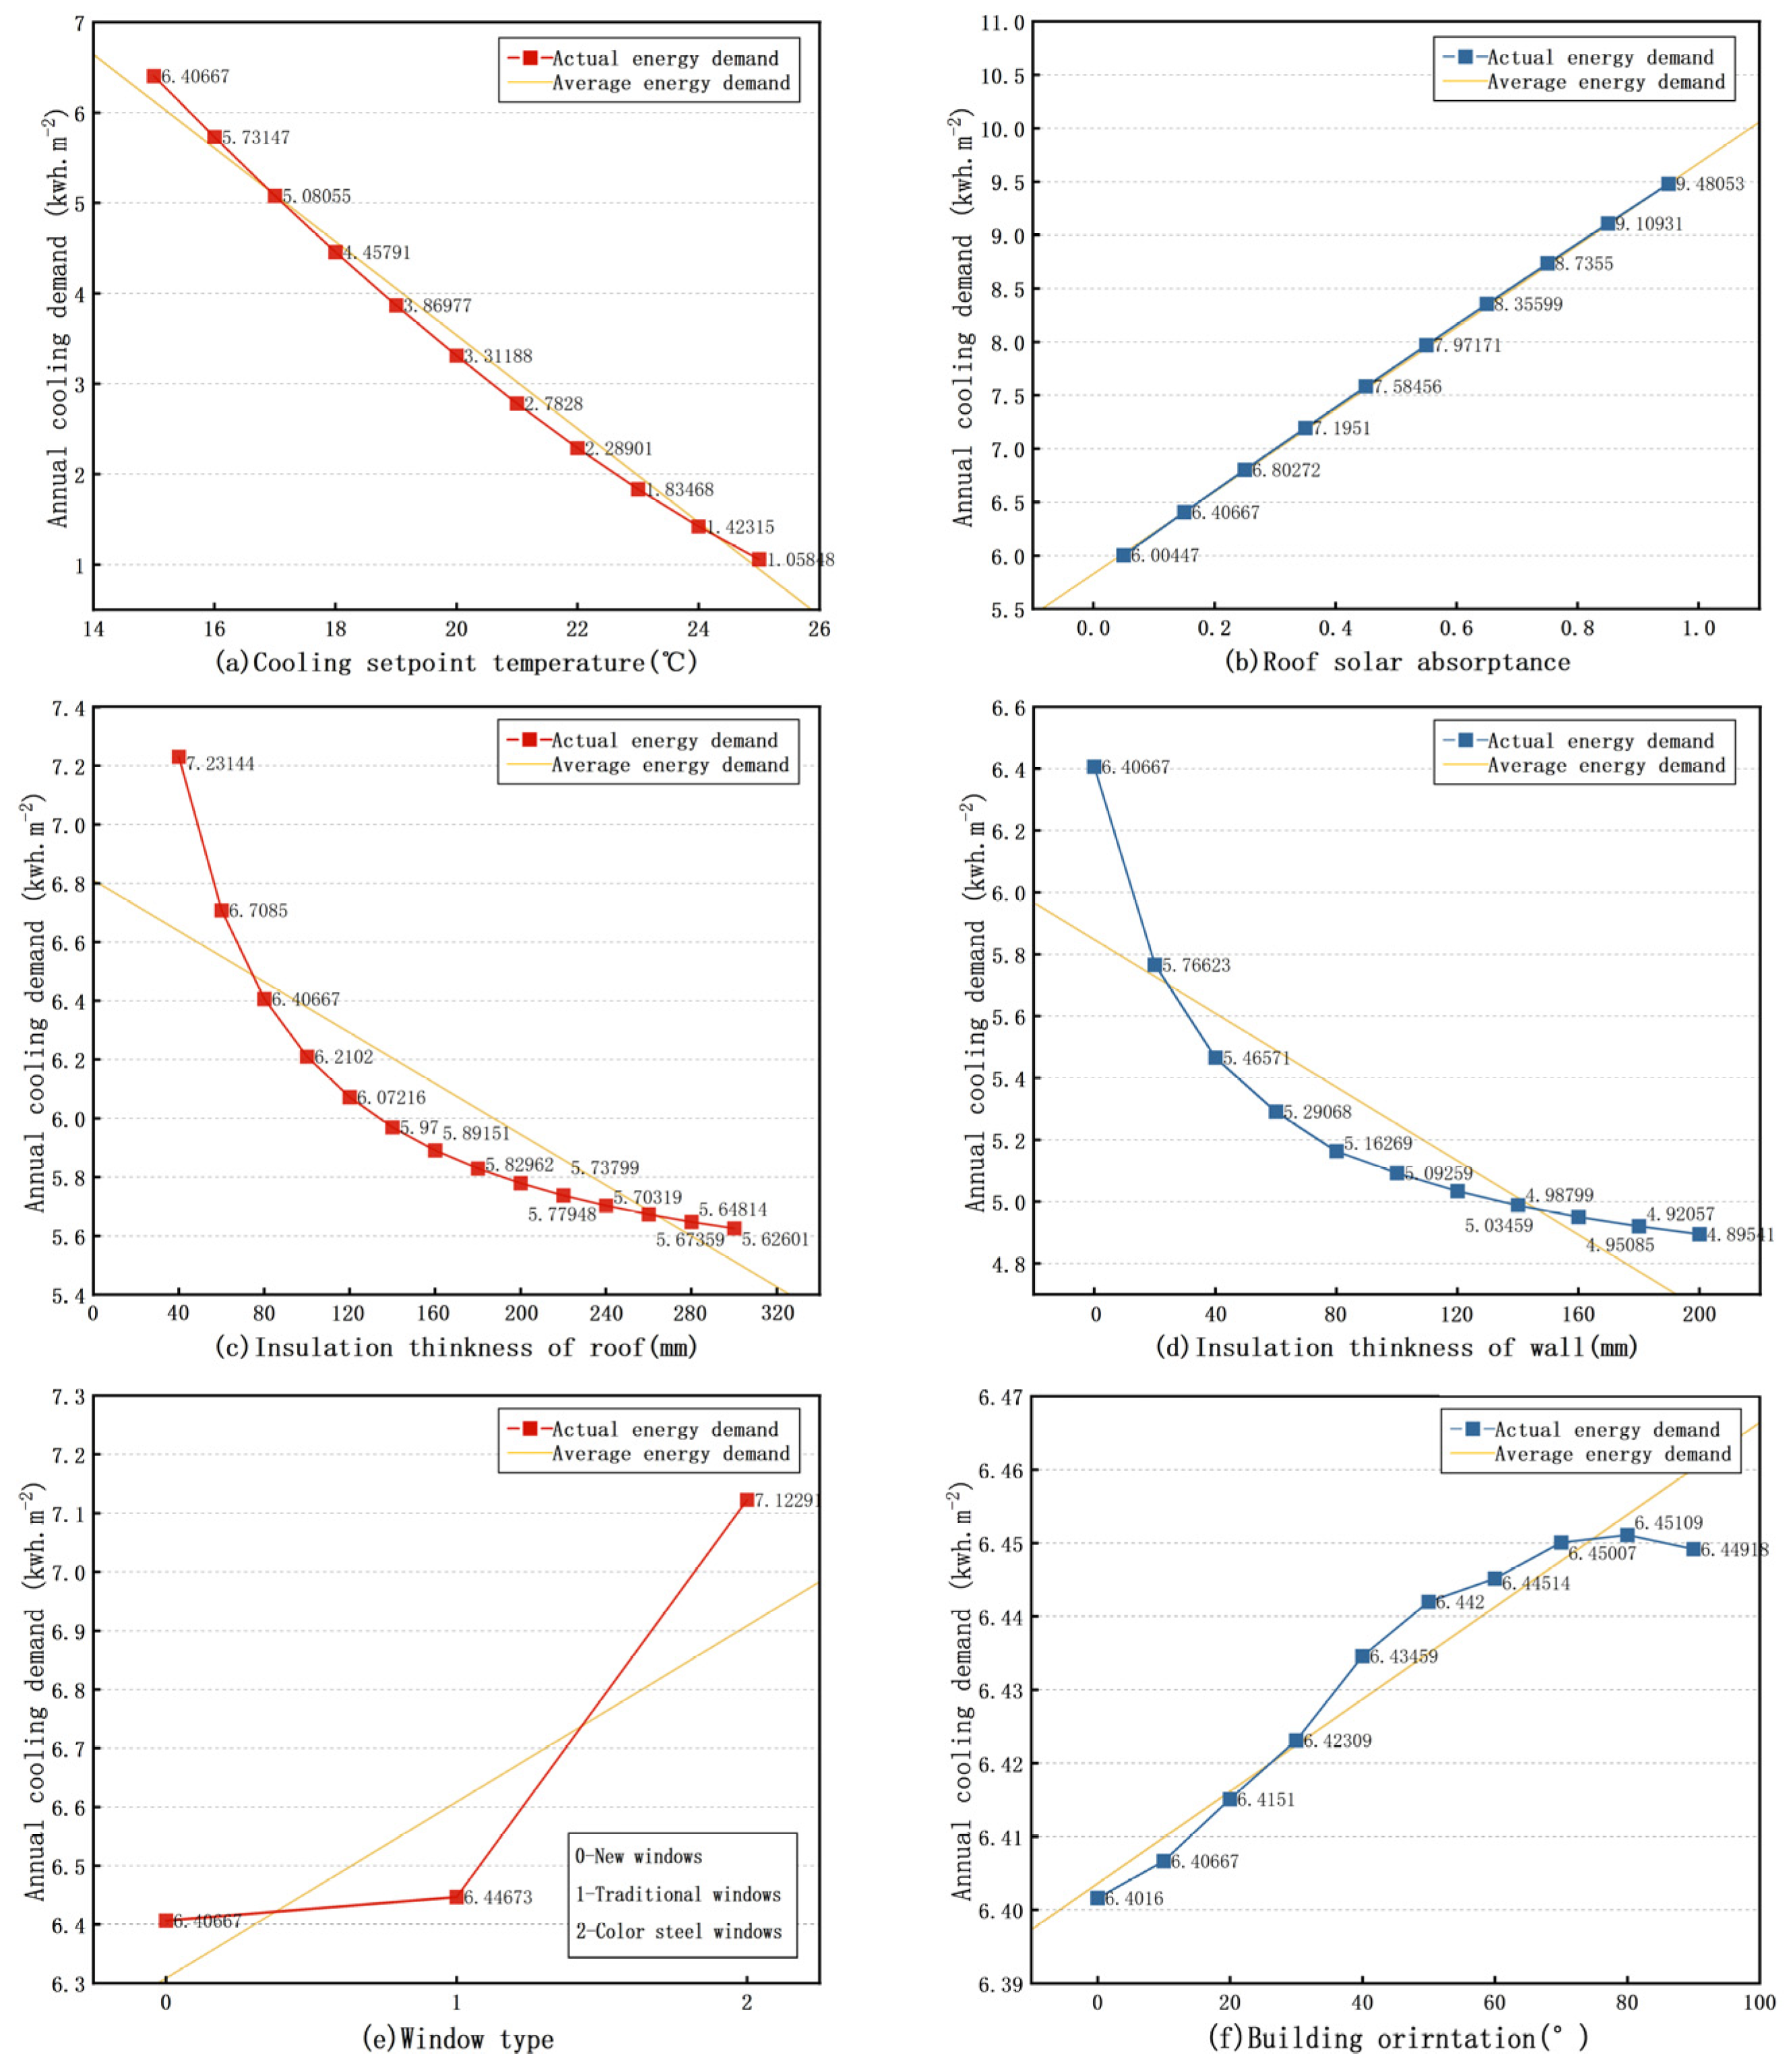
The LAS results show that the cooling energy demand of grain warehouses increases significantly as the cooling set-point temperature decreases, with the greatest increase occurring at temperatures below 18 °C. A smaller solar absorptance of the roof leads to a greater effect on the reduction of the cooling energy demand of grain warehouses. When the thickness of the roof thermal insulation is less than 120 mm, the greatest reduction in cooling energy demand in grain warehouses is achieved. To reduce cooling energy consumption, it is recommended to use traditional or new thermal insulation with closed windows, ensuring that the long side of the granary is oriented between 10 degrees northwest and northeast.
The sensitivity analyses indicate that the cooling energy consumption of a grain warehouse is significantly impacted by several parameters, including the cooling setpoint temperature, the roof solar absorption rate, the roof insulation thickness, the external wall insulation thickness, and the window type and orientation. Accurately identifying and optimizing key parameters allows for a design reference in the early stages of grain silo construction and timely adjustments. When designing granary buildings, we should also prioritize the selection of roofing materials with a low solar energy absorption rate and reasonably determine the thickness of the insulation layer to ensure that the granary buildings have adequate thermal insulation performance. Simultaneously, it is crucial to fully consider the type and orientation of windows during the design and planning layout stage. By understanding these parameters and their ranges, we can select the right materials and technologies for the actual situation, thereby effectively reducing cooling energy demand, lowering energy consumption and operating costs, reducing environmental impact and promoting sustainable development.

Author Contributions

Conceptualization: H.Z., J.Y. and X.L.; methodology: H.Z. and J.Y.; software: J.Y.; writing—original draft preparation: J.Y.; writing—review and editing: H.Z., S.N., K.L., X.L. and J.Y.; project administration: H.Z., X.L. and S.N.; funding acquisition: H.Z. and X.L. All authors have read and agreed to the published version of the manuscript.

Funding

This research was supported by the National Natural Science Foundation of China (grant no. 52108011); Henan Key Laboratory of Grain and oil storage facility & safety (grant no. 2023KF07); Guangdong Basic and Applied Basic Research Foundation (grant no. 2023A1515011137); Henan Key specialized research and development breakthrough–science and technology project (grant no. 222102110272); Guangzhou Basic and Applied Basic Research Foundation (grant no. 2024A04J9930); the 2022 Guangdong Philosophy and Social Science Foundation (grant no. GD22XGL02); Guangzhou Philosophy and Social Science Planning 2022 Annual Project (grant no. 2022GZQN14); the Fundamental Research Funds for the Central Universities (grant no. QNMS202211); Department of Housing and Urban-Rural Development of Guangdong Province (grant no. 2021-K2-305243); Department of Education of Guangdong Province (grant no. 2021KTSCX004).

Data Availability Statement

Data will be made available on request.

Acknowledgments

We want to sincerely thank the editors and anonymous reviewers for their valuable comments and suggestions.

Conflicts of Interest

Author Xiao Liu was employed by the company Architectural Design & Research Institute Co., Ltd. The remaining authors declare that the research was conducted in the absence of any commercial or financial relationships that could be construed as a potential conflict of interest.

References

  1. Food Security in China (White Paper) [EB/OL]. Available online: http://www.gov.cn/zhengce/2019-10/14/content_5439410.htm (accessed on 15 January 2024).
  2. Wang, Y.; Zeng, C.; Hu, C. Thermal Performance and Energy Conservation Effect of Grain Bin Walls Incorporating PCM in Different Ecological Areas of China. Processes 2022, 10, 2360. [Google Scholar] [CrossRef]
  3. Hamel, D.; Rozman, V.; Liška, A. Storage of cereals in warehouses with or without pesticides. Insects 2020, 11, 846. [Google Scholar] [CrossRef]
  4. Chen, G.; Hou, J.; Liu, C. A Scientometric Review of Grain Storage Technology in the Past 15 Years (2007–2022) Based on Knowledge Graph and Visualization. Foods 2022, 11, 3836. [Google Scholar] [CrossRef]
  5. Collins, D.A. A review on the factors affecting mite growth in stored grain commodities. Exp. Appl. Acarol. 2012, 56, 191–208. [Google Scholar] [CrossRef]
  6. Tang, W.; Di, Y. Ventilation technology and low temperature storage of granary in China. Appl. Mech. Mater. 2012, 204, 4372–4377. [Google Scholar] [CrossRef]
  7. Liu, D. Carbon Emissions Calculation of Grain Storage Process in Large Warehouse. Master’s Thesis, Henan University of Technology, Zhengzhou, China, 2020. (In Chinese). [Google Scholar]
  8. Samuelson, H.; Claussnitzer, S.; Goyal, A.; Chen, Y.; Romo-Castillo, A. Parametric energy simulation in early design: High-rise residential buildings in urban contexts. Build. Environ. 2016, 101, 19–31. [Google Scholar] [CrossRef]
  9. Gercek, M.; Arsan, Z.D. Energy and environmental performance based decision support process for early design stages of residential buildings under climate change. Sustain. Cities Soc. 2019, 48, 101580. [Google Scholar] [CrossRef]
  10. Chen, X.; Yang, H.; Zhang, W. Simulation-based approach to optimize passively designed buildings: A case study on a typical architectural form in hot and humid climates. Renew. Sustain. Energy Rev. 2018, 82, 1712–1725. [Google Scholar] [CrossRef]
  11. Tian, W. A review of sensitivity analysis methods in building energy analysis. Renew. Sustain. Energy Rev. 2013, 20, 411–419. [Google Scholar] [CrossRef]
  12. Zhang, J.; Liu, N.; Wang, S. A parametric approach for performance optimization of residential building design in Beijing. Build. Simul. 2020, 13, 223–235. [Google Scholar] [CrossRef]
  13. Deng, Y.; Zhou, Y.; Wang, H.; Xu, C.; Wang, W.; Zhou, T.; Liu, X.; Liang, H.; Yu, D. Simulation-based Sensitivity Analysis of Energy Performance Applied to an Old Beijing Residential Neighbourhood for Retrofit Strategy Optimisation with Climate Change Prediction. Energy Build. 2023, 294, 113284. [Google Scholar] [CrossRef]
  14. Chen, S.; Zhao, L.; Zheng, L.; Bi, G. A rapid evaluation method for design strategies of high-rise office buildings achieving nearly zero energy in Guangzhou. J. Build. Eng. 2021, 44, 103297. [Google Scholar] [CrossRef]
  15. Zhang, J.; Li, Y.; Li, H. Sensitivity analysis of thermal performance of granary building based on machine learning. In Proceedings of the Intelligent & Informed—The 24th CAADRIA Conference, Wellington, New Zealand, 15–18 April 2019; Victoria University of Wellington: Wellington, New Zealand, 2019; Volume 1, pp. 665–674. [Google Scholar]
  16. Delgarm, N.; Sajadi, B.; Azarbad, K. Sensitivity analysis of building energy performance: A simulation-based approach using OFAT and variance-based sensitivity analysis methods. J. Build. Eng. 2018, 15, 181–193. [Google Scholar] [CrossRef]
  17. Li, H.; Wang, S.; Cheung, H. Sensitivity analysis of design parameters and optimal design for zero/low energy buildings in subtropical regions. Appl. Energy 2018, 228, 1280–1291. [Google Scholar] [CrossRef]
  18. Zhang, L.; Dong, Z.; Liu, F.; Li, H.; Zhang, X.; Wang, K.; Chen, C.; Tian, C. Passive solar sunspace in a Tibetan buddhist house in Gannan cold areas: Sensitivity analysis. J. Build. Eng. 2023, 67, 105960. [Google Scholar] [CrossRef]
  19. Saurbayeva, A.; Memon, S.A.; Kim, J. Sensitivity analysis and optimization of PCM integrated buildings in a tropical savanna climate. J. Build. Eng. 2023, 64, 105603. [Google Scholar] [CrossRef]
  20. Chen, R.; Tsay, Y.S. An Integrated Sensitivity Analysis Method for Energy and Comfort Performance of an Office Building along the Chinese Coastline. Buildings 2021, 11, 371. [Google Scholar] [CrossRef]
  21. Gagnon, R.; Gosselin, L.; Decker, S. Sensitivity analysis of energy performance and thermal comfort throughout building design process. Energy Build. 2018, 164, 278–294. [Google Scholar] [CrossRef]
  22. Pianosi, F.; Beven, K.; Freer, J.; Hall, J.W.; Rougier, J.; Stephenson, D.B.; Wagener, T. Sensitivity analysis of environmental models: A systematic review with practical workflow. Environ. Model. Softw. 2016, 79, 214–232. [Google Scholar] [CrossRef]
  23. Goffart, J.; Woloszyn, M. EASI RBD-FAST: An efficient method of global sensitivity analysis for present and future challenges in building performance simulation. J. Build. Eng. 2021, 43, 103129. [Google Scholar] [CrossRef]
  24. Zhan, C.S.; Song, X.M.; Xia, J.; Tong, C. An efficient integrated approach for global sensitivity analysis of hydrological model parameters. Environ. Model. Softw. 2012, 41, 39–52. [Google Scholar] [CrossRef]
  25. Herrera, P.A.; Marazuela, M.A.; Hofmann, T. Parameter estimation and uncertainty analysis in hydrological modeling. Wiley Interdiscip. Rev. Water 2022, 9, e1569. [Google Scholar] [CrossRef]
  26. Nossent, J.; Elsen, P.; Bauwens, W. Sobol’ sensitivity analysis of a complex environmental model. Environ. Model. Softw. 2011, 26, 1515–1525. [Google Scholar] [CrossRef]
  27. Pudleiner, D.; Colton, J. Using sensitivity analysis to improve the efficiency of a Net-Zero Energy vaccine warehouse design. Build. Environ. 2015, 87, 302–314. [Google Scholar] [CrossRef]
  28. Blower, S.M.; Dowlatabadi, H. Sensitivity and uncertainty analysis of complex models of disease transmission: An HIV model, as an example. Int. Stat. Rev./Rev. Int. De Stat. 1994, 62, 229–243. [Google Scholar] [CrossRef]
  29. Saurbayeva, A.; Memon, S.A.; Kim, J. Integrated multi-stage sensitivity analysis and multi-objective optimization approach for PCM integrated residential buildings in different climate zones. Energy 2023, 278, 127973. [Google Scholar] [CrossRef]
  30. Sobol, I.M. Global sensitivity indices for nonlinear mathematical models and their Monte Carlo estimates. Math. Comput. Simul. 2001, 55, 271–280. [Google Scholar] [CrossRef]
  31. Hu, Y.; Guo, R.; Heiselberg, P.K.; Johra, H. Modeling PCM phase change temperature and hysteresis in ventilation cooling and heating applications. Energies 2020, 13, 6455. [Google Scholar] [CrossRef]
  32. Silva, A.S.; Ghisi, E. Estimating the sensitivity of design variables in the thermal and energy performance of buildings through a systematic procedure. J. Clean. Prod. 2020, 244, 118753. [Google Scholar] [CrossRef]
  33. Naji, S.; Aye, L.; Noguchi, M. Sensitivity analysis on energy performance, thermal and visual discomfort of a prefabricated house in six climate zones in Australia. Appl. Energy 2021, 298, 117200. [Google Scholar] [CrossRef]
  34. Hopfe, C.J.; Hensen, J.L.M. Uncertainty analysis in building performance simulation for design support. Energy Build. 2011, 43, 2798–2805. [Google Scholar] [CrossRef]
  35. Brown, N.C.; Jusiega, V.; Mueller, C.T. Implementing data-driven parametric building design with a flexible toolbox. Autom. Constr. 2020, 118, 103252. [Google Scholar] [CrossRef]
  36. Liu, S.; Wang, Y.; Liu, X.; Yang, L.; Zhang, Y.; He, J. How does future climatic uncertainty affect multi-objective building energy retrofit decisions? Evidence from residential buildings in subtropical Hong Kong. Sustain. Cities Soc. 2023, 92, 104482. [Google Scholar] [CrossRef]
  37. Hoseinzadeh, P.; Assadi, M.K.; Heidari, S.; Khalatbari, M.; Saidur, R.; Nejad, K.H.; Sangin, H. Energy performance of building integrated photovoltaic high-rise building: Case study, Tehran, Iran. Energy Build. 2021, 235, 110707. [Google Scholar] [CrossRef]
  38. Natanian, J.; Aleksandrowicz, O.; Auer, T. A parametric approach to optimizing urban form, energy balance and environmental quality: The case of Mediterranean districts. Appl. Energy 2019, 254, 113637. [Google Scholar] [CrossRef]
  39. Li, X.; Ding, Y.; Zhao, J.; Xu, Q. Experimental study on mechanical properties of integrated wall panels of grain warehouse with “Thermal Insulation”. Adv. Civ. Eng. 2022, 2022, 8636936. [Google Scholar] [CrossRef]
  40. GB/T 29890-2013; Technical Criterion for Grain and Oil-Seeds Storage. China Standard Press: Beijing, China, 2013.
  41. Wang, Z. Basic Theory and Design of Granary Building; Henan Science and Technology Press: Zhengzhou, China, 2015; pp. 244–250. ISBN 978-7-5349-7322-2. [Google Scholar]
  42. GB 50345-2012; Technical Code for Roof Engineering. China Architecture & Building Press: Beijing, China, 2012.
  43. Wang, H.; Huang, Y.; Yang, L. Integrated economic and environmental assessment-based optimization design method of building roof thermal insulation. Buildings 2022, 12, 916. [Google Scholar] [CrossRef]
  44. Manache, G.; Melching, C.S. Sensitivity of Latin hypercube sampling to sample size and distributional assumptions. In Proceedings of the 32nd Congress of the International Association of Hydraulic Engineering and Research, Venice, Italy, 1–6 July 2007. [Google Scholar]
  45. Ouanes, S.; Sriti, L. Regression-based sensitivity analysis and multi-objective optimisation of energy performance and thermal comfort: Building envelope design in hot arid urban context. Build. Environ. 2024, 248, 111099. [Google Scholar] [CrossRef]
  46. Song, J.; Peng, J.; Cao, J.; Yin, R.; He, Y.; Zou, B.; Zhao, W. Global sensitivity analysis of fan coil air conditioning demand response—A case study of medium-sized office buildings. Appl. Therm. Eng. 2023, 230, 120721. [Google Scholar] [CrossRef]
  47. Yildiz, Y.; Korkmaz, K.; Ozbalta, T.G.; Arsan, Z.D. An approach for developing sensitive design parameter guidelines to reduce the energy requirements of low-rise apartment buildings. Appl. Energy 2012, 93, 337–347. [Google Scholar] [CrossRef]
  48. Xu, W.; Gong, S.; Wang, N.; Zhao, W.; Yin, H.; Yang, R.; Yin, X.; Tan, G. Temperature reduction and energy-saving analysis in grain storage: Field application of radiative cooling technology to grain storage warehouse. Renew. Energy 2023, 218, 119272. [Google Scholar] [CrossRef]
  49. Zhu, L.; Zhang, J.; Gao, Y.; Tian, W.; Yan, Z.; Ye, X.; Sun, X.; Wu, C. Uncertainty and sensitivity analysis of cooling and heating loads for building energy planning. J. Build. Eng. 2022, 45, 103440. [Google Scholar] [CrossRef]
  50. Guo, J.; Li, M.; Jin, Y.; Shi, C.; Wang, Z. Energy Prediction and Optimization Based on Sequential Global Sensitivity Analysis: The Case Study of Courtyard-Style Dwellings in Cold Regions of China. Buildings 2022, 12, 1132. [Google Scholar] [CrossRef]
  51. Choi, J.H. Investigation of the correlation of building energy use intensity estimated by six building performance simulation tools. Energy Build. 2017, 147, 14–26. [Google Scholar] [CrossRef]
  52. Li, K.; Liu, X.; Zhang, H.; Ma, J.; He, B.J. Evaluating and improving the adaptability of commonly used indices for predicting outdoor thermal sensation in hot and humid residential areas of China. Dev. Built Environ. 2023, 16, 100278. [Google Scholar] [CrossRef]
  53. Liu, X.; He, J.; Xiong, K.; Liu, S.; He, B.-J. Identification of factors affecting public willingness to pay for heat mitigation and adaptation: Evidence from Guangzhou, China. Urban Clim. 2023, 48, 101405. [Google Scholar] [CrossRef]
  54. Zhang, Y.; Li, B.; Caneparo, L.; Meng, Q.; Guo, W.; Liu, X. Physical Environment Study on Social Housing Stock in Italian Western Alps for Healthy and Sustainable Communities. Land 2023, 12, 1468. [Google Scholar] [CrossRef]
  55. Li, B.; Guo, W.; Liu, X.; Zhang, Y.; Caneparo, L. The Third Solar Decathlon China Buildings for Achieving Carbon Neutrality. Buildings 2022, 12, 1094. [Google Scholar] [CrossRef]
  56. Zheng, S.; He, C.; Guldmann, J.-M.; Xu, H.; Liu, X. Heat Mitigation Benefits of Urban Trees: A Review of Mechanisms, Modeling, Validation and Simulation. Forests 2023, 14, 2280. [Google Scholar] [CrossRef]
Figure 1. Sensitivity analysis flow chart.
Agriculture 14 00193 g001
Figure 2. Geometric model of the grain warehouse.
Agriculture 14 00193 g002
Figure 3. Correlation coefficients among design parameters.
Agriculture 14 00193 g003
Figure 4. (a) Granary cooling energy distribution; (b) Normal distribution Q-Q plot.
Agriculture 14 00193 g004
Figure 5. (a) Sensitivity ranking of SRC; (b) Sensitivity ranking of PRCC.
Agriculture 14 00193 g005
Figure 6. Sensitivity analysis results of the Sobol method.
Agriculture 14 00193 g006
Figure 7. Results of local sensitivity factor analysis.
Agriculture 14 00193 g007
Table 1. Input parameters of the energy model.
CategoryParameter Name TypeRangesReferences
Shape parametersBuilding length (BL) continuous36~66 m[41]
Building width (BW) continuous21~30 m[41]
Loading height (LH) continuous6~12 m[41]
Building orientation (BO)continuous0~90°
Roof slope (RS) continuous3~45°[42]
Envelope parametersWall thickness (T) discrete370 mm, 490 mm, 620 mm, 740 mm
Window type (WD_T)Color steel doors and windowsdiscrete6.6 w/(m2.k)
Door type (D_T)Traditional insulation and airtight doors and windows 0.5 w/(m2.k)
New thermal insulation and airtight doors and windows 0.22 w/(m2.k)
Wall insulation type (W_T)EPSdiscrete0.024 w/(m.k)[43]
Roof insulation type (R_T)XPS 0.032 w/(m.k)
PU 0.039 w/(m.k)
Wall thermal insulation thickness (W_THI)continuous0~200 mm
Roof thermal insulation thickness (R_THI)continuous40~300 mm
Wall solar absorptance (W_SA)continuous0.05~0.95[21]
Roof solar absorptance (R_SA)continuous0.05~0.95[21]
EquipmentparameterCooling Set-point Temperature (C_ST) continuous15~25 °C
Table 2. Ranking of parameter importance corresponding to three GSA methods.
RankingSRCPRCCSobol
(First-Order Effect)
1C_STC_STC_ST
2R_SAR_SAR_SA
3R_THIR_THIWD_T
4W_THIW_THIR_THI
5WD_TW_SAW_THI
6W_SARSBO
7R_TWD_TRS
8RSR_TLH
9TW_TT
10D_TTBW
11W_TLHR_T
12BOBWW_T
13BLBLW_SA
14LHD_TD_T
15BWBOBL
Table 3. Results of comprehensive local sensitivity analysis.
C_STR_SAR_THIW_THIWD_TBO
Sensitivity factor0.8350.3670.2220.2360.1010.008
Disclaimer/Publisher’s Note: The statements, opinions and data contained in all publications are solely those of the individual author(s) and contributor(s) and not of MDPI and/or the editor(s). MDPI and/or the editor(s) disclaim responsibility for any injury to people or property resulting from any ideas, methods, instructions or products referred to in the content.

