
Evaluating the Effects of Fertilizer Deep Placement on Greenhouse Gas Emissions and Nutrient Use Efficiency in Wet Direct-Seeded Rice During the Wet Season in Assam, India

 ,
,  , ,
, ,
Abstract
1. Introduction
2. Materials and Methods
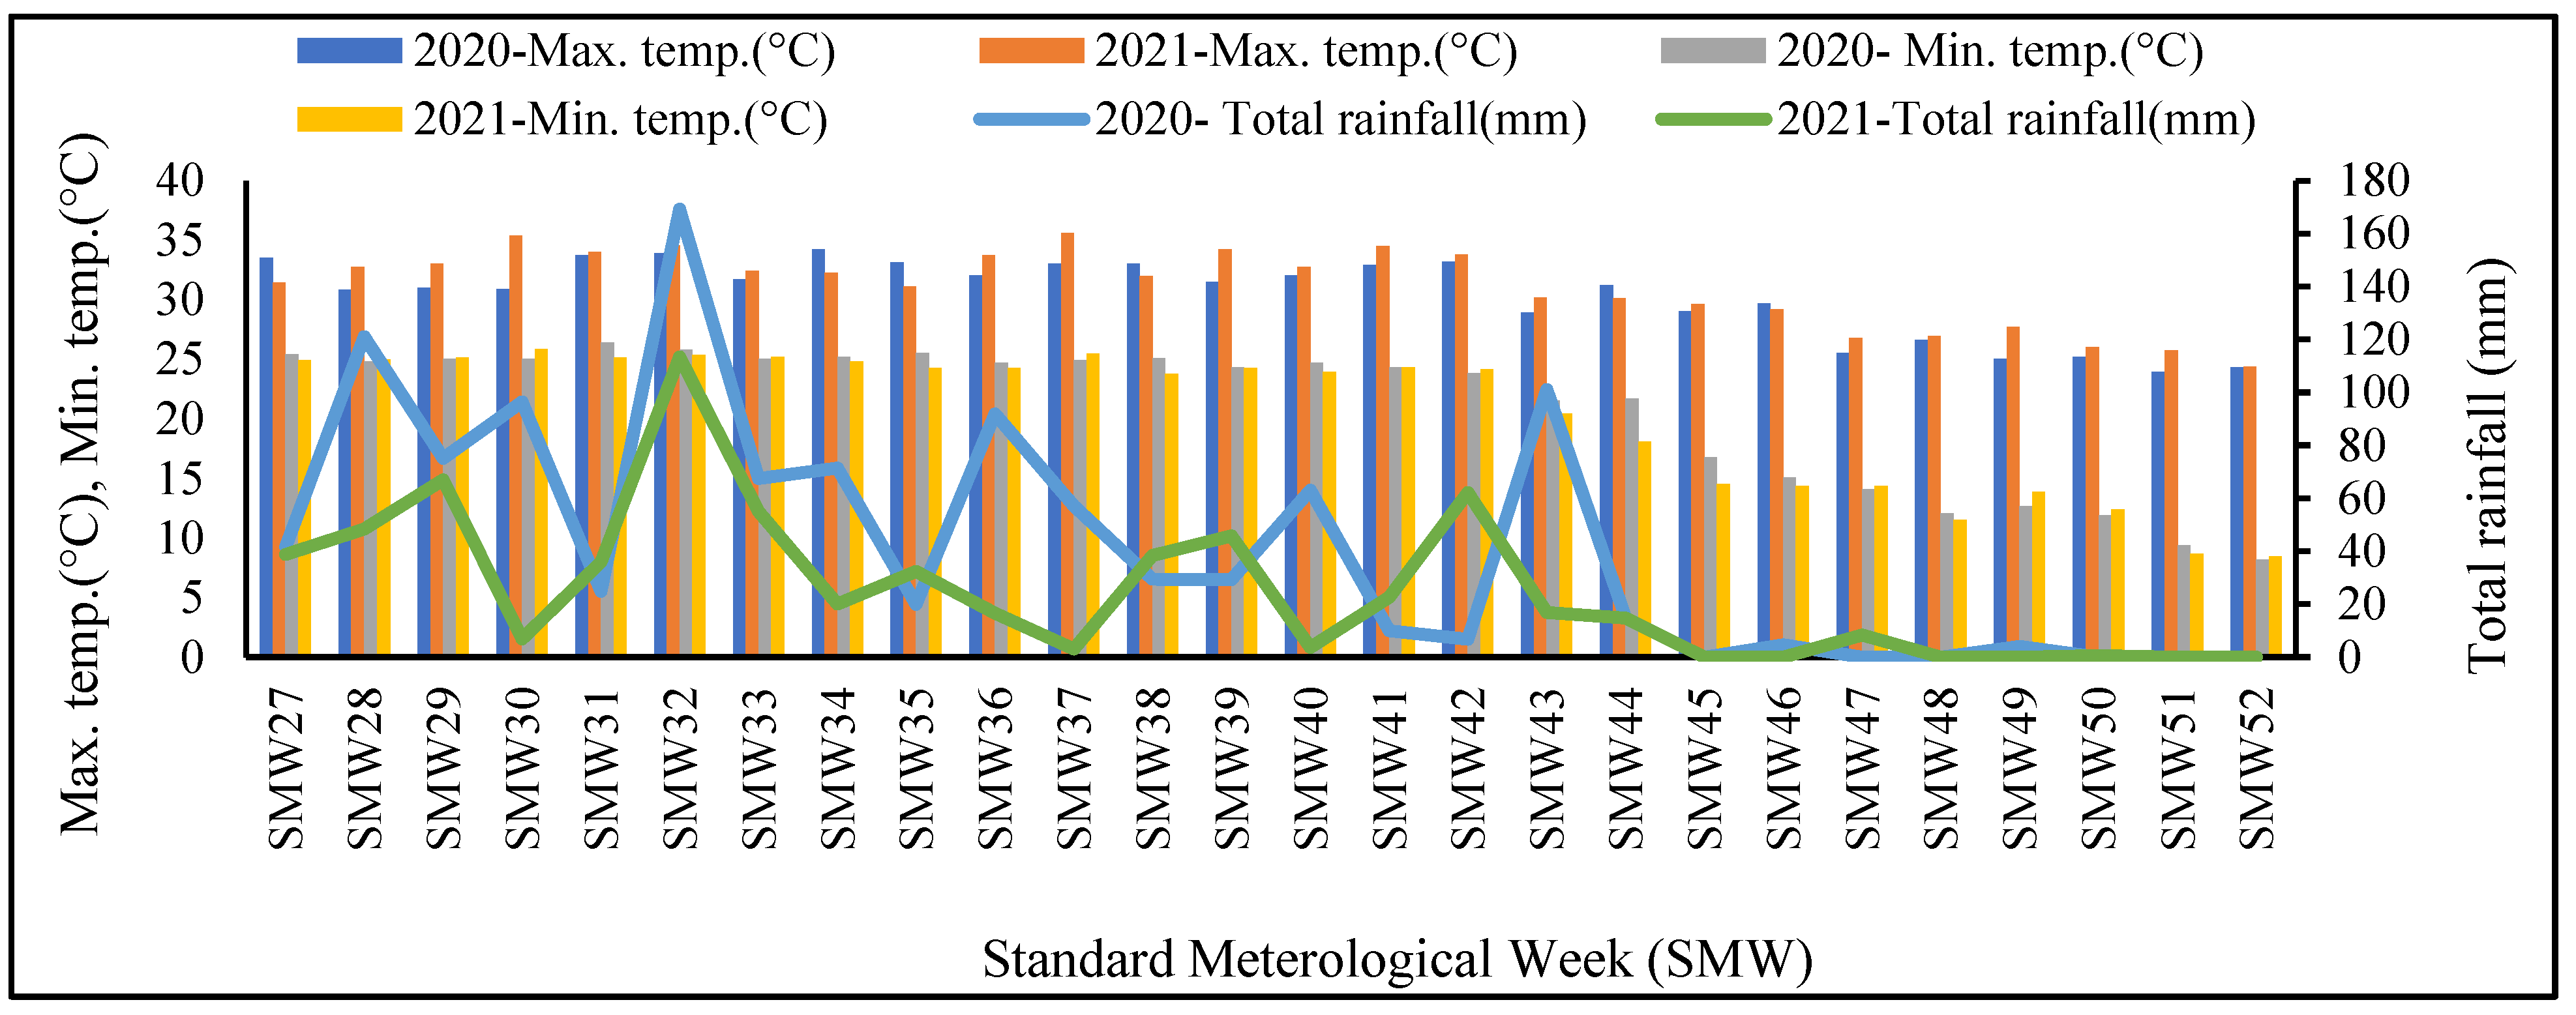
2.1. Experiment Site
2.2. Treatment Details and Observations
2.3. Gas Sampling and Measurement (Through Static Chamber)
2.4. Estimates of Global Warming Potential (GWP), Greenhouse Gas Intensity (GHGI), and Carbon Equivalent Emissions (CEE)
2.5. Economic Analysis
2.6. Statistical Analysis
3. Results
3.1. Efficiency Indices
3.2. Green House Gas Emissions
3.3. GWP, CEE, and GHGI
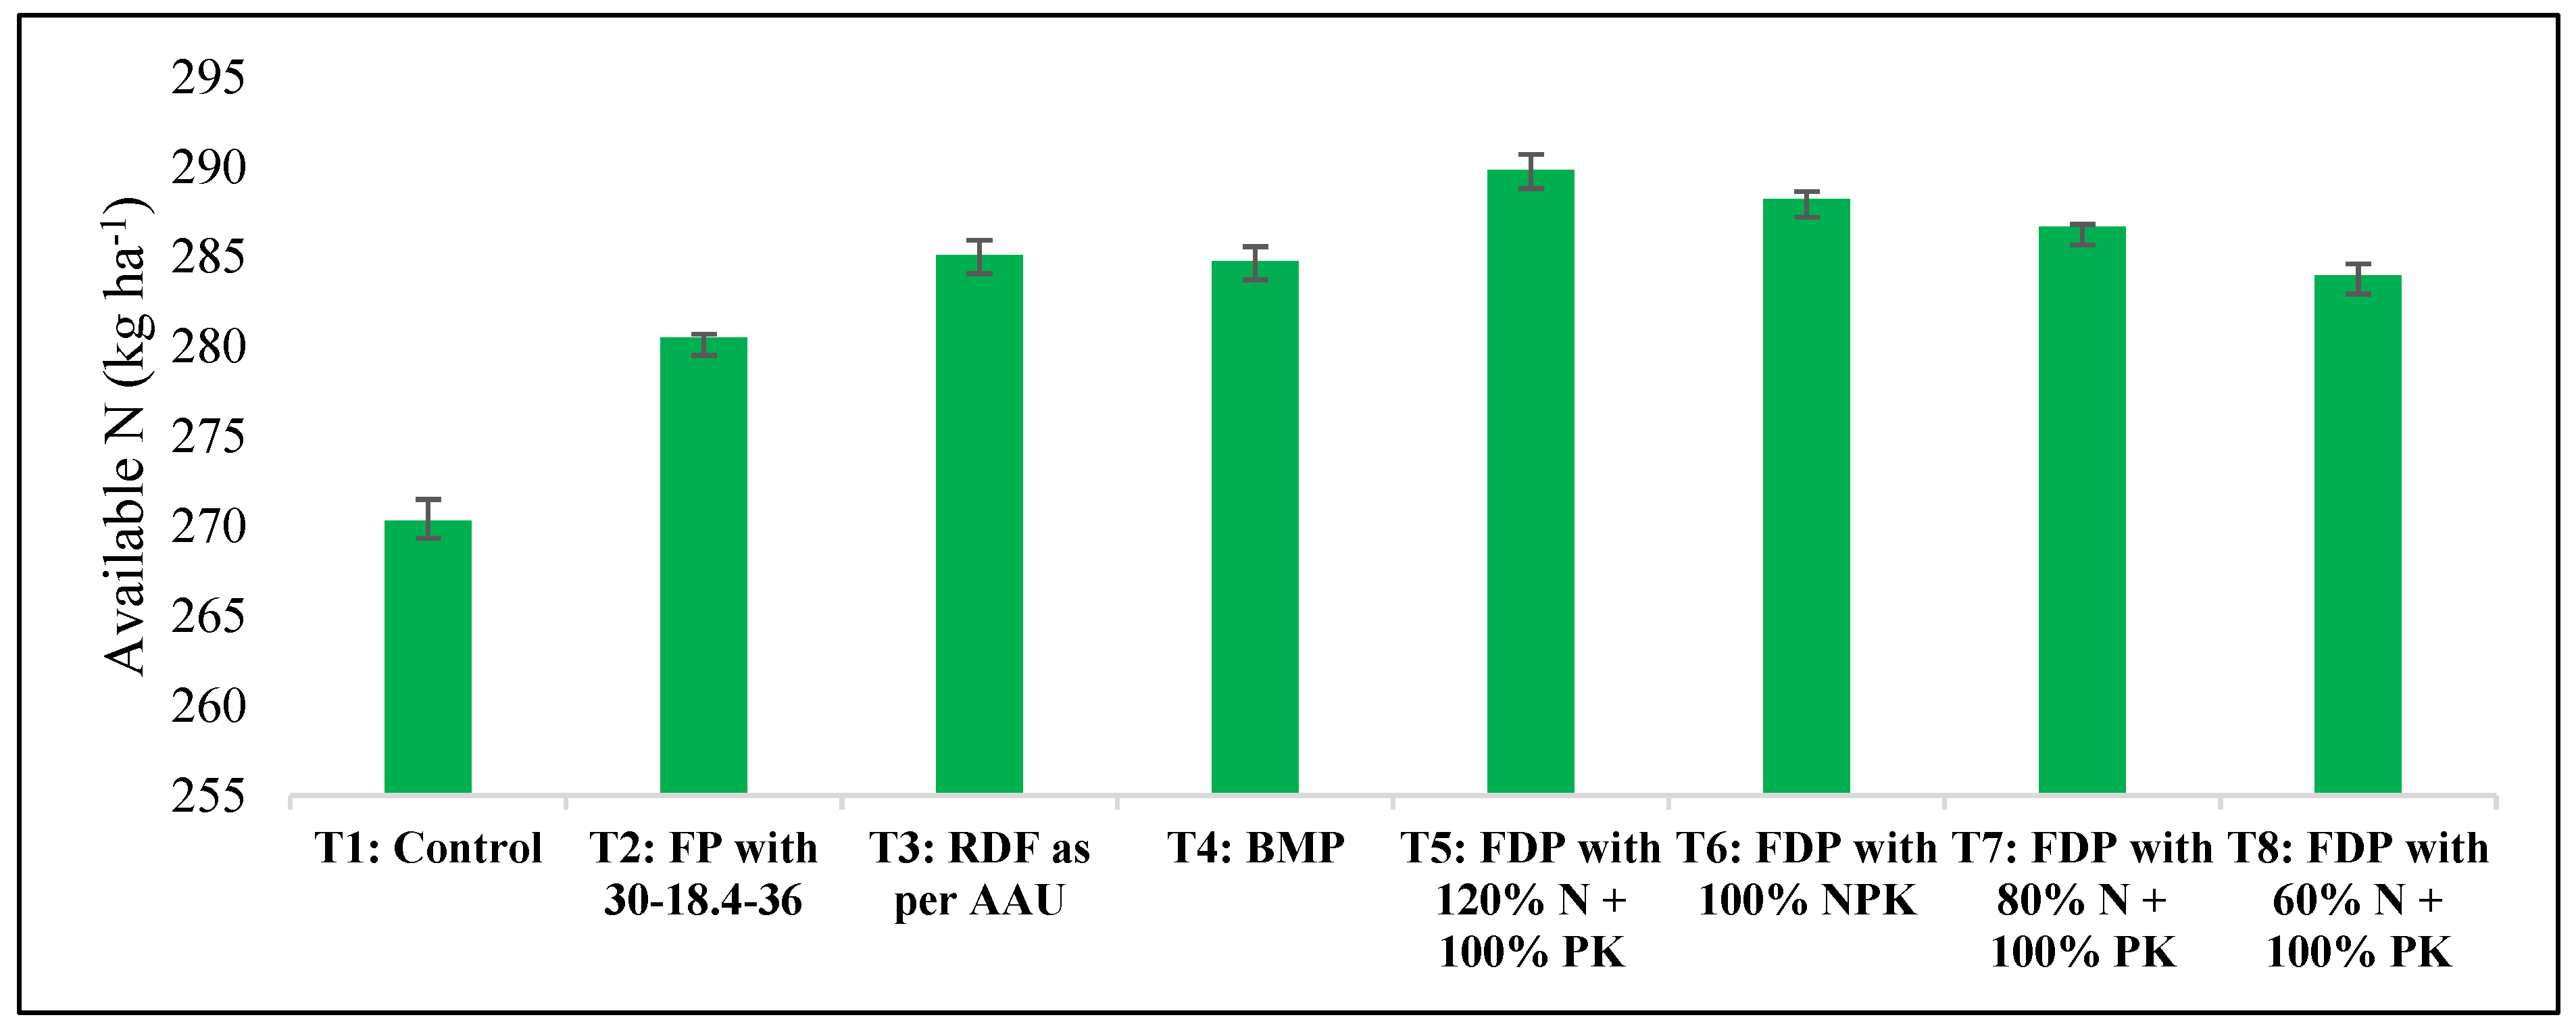
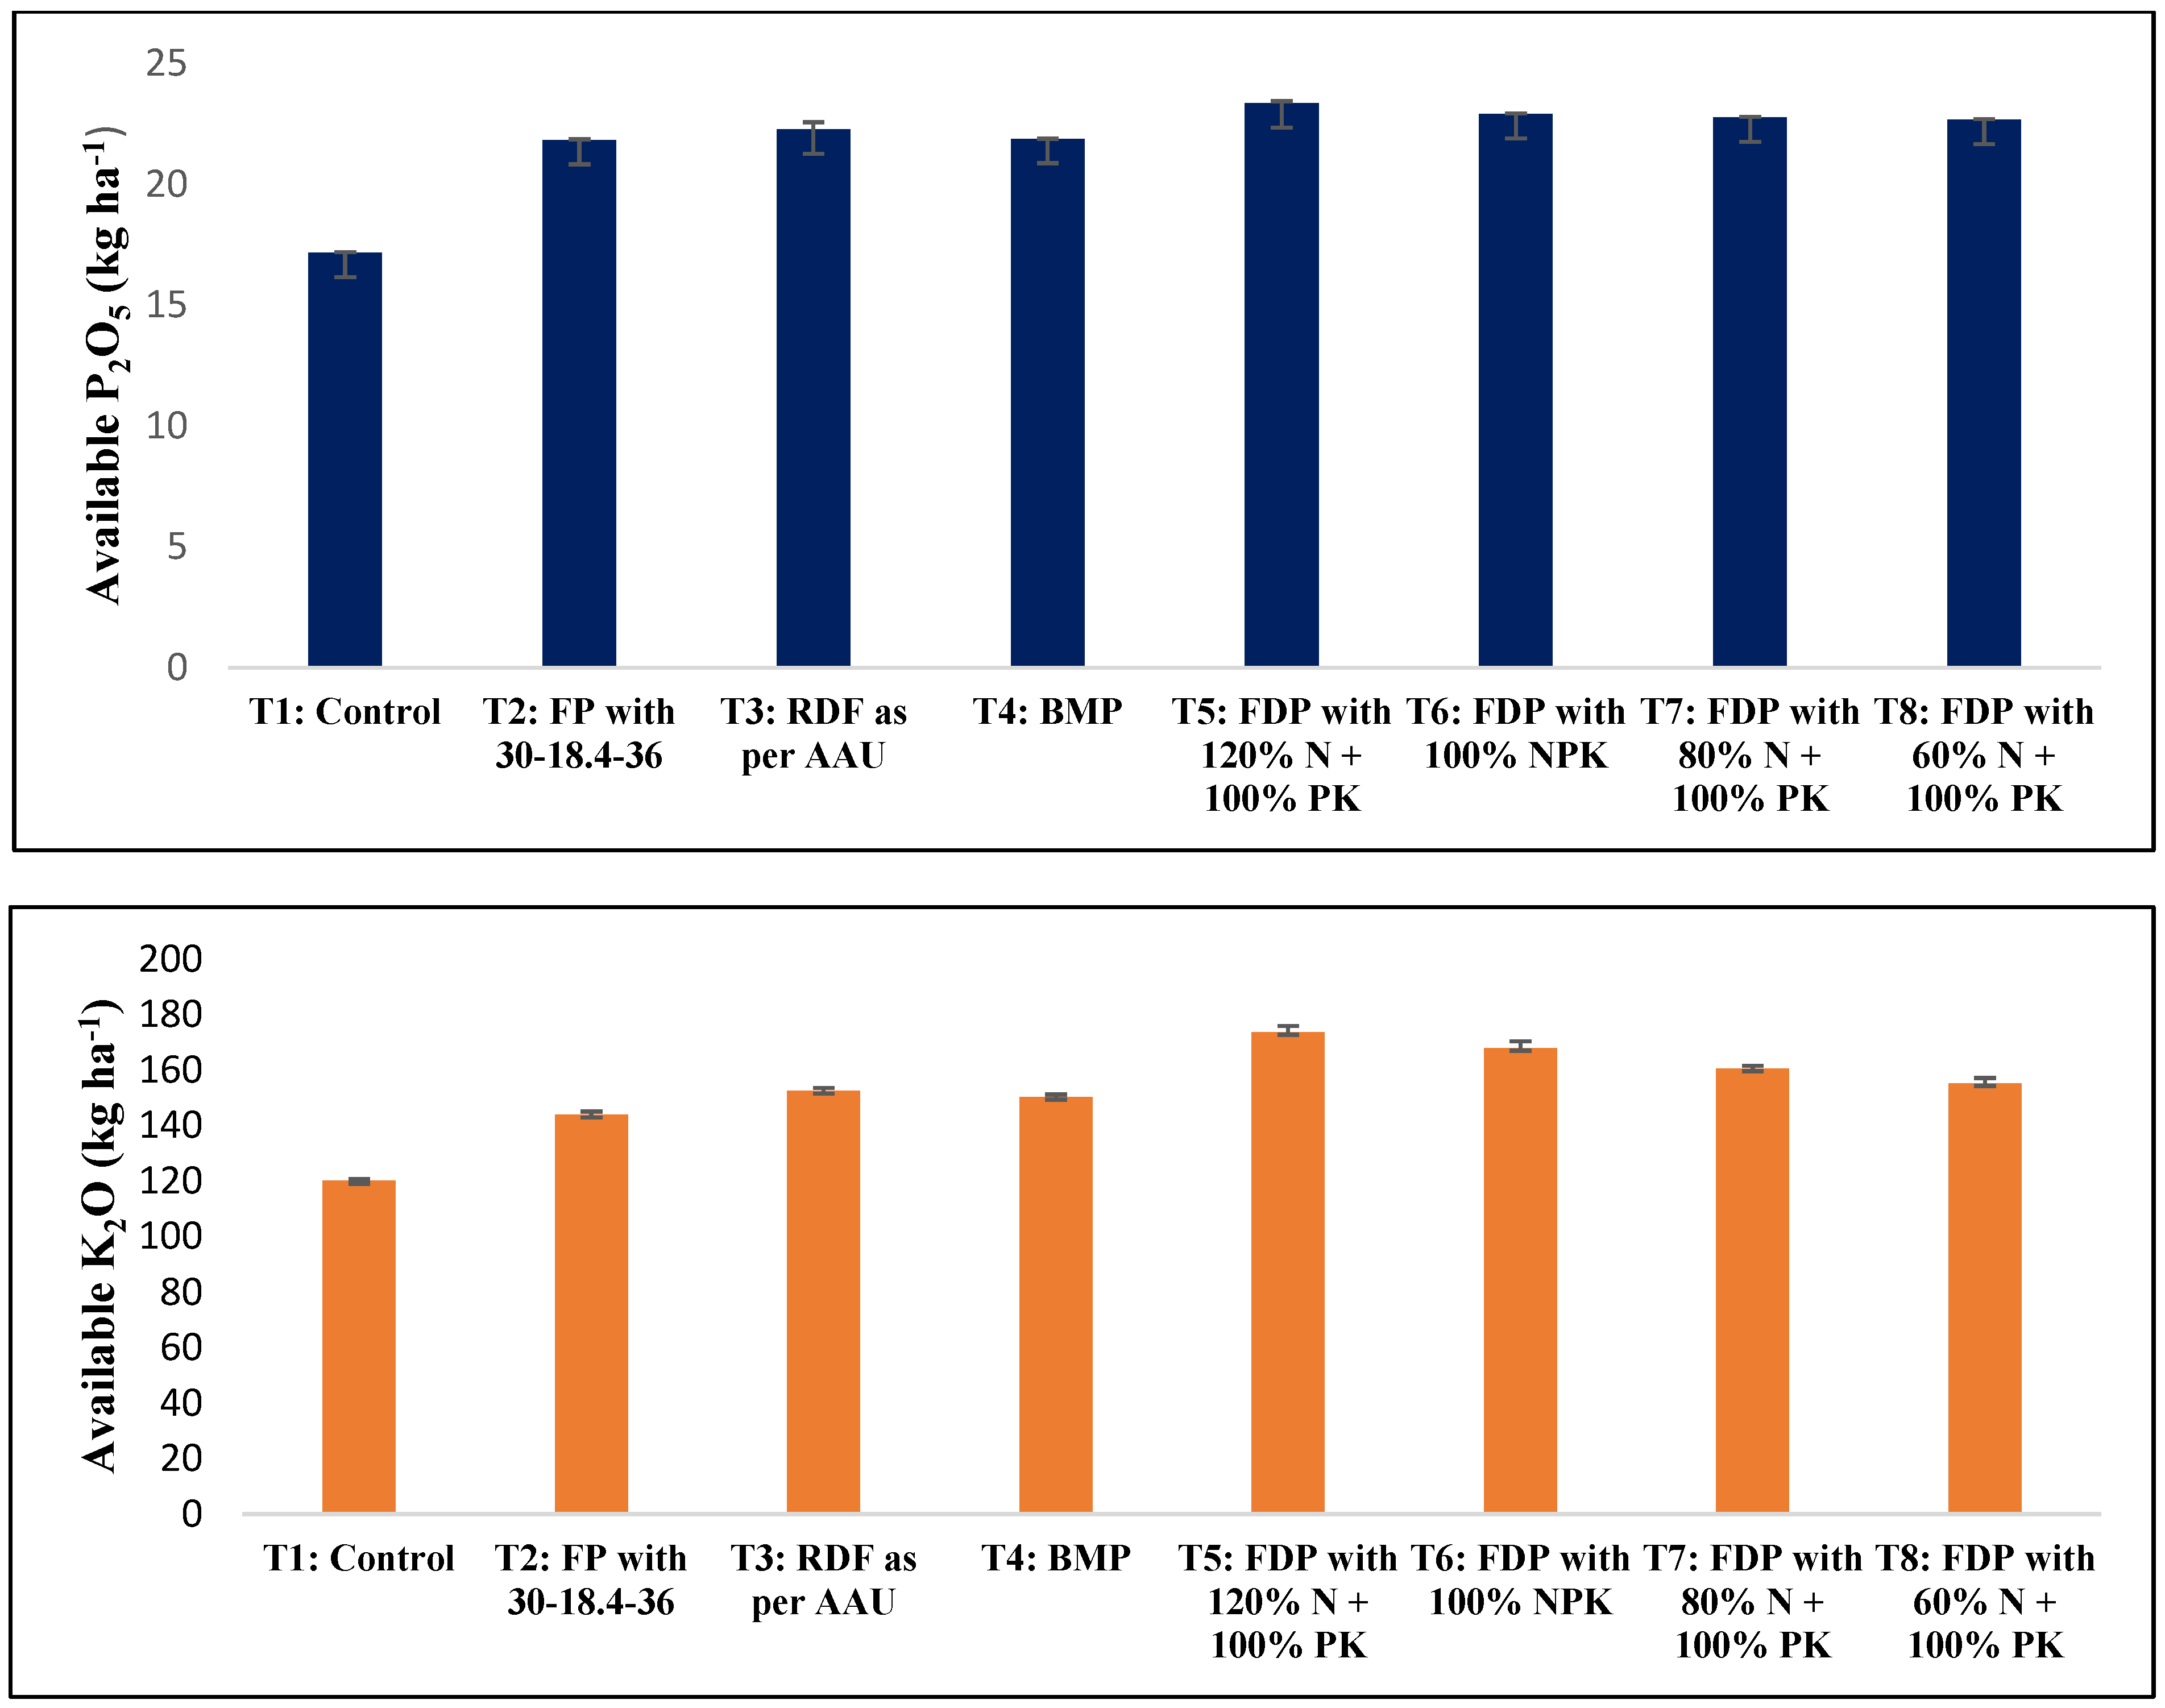
3.4. Available N, P2O5 and K2O Content in Soil
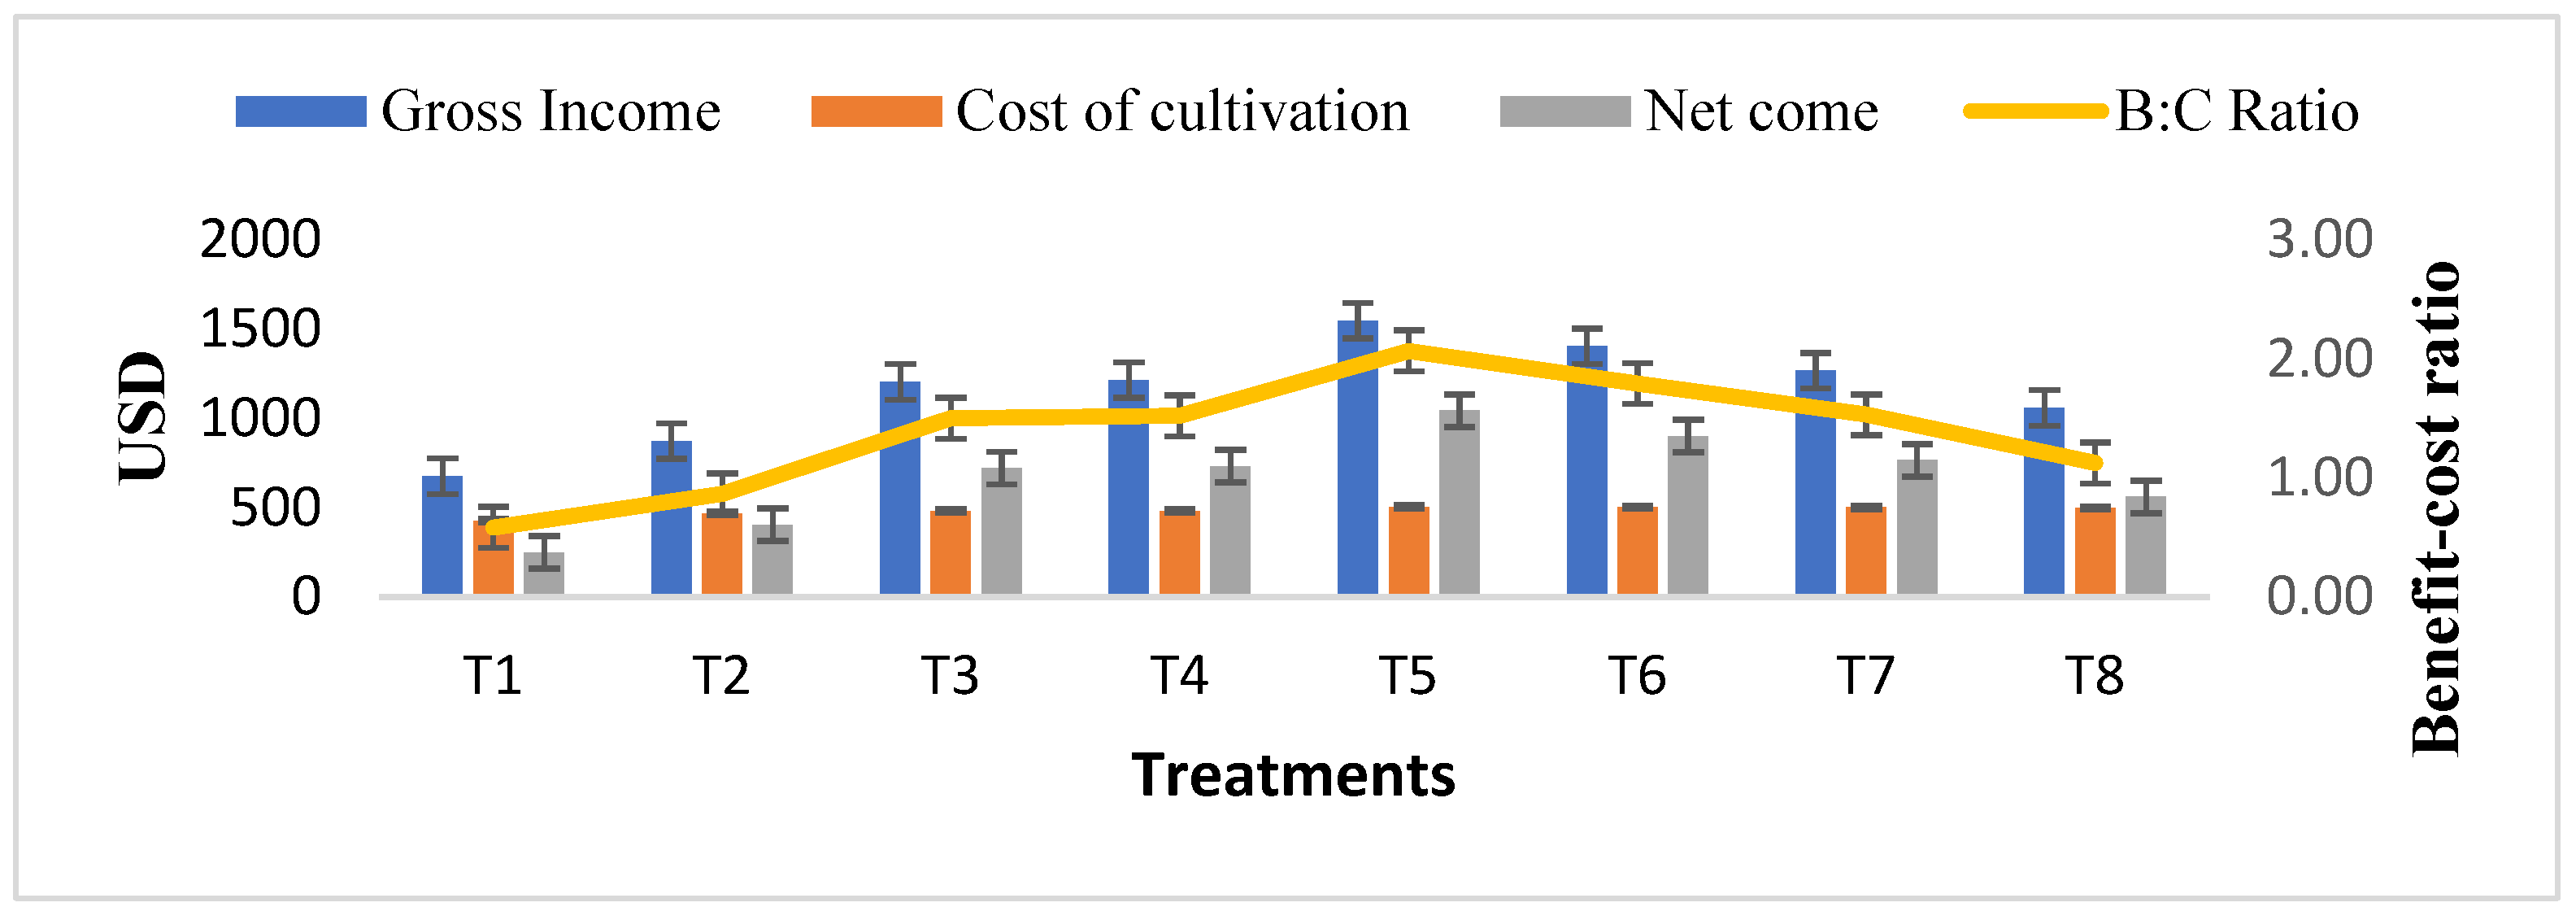
3.5. Economics
4. Discussion
4.1. Growth Parameters, Yield Attributes, and Yield
4.2. Nutrient Content and Uptake
4.3. Nutrient Use Efficiencies (NUE)
4.4. Greenhouse Gas Emissions
4.5. Available N, P2O5 and K2O Content in Soil
4.6. Economic Analysis
5. Conclusions
Author Contributions
Funding
Institutional Review Board Statement
Data Availability Statement
Acknowledgments
Conflicts of Interest
References
- Llones, C.; Suwanmaneepong, S. Influence of perceived risks in farmer’s decision towards sustainable farm practices, Evidence from Northern Thailand. Int. J. Agric. 2021, 17, 2143–2154. [Google Scholar]
- Palanisami, K.; Kakumanu, K.R.; Nagothu, U.S.; Ranganathan, C.R.; Senthilnathan, S. Climate change and India’s future rice production: Evidence from 13 major rice growing states of India. SciFed J. Glob. Warm. 2017, 1, 1000010. [Google Scholar]
- Ray, D.K.; West, P.C.; Clark, M.; Gerber, J.S.; Prishchepov, A.V.; Chatterjee, S. Climate change has likely already affected global food production. PLoS ONE 2019, 14, e0217148. [Google Scholar] [CrossRef] [PubMed]
- MoEFCC (Ministry of Environment, Forest and Climate Change). Third Biennial Update Report to the United Nations Framework Convention on Climate Change; Ministry of Environment, Forest and Climate Change, Government of India: New Delhi, India, 2021. [Google Scholar]
- GOI (Government of India). Agricultural Statistics at a Glance; Government of India, Ministry of Agriculture and Farmers Welfare, Department of Agriculture, Cooperation and Farmers Welfare, Directorate of Economics and Statistics: New Delhi, India, 2021. [Google Scholar]
- Deka, A.M.; Bora, P.C.; Kalita, H.; Zaman, A.S.N.; Saikia, P. Effect of dates and methods of winter rice (Oryza sativa L.) transplanting on relayed niger (Guizotia abyssinica) and soil health. Indian J. Agric. Res. 2019, 53, 435–440. [Google Scholar] [CrossRef]
- Zhu, C.H.; Ouyang, Y.Y.; Diao, Y.; Yu, J.Q.; Luo, X.; Zheng, J.G.; Li, X.Y. Effects of mechanized deep placement of nitrogen fertilizer rate and type on rice yield and nitrogen use efficiency in Chuanxi Plain, China. J. Integr. Agric. 2021, 20, 581–592. [Google Scholar] [CrossRef]
- Min, J.; Sun, H.; Wang, Y.; Pan, Y.; Kronzucker, H.J.; Zhao, D.; Shi, W. Mechanical side-deep fertilization mitigates ammonia volatilization and nitrogen runoff and increases profitability in rice production independent of fertilizer type and split ratio. J. Clean. Prod. 2021, 316, 128370. [Google Scholar] [CrossRef]
- Bhattacharyya, P.; Nayak, A.K.; Mohanty, S.; Tripathi, R.; Shahid, M.; Kumar, A.; Rao, K.S. Greenhouse gas emission in relation to labile soil C, N pools and functional microbial diversity as influenced by 39 years long-term fertilizer management in tropical rice. Soil Tillage Res. 2013, 129, 93–105. [Google Scholar] [CrossRef]
- IPCC (Intergovernmental Panel on Climate Change). Summary for Policymakers. In Climate Change 2013: The Physical Science Basis. Contribution of Working Group I to the Fifth Assessment Report of the Intergovernmental Panel on Climate Change; Stocker, T.F., Qin, D., Plattner, G.-K., Tignor, M., Allen, S.K., Boschung, J., Nauels, A., Xia, Y., Bex, V., Midgley, P.M., Eds.; Cambridge University Press: Cambridge, UK; New York, NY, USA, 2013; p. 1535. [Google Scholar]
- Shang, Q.; Yang, X.; Gao, C.; Wu, P.; Liu, J.; Xu, Y.; Guo, S. Net annual global warming potential and greenhouse gas intensity in Chinese double rice-cropping systems: A 3-year field measurement in long-term fertilizer experiments. Glob. Chang. Biol. 2011, 17, 2196–2210. [Google Scholar] [CrossRef]
- Gopinath, P.P.; Parsad, R.; Joseph, B.; Adarsh, V.S. grapesAgri1: Collection of Shiny Apps for Data Analysis in Agriculture. J. Open Source Softw. 2021, 6, 3437. [Google Scholar] [CrossRef]
- Gaudin, R. L’ammoniac NH3, une clé pour comprendre l’éfficacité des supergranules d’urée en riziculture irriguée. Agron. Trop. 1988, 43, 30–36. [Google Scholar]
- Yoshida, S.; Cock, J.H.; Parao, F.T. Physiological aspects of high yields. Annu. Rev. Plant Physiol. 1972, l23, 437–464. [Google Scholar] [CrossRef]
- Das, S.; Islam, M.R.; Sultana, M.; Afroz, H.; Hashem, M.A. Effect of deep placement of nitrogen fertilizers on rice yield and N use efficiency under water regimes. SAARC J. Agric. 2015, 13, 161–172. [Google Scholar] [CrossRef]
- Islam, M.R.; Tabassum, N.; Akhter, M.T.; Hossen, K.; Hossain, M.A. Nitrogen use efficiency and yield of BRRI dhan46 as influenced by deep placement of N fertilizers under flooded condition. Asian Australas. J. Biosci. Biotechnol. 2017, 2, 219–225. [Google Scholar] [CrossRef]
- Zeng, X.; Han, B.; Xu, F.; Huang, J.; Cai, H.; Shi, L. Effects of modified fertilization technology on the grain yield and nitrogen use efficiency of midseason rice. Field Crops Res. 2012, 137, 203–212. [Google Scholar] [CrossRef]
- Mazid, M.M.A.; Gaihre, Y.K.; Hunter, G.; Singh, U.; Hossain, S.A. Fertilizer deep placement increases rice production: Evidence from farmers’ fields in southern Bangladesh. Agron. J. 2016, 108, 805–812. [Google Scholar] [CrossRef]
- Hasan, S.L.; Islam, M.R.; Sumon, M.H.; Huda, A. Deep placement of N fertilizers influences N use efficiency and yield of BRRI dhan29 under flooded condition. Asian J. Med. Biol. Res. 2016, 2, 279–284. [Google Scholar] [CrossRef]
- Li, L.; Tian, H.; Zhang, M.; Fan, P.; Ashraf, U.; Liu, H.; Pan, S. Deep placement of nitrogen fertilizer increases rice yield and nitrogen use efficiency with fewer greenhouse gas emissions in a mechanical direct-seeded cropping system. Crop J. 2021, 9, 1386–1396. [Google Scholar] [CrossRef]
- Rea, R.S.; Islam, M.R.; Rahman, M.M.; Mix, K. Study of nitrogen use efficiency and yield of rice influenced by deep placement of nitrogen fertilizers. SAARC J. Agric. 2019, 17, 93–103. [Google Scholar] [CrossRef]
- Afroz, H.; Islam, M.R. Floodwater nitrogen, rice yield and N use efficiency as influenced by deep placement of nitrogenous fertilizers. J. Environ. Sci. Nat. Resour. 2014, 7, 207–213. [Google Scholar] [CrossRef]
- Islam, M.R.; Akter, M.; Sumon, M.H.; Das, S.; Huda, A. Effect of deep placement of N fertilizers on yield and nitrogen use efficiency of boro rice cv. BRRI DHAN28. Bangladesh J. Crop Sci. 2014, 25, 1–7. [Google Scholar]
- He, Y.; Liao, H.; Yan, X. Localized supply of phosphorus induces root morphological and architectural changes of rice in split and stratified soil cultures. Plant Soil 2003, 248, 247–256. [Google Scholar] [CrossRef]
- Roberts, T.L. Improving nutrient use efficiency. Turk. J. Agric. For. 2008, 32, 177–182. [Google Scholar]
- Kapoor, V.; Singh, U.; Patil, S.K.; Magre, H.; Shrivastava, L.K.; Mishra, V.N.; Diamond, R. Rice growth, grain yield, and floodwater nutrient dynamics as affected by nutrient placement method and rate. Agron. J. 2008, 100, 526–536. [Google Scholar] [CrossRef]
- Bijay, S.; Gupta, R.K.; Yadvinder, S.; Gupta, S.K.; Jag-deep, S.; Bains, J.S.; Vashishta, M. Need-based nitrogen management using leaf color chart in wet direct-seeded rice in Northwestern. Indian J. New Seeds 2006, 8, 354–357. [Google Scholar]
- Rawal, N.; Pande, K.R.; Shrestha, R.; Vista, S.P. Nutrient-Use Efficiency Indices in Maize Hybrid as a Function of Various Rates of NPK in Mid Hills of Nepal. Turk. J. Food Sci. Technol. 2021, 9, 2278–2288. [Google Scholar] [CrossRef]
- Khalili, A.; Dhar, S.; Dass, A.; Ahmad, F.M.; Varghese, E. Agronomic indices of nitrogen use efficiency and maize yield response to various rates, time of application and their interaction effect in Kandahar region of Afghanistan. Agronomic indices of nitrogen use efficiency and maize yield response. Ann. Agric. Sci. 2018, 39, 347–353. [Google Scholar]
- Baruah, K.K.; Gogoi, B.; Gogoi, P. Plant physiological and soil characteristics associated with methane and nitrous oxide emission from rice paddy. Physiol. Mol. Biol. Plants 2010, 16, 79–91. [Google Scholar] [CrossRef] [PubMed]
- Liu, T.Q.; Li, S.H.; Guo, L.G.; Cao, C.G.; Li, C.F.; Zhai, Z.B.; Ke, H.J. Advantages of nitrogen fertilizer deep placement in greenhouse gas emissions and net ecosystem economic benefits from no-tillage paddy fields. J. Clean. Prod. 2020, 263, 121322. [Google Scholar] [CrossRef]
- Liu, T.; Fan, D.; Zhang, X.; Chen, J.; Li, C.; Cao, C. Deep placement of nitrogen fertilizers reduces ammonia volatilization and increases nitrogen utilization efficiency in no-tillage paddy fields in central China. Field Crop. Res. 2015, 184, 80–90. [Google Scholar] [CrossRef]

| Treatment | Plant Height (cm) at Harvest | Effective Tillers (No. m−2) | LAI at 90 DAS | Dry Matter Production (g m−2) at Harvest |
|---|---|---|---|---|
| T1: Control | 83 f | 206 g | 1.6 f | 851 f |
| T2: FP with 30-18.4-36 | 95 e | 227 f | 2.2 ef | 1096 e |
| T3: RDF as per AAU | 115 c | 264 d | 3.5 cd | 1509 c |
| T4: BMP | 116 c | 272 cd | 3.7 c | 1557 c |
| T5: FDP with 120% N + 100% PK | 140 a | 318 a | 5.9 a | 2116 a |
| T6: FDP with 100% NPK | 129 b | 298 b | 4.9 b | 1823 b |
| T7: FDP with 80% N + 100% PK | 119 c | 278 c | 4.1 c | 1644 c |
| T8: FDP with 60% N + 100% PK | 105 d | 245 e | 2.7 de | 1286 d |
| Treatment (T) | * | * | * | * |
| Year (Y) | NS | * | NS | * |
| Y * T interaction | NS | NS | NS | NS |
| Treatment | Panicle Length (cm) | Filled Grains (No. Panicle−1) | Total Spikelets (No. Panicle−1) | 1000-Grain Weight (g) | Grain Yield (kg ha−1) | Straw Yield (kg ha−1) | Harvest Index (%) |
|---|---|---|---|---|---|---|---|
| T1: Control | 23.2 f | 100 g | 128 g | 17.9 f | 1970 g | 3488 g | 36.0 e |
| T2: FP with 30-18.4-36 | 24.3 e | 117 f | 144 f | 19.0 e | 2642 f | 4163 f | 38.8 d |
| T3: RDF as per AAU | 26.4 c | 152 d | 177 d | 19.4 c | 3780 d | 5273 d | 41.8 bc |
| T4: BMP | 26.5 c | 155 cd | 179 cd | 19.5 c | 3819 cd | 5290 d | 41.9 abc |
| T5: FDP with 120% N + 100% PK | 27.9 a | 198 a | 218 a | 20.2 a | 4933 a | 6520 a | 43.1 a |
| T6: FDP with 100% NPK | 27.2 b | 179 b | 200 b | 19.9 b | 4451 b | 5988 b | 42.7 ab |
| T7: FDP with 80% N + 100% PK | 26.5 c | 162 c | 184 c | 19.5 c | 4002 c | 5451 c | 42.3 abc |
| T8: FDP with 60% N + 100% PK | 25.7 d | 135 r | 161 e | 19.2 d | 3297 e | 4727 e | 41.1 c |
| Treatment (T) | * | * | * | * | * | * | * |
| Year (Y) | * | * | * | NS | * | * | NS |
| Y * T interaction | NS | NS | NS | NS | NS | NS | NS |
| Treatment | Uptake (kg ha−1) | Total Uptake (kg ha−1) | |||||||
|---|---|---|---|---|---|---|---|---|---|
| Grain | Straw | ||||||||
| N | P | K | N | P | K | N | P | K | |
| T1: Control | 11.56 f | 2.31 g | 4.07 f | 8.73 g | 3.50 f | 23.17 f | 20.29 g | 5.81 f | 27.24 f |
| T2: FP with 30-18.4-36 | 16.90 e | 3.15 f | 5.79 e | 11.05 f | 4.27 e | 28.07 e | 27.95 f | 7.43 e | 33.86 e |
| T3: RDF as per AAU | 27.63 c | 4.94 e | 8.60 d | 17.57 d | 5.53 d | 36.57 d | 45.19 d | 10.47 d | 45.17 d |
| T4: BMP | 27.99 c | 5.00 e | 8.70 d | 17.76 d | 5.56 d | 36.73 d | 45.74 cd | 10.55 d | 45.43 d |
| T5: FDP with 120% N + 100% PK | 36.48 a | 8.21 a | 13.41 a | 26.87 a | 7.75 a | 52.49 a | 63.35 a | 15.97 a | 65.89 a |
| T6: FDP with 100% NPK | 32.71 b | 7.40 b | 11.95 b | 22.95 b | 7.11 b | 47.76 b | 55.65 b | 14.52 b | 59.70 b |
| T7: FDP with 80% N + 100% PK | 29.38 c | 6.60 c | 10.62 c | 18.65 c | 6.39 c | 43.31 c | 48.02 c | 12.99 c | 53.92 c |
| T8: FDP with 60% N + 100% PK | 21.72 d | 5.42 d | 8.60 d | 15.04 e | 5.55 d | 37.21 d | 36.76 e | 10.97 d | 45.80 d |
| Treatment (T) | * | * | * | * | * | * | * | * | * |
| Year (Y) | * | * | * | * | * | * | * | * | * |
| Y * T interaction | NS | NS | NS | NS | NS | NS | NS | NS | NS |
| Treatment | N Agronomic Efficiency (kg Grain Increase/kg N Applied) | N Partial Factor Productivity (kg Grain Yield Per kg N Applied) | Recovery Efficiency (kg Nutrient Taken Up/kg Nutrient Applied) | ||
|---|---|---|---|---|---|
| N | P | K | |||
| T1: Control | - | - | - | - | - |
| T2: FP with 30-18.4-36 | 22.4 | 0.88 | 0.26 | 0.09 | 0.19 |
| T3: RDF as per AAU | 30.2 | 0.63 | 0.42 | 0.24 | 0.45 |
| T4: BMP | 30.8 | 0.64 | 0.43 | 0.24 | 0.46 |
| T5: FDP with 120% N + 100% PK | 41.2 | 0.69 | 0.60 | 0.51 | 0.97 |
| T6: FDP with 100% NPK | 41.4 | 0.74 | 0.59 | 0.44 | 0.81 |
| T7: FDP with 80% N + 100% PK | 42.3 | 0.83 | 0.58 | 0.36 | 0.67 |
| T8: FDP with 60% N + 100% PK | 36.9 | 0.92 | 0.46 | 0.26 | 0.46 |
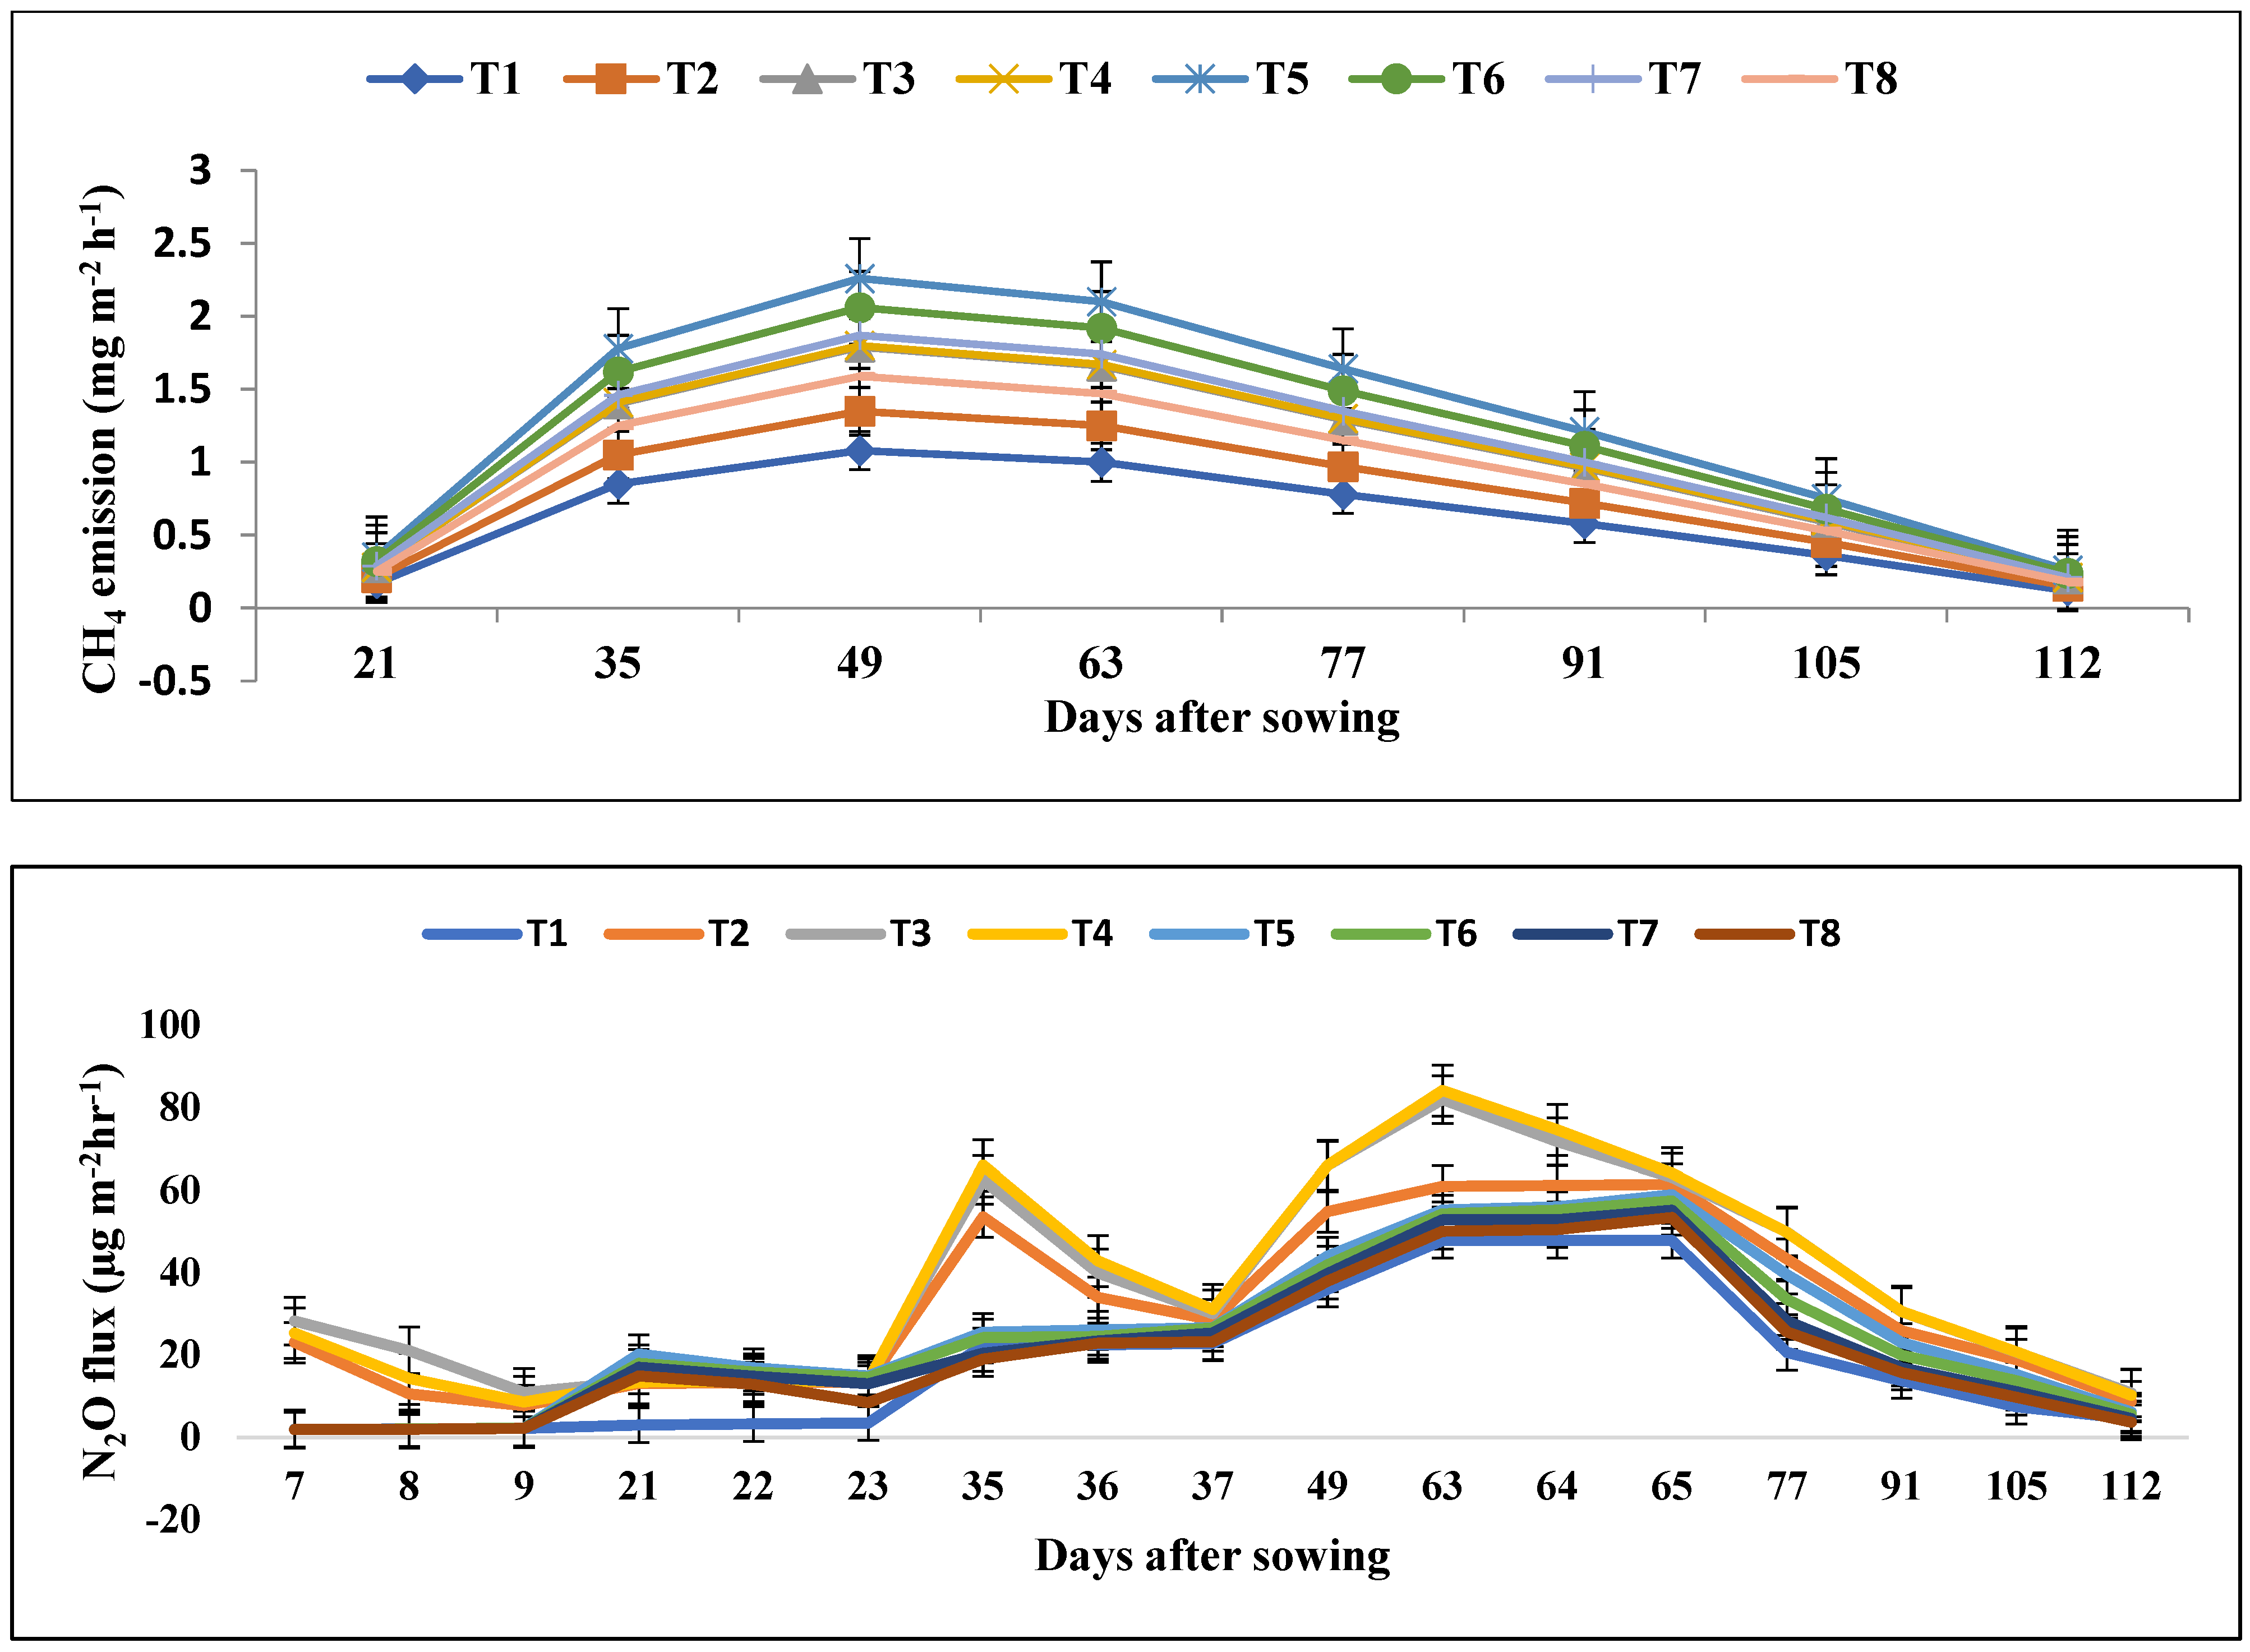
| Treatment | CH4 Emission (mg m−2 h−1) at | |||||||
|---|---|---|---|---|---|---|---|---|
| 21 DAS | 35 DAS | 49 DAS | 63 DAS | 77 DAS | 91 DAS | 105 DAS | 112 DAS | |
| T1: Control | 0.17 f | 0.85 g | 1.08 g | 1.00 g | 0.78 g | 0.58 f | 0.36 f | 0.12 f |
| T2: FP with 30-18.4-36 | 0.21 e | 1.05 f | 1.35 f | 1.25 f | 0.97 f | 0.72 e | 0.45 e | 0.15 e |
| T3: RDF as per AAU | 0.28 c | 1.40 d | 1.79 d | 1.66 d | 1.29 d | 0.96 c | 0.59 c | 0.20 c |
| T4: BMP | 0.28 c | 1.41 cd | 1.80 d | 1.67 d | 1.30 d | 0.97 c | 0.60 c | 0.21 c |
| T5: FDP with 120% N + 100% PK | 0.35 a | 1.78 a | 2.26 a | 2.10 a | 1.64 a | 1.21 a | 0.75 a | 0.26 a |
| T6: FDP with 100% NPK | 0.32 b | 1.62 b | 2.06 b | 1.92 b | 1.49 b | 1.11 b | 0.68 b | 0.24 b |
| T7: FDP with 80% N + 100% PK | 0.29 c | 1.46 c | 1.87 c | 1.74 c | 1.35 c | 1.00 c | 0.62 c | 0.21 c |
| T8: FDP with 60% N + 100% PK | 0.25 d | 1.25 e | 1.59 e | 1.47 e | 1.15 e | 0.85 d | 0.53 d | 0.18 d |
| Treatment (T) | * | * | * | * | * | * | * | * |
| Year (Y) | NS | * | * | * | * | * | NS | NS |
| Y * T interaction | NS | NS | NS | NS | NS | NS | NS | NS |
| Treatment | N2O Flux (µg m−2 h−1) at | ||||||||||||||||
|---|---|---|---|---|---|---|---|---|---|---|---|---|---|---|---|---|---|
| 7 DAS | 8 DAS | 9 DAS | 21 DAS | 22 DAS | 23 DAS | 35 DAS | 36 DAS | 37 DAS | 49 DAS | 63 DAS | 64 DAS | 65 DAS | 77 DAS | 91 DAS | 105 DAS | 112 DAS | |
| T1 | 1.89 d | 1.94 e | 2.12 f | 2.94 e | 3.24 e | 3.43 d | 22.25 f | 22.45 f | 22.75 f | 35.91 f | 47.76 e | 47.73 e | 47.78 h | 20.55 g | 13.69 g | 7.40 e | 4.45 d |
| T2 | 23.00 c | 10.51 c | 7.67 c | 13.01 d | 13.22 cd | 13.31 ab | 53.45 c | 33.95 c | 28.50 bc | 54.78 b | 60.87 b | 61.08 b | 61.38 c | 43.29 b | 25.83 b | 18.81 a | 8.69 b |
| T3 | 28.23 a | 20.96 a | 10.81 a | 13.58 cd | 13.90 cd | 14.00 ab | 62.44 b | 39.84 b | 29.95 ab | 65.84 a | 81.88 a | 71.68 a | 63.10 b | 49.79 a | 30.44 a | 20.65 a | 10.76 a |
| T4 | 25.28 b | 14.22 b | 8.56 b | 13.35 cd | 13.58 cd | 13.68 ab | 65.93 a | 42.75 a | 31.00 a | 65.85 a | 84.08 a | 74.49 a | 64.05 a | 49.70 a | 30.53 a | 20.73 a | 10.18 a |
| T5 | 1.94 d | 1.97 d | 2.17 d | 20.19 a | 16.84 a | 14.87 a | 25.46 d | 26.00 d | 26.60 cd | 43.95 c | 55.20 c | 55.94 c | 58.88 d | 39.44 c | 22.95 c | 15.19 b | 6.10 c |
| T6 | 1.90 d | 1.96 de | 2.17 d | 17.95 b | 15.79 ab | 14.49 ab | 24.22 e | 24.46 e | 26.51 cd | 41.85 d | 54.22 c | 55.08 c | 57.37 e | 33.45 d | 19.90 d | 13.71 bc | 5.52 c |
| T7 | 1.90 d | 1.95 de | 2.15 e | 16.94 b | 14.77 bc | 12.96 b | 20.41 g | 23.35 ef | 25.30 de | 39.73 e | 52.76 cd | 52.76 cd | 55.15 f | 28.18 e | 16.83 e | 11.04 cd | 4.49 d |
| T8 | 1.90 d | 1.94 e | 2.14 e | 14.84 c | 12.85 d | 8.36 c | 18.98 h | 22.83 f | 23.16 ef | 37.85 ef | 50.00 de | 50.39 de | 53.35 g | 25.54 f | 15.69 f | 9.66 de | 3.60 e |
| T | * | * | * | * | * | * | * | * | * | * | * | * | * | * | * | * | * |
| Y | * | * | * | * | * | * | * | NS | * | NS | * | * | * | * | * | * | * |
| Y * T | NS | NS | NS | NS | NS | NS | NS | NS | NS | NS | NS | NS | NS | NS | NS | NS | NS |
| Treatment | CH4 Emission (kg ha−1 Crop Cycle−1) | N2O Flux (kg ha−1 Crop Cycle−1) | GWP (kg eq CO2 ha−1) | CEE (kg ha−1) | GHGI (kg eq CO2 kg of GY−1) |
|---|---|---|---|---|---|
| T1: Control | 15.74 f | 0.502 g | 573.64 e | 156.45 e | 0.296 a |
| T2: FP with 30-18.4-36 | 19.65 e | 0.857 b | 777.11 d | 211.94 d | 0.295 a |
| T3: RDF as per AAU | 25.95 c | 1.004 a | 992.58 b | 270.70 b | 0.262 b |
| T4: BMP | 26.12 c | 1.010 a | 998.77 b | 272..39 b | 0.262 b |
| T5: FDP with 120% N + 100% PK | 32.84 a | 0.733 c | 1113.38 a | 303.65 a | 0.227 d |
| T6: FDP with 100% NPK | 29.98 b | 0.681 d | 1019.83 b | 278.14 b | 0.230 d |
| T7: FDP with 80% N + 100% PK | 27.14 c | 0.623 e | 924.72 c | 252.20 c | 0.232 cd |
| T8: FDP with 60% N + 100% PK | 23.03 d | 0.575 f | 797.20 d | 217.42 d | 0.242 c |
| Treatment (T) | * | * | * | * | * |
| Year (Y) | * | NS | * | * | NS |
| Y * T interaction | NS | NS | NS | NS | NS |
Disclaimer/Publisher’s Note: The statements, opinions and data contained in all publications are solely those of the individual author(s) and contributor(s) and not of MDPI and/or the editor(s). MDPI and/or the editor(s) disclaim responsibility for any injury to people or property resulting from any ideas, methods, instructions or products referred to in the content. |
© 2024 by the authors. Licensee MDPI, Basel, Switzerland. This article is an open access article distributed under the terms and conditions of the Creative Commons Attribution (CC BY) license (https://creativecommons.org/licenses/by/4.0/).
Share and Cite
Naveen, J.; Kurmi, K.; Saikia, M.; Pathak, K.; Kumar, V.; Borgohain, R.; Srivastava, A.K.; Khandai, S.; Peramaiyan, P.; Kumar, V.; et al. Evaluating the Effects of Fertilizer Deep Placement on Greenhouse Gas Emissions and Nutrient Use Efficiency in Wet Direct-Seeded Rice During the Wet Season in Assam, India. Agriculture 2024, 14, 2061. https://doi.org/10.3390/agriculture14112061
Naveen J, Kurmi K, Saikia M, Pathak K, Kumar V, Borgohain R, Srivastava AK, Khandai S, Peramaiyan P, Kumar V, et al. Evaluating the Effects of Fertilizer Deep Placement on Greenhouse Gas Emissions and Nutrient Use Efficiency in Wet Direct-Seeded Rice During the Wet Season in Assam, India. Agriculture. 2024; 14(11):2061. https://doi.org/10.3390/agriculture14112061
Chicago/Turabian StyleNaveen, Jami, Khagen Kurmi, Mrinal Saikia, Kalyan Pathak, Virendar Kumar, Rupam Borgohain, Ashish K. Srivastava, Suryakanta Khandai, Panneerselvam Peramaiyan, Vivek Kumar, and et al. 2024. "Evaluating the Effects of Fertilizer Deep Placement on Greenhouse Gas Emissions and Nutrient Use Efficiency in Wet Direct-Seeded Rice During the Wet Season in Assam, India" Agriculture 14, no. 11: 2061. https://doi.org/10.3390/agriculture14112061
APA StyleNaveen, J., Kurmi, K., Saikia, M., Pathak, K., Kumar, V., Borgohain, R., Srivastava, A. K., Khandai, S., Peramaiyan, P., Kumar, V., Sarmah, M., Gogoi, B., Singh, K., Singh, S., Kundu, S., Teja, K. S., & Sekhar, G. (2024). Evaluating the Effects of Fertilizer Deep Placement on Greenhouse Gas Emissions and Nutrient Use Efficiency in Wet Direct-Seeded Rice During the Wet Season in Assam, India. Agriculture, 14(11), 2061. https://doi.org/10.3390/agriculture14112061