Article

Nitrogen and Carbon Mineralization from Organic Amendments and Fertilizers Using Incubations with Sandy Soils

Department of Soil, Water, and Ecosystem Sciences, University of Florida, Gainesville, FL 32611, USA
*
Author to whom correspondence should be addressed.
Current address: Indian River Research and Education Center, University of Florida, Fort Pierce, FL 34945-3138, USA.
Current address: School of Forest, Fisheries, & Geomatics Sciences & School of Natural Resources and Environment, University of Florida, Gainesville, FL 32611, USA.
§
Current address: Quality Certification Services, Gainesville, FL 32611, USA.
Agriculture 2024, 14(11), 2009; https://doi.org/10.3390/agriculture14112009
Submission received: 8 October 2024 / Revised: 7 November 2024 / Accepted: 7 November 2024 / Published: 8 November 2024
(This article belongs to the Special Issue Integrated Management and Efficient Use of Nutrients in Crop Systems)

Abstract

:
Synthetic fertilizers are the main nitrogen (N) input used in specialty crop systems established on sandy soils of Florida, although organic amendments and fertilizers can be used as a substitute. Organic N contained in these products must be mineralized before crop uptake, which is affected by amendment properties, soil properties, and temperature. A better method for predicting N release can help maximize the nutrient cycling benefits of organic amendments and fertilizers while avoiding negative environmental impacts. The main objective of this study was to measure N release and CO2 emissions from two poultry manure-based amendments (PMA) and two processed organic fertilizers (OF) made from livestock byproducts (e.g., feather meal). We conducted an 8-week incubation using two sandy Florida soils belonging to two soil orders (Entisol and Spodosol) and with a greater than two-fold difference in soil organic C. We incubated these soils at 10 °C, 17 °C, 24 °C, and 30 °C, measured plant-available N at 0, 1, 4, and 8 weeks, and measured CO2 emissions weekly. In both soils, OF released more inorganic N and at a faster rate compared with PMA, but CO2 emissions were greater from PMA than OF. Nitrogen mineralization and CO2 emissions increased with temperature, but temperature effects were less important than expected. These results on the mineralization of PMA and OF in sandy soils are key to optimize their use and management in Florida and other areas dominated by sandy soils.

1. Introduction

Synthetic fertilizers currently dominate nitrogen (N) inputs in agriculture, as they allow for a better control in the amount and concentration of nutrients being applied, which helps synchronize N release with crop demand [1]. Synthetic fertilizers are also typically more affordable and convenient to use than amendments because of their higher nutrient concentrations [1]. However, heavy usage of synthetic fertilizers can result in environmental issues like N leaching (mostly as nitrate—NO3) and nitrous oxide emissions [2], making alternative nutrient inputs like organic amendments and fertilizers attractive.
Organic amendments are commonly used to provide nutrients to crops and reduce the reliance on synthetic fertilizers [3], and they also improve soil health by increasing soil organic matter (SOM), which benefits other soil properties like cation exchange capacity (CEC), bulk density, and water infiltration and retention [4]. Unlike synthetic fertilizers however, amendments mostly contain organic N that must be transformed into plant-available N (PAN) via mineralization, which converts organic N into plant-available ammonium (NH4+) [5,6], and subsequent nitrification that converts NH4+ into NO3 in well-aerated soils [7]. Both processes are affected by several factors, including soil texture, temperature, and moisture [8,9]. For example, both mineralization and nitrification rates are usually greater at higher soil temperatures and intermediate soil moisture that allows for sufficient microbial growth while avoiding anoxia due to water-logging [10].
Nitrogen mineralization is closely tied to carbon (C) cycling, and a critical indicator of this interaction is the C:N ratio [11]. The C:N ratio is a good predictor of whether N mineralization or immobilization can be expected after additions of organic material [12,13], indicating if the N applied with amendments will be available to plants after application. A C:N ratio of 20:1 [14] or 16:1 [13,15] is often considered to be the cutoff below which mineralization is favored, resulting in a net supply of N to crops. In contrast, higher C:N ratios (especially >25:1) indicate that N immobilization is likely, with a reduction of soil PAN after application, resulting in insufficient N supplied to crops [14,16].
The feedstock and processing methods used to produce amendments will influence nutrient and C concentrations, the C:N ratio, and ultimately the fate of N after application. Poultry manure is a commonly used feedstock that can be used raw, transformed by composting or heat treatment, deodorized with microbial and/or mineral preparations, or charred by pyrolysis, and this will affect how it contributes to N cycling and soil health after application [5,17]. On the other hand, organic fertilizers are manufactured from nutrient-rich livestock processing byproducts (e.g., blood meal, feather meal), resulting in low C:N ratios and a more rapid and predictable N release than traditional amendments [15]. Despite this, it can be difficult to predict the optimal rate of organic amendment or fertilizer needed, as soil background N will affect N mineralization and other N cycling processes (e.g., volatilization), affecting the capacity of plants to take up N. This can lead to under- or over-application of N, with potential yield reductions and environmental impacts, respectively [18]. Managing N fertility is especially challenging when crops require a large amount of N in a short period of time [19], as both the magnitude and timing of N release from organic sources must match crop demand.
The management of organic amendments and fertilizers is further complicated in the southeastern US due to its challenging soil and climate conditions, with sandy soils low in C and a subtropical climate [20,21,22]. These conditions favor leaching losses [23], and sandy soils also favor N mineralization compared with finer textured soils [9,20]. Furthermore, the mineralization of organic amendments and fertilizers will be affected by environmental conditions (e.g., soil temperature) [8]. Hence, understanding how changes in temperature affect mineralization rates of different amendments in a diversity of soils is critical, so that crops are supplied with sufficient N while avoiding excessive inputs that promote losses [9]. In Florida, monthly averages for soil temperatures can be as low as 10 °C in the northwest whereas maximum soil temperatures of 30 °C are recorded throughout the state during summer months, with an average around 24 °C being typical of north central Florida [24]. Hence, determining how these changes in temperature affect N mineralization is important, to adjust management accordingly.
The main objective of this study was to measure the mineralization of two poultry-manure-based organic amendments (PMA) made from a mixture of poultry litters (broilers and layers) and two organic protein-based fertilizers (OF) when incubated in two Florida soils across four temperatures that are representative of temperature variability in Florida. The soils used in this study were both >95% sand but belonged to two soil orders (Entisol, Spodosol) and had a more than two-fold difference in soil total C, providing a range of soil conditions that allowed for the application of our results to other areas with sandy soils. We hypothesized that due to their higher C:N ratio, PMA would release inorganic N more slowly compared with OF, with greater release from heat-treated as opposed to biocharred poultry manure.

2. Materials and Methods

2.1. Experimental Design

We used two soils for this experiment, both collected in early 2021 (Table 1). The first soil was sampled from inter-rows of a grass cover crop at the University of Florida/IFAS Plant Science Research and Education Unit located in Citra (29°24′37″ N 82°08′49″ W), and is mapped as a Candler soil (hyperthermic, uncoated Lamellic Quartzipsamments in the US classification [25]; Arenosol in the FAO classification [26]). The second soil was collected from a citrus orchard at the Southwest Florida Research and Education Center located in Immokalee (26°27′47″ N 81°26′39″ W), and it is mapped as an Immokalee soil (sandy, silicious, hyperthermic Arenic Alaquod in the US classification [25]; Podzol in the FAO classification [26]). Both soils were taken from a depth of 0–20 cm, air-dried, and sieved to 2 mm before incubations. Soils were analyzed for macronutrients, with Mehlich-3 extractions (the standard soil extract in Florida, consisting of acetic acid, ammonium nitrate, ammonium fluoride, nitric acid, and EDTA) and quantification by inductively coupled plasma—optical emission spectrometry (ICP-OES) with an Agilent 5110 ICP-OES spectrometer (Agilent, Santa Clara, CA, USA) and soil pH (1:1 soil:water) at Waters Agricultural Laboratories, Inc. (Camilla, GA, USA). Soil texture was measured by laser diffraction using a Beckman Coulter LS-13320 multi-wave particle size analyzer (Beckman-Coulter, Brea, CA, USA) at the Environmental Pedology and Land Use Laboratory (Gainesville, FL, USA). Finally, total C and N were determined by combustion using a Costech ECS 4010 CHNS elemental analyzer (Costech Analytical Technologies, Valencia, CA, USA) at the Stable Isotope Mass Spectrometry Laboratory (Gainesville, FL, USA).
Four amendments were used in this experiment: two organic protein-based fertilizers (OF) and two poultry manure-based amendments (PMA) made from a mixture of poultry litters (broilers and layers) (Table 2). The OF were Nature SafeTM 10-2-8 and 13-0-0 (Darling Ingredients, Irving, TX, USA), both made from feather meal, meat meal, and blood meal; the 10-2-8 also contained potassium sulfate and bone meal. The PMA consisted of heat-treated poultry manure from Everlizer 3-3-3 (Everlizer, Live Oak, FL, USA) and poultry manure biochar from Frye (Frye LLC, Wardensville, WV, USA). Amendment properties were determined via combustion (for total C and N) and acid digestion followed by ICP-OES (for P and K) at AgroLab Inc. (Harrington, DE, USA). The same properties were determined with the same methods for fertilizers at Waters Agricultural Laboratories, Inc. (Camilla, GA, USA).
Before the experiment began, the OF and PMA were each hand mixed in the two soils, creating large homogeneous batches that had a final weight of 1000 g each. These batches included the fresh amendment and dry soil, with amendments added at rates of 13.2 g (Everlizer), 13.9 g (Frye), 1.24 g (Nature Safe 10-2-8), and 0.944 g (Nature Safe 13-0-0) per 1000 g of soil. These input rates were computed to represent an input of 196 kg N ha−1 mixed in the first 15 cm of the soil, assuming a bulk density of 1.5 g cm−3 and a percent of plant-available N (PAN) corresponding to 23% (Frye), 24% (Everlizer), or 75% (fertilizers). These PAN estimates were determined by an external laboratory for Everlizer and Frye (AgroLab Inc., Harrington, DE, USA) or based on past research in Florida for Nature Safe fertilizers [27]. After mixing each batch, 176 g of re-distilled water was added to reach a gravimetric moisture content of 15%. For the unamended control sample of each soil, only 176 g of re-distilled water was added to the 1000 g of soil.
From each large batch, duplicate subsamples were taken and analyzed to measure initial N concentrations, which are denoted as “Day 0”. Then, from each 1000 g batch of soil-amendment combination, two sets of three 150 g samples were taken, and each set was incubated in temperature-controlled incubators at 10 °C and 17 °C for eight weeks in the summer of 2021. The same process was then repeated for incubations at 24 °C and 30 °C in the fall of 2021. Incubation temperatures were chosen as the lowest average monthly soil temperature in the state of Florida (10 °C), the annual average soil temperature at Citra (24 °C), and the highest monthly soil temperature at Citra and Immokalee (30 °C); 17 °C was chosen as the midpoint between 10 °C and 24 °C.
Each 150 g sample of soil mixed with fertilizer or amendment was added to a polyethylene sample cup, packed down to 100 cm−3, sealed in a 1000 cm−3 jar with a 20 cm−3 plastic vial containing re-distilled water (to preserve moisture in the jar), and with a 20 cm−3 vial of 2 M NaOH to capture carbon dioxide (CO2) emissions during the 8-week incubation period. Vials with NaOH were changed weekly to quantify CO2 emissions. The volume of 2 M NaOH in the vial was reduced to 15 cm−3 (weeks 1 and 2), 10 cm−3 (weeks 3 to 5), and 7.5 cm−3 (weeks 6 to 8), as CO2 emissions decreased during the incubation.

2.2. Soil N Analyses

From the 150 g samples being incubated, 5 g of soil was sampled at days 7, 28, and 56, extracted with 25 cm−3 of 2 M KCl, shaken for 30 min, centrifuged at 3500 rpm, and filtered through a Fisherbrand Q2 filter. Soil extracts were measured for ammonium (NH4+-N) and nitrate (NO3-N) nitrogen concentrations through colorimetry using an Epoch 2 microplate reader (Biotek, Winooski, VT, USA) [7].

2.3. CO2 Emissions

To measure CO2 emissions, vials of 2 M NaOH were removed weekly from each mason jar, immediately capped, and the liquid from the vial was titrated. The NaOH was placed in a beaker and constantly stirred with a stir bar; 3 cm−3 of 1.5 M BaCl2 and three drops of phenolphthalein color indicator were added, and 1M HCl was gradually added with a burette until the solution turned from pink to clear. The volume of HCl added to the solution was used to calculate CO2-C release, based on Franzluebbers’ equation [28]:
CO2-C (mg kg−1 soil) = (cm−3 [blank] − cm−3 [sample]) × N × M/S
In this equation, N = normality of the HCl, M = mass conversion of cmolc to g C with a conversion factor of 6000, and S = soil carbon measured in soils (mg g−1). For the latter, this was either soil C measured before the incubation for unamended controls, or the sum of soil C measured before the incubation and C inputs for amended treatments. The blank was taken weekly throughout the incubation and its value was used to correct for the control. This equation was used to calculate both emissions on each week and cumulative C emissions (mg C-CO2 g−1 C added) during the entire incubation, which was calculated for each replicate of a given soil-amendment-temperature combination.

2.4. Data Analyses

Soil inorganic N concentrations were analyzed both in mg kg−1 and net mg kg−1, where net mg kg−1 was calculated by subtracting the concentrations measured in the control jars from inorganic N concentrations measured for each treatment at each time point. The percent of N inputs released as net soil inorganic N was also computed, where the final soil N concentrations measured at day 56 were divided by the total N added with each amendment (Table 2), expressed in mg kg−1, after soil N concentrations from the control were removed.
Inorganic N release and net inorganic N release datasets were analyzed using a three-way ANOVA with a linear model where time was treated as a repeated measure and amendments and temperatures were treated as fixed effects. This three-way ANOVA analysis was carried out separately for Citra and Immokalee soils.
CO2-C emissions were analyzed as cumulative emissions after 8 weeks. A two-way ANOVA linear model was used, with separate ANOVAs for Citra and Immokalee soils.
All data were analyzed with R version 4.3.2 [29]. Residuals for each of the datasets were tested for normality and were square-root transformed when needed. For all ANOVAs, a Tukey HSD post hoc analysis was used with the “emmeans” function to calculate the estimated marginal means for all levels of each treatment as a factor, considering temperature as the grouping variable, and using the “pairwise” function to compare the estimated marginal means. Differences among treatments were assigned different letters with the “cld” function, and results were considered significant at the α = 0.05 level.

3. Results

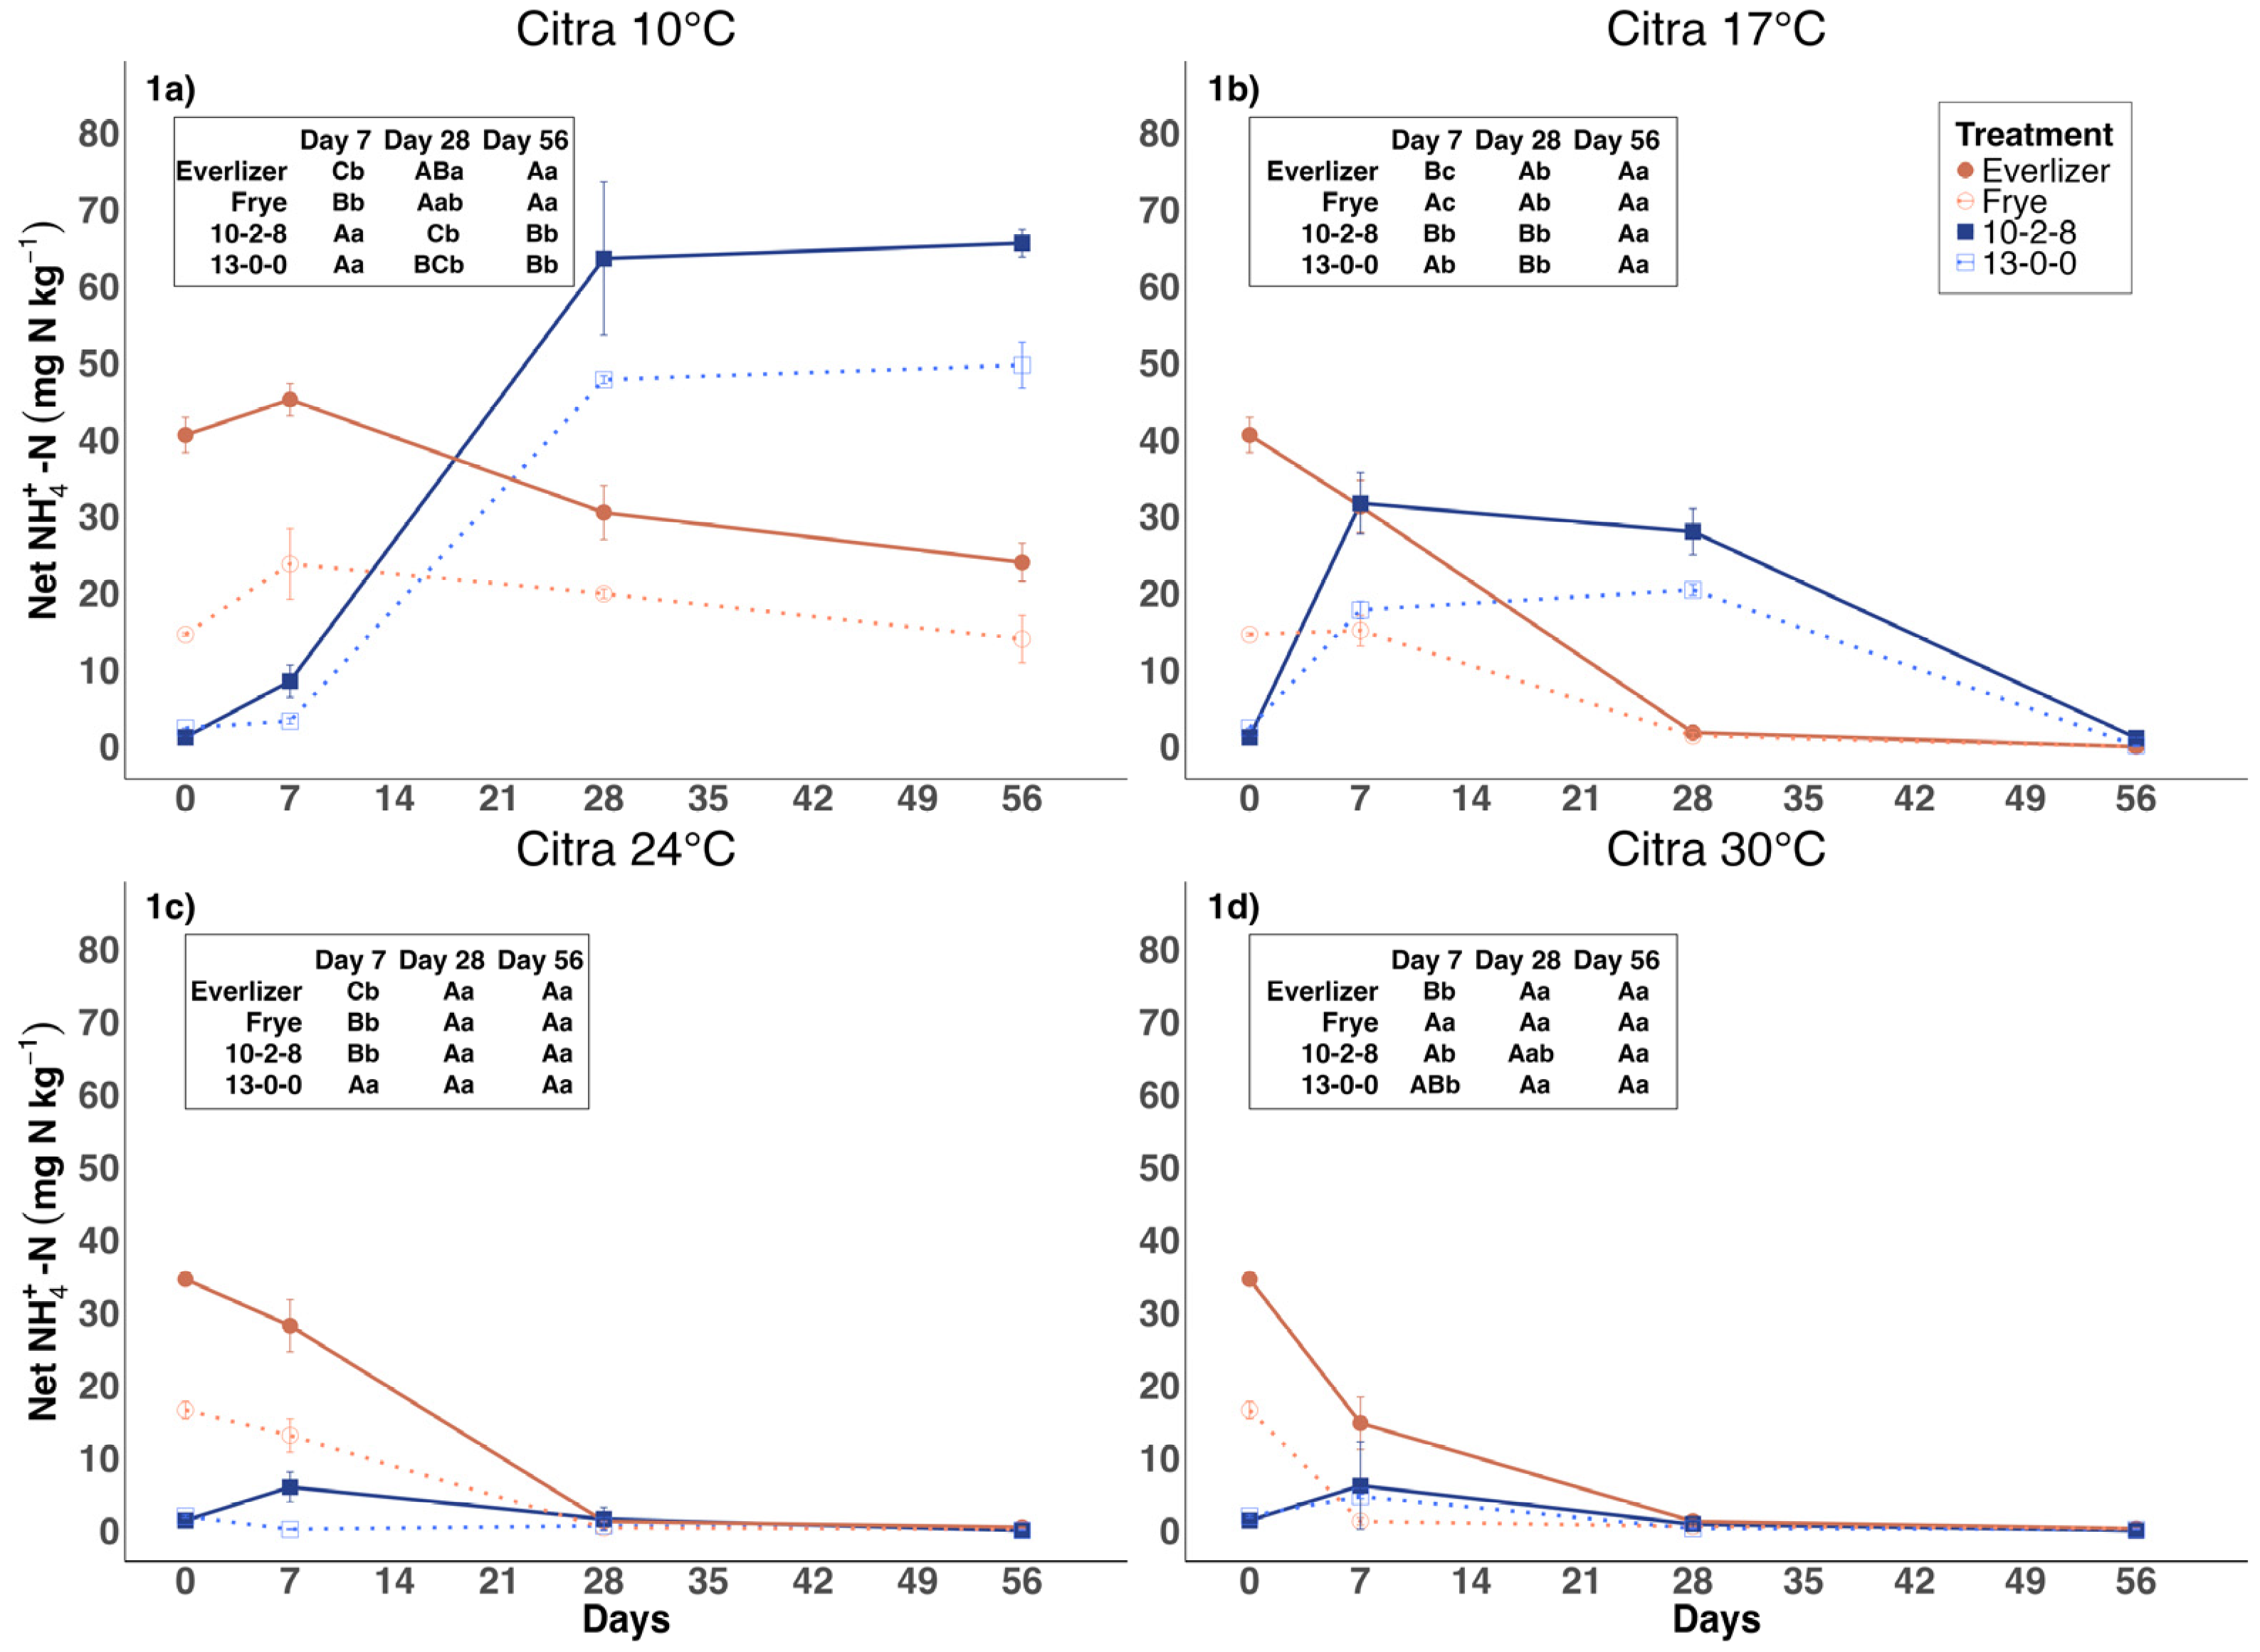
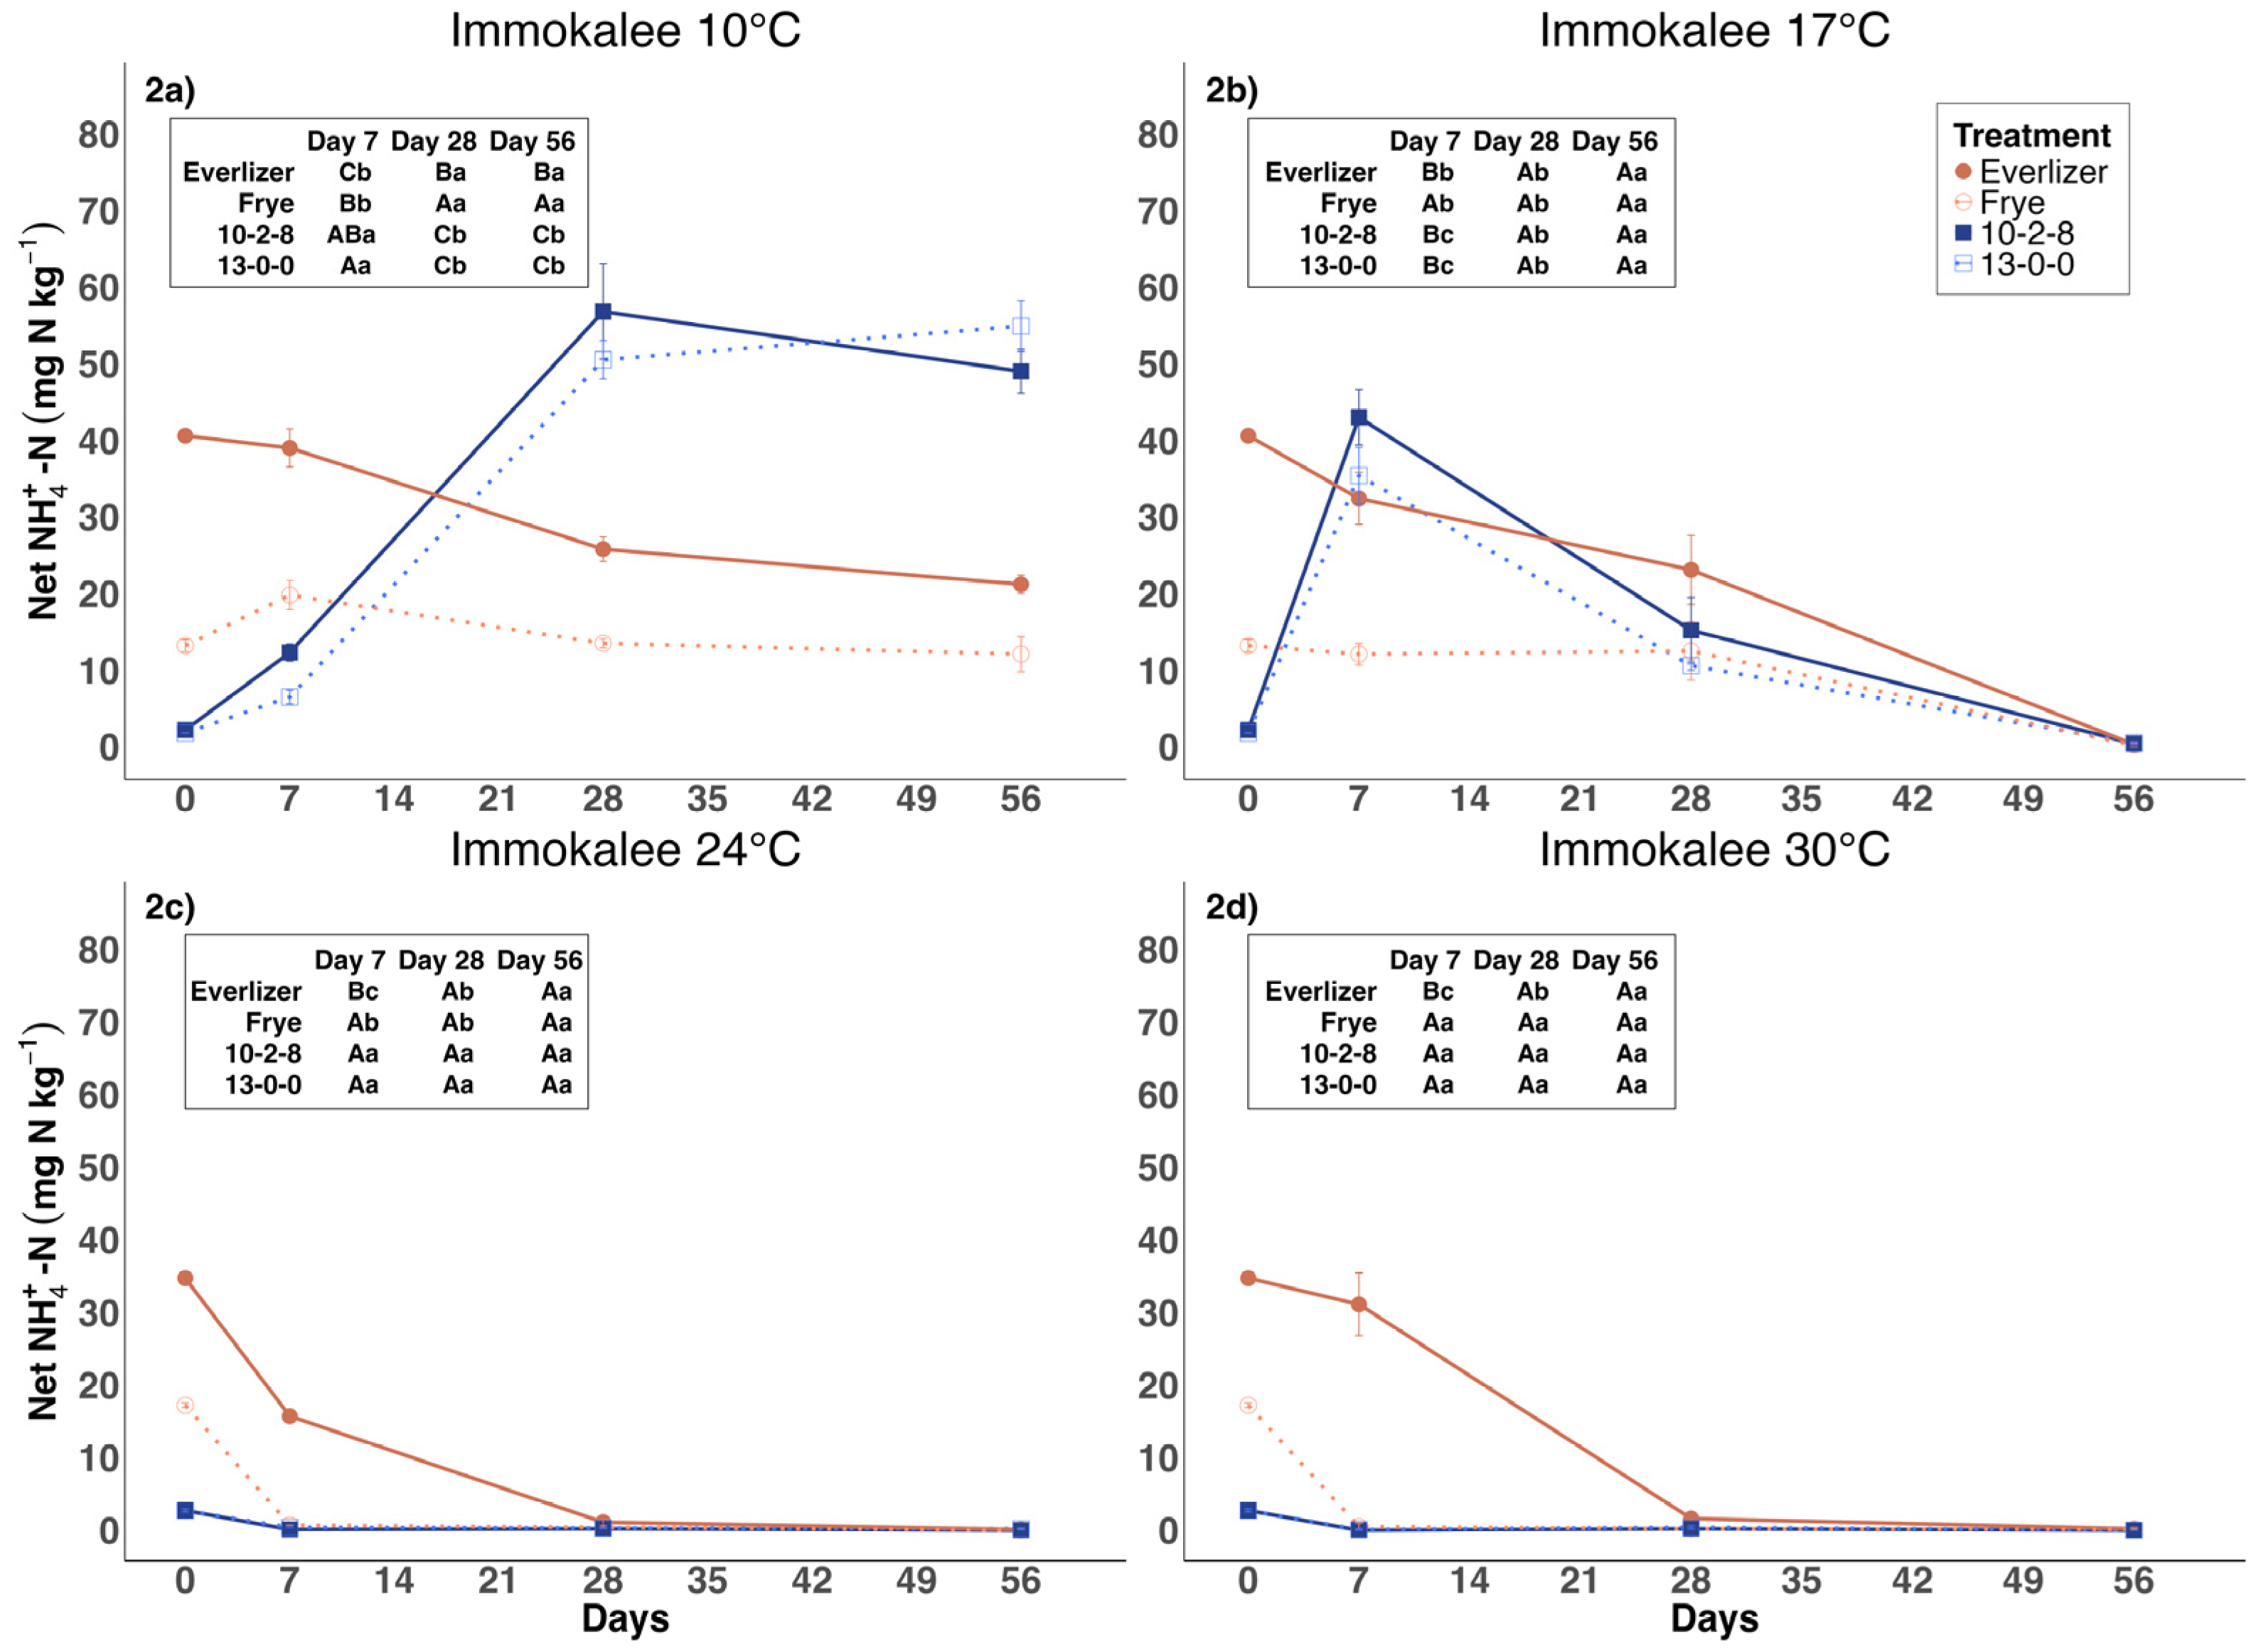
3.1. Ammonium Nitrogen

Unamended soils had low NH4+-N concentrations at all temperatures throughout the incubation (Figures S1 and S2), hence only net patterns of NH4+-N concentrations are discussed for amended soils (Figure 1 and Figure 2). For incubations with Everlizer, initial soil concentrations were about 40 mg N kg−1 at the beginning of incubations in both soils, and declined to 0 mg N kg−1 at all temperatures except 10 °C (where final concentrations were 20 to 30 mg N kg−1) with a quicker decline at 24 °C and 30 °C than at 17 °C. A similar pattern was observed for Frye, although with lower concentrations and with similar initial and final concentrations at 10 °C. In contrast, soil NH4+-N concentrations remained low for incubations at 24 °C and 30 °C for both OF in both soils. At 10 °C, concentrations increased and then stabilized between 50 and 70 mg NH4+-N, whereas they increased to about 35 mg NH4+-N and then declined to 0 mg N kg−1 at 17 °C.
There was no significant difference in soil NH4+-N between the two OF, except for greater soil NH4+-N with 10-2-8 than 13-0-0 at 7 days for 17 °C and 24 °C in the Citra soil (Figure 1); there was no difference between OF in the Immokalee soil (Figure 2). In contrast, soil NH4+-N concentrations with Everlizer were significantly greater than Frye after 7 days, but soil NH4+-N concentrations were similar between the two PMA after 56 days, except for Immokalee at 10 °C. In addition, soils amended with Everlizer had greater soil NH4+-N concentrations than OF after 7 days at 10 °C and 24 °C in both soils (and at 30 °C for Immokalee), whereas OF had greater soil NH4+-N concentrations than PMA at 10 °C after 56 days.

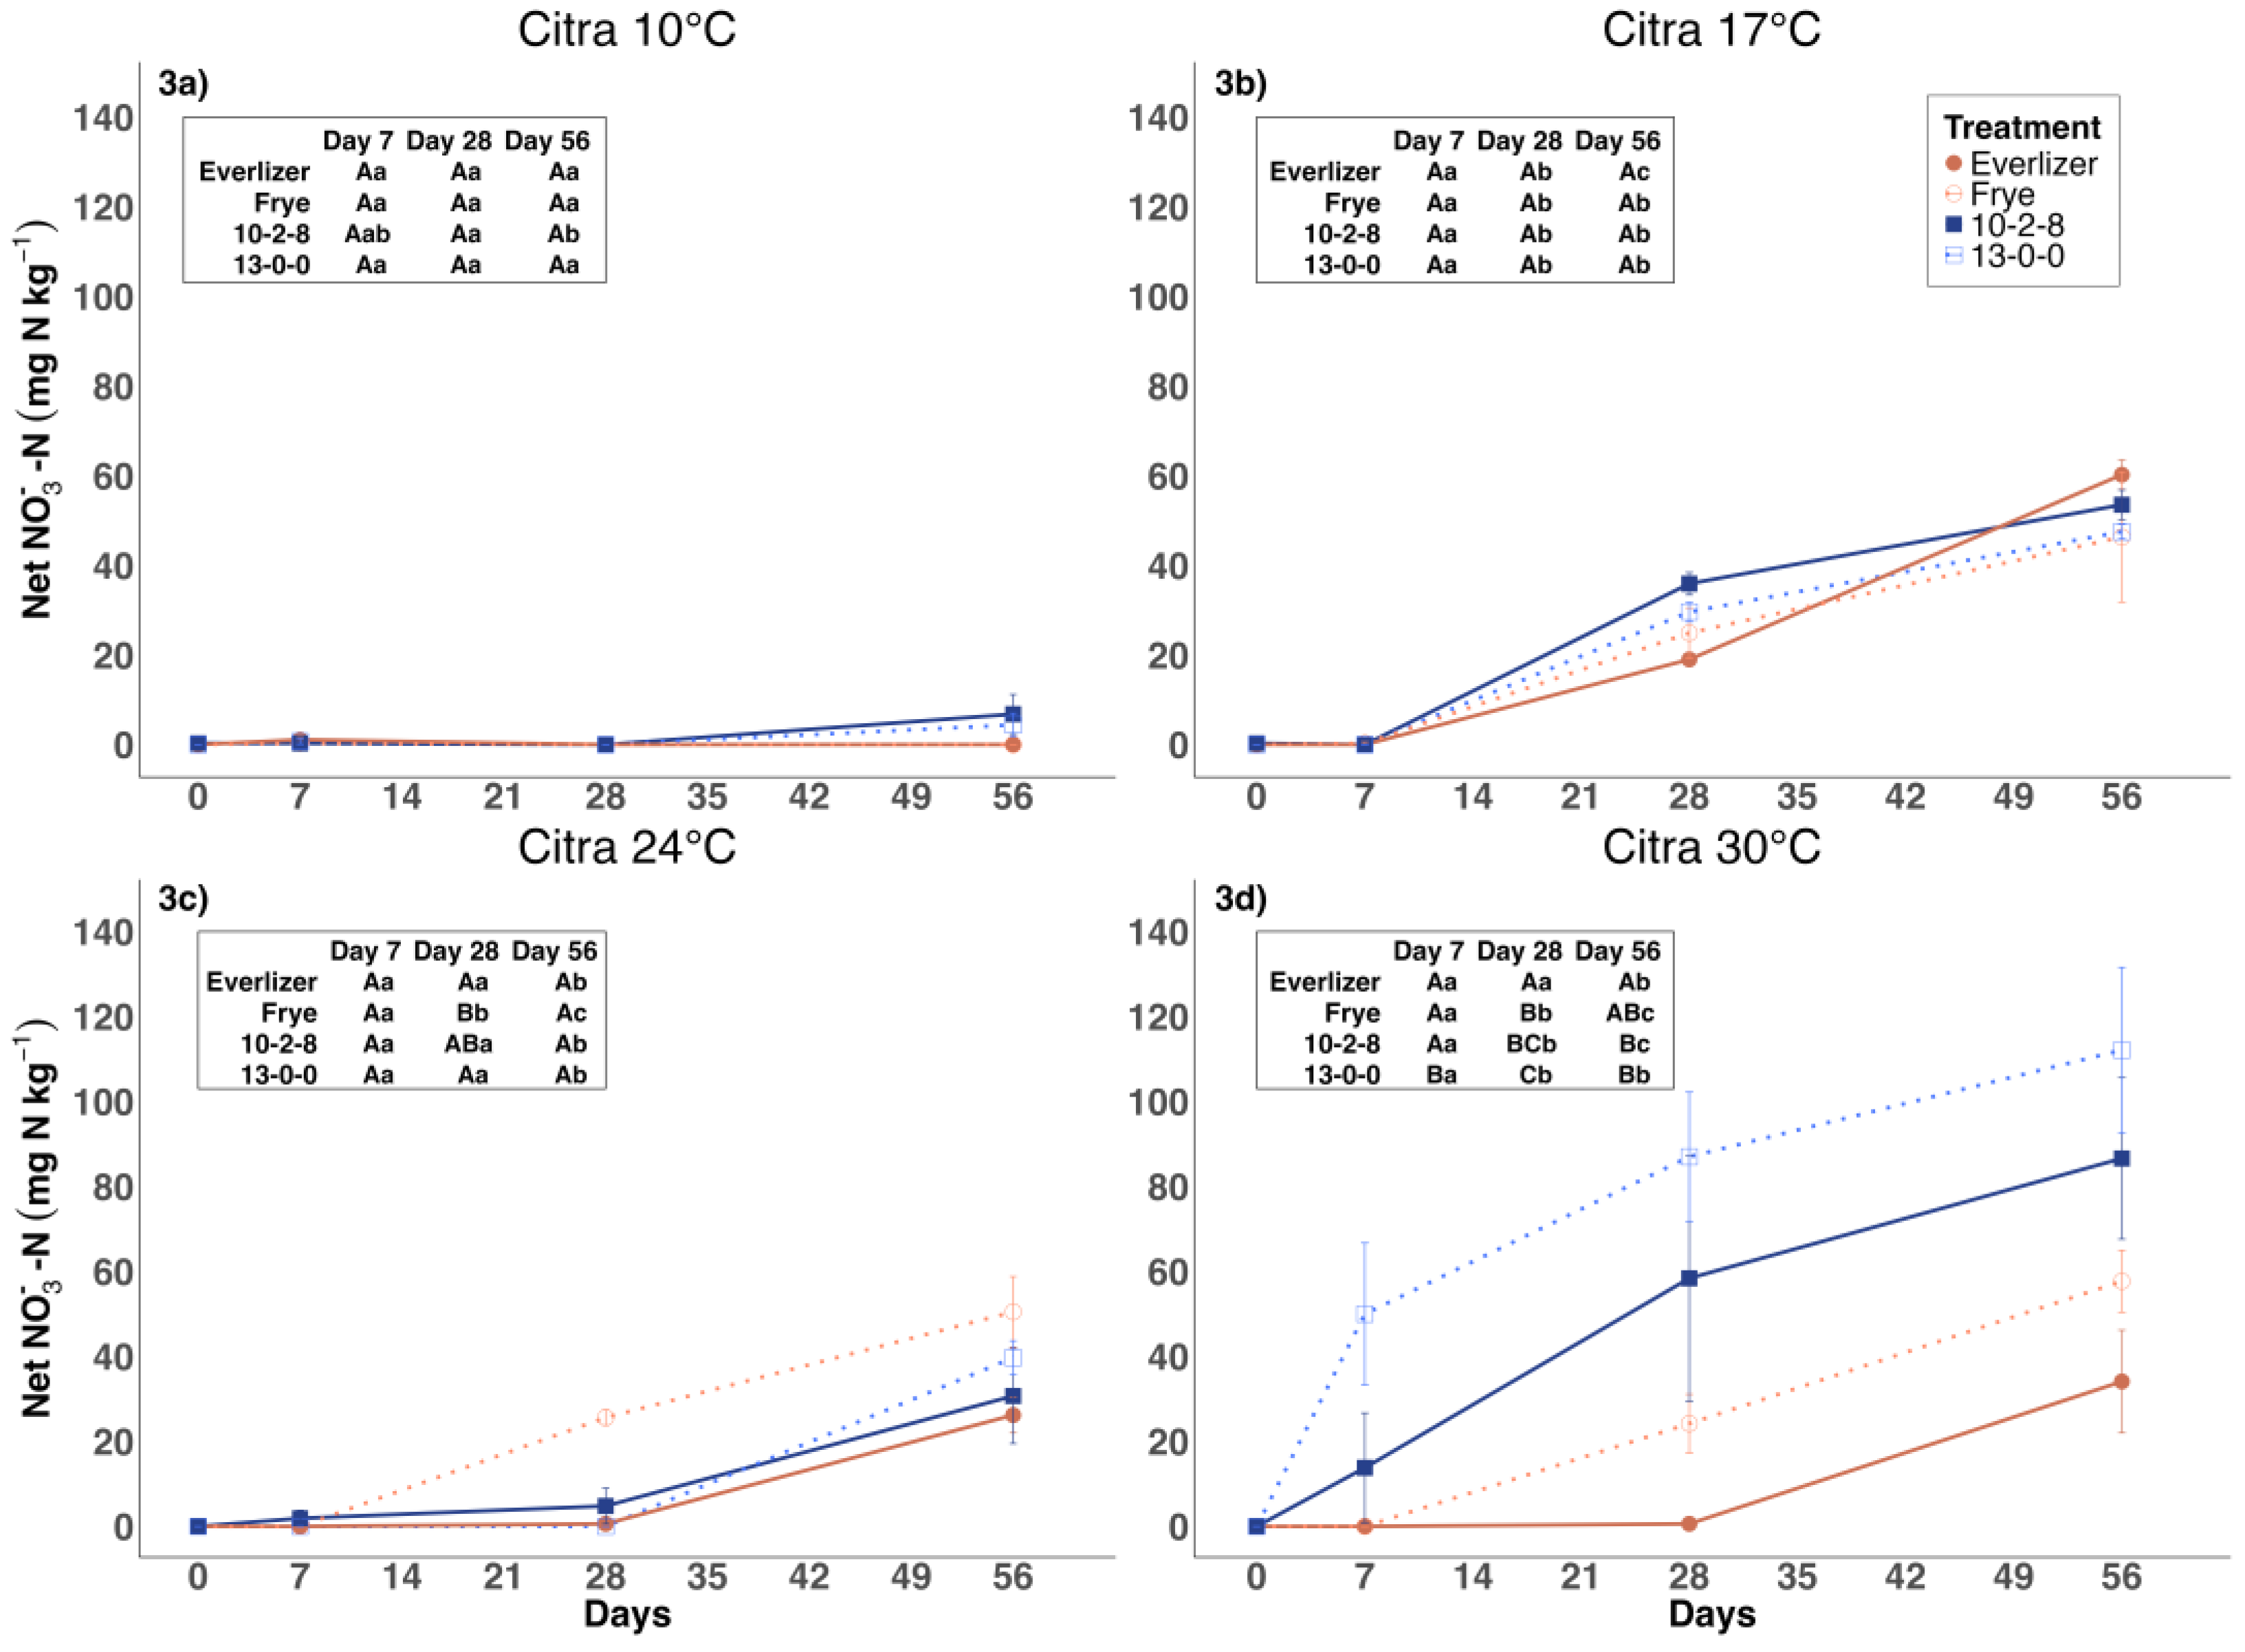
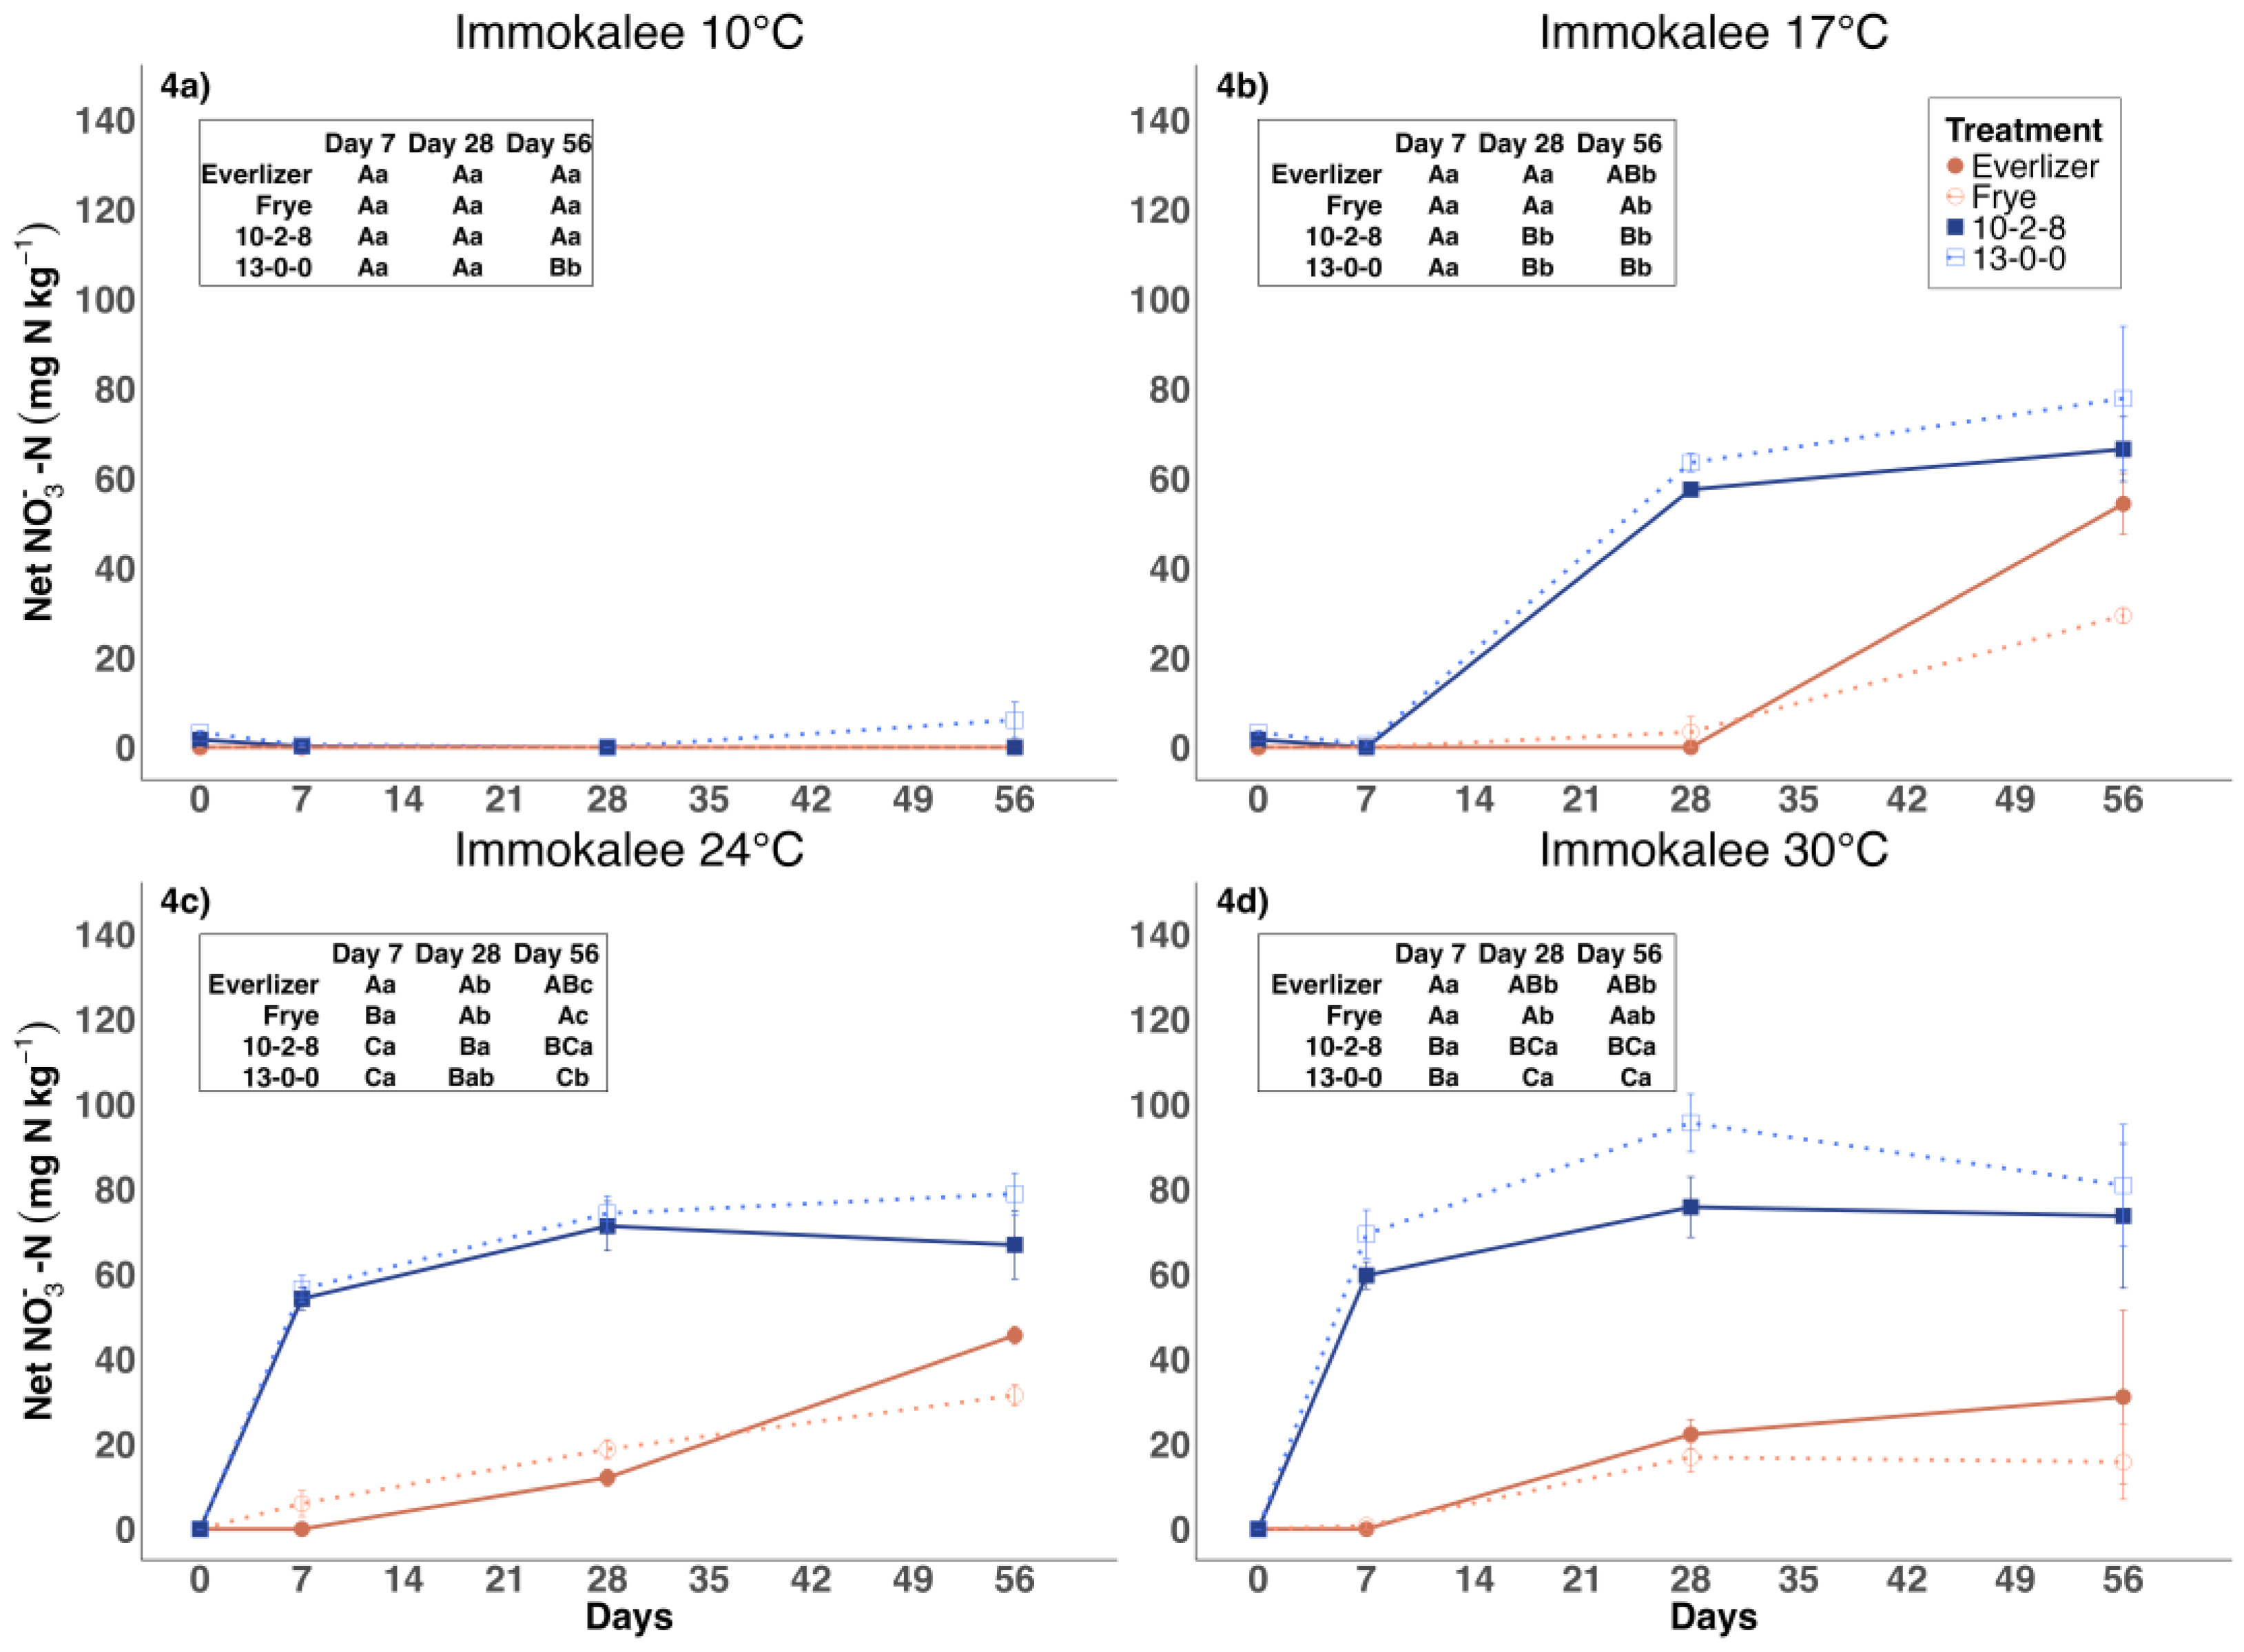
3.2. Nitrate Nitrogen

Unlike for NH4+-N, soil NO3-N concentrations increased in unamended soils during the incubation (Figures S3 and S4). For the unamended Citra soil, there was limited NO3-N accumulation at 10 °C and 17 °C, but after 56 days, there was 10 mg N kg−1 at 24 °C and 25 mg N kg−1 at 30 °C. For the unamended Immokalee soil, there was limited soil NO3-N accumulation at 10 °C, but concentrations of 20, 60, and 140 mg N kg−1 at 17 °C, 24 °C, and 30 °C, respectively, after 56 days, resulting in important differences in soil NO3-N concentration when computing net values.
In the Citra soil, there was a steady increase in net NO3-N concentrations through time for all amendments at all temperatures (except 10 °C) with no plateau, and final net NO3-N concentrations were largest at 30 °C (Figure 3). After 56 days, there was no difference in net NO3-N concentrations among PMA and OF at 10 °C (all <10 mg N kg−1), 17 °C (all about 60 mg N kg−1), and 24 °C (all between 30 and 50 mg N kg−1), whereas at 30 °C net NO3-N concentrations were higher with OF (between 80 and 110 mg N kg−1) than with Everlizer (30 mg N kg−1).
A similar pattern was observed in the Immokalee soil, as there was an increase in net NO3-N concentrations through time for all amendments at all temperatures except 10 °C, with no striking difference among 17 °C, 24 °C, and 30 °C (Figure 4). In contrast to the Citra soil, there was a plateau observed at 24 °C and 30 °C (and at 17 °C, to a lesser extent) for both OF. In addition, 13-0-0 had the greatest net NO3-N concentrations after 56 days at 17 °C, 24 °C, and 30 °C (about 80 mg N kg−1), whereas 10-2-8 (between 60 and 70 mg N kg−1) was greater than Frye (between 20 and 30 mg N kg−1) at 17 °C, 24 °C and 30 °C, but never greater than Everlizer (between 30 and 60 mg N kg−1).

3.3. Inorganic Nitrogen

Soil inorganic N (i.e., NO3-N + NH4+-N) accumulation after 56 days was mostly driven by NH4+-N at 10 °C vs. NO3-N at 24 °C and 30 °C, although variations in soil inorganic N through time were affected by both N forms (Figure 5 and Figure 6, Figures S5 and S6). For unamended Citra control soils, there was limited inorganic N accumulation at 10 °C, 17 °C, and 24 °C, with a steady but small accumulation through time at 30 °C (20 mg N kg−1). In contrast, soil inorganic N accumulation was more important at 24 °C (60 mg N kg−1) and 30 °C (140 mg N kg−1) in unamended Immokalee soils, but small at 10 °C and 17 °C.
In the Citra soil, net soil inorganic N steadily increased with time for both OF, with higher final concentrations at 30 °C than at lower temperatures, and no difference between the two OF (Figure 5). Soil inorganic N decreased with Everlizer between 0 and 28 days, then subsequently increased after 28 days, except at 10 °C when it continued to decline. Soils amended with Frye also had a reduction in soil inorganic N after 7 days at 24 °C and 30 °C, then soil inorganic N increased after 28 days. PMA had significantly lower soil inorganic N than OF after 56 days at 10 °C.
For the Immokalee soil, net soil inorganic N initially increased and then plateaued for both OF at all temperatures, although the plateau was reached quicker at 30 °C than at 10 °C and 17 °C (Figure 6). Like the Citra soil, soil inorganic N decreased between 0 and 28 days for all soils incubated with Everlizer, then concentrations increased again by 56 days, except at 10 °C. For Frye-incubated soils, the decrease occurred at 7 days and only at 24 °C and 30 °C, with a subsequent increase by 56 days. Soil incubated with OF had higher net soil inorganic N than PMA after 56 days at 10 °C and 24 °C, whereas at 17 °C both OF were not different from Everlizer and at 30 °C only 13-0-0 was greater than both PMA.
In the Citra soil, the percentage of N inputs released as net soil inorganic N after 56 days was numerically lower for PMA than OF at all temperatures, although the difference between 13-0-0 and Everlizer at 10 °C and between 10-2-8 and Frye at 30 °C was not significant (Table 3). In addition, there was no significant differences among OF and PMA at 17 °C and 24 °C. Furthermore, there was no consistent response to changes in temperature, except that the percentage of N inputs released as soil inorganic N was highest at 30 °C for both OF and Frye.
In the Immokalee soil, the percentage of N inputs released as net soil inorganic N increased with temperature for both OF, being highest at 30 °C, whereas for PMA it peaked at 17 °C for Everlizer or 17 °C and 24 °C for Frye (Table 3). There was a greater percentage of N inputs released as net soil inorganic N for OF relative to Everlizer at all temperatures except 24 °C (10-2-8 = Everlizer), and similarly Frye was lower than both OF at 10 °C and 30 °C.

3.4. CO2-C Emissions

For both soils, weekly emissions of CO2-C were highest early in the incubation, then decreased as the incubation progressed. Cumulative emissions were low throughout the incubation for the Citra unamended control soil at 10 °C and 17 °C, whereas they increased to 10–15 mg CO2-C g−1 C input at 24 °C and 30 °C after eight weeks (Figure 7). Unamended control soils and Everlizer always had the lowest and highest CO2-C emissions of all treatments, respectively. Frye emitted less than Everlizer but more than OF at all temperatures except at 10 °C, when 10-2-8 and Frye were not different. OF had lower CO2-C emissions than PMA for all temperatures except at 10 °C (Frye = 10-2-8 > 13-0-0), with similar emissions between OF except at 10 °C. For all PMA and OF, CO2-C emissions were lowest at 10 °C and highest at 30 °C, with small differences between 17 °C, 24 °C, and 30 °C, except for 10-2-8, where emissions at 10 °C were higher than at 17 °C and 24 °C.
Compared with the Citra soil, the unamended Immokalee control soil had greater CO2-C emissions at 17 °C, 24 °C, and 30 °C; emissions increased at higher temperatures, and emissions at 30 °C were comparable with those from both OF (Figure 8). Like the Citra soil, Everlizer always had the highest emissions, Frye was lower than Everlizer at all temperatures, Frye was greater than OF at 10 °C and 17 °C, and OF had the lowest emissions, with no difference between 10-2-8 and 13-0-0. Overall, CO2-C emissions were lowest at 10 °C and highest at 30 °C, with small differences between 17 °C, 24 °C, and 30 °C, despite trends of increasing emissions for Frye and OF at higher temperatures.
The percentage of CO2-C emissions relative to soil C—i.e., initial soil C for unamended controls or the sum of initial soil C and C inputs for amended treatments—was less than 15% after 56 days of incubation (Table 4). There was a significantly greater percentage emitted with Everlizer than all other amendments for both soils, while Frye was always lower than Everlizer and generally greater than OF (except at 10 °C in Citra and 24 °C and 30 °C in Immokalee). OF had a greater percentage emitted than unamended controls for all temperatures and both soils, except at 30 °C in the Immokalee soil. The percentage emitted was generally highest at 30 °C.

4. Discussion

4.1. Effects of Amendment Type and Temperature on Nitrogen Release

The increase in soil inorganic N, observed when incubation temperatures increased from 10 °C to 30 °C, was expected given that mineralization is a temperature-dependent process [8,19]. However, the response to temperature differed between NH4+-N and NO3-N, with the former accumulating with time at 10 °C, increasing and then decreasing at 17 °C, and declining rapidly at 24 °C and 30 °C. In contrast, NO3-N accumulation was minimal at 10 °C but increased with temperature, indicative of nitrification limitation at low temperatures that was relieved at higher temperatures.
Manure-based amendments had the highest N release at 30 °C in both Citra and Immokalee soils, confirming the temperature-dependence of N mineralization observed in past studies [8,9]. Both MBA saw decreases in inorganic N after application, indicative of immobilization, although subsequent N release indicates that these were ultimately net suppliers of N. Nitrogen immobilization in the first few weeks after application followed by a later release of N is consistent with Kelley et al. [7] and confirms that amendments must be managed carefully to avoid crop N deficiency.
In contrast, OF released N rapidly in the first week after application in both soils, with warmer temperatures generally experiencing a sharper increase in soil inorganic N, consistent with other studies where the highest net N mineralization was seen at higher temperatures [9]. Past studies have also found high N release in the first two weeks with N-rich OF, with 57% to 60% of the N mineralization in blood meal and feather meal occurring within the first two weeks at 30 °C, whereas N release ranged between 48% and 51% at 10 °C [19].
OF released a greater fraction of their N as soil inorganic N than MBA, which was expected given their C:N ratio [5,13]. OF had a C:N ratio less than 4 while MBA had C:N ratios between 8 and 10, consistent with a greater proportion of organic N being mineralized when the C:N ratio decreases [30]. This greater N release in OF was observed at all temperatures, consistent with other studies where organic N was released from high N OF even at low temperatures, albeit at lower rates [19].
In this study, PMA had a net N release of less than 20% in both soils, which is at the lower end of a literature survey that found N release ranging from 3% to 75% for manure-based amendments [6]. This result is also lower than the 29–72% range Gale et al. [5] found for different poultry manures subject to different processing methods. Given that the C:N ratios of PMA were much lower than 20:1, a greater mineralization of total N inputs was expected for these inputs, as indicated by the original estimates of 23–24% PAN obtained from an external laboratory. It is possible that we underestimated N release from these PMA with our relatively short 8-week incubation. In contrast, N release typically peaked between 59% and 72% for OF, consistent with past studies where protein-based fertilizers had a mineralization between 60% and 90% [5,15,21] and the estimate of 75% availability used in this study, based on Allar and Maltais-Landry [27].

4.2. Effects of Amendment Type and Temperature on CO2 Emissions

Carbon emissions from unamended controls increased from 10 °C to 30 °C in both soils, with a stronger response to temperature in the Immokalee soil, consistent with previous studies [31,32]. The greater emissions observed in the Immokalee soil are likely due to its C concentration (1.60% C), more than twice that of the Citra soil (0.62% C), as greater soil C is known to increase CO2 emissions through respiration [33,34]. However, given that our soil C emissions were standardized by soil C, other factors might be more important drivers, such as differences in microbial biomass between the two soils. The temperature response observed is consistent with previous studies where soil CO2-C emissions increased by 48% and 22% when temperatures increased from 10 °C to 17 °C and from 17 °C to 25 °C, respectively [35], although the increase in emissions with temperature was more modest in this study beyond 17 °C. This is partly supported by past studies that reported a weaker effect of temperature on soil respiration when the temperature increased above 24.5 °C [36,37].
The heat-treated poultry manure (Everlizer) emitted more CO2-C than the other amendments in both soils and at all temperatures in this study, which is likely due to the large C inputs made with this amendment that is not as stable as composted or charred manure [7]. Consequently, the charred manure (Frye) emitted much less CO2-C, despite similar total C inputs relative to the heat-treated manure, confirming that the amount of CO2-C released from organic materials added to the soil depends on the material used [38]. In this study, much larger inputs of PMA were required compared with OF, given their much lower percent of organic N estimated to be PAN, consistent with previous studies using manure-based amendments [7].

4.3. Implications

Consistent with previous studies, the highest inorganic N release and CO2 emissions were observed at the highest temperature (30 °C), confirming the role of temperature as a key driver of decomposition [7,39]. For both soils, unamended control soils had small inorganic N release at temperatures of 10 °C or 17 °C, hence inorganic N released was almost entirely derived from amendments at these temperatures. However, the unamended control soils accounted for higher N release at 30 °C for both soils, and at 24 °C in the Immokalee soil, emphasizing the value of including unamended control soils to correct for N mineralization from SOM when estimating N release from amendments. As N release in amendment-free incubations was much larger in the Immokalee than in the Citra soil, likely due to the much higher SOM measured in the former, amendment-free incubations are especially valuable for soils with higher SOM concentrations.
From a practical standpoint, the temperature-dependence of N mineralization should be considered when managing these amendments in different seasons [31,32]. For example, as the N release from 13-0-0 increased from 48% at 10 °C to 99% at 30 °C in the Citra soil, this input should be managed differently across seasons, with a very rapid release expected in the summer that may be too rapid relative to crop N uptake, which could lead to N losses. In contrast, earlier and/or higher inputs might be needed to supply sufficient N to sustain good crop growth and yield in the winter. Although it was similar for the two soils used in this study, soil texture could also affect N mineralization and should guide management decisions, as sandy soils favor mineralization [20].
High CO2-C emissions in the unamended Immokalee soil indicate that amendment-free controls should be included to properly determine the amount of C inputs from amendments that is emitted as CO2-C. In this study, low CO2-C emissions from OF were associated with high N release, highlighting their benefit as a nutrient source. Despite their high CO2-C emissions, the large C inputs required to supply sufficient PAN with PMA suggests a larger contribution to SOM and long-term fertility, which may be advantageous when building soil health is a primary focus.

5. Conclusions

Patterns in soil NH4+-N and NO3-N concentrations indicate that both mineralization and nitrification responded to temperature in this study, resulting in greater N release at 30 °C relative to 10 °C. Overall, N release was greater for OF than PMA, consistent with their C:N ratios. PMA had the highest CO2-C emissions at all temperatures, with greater emissions from the heat-treated as opposed to the biocharred manure. As both N release and C emissions responded to temperature in this study, this impacts which protocols should be used to conduct incubations and how these OF and PMA should be managed across different seasons.

Supplementary Materials

The following supporting information can be downloaded at: https://www.mdpi.com/article/10.3390/agriculture14112009/s1, Figure S1: Soil NH4+-N concentrations in the Citra soil; Figure S2: Soil NH4+-N concentrations in the Immokalee soil; Figure S3: Soil NO3-N concentrations in the Citra soil, Figure S4: Soil NO3-N concentrations in the Immokalee soil, Figure S5: Soil inorganic N concentrations in the Citra soil, Figure S6: Soil inorganic N concentrations in the Immokalee soil.

Author Contributions

Conceptualization: S.V., K.T. and G.M.-L.; methodology: S.V., K.T. and G.M.-L.; validation: C.G. and G.M.-L.; formal analysis: C.G. and G.M.-L.; investigation: S.V., K.T. and G.M.-L.; resources: G.M.-L.; data curation: C.G. and G.M.-L.; writing—original draft preparation: C.G. and G.M.-L.; writing—review and editing: C.G., K.T., S.V., Y.L., T.O. and G.M.-L.; visualization: C.G. and G.M.-L.; supervision: G.M.-L.; project administration: G.M.-L.; funding acquisition: G.M.-L. All authors have read and agreed to the published version of the manuscript.

Funding

Funding for this work was provided by the University of Florida Institute of Food and Agricultural Sciences Early Career Seed grant, USDA Hatch grants FLA-SWS-006383 and FLA-SWS-005733, and the USDA National Institute of Food and Agriculture National Needs Fellow grant, 2021-38420-34936.

Institutional Review Board Statement

Not applicable.

Data Availability Statement

The datasets generated during and/or analyzed during the current study are available from the corresponding author on reasonable request.

Acknowledgments

We would like to thank Angelique Bochnak for support with lab analyses, and Laura Cano-Castro, Martin Zapien, and Julia Barra Netto-Ferreira for their help with data analysis.

Conflicts of Interest

The authors declare no conflicts of interest.

References

  1. Sabry, K. Synthetic fertilizers; role and hazards. Fertil. Technol. 2015, 1, 110–133. [Google Scholar] [CrossRef]
  2. Nair, V.D.; Nair, P.K.R.; Dari, B.; Freitas, A.M.; Chatterjee, N.; Pinheiro, F.M. Biochar in the agroecosystem-climate-change-sustainability nexus. Front. Plant Sci. 2017, 8, 2051. [Google Scholar] [CrossRef] [PubMed]
  3. Heijboer, A.; ten Berge, H.F.M.; de Ruiter, P.C.; Jørgensen, H.B.; Kowalchuk, G.A.; Bloem, J. Plant biomass, soil microbial community structure and nitrogen cycling under different organic amendment regimes; a 15N tracer-based approach. Appl. Soil Ecol. 2016, 107, 251–260. [Google Scholar] [CrossRef]
  4. Urra, J.; Alkorta, I.; Garbisu, C. Potential benefits and risks for soil health derived from the use of organic amendments in agriculture. Agronomy 2019, 9, 542. [Google Scholar] [CrossRef]
  5. Gale, E.S.; Sullivan, D.M.; Cogger, C.G.; Bary, A.I.; Hemphill, D.D.; Myhre, E.A. Estimating plant-available nitrogen release from manures, composts, and specialty products. J. Environ. Qual. 2006, 35, 2321–2332. [Google Scholar] [CrossRef]
  6. Geisseler, D.; Smith, R.; Cahn, M.; Muramoto, J. Nitrogen mineralization from organic fertilizers and composts: Literature survey and model fitting. J. Environ. Qual. 2021, 50, 1325–1338. [Google Scholar] [CrossRef]
  7. Kelley, A.; Wilkie, A.C.; Maltais-Landry, G. Food-based composts provide more soil fertility benefits than cow manure-based composts in sandy soils. Agriculture 2020, 10, 69. [Google Scholar] [CrossRef]
  8. Agehara, S.; Warncke, D.D. Soil moisture and temperature effects on nitrogen release from organic nitrogen sources. Soil Sci. Soc. Am. J. 2005, 69, 1844–1855. [Google Scholar] [CrossRef]
  9. de Jesus, H.I.; Cassity-Duffey, K.; Dutta, B.; da Silva, A.L.B.R.; Coolong, T. Influence of soil type and temperature on nitrogen mineralization from organic fertilizers. Nitrogen 2024, 5, 47–61. [Google Scholar] [CrossRef]
  10. Haynes, R.J. The decomposition process: Mineralization, immobilization, humus formation, and degradation. In Mineral Nitrogen in the Plant-Soil System; Haynes, R.J., Ed.; Academic Press: Cambridge, MA, USA, 1986; pp. 52–126. [Google Scholar]
  11. van der Sloot, M.; Kleijn, D.; de Deyn, G.B.; Limpens, J. Carbon to nitrogen ratio and quantity of organic amendment interactively affect crop growth and soil mineral N retention. Crop Environ. 2022, 1, 161–167. [Google Scholar] [CrossRef]
  12. Janssen, B.H. Nitrogen mineralization in relation to C ratio and decomposability of organic materials. Plant Soil 1996, 181, 39–45. [Google Scholar] [CrossRef]
  13. Delin, S.; Stenberg, B.; Nyberg, A.; Brohede, L. Potential methods for estimating nitrogen fertilizer value of organic residues. Soil Use Manag. 2012, 28, 283–291. [Google Scholar] [CrossRef]
  14. Bengtsson, G.; Bengtson, P.; Månsson, K.F. Gross nitrogen mineralization-, immobilization-, and nitrification rates as a function of soil C/N ratio and microbial activity. Soil Biol. Biochem. 2003, 35, 143–154. [Google Scholar] [CrossRef]
  15. Lazicki, P.; Geisseler, D.; Lloyd, M. Nitrogen mineralization from organic amendments is variable but predictable. J. Environ. Qual. 2019, 49, 483–495. [Google Scholar] [CrossRef] [PubMed]
  16. Sikora, L.; Szmidt, R.; Stofella, P.; Kahn, B. Nitrogen sources, mineralization rates and nitrogen nutrition benefits to plants of compost. In Compost Utilization in Horticultural Cropping Systems; Stofella, P.J., Kahn, B.A., Eds.; Lewis Publishers: Boca Raton, FL, USA, 2001; pp. 287–305. [Google Scholar]
  17. Żołnowski, A.C.; Bakuła, T.; Rolka, E.; Klasa, A. Effect of Mineral–Microbial Deodorizing Preparation on the Value of Poultry Manure as Soil Amendment. Int. J. Environ. Res. Public Health 2022, 19, 16639. [Google Scholar] [CrossRef]
  18. Olfs, H.-W.; Blankenau, K.; Brentrup, F.; Jasper, J.; Link, A.; Lammel, J. Soil- and plant-based nitrogen-fertilizer recommendations in arable farming. J. Plant Nutr. Soil Sci. 2005, 168, 414–431. [Google Scholar] [CrossRef]
  19. Hartz, T.K.; Johnstone, P.R. Nitrogen availability from high-nitrogen-containing organic fertilizers. HortTechnology 2006, 16, 39–42. [Google Scholar] [CrossRef]
  20. Cassity-Duffey, K.; Cabrera, M.; Franklin, D.; Gaskin, J.; Kissel, D. Effect of soil texture on nitrogen mineralization from organic fertilizers in four common southeastern soils. Soil Sci. Soc. Am. J. 2020, 84, 534–542. [Google Scholar] [CrossRef]
  21. Cassity-Duffey, K.; Cabrera, M.; Gaskin, J.; Franklin, D.; Kissel, D.; Saha, U. Nitrogen mineralization from organic materials and fertilizers: Predicting N release. Soil Sci. Soc. Am. J. 2020, 84, 522–533. [Google Scholar] [CrossRef]
  22. Nyabami, P.; Maltais-Landry, G.; Lin, Y. Nitrogen release dynamics of cover crop mixtures in a subtropical agroecosystem were rapid and species-specific. Plant Soil 2023, 492, 399–412. [Google Scholar] [CrossRef]
  23. Mylavarapu, R.; Harris, W.; Hochmuth, G. Agricultural Soils of Florida. 2019. Available online: https://edis.ifas.ufl.edu/publication/SS655 (accessed on 1 July 2024).
  24. UF IFAS Extension. FAWN Soil Temperature. University of Florida. 2024. Available online: https://fawn.ifas.ufl.edu (accessed on 1 July 2024).
  25. Soil Survey Staff, Natural Resources Conservation Service, United States Department of Agriculture. Official Soil Series Descriptions. Available online: https://soilseries.sc.egov.usda.gov (accessed on 1 July 2024).
  26. Food and Agriculture Organization of the United Nations. World Reference Base. Available online: https://www.fao.org/soils-portal/data-hub/soil-classification/world-reference-base/en/ (accessed on 1 November 2024).
  27. Allar, J.; Maltais-Landry, G. Limited benefits of summer cover crops on nitrogen cycling in organic vegetable production. Nutr. Cycl. Agroecosyst. 2022, 122, 119–138. [Google Scholar] [CrossRef]
  28. Franzluebbers, A.J. Should soil testing services measure soil biological activity? Agric. Environ. Lett. 2016, 1, 150009. [Google Scholar] [CrossRef]
  29. R Core Team. R: A Language and Environment for Statistical Computing; R Foundation for Statistical Computing: Vienna, Austria, 2019. [Google Scholar]
  30. Flavel, T.C.; Murphy, D.V. Carbon and nitrogen mineralization rates after application of organic amendments to soil. J. Environ. Qual. 2006, 35, 183–193. [Google Scholar] [CrossRef] [PubMed]
  31. Buragienė, S.; Šarauskis, E.; Romaneckas, K.; Adamavičienė, A.; Kriaučiūnienė, Z.; Avižienytė, D.; Marozas, V.; Naujokienė, V. Relationship between CO₂ emissions and soil properties of differently tilled soils. Sci. Total Environ. 2019, 662, 786–795. [Google Scholar] [CrossRef]
  32. Juhász, C.; Huzsvai, L.; Kovács, E.; Kovács, G.; Tuba, G.; Sinka, L.; Zsembeli, J. Carbon dioxide efflux of bare soil as a function of soil temperature and moisture content under weather conditions of warm, temperate, dry climate zone. Agronomy 2022, 12, 3050. [Google Scholar] [CrossRef]
  33. Raich, J.W.; Kaiser, M.S.; Dornbush, M.E.; Martin, J.G.; Valverde-Barrantes, O.J. Multiple factors co-limit short-term in situ soil carbon dioxide emissions. PLoS ONE 2023, 18, e0279839. [Google Scholar] [CrossRef]
  34. Vicentini, M.E.; Pinotti, C.R.; Hirai, W.Y.; de Moraes, M.L.T.; Montanari, R.; Filho, M.C.M.T.; Milori, D.M.B.P.; Júnior, N.L.S.; Panosso, A.R. CO₂ emission and its relation to soil temperature, moisture, and O₂ absorption in the reforested areas of Cerrado biome, Central Brazil. Plant Soil 2019, 444, 193–211. [Google Scholar] [CrossRef]
  35. Nyberg, M.; Hovenden, M.J. Warming increases soil respiration in a carbon-rich soil without changing microbial respiratory potential. Biogeosciences 2020, 17, 4405–4420. [Google Scholar] [CrossRef]
  36. Bezyk, Y.; Dorodnikov, M.; Górka, M.; Sówka, I.; Sawiński, T. Temperature and soil moisture control CO2 flux and CH2 oxidation in urban ecosystems. Geochemistry 2023, 83, 125989. [Google Scholar] [CrossRef]
  37. Schipper, L.A.; Hobbs, J.K.; Rutledge, S.; Arcus, V.L. Thermodynamic theory explains the temperature optima of soil microbial processes and high Q10 values at low temperatures. Glob. Chang. Biol. 2014, 20, 3578–3586. [Google Scholar] [CrossRef]
  38. Bernal, M.P.; Sánchez-Monedero, M.A.; Paredes, C.; Roig, A. Carbon mineralization from organic wastes at different composting stages during their incubation with soil. Bioresour. Technol. 1998, 64, 179–187. [Google Scholar] [CrossRef]
  39. Fierer, N.; Craine, J.M.; McLauchlan, K.; Schimel, J.P. Litter quality and the temperature sensitivity of decomposition. Ecology 2005, 86, 320–326. [Google Scholar] [CrossRef]
Figure 1. Net soil inorganic NH4+-N concentrations (mean ± SE) in the Citra soil incubated at (a) 10 °C, (b) 17 °C, (c) 24 °C, and (d) 30 °C. Uppercase letters indicate significant differences among treatments at each individual day, whereas lowercase letters indicate significant differences among incubation days within an individual treatment, according to an ANOVA followed by a Tukey post hoc test (p < 0.05).
Agriculture 14 02009 g001
Figure 2. Net soil inorganic NH4+-N concentrations (mean ± SE) in the Immokalee soil incubated at (a) 10 °C, (b) 17 °C, (c) 24 °C, and (d) 30 °C. Uppercase letters indicate significant differences among treatments at each individual day, whereas lowercase letters indicate significant differences among incubation days within an individual treatment, according to an ANOVA followed by a Tukey post hoc test (p < 0.05).
Agriculture 14 02009 g002
Figure 3. Net soil inorganic NO3-N concentrations (mean ± SE) in the Citra soil incubated at (a) 10 °C, (b) 17 °C, (c) 24 °C, and (d) 30 °C. Uppercase letters indicate significant differences among treatments at each individual day, whereas lowercase letters indicate significant differences among incubation days within an individual treatment, according to an ANOVA followed by a Tukey post hoc test (p < 0.05).
Agriculture 14 02009 g003
Figure 4. Net soil inorganic NO3-N concentrations (mean ± SE) in the Immokalee soil incubated at (a) 10 °C, (b) 17 °C, (c) 24 °C, and (d) 30 °C. Uppercase letters indicate significant differences among treatments at each individual day, whereas lowercase letters indicate significant differences among incubation days within an individual treatment, according to an ANOVA followed by a Tukey post hoc test (p < 0.05).
Agriculture 14 02009 g004
Figure 5. Net soil inorganic N concentrations (mean ± SE of NH4+-N + NO3-N) in the Citra soil incubated at (a) 10 °C, (b) 17 °C, (c) 24 °C, and (d) 30 °C. Uppercase letters indicate significant differences among treatments at each individual day, whereas lowercase letters indicate significant differences among incubation days within an individual treatment, according to an ANOVA followed by a Tukey post hoc test (p < 0.05).
Agriculture 14 02009 g005
Figure 6. Net soil inorganic N concentrations (mean ± SE of NH4+-N + NO3-N) in the Immokalee soil incubated at (a) 10 °C, (b) 17 °C, (c) 24 °C, and (d) 30 °C. Uppercase letters indicate significant differences among treatments at each individual day, whereas lowercase letters indicate significant differences among incubation days within an individual treatment, according to an ANOVA followed by a Tukey post hoc test (p < 0.05).
Agriculture 14 02009 g006
Figure 7. Cumulative mg CO2-C g−1 C emissions (mean ± SE) for the Citra soil incubated at (a) 10 °C, (b) 17 °C, (c) 24 °C, and (d) 30 °C. Letters indicate significant differences among treatments at the end of incubations, according to an ANOVA followed by a Tukey post hoc test (p < 0.05).
Agriculture 14 02009 g007
Figure 8. Cumulative mg CO2-C g−1 C emissions (mean ± SE) for the Immokalee soil incubated at (a) 10 °C, (b) 17 °C, (c) 24 °C, and (d) 30 °C. Letters indicate significant differences among treatments at the end of incubations, according to an ANOVA followed by a Tukey post hoc test (p < 0.05).
Agriculture 14 02009 g008
Table 1. Selected properties of the two soils used in incubations.
SoilClaySiltSandpHTotal CTotal NPKCaMgS
________ % _______ _______ % _________ mg kg−1 __
Citra0.72.696.76.60.620.048711559116
Immokalee0.73.595.96.91.600.1423378821310
Table 2. Selected properties of organic fertilizers and organic amendments prior to incubations. Nitrogen inputs are total N inputs, and C inputs only account for amendment inputs, not soil carbon.
AmendmentTypeTotal CTotal NC:NC InputsN InputsP2O5K2O
________ % ________ ______ mg kg−1 __________ % ____
EverlizerHeat-treated poultry manure30.33.19.837103694.05.2
FryeCharred poultry manure28.03.48.338753735.76.6
10-2-8Protein-based fertilizer40.210.83.74991252.47.7
13-0-0Protein-based fertilizer45.312.63.64281131.10.7
Table 3. Net percent inorganic N released relative to N inputs for each amendment, after values for unamended controls have been subtracted. Letters indicate significant differences among amendments within an incubation temperature and soil, according to an ANOVA followed by a Tukey post hoc test (p < 0.05).
SoilAmendment10 °C17 °C24 °C30 °C
CitraEverlizer7% ab16% a7% a9% a
Frye4% a12% a14% a16% ab
10-2-858% c44% a25% a69% bc
13-0-048% bc42% a35% a99% c
ImmokaleeEverlizer6% a15% ab12% ab8% a
Frye3% a8% a8% a4% a
10-2-839% b54% b54% ab59% b
13-0-054% b69% b70% b72% b
Table 4. Cumulative mg CO2-C g−1 C emissions at 8 weeks as a percentage of soil C. Letters indicate significant differences among treatments for percentage of cumulative CO2-C emissions, as determined with an ANOVA followed by a Tukey post hoc test (p < 0.05).
SoilAmendment10 °C17 °C24 °C30 °C
CitraEverlizer10.4% d14.5% d14.1% d14.8% d
Frye6.4% c8.4% c9.0% c8.8% c
10-2-85.1% c4.6% b3.8% b5.3% b
13-0-02.8% b4.0% b3.4% b5.9% b
Control0.7% a0.6% a1.4% a1.9% a
ImmokaleeEverlizer6.7% d9.3% d9.8% c11.1% c
Frye3.8% c5.7% c5.3% b6.8% b
10-2-82.7% b3.9% b4.7% b5.6% ab
13-0-02.3% b3.3% b4.8% b6.3% ab
Control0.7% a1.5% a3.4% a4.9% a
Disclaimer/Publisher’s Note: The statements, opinions and data contained in all publications are solely those of the individual author(s) and contributor(s) and not of MDPI and/or the editor(s). MDPI and/or the editor(s) disclaim responsibility for any injury to people or property resulting from any ideas, methods, instructions or products referred to in the content.

