Abstract
In the future, the cultivation of maize will become more and more prominent. As the world’s demand for food and animal feeding increases, remote sensing technologies (RS technologies), especially unmanned aerial vehicles (UAVs), are developing more and more, and the usability of the cameras (Multispectral-MS) installed on them is increasing, especially for plant disease detection and severity observations. In the present research, two different maize hybrids, P9025 and sweet corn Dessert R78 (CS hybrid), were employed. Four different treatments were performed with three different doses (low, medium, and high dosage) of infection with corn smut fungus (Ustilago maydis [DC] Corda). The fields were monitored two times after the inoculation—20 DAI (days after inoculation) and 27 DAI. The orthomosaics were created in WebODM 2.5.2 software and the study included five vegetation indices (NDVI [Normalized Difference Vegetation Index], GNDVI [Green Normalized Difference Vegetation Index], NDRE [Normalized Difference Red Edge], LCI [Leaf Chlorophyll Index] and ENDVI [Enhanced Normalized Difference Vegetation Index]) with further analysis in QGIS. The gathered data were analyzed using R-based Jamovi 2.6.13 software with different statistical methods. In the case of the sweet maize hybrid, we obtained promising results, as follows: the NDVI values of CS 0 were significantly higher than the high-dosed infection CS 10.000 with a mean difference of 0.05422 *** and a p value of 4.43 × 10⁻⁵ value, suggesting differences in all of the levels of infection. Furthermore, we investigated the correlations of the vegetation indices (VI) for the Dessert R78, where NDVI and GNDVI showed high correlations. NDVI had a strong correlation with GNDVI (r = 0.83), a medium correlation with LCI (r = 0.56) and a weak correlation with NDRE (r = 0.419). There was also a strong correlation between LCI and GNDVI, with r = 0.836. NDRE and GNDVI indices had the correlation coefficients with a CCoeff. of r = 0.716. For hybrid separation analyses, useful results were obtained for NDVI and ENDVI as well.
1. Introduction
Precision agriculture (PA) and related developments are rapidly spreading among farmers and researchers [1]. In today’s world, the importance of digitization and data has increased tremendously [2]. Precision agriculture greatly contributes to saving and optimizing resources based on the appropriate analysis of data. The adequate interpretation of the data greatly contributes to the development of new technologies, for example, saving fuel, optimizing workflow and seed and fertilizer use, optimizing the usage of water and reducing the negative environmental factors [3,4,5,6,7].
Remote sensing techniques are one of the cornerstones of precision farming technologies. They are widely used with different sensors and GPS-based technologies [8]. In the past few years, many advancements in RS technology and Unmanned Aerial Vehicles have opened up a huge scale of new opportunities for PA and plant disease detection techniques for experts in the field [9]. By using Unmanned Aerial Vehicle (UAV) technology, we can perform monitoring recordings over fields, and the different VI values obtained from the vegetation indices (VI) calculated from the recordings can be used to improve crop production and provide users with useful information about crop conditions [10,11,12]. UAV devices equipped with different payloads, for example RGB cameras or multispectral camera systems MSC (Multi Spectral Camera), can be used for high accuracy field monitoring. Multispectral camera systems are available on the market and can be used to monitor plant diseases and assess the severity of diseases.
Maize (Zea mays) is one of the most widely produced species of cereals on the planet. In Hungary, it is also in the top three main crops. In 2022, the sowing area was 817.000 ha (KSH 2024) [13]. All significant results related to maize are crucial within the field of agricultural research. The year 2022 showed farmers that making corn cultivation sustainable and achieving crop security is very important. In 2022, there was a massive heatwave across Hungary, and nearly no rainfall was seen in the critical development stages [14]. Hajdú-Bihar county was highly affected by the heat wave, and almost every hectare of corn was destroyed by drought, amounting to nearly 90%. The rising temperature (climate change) means that the appearance of warm-loving pathogens will increase. One of the main pathogens that affects maize is the corn smut fungus Ustilago maydis (DC) Corda. As time moves forward and the temperature increases, it will become much more relevant to the plant production industry, as an obligate wound parasite that will appear in greater numbers together with heat-loving pests. One of the most important entry points for the infection is damage to the plant caused by insect pests.
Many studies deal with plant pathogen identification and the measurement of their severity; for example, Liu L et al. investigated and worked on preparing a disease index that is able to identify wheat Fusarium [15]. Yu et al. was interested in the early detection of Pine wilt disease PWD [16]; these types of RS technologies can also detect various plant diseases in the earlier stages of the pathogenic infection. Kerkech et al. also used multispectral images with depth maps to create a network-based detection method—vine disease detection [17]. Zhang et al. also worked with the same technology and used drones (UAV) to detect banana plant diseases; their study was focused on Banana Fusarium wilt disease [18]. Bendel et al. sought to observe whether it is possible to identify lesions on the leaves of a plant by using hyper- or multispectral technologies on Esca disease GTD in grapevine [19]. NDVI and GNDVI are standard VIs that are widely used, with proven applicability. Zhao H. et al. (2020) [20] used six typical VIs for disease severity grading along with normalization methods. NDVI and GNDVI performed well in the case of severity detection, just like in our results, especially in a sweetcorn hybrid, highlighting the differences between the infection levels (CS hybrid) [20]. Further VI correlation results can provide basic information (related to disease detection), and help in selecting wavelengths for higher-resolution sensors, such as hyperspectral cameras [21]. Chang A. et al. (2020) [10] also used different VIs for citrus greening disease (CGD); similar symptoms appeared on plant tissues such as Ustilago maydis (DC) Corda. In every healthy case, they observed higher VI values for the non-infected parts, especially those values derived from NDVI and NDRE. VIs and the results of proper data filtering methods are critical to every plant disease modeling system [22].
In any case, remote sensing technologies are increasingly suitable for monitoring plant diseases, and the related data analysis sciences and data cleaning procedures promise researchers even more tangible results in the future. The purpose of the present study is the applicability of vegetation indices in open field conditions to detect differences caused by plant pathogens and to separate potential corn hybrids based on their VI values. The exploration of the strength of the correlations is very important in the case of this study, because these data provide additional useful information related to the establishment of more serious sensors, such as hyperspectral UAVs, and the creation of potential pathogen-specific indices.
2. Materials and Methods
2.1. Experimental Area
The experimental settings were located in Hajdú-Bihar county in the eastern region of Hungary. The Google Maps GPS coordinates of the experimental site are (47°33′06.5″ N 21°36′07.1″ E) (Figure 1). The area is part of the University of Debrecen (UD) experimental garden site. Here, 24 plots were created in the area. According to previous studies, two different maize hybrids were selected: sweet maize Dessert R78 and the forage maize Pioneer P 9025. These hybrids are promising for use in further research, based on our results. The sowing was carried out with a Maschio GASPARDO, Italian made, 4-row sowing machine on 4 May 2022. Each plot included four rows, with 18.5 cm plant spacing and 75 cm row spacing. The whole area was 500 m2. We kept the area between the plots and between the rows weed-free via mechanical weed control until the end of the experiment. In the research period, no chemical agents were used for weed control (we wanted to avoid any yellow-flash effects on the plant leaves) so as not to affect the values of the different VIs calculated during the monitoring stages.
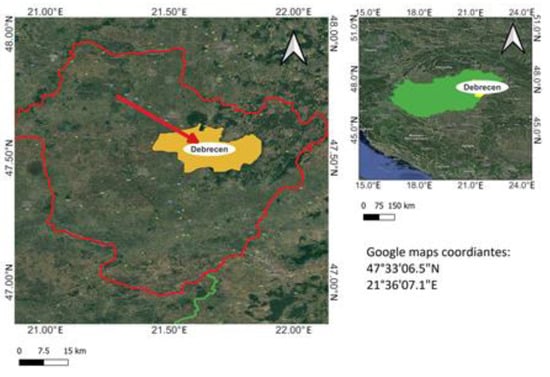
Figure 1.
Map of Hungary and Subregion Hajdú-Bihar county with subregion and city of Debrecen where the experiment was set up.
The artificial infection of the fungi (Ustilago maydis (DC) Corda) was carried out on three different levels of sporidium concentration on 3 June 2022, with a mass injection device. We prepared a low dosage of 5000 spores/mL of spores concentration (spore numbers), a medium dosage of 7500 spores/mL and a high dosage of infection of 10,000 spores/mL. The cell count process was undertaken in Burker chambers. Altogether, with the non-infected healthy control parcels, 4 treatments were completed in 3 replications, all of which were randomized on the study site. The doses of the treatments were adjusted based on previous results regarding these types of infections [23,24].
The four treatments of the experiment were as follows:
- Non-infected (healthy control);
- Low dose, 5000 spore/mL;
- Medium dose, 7500 spore/mL;
- High dose, 10,000 spore/mL.
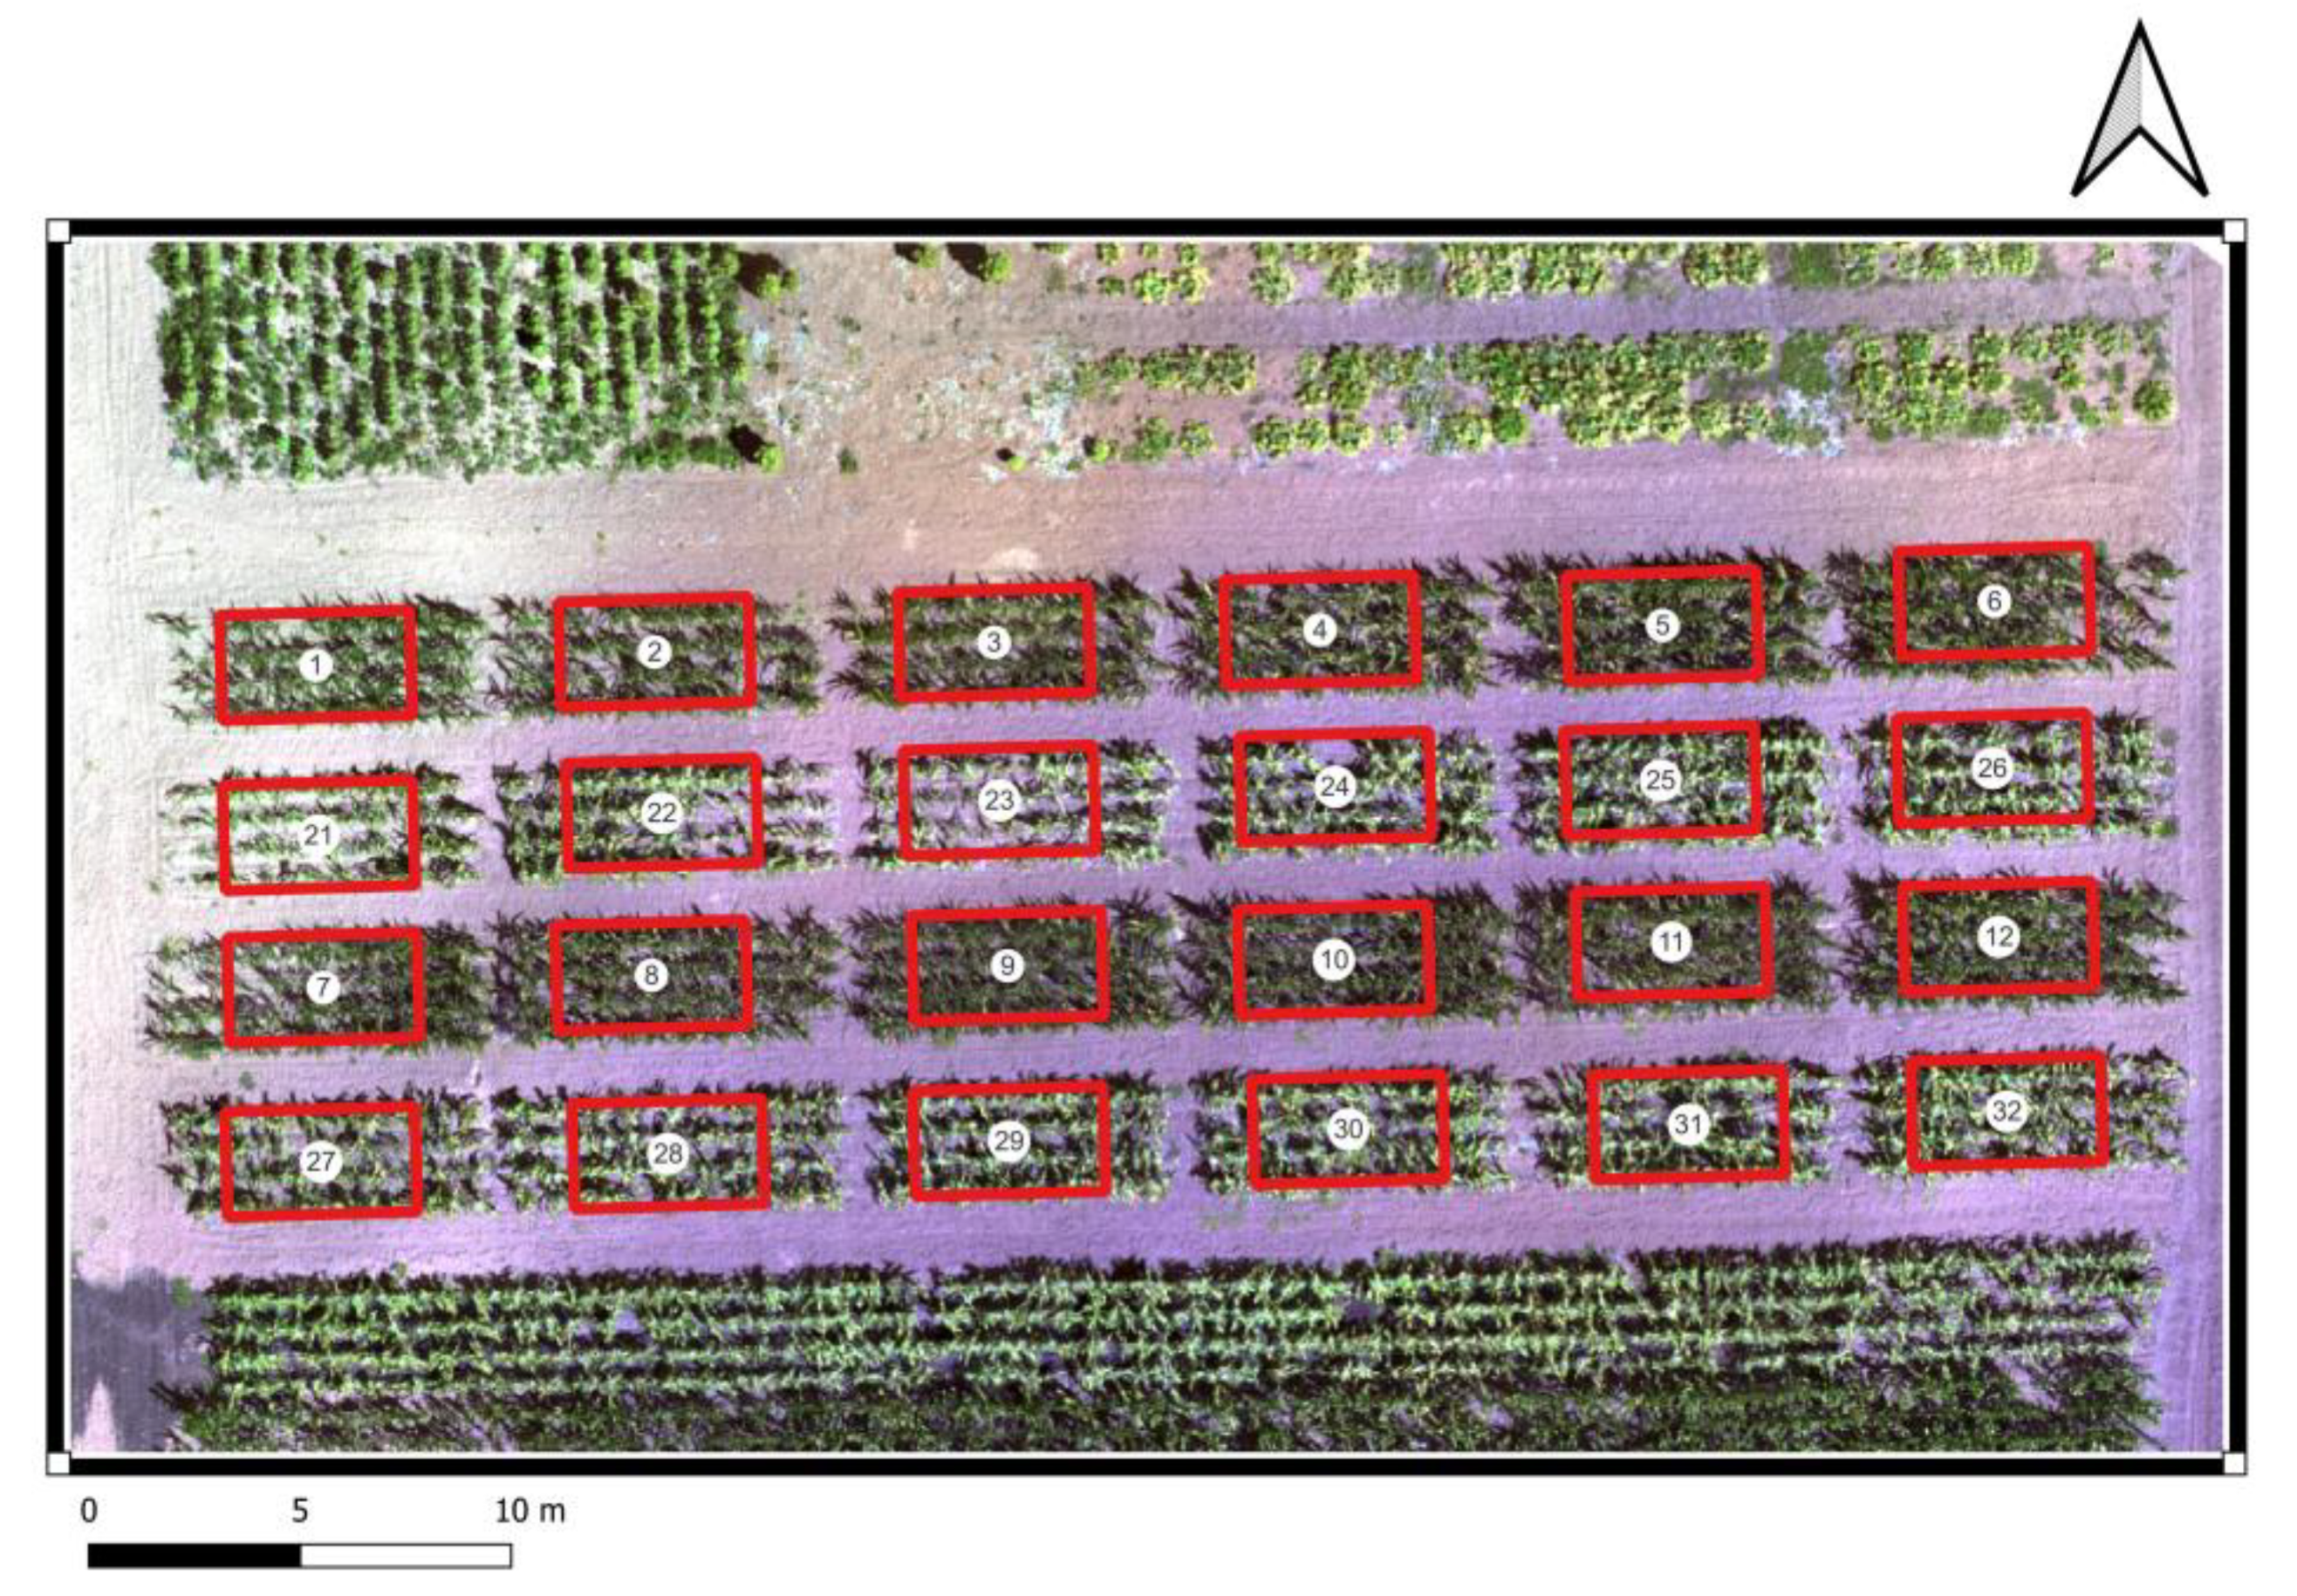
In total, 24 plots were created, and the areas of each of these plots were 18.75 m2 (Figure 2).

Figure 2.
Research field of the University of Debrecen. Each red rectangle represents a parcel, including its numbers. (DJI Phantom 4 MS multispectral made in China by Shenzhen DJI Sciences and Technologies Ltd., Shenzhen, China (the recording contains all six channels) orthomosaic in the environment of QGIS 3.360).
The numbers inside the red rectangles (shp) give names to the parcels, which were added for the sake of the attribute tables. The artificial infection of the plants was directed into the middle part of each parcel. During the sampling of the UAV recording, a multipolygon shape (shp) file was used for extracting the vegetation index (VI) values from the raster regions. These “sampling polygons” were 4.5 m long and 2.5 m wide. Each unified sampling area focused on the middle parts of the plots.
2.2. UAV Specifications and Data Collection, Analyzing Methods
The research site was monitored 2 times after the inoculation was performed, as follows:
- 23 June 2022 (20 days after inoculation) DAI;
- 30 June 2022 (27 day after inoculation) DAI.
The weather was clear and sunny at each recording time. It is important to be aware of the temperature when measuring. The operating temperature was suitable, at between 0 and 40 °C. The speed of the UAV depends on three factors. The first one is the shooting interval in seconds (2 s is standard), the second is altitude (m), and the third is front/side overlap. The phantom 4 MS controlling application sets the UAV speed automatically based on overlap and UAV altitude. We used the following parameters to get high-quality recordings from the area. The front overlap was 80% and the side overlap was 75%. During the flights, the UAV’s altitude was 30 m and the speed was 2 m/s. The average resoultion of the recordings was 1.8 cm/px (GSD).
The multispectral imaging system contains six sensors, all of which were 1/2.9” CMOSs, with one RGB (vis. light sensor) for creating RGB recordings and the other five were each monochrome sensors. MS data were used for further analyses. The camera sensor has 2.08 MP of effective pixels, amounting to 2.12 in total [25]. The camera lenses’ specifications are the following: focal length, 5.74 mm (35 mm format equivalent: 40 mm); autofocus set at ∞; aperture, f/2.2; field of view (FOV), 62.7° [25].
The maximum image size is 1600 × 1300 (4:3.25) for RGB recordings, with the format being JPEG for RGB and TIFF for the multispectral imaging. The image’s GSD is calculated with this formula: GSD = Focal Length × Image Width/Altitude × Sensor Width.
The five monochrome sensors have filters on different wavelengths, as follows [25]:
- Red (R), 650 nm ± 16 nm;
- Green (G), 560 nm ± 16 nm;
- Blue (B), 450 nm ± 16 nm;
- Red Edge (RE), 730 nm ± 16 nm;
- Near-Infrared (NIR), 840 nm ± 26 nm;
- Visible Light (RGB).
For the multispectral photogrammetry process, orthomosaics were created in WebODM version 2.5.2 [26], and for further analyses of the raster layers, QuantumGIS version 3.36 software was used [27]. Five indices were investigated in the study—NDVI, GNDVI, ENDVI, LCI, and NDRE; the calculation formulas are shown in Table 1. These indices are widespread and used for different purposes in measuring plant diseases.

Table 1.
Observed vegetation indices (VI) in the study and their calculation formulas.
Table 1.
Observed vegetation indices (VI) in the study and their calculation formulas.
| Abbrev. | Formula | References |
|---|---|---|
| NDVI | (RNIR − RRed)/(RNIR + RRed) | [28] |
| ENDVI | (RNIR + RGreen − 2 × RBlue)/(RNIR + RGreen + 2 × RBlue) | [29] |
| GNDVI | (RNIR − RGreen)/(RNIR + RGreen) | [30] |
| NDRE | (RNIR − RRedEdge)/(RNIR + RRedEdge) | [31] |
| LCI | (RNIR − RRedEdge)/(RNIR + RRed) | [32] |
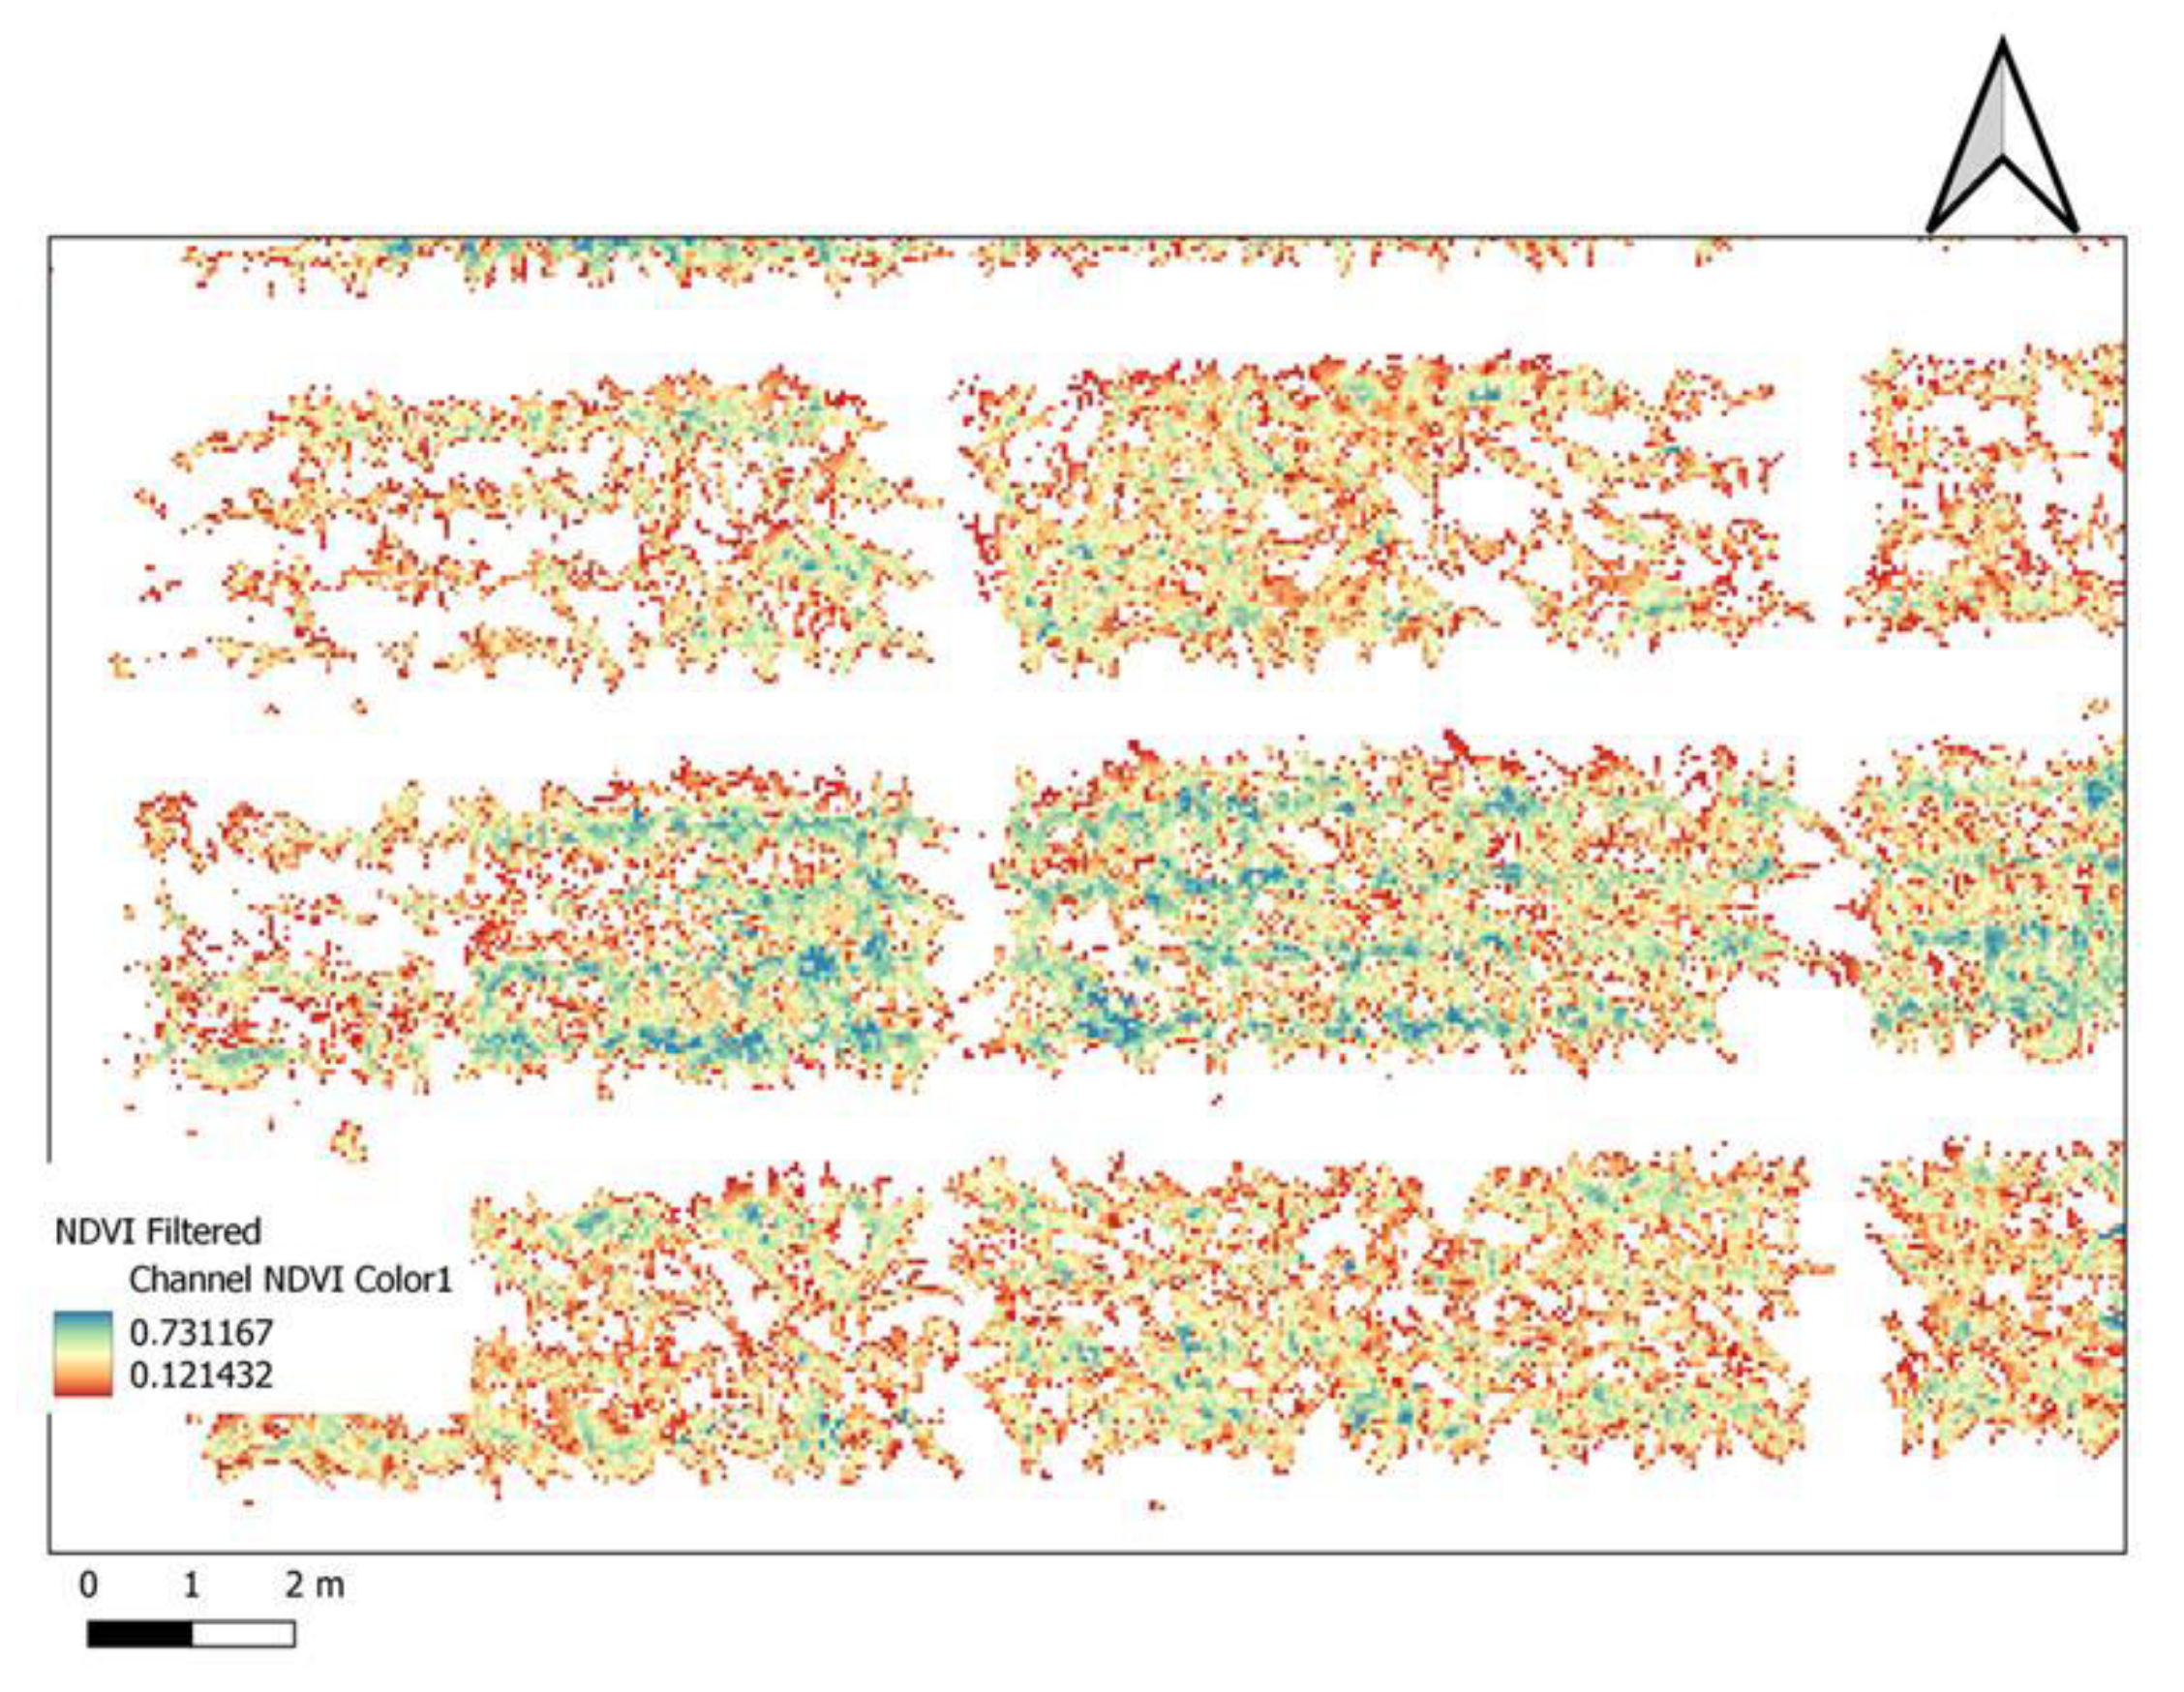
After the successful calculation of the indices, different filtering options were applied on the layers, and thus for further investigation, only plant pixels separated from the background were examined. This raster layer filtering method is very useful in data cleaning, and provides more reliable and comparable data. After the maps were filtered, zonal statistics were performed for each polygon (Figure 3).
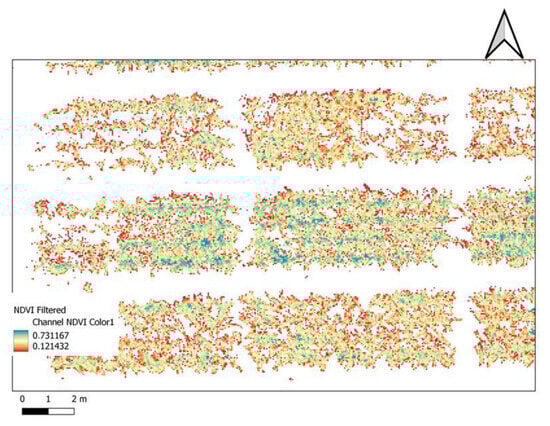
Figure 3.
Research field NDVI map (QGIS environment). The filtered version contains only maize plants pixel on the colored NDVI channel.
The zonal statistics include count, median, mean, min/max values and variance. The statistics attributes were exported in xlsx. After the database was finalized in MS Excel version 2108, it was exported into csv format for the statistical analysis in the R-based software Jamovi 2.3.28.
Figures and graphs were created in Jamovi 2.3.28 and MS Excel. For statistical analyses, Jamovi 2.3.28 was used, including descriptive statistics and one-way ANOVA, as well as Pearson’s correlation between the VIs. The database was created in Excel after the attributes were extracted from QGIS 3.36.
3. Results
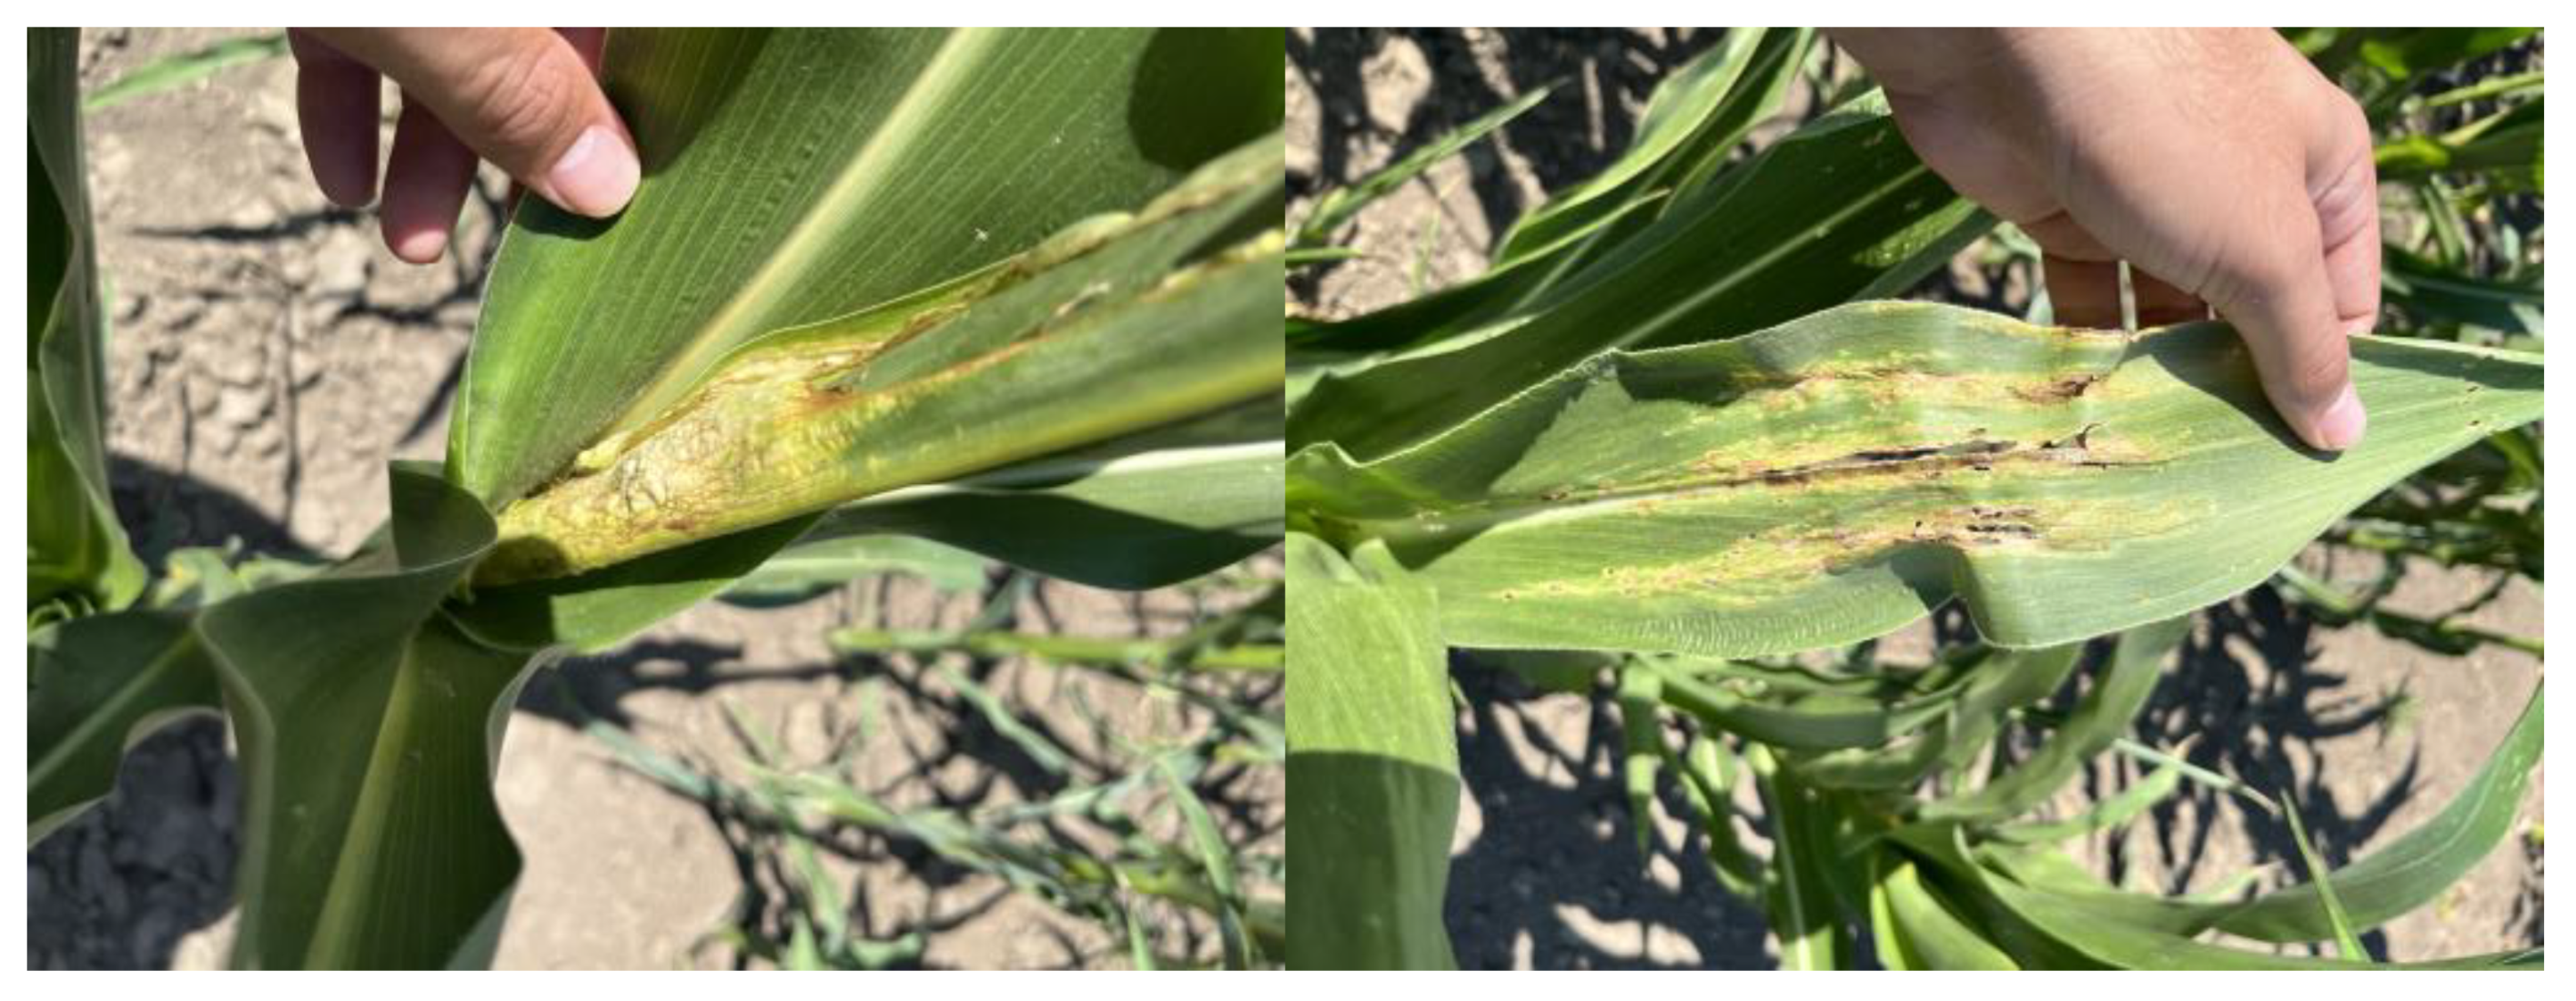
The first recordings were made in the third (June 23) (20 days after the infection—20 DAI) and fourth weeks (30 June, 27 DAI) after the artificial infection. After the third and fourth weeks of infection, the symptoms and tissue damage were observed in the infected plots. The surface chlorosis and the yellowing of the foliage revealed the typical characteristics of the infection (Figure 4).
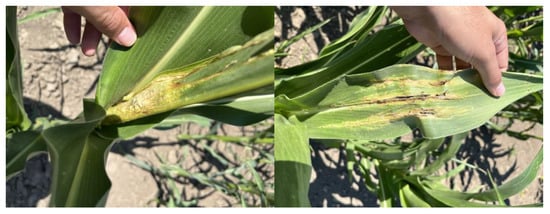
Figure 4.
Symptoms of the Ustilago maydis (DC) Corda three weeks after the infection (left picture, stalk symptom; right picture, leaf symptoms); hlorosis and cell destruction mainly seen on the plant tissues.
The main objective of the study was to determine whether the applied doses resulted in differences in symptom intensity. Additionally, we aimed to examine how these doses affect vegetation index values and how these values differ from those in uninfected (healthy) control areas. Furthermore, we were interested in investigating the dynamics and spatial distribution of corn smut infection.
Hereinafter, the different treatments will be referred to by the following abbreviations. For the sweet maize (Dessert R78 hybrid), the following:
- CS 0 (healthy untreated plots in three replications);
- CS 5000 (low dose, 5000 s/mL infection in three replications);
- CS 7500 (medium dose, 7500 s/mL infection in three replications);
- CS 10,000 (high dose, 10,000 s/mL infection in three replications).
For the fodder maize hybrid, which was P9025, we set out the following:
- T 0 (Healthy untreated plots in three replications);
- T 5000 (low dose, 5000 s/mL infection in three replications);
- T 7500 (medium dose, 7500 s/mL infection in three replications);
- T 10,000 (high dose, 10,000 s/mL infection in three replications).
3.1. Data Distribution and Correlations in Dessert R78 Hybrid
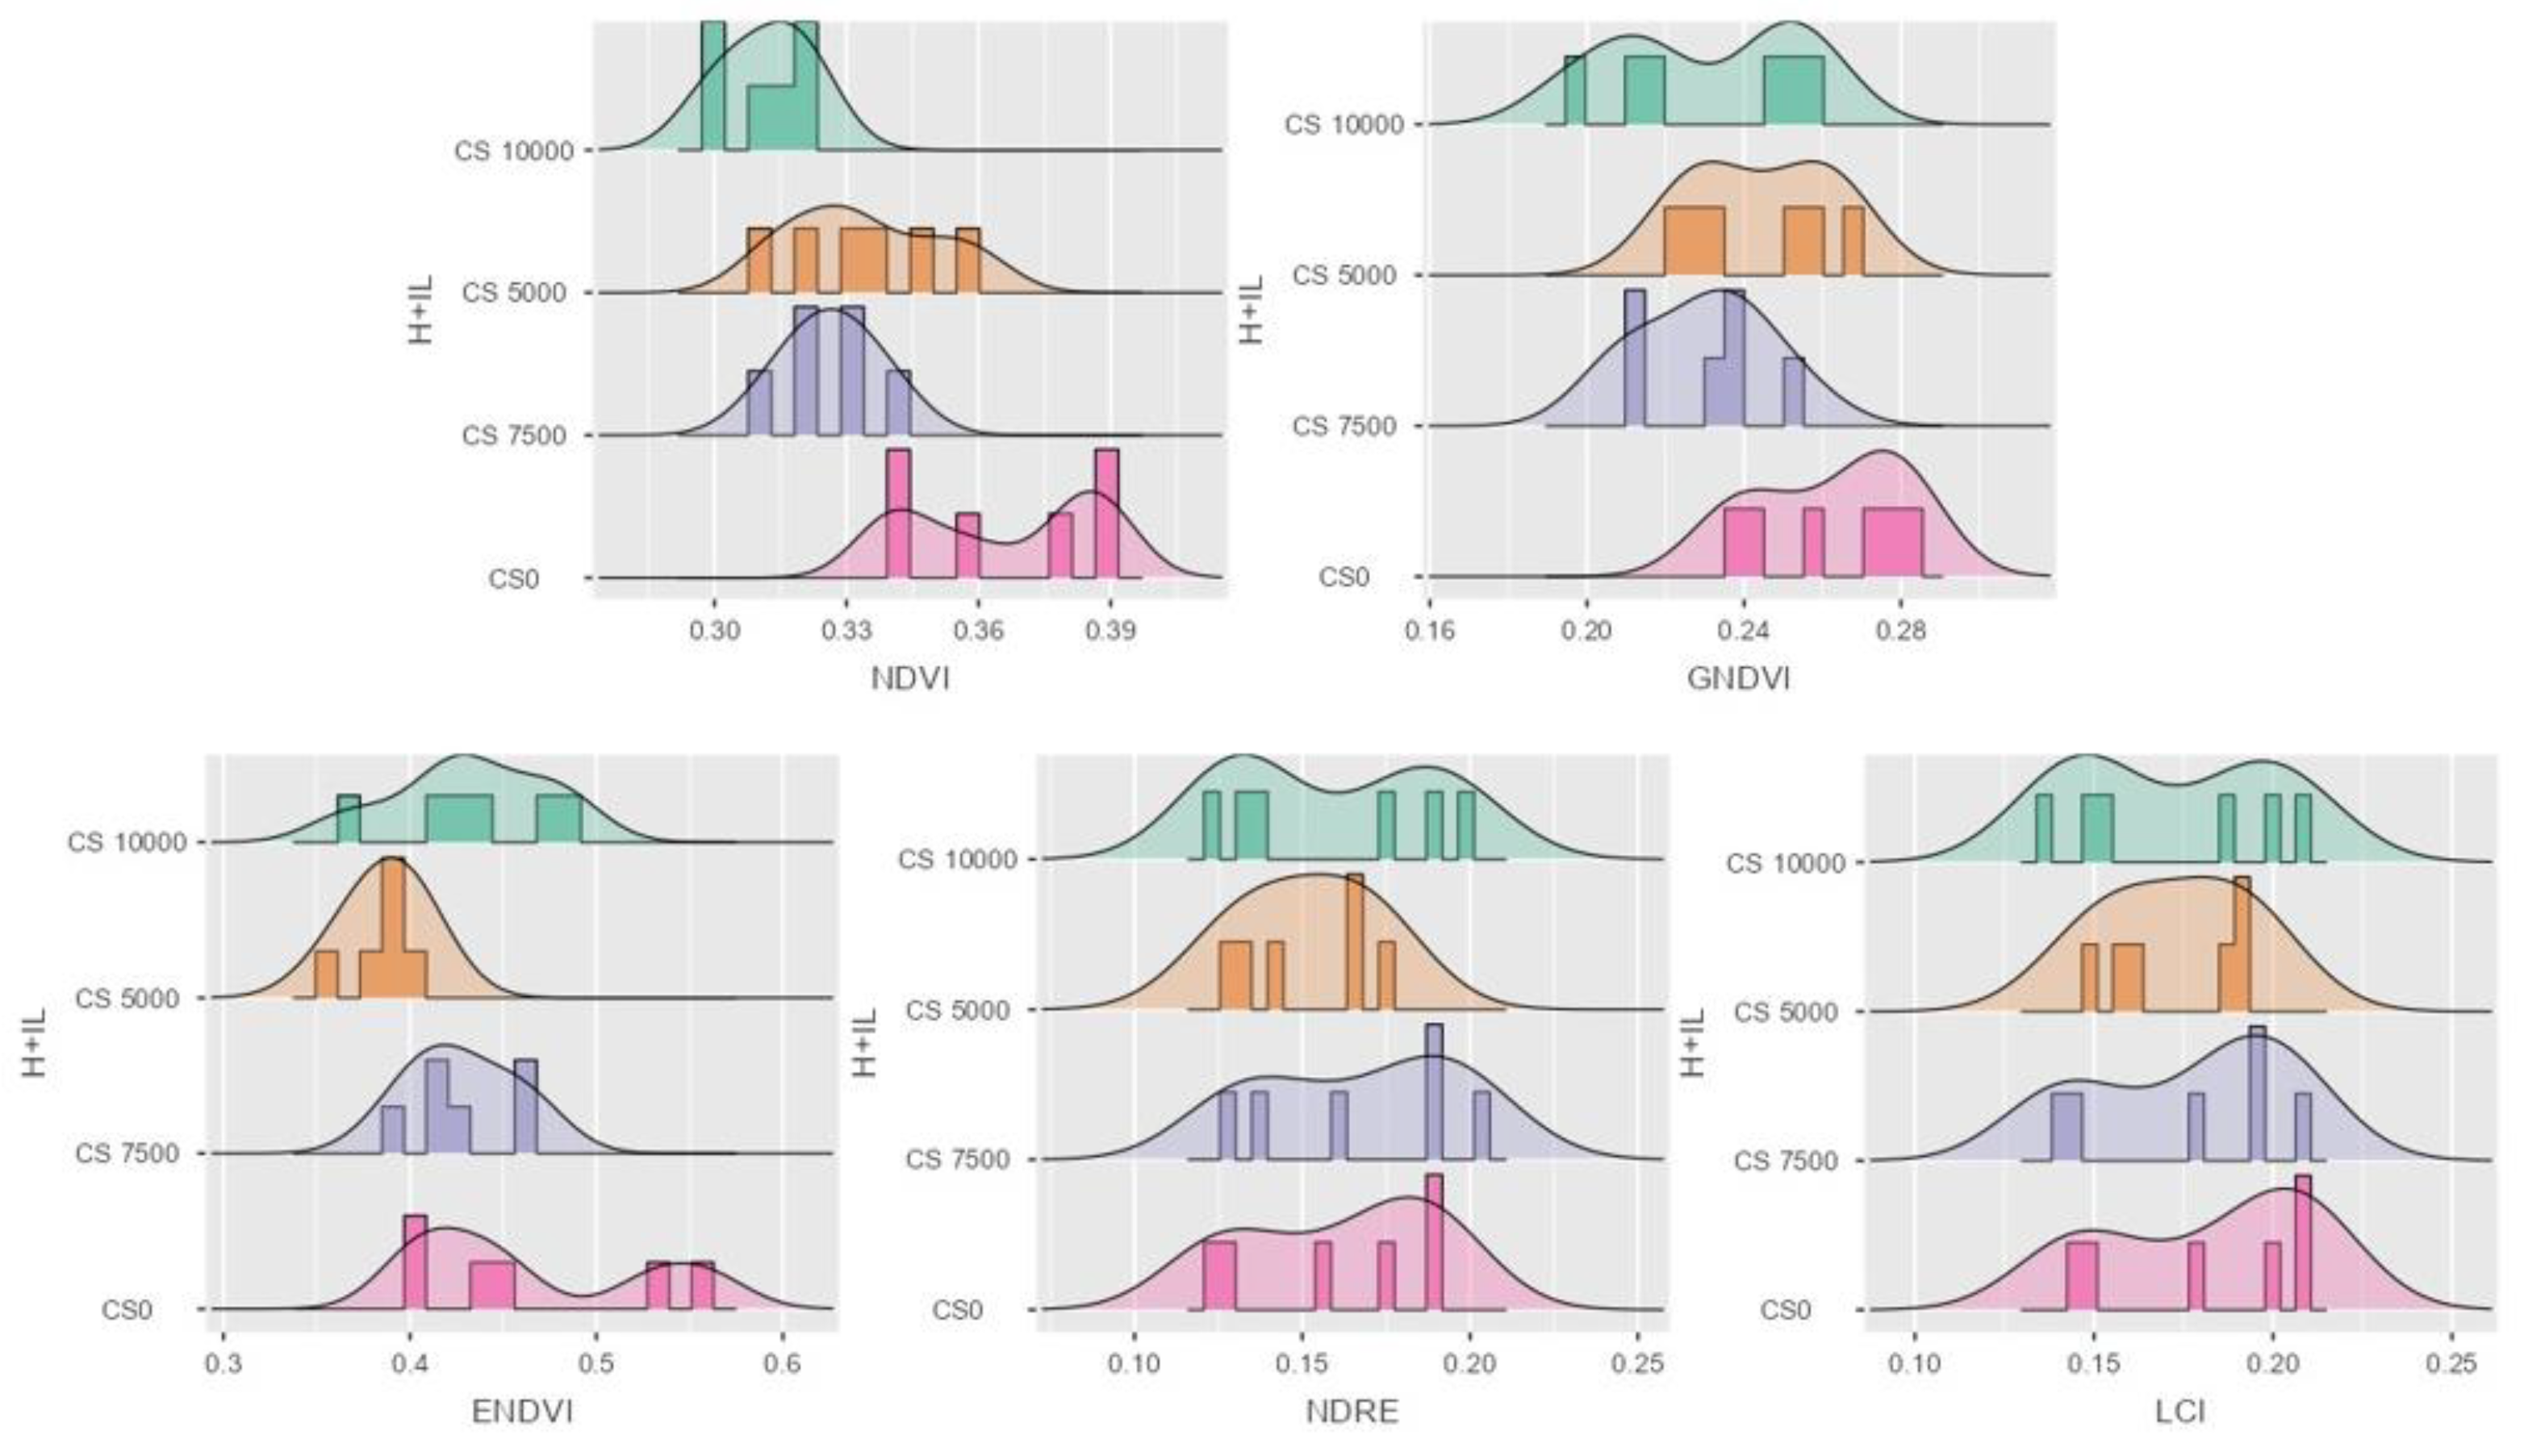
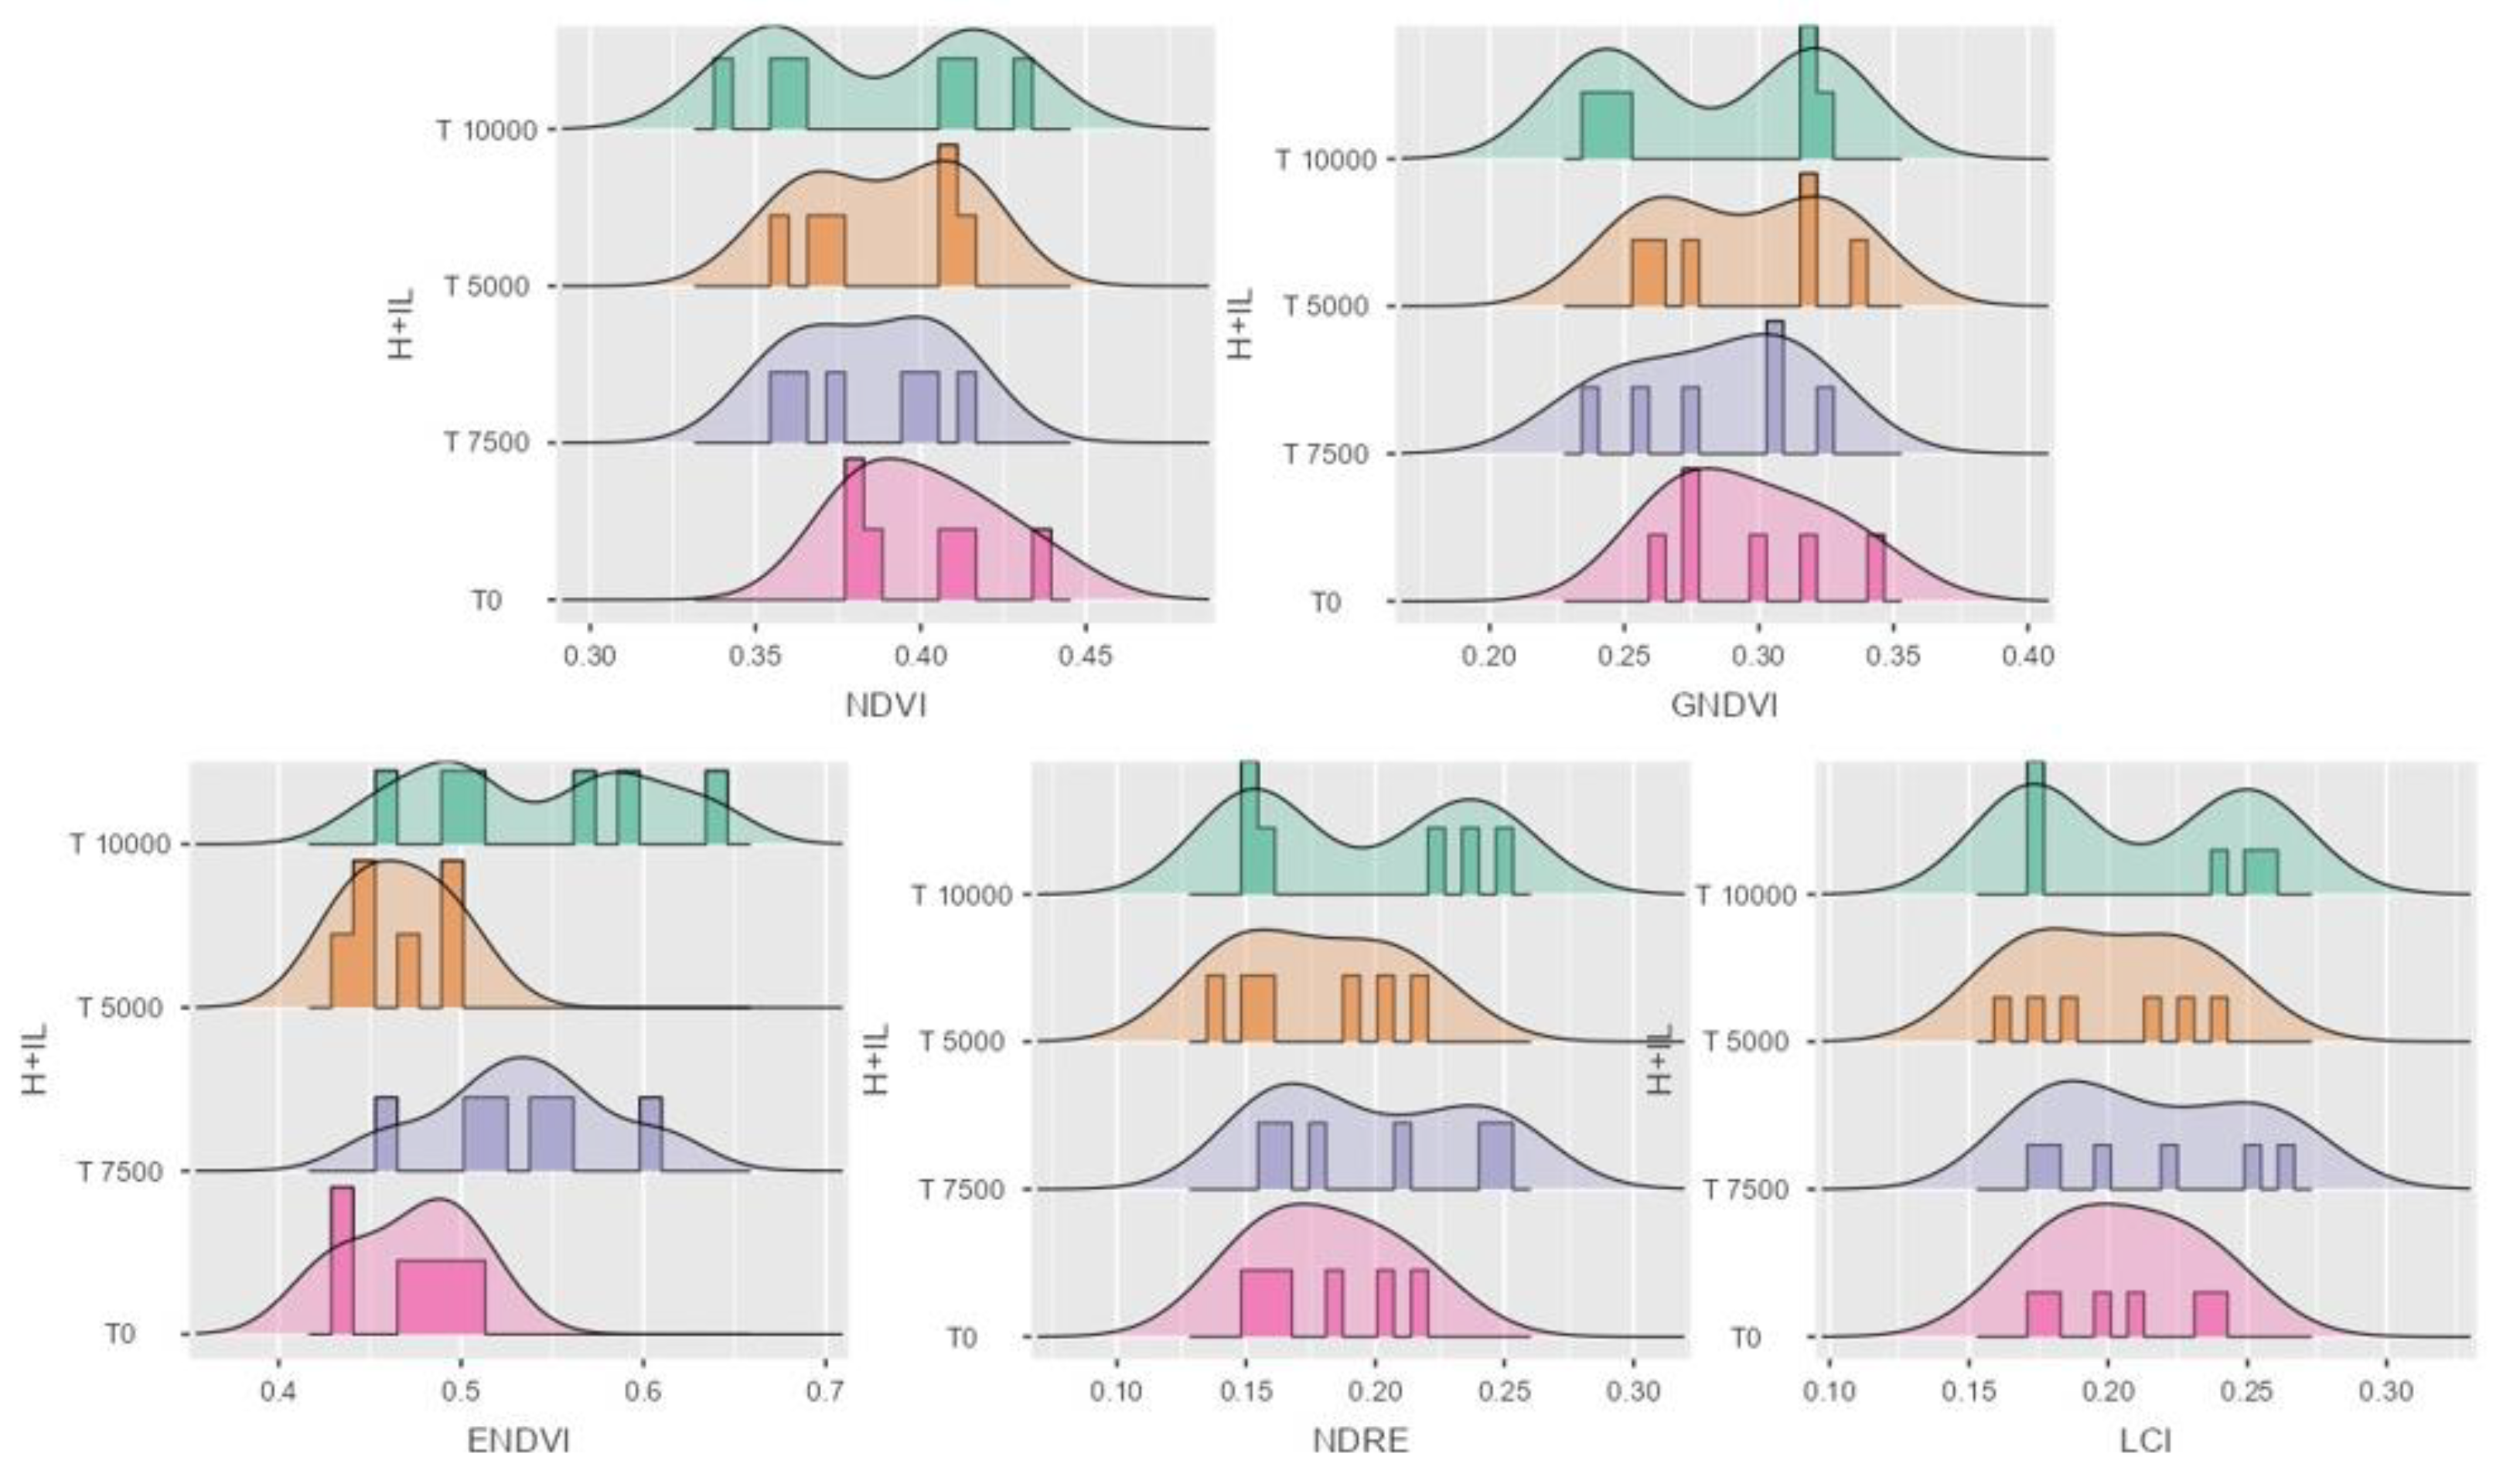
Figure 5 shows that the differences in data distribution are clearly visible in the case of the sweet maize hybrid Dessert R78, while the higher VI values occur in the CS 0 treatment. The exploration of the strengths of the correlations is very important here because they provide additional useful information for the setting of more serious sensors, such as hyperspectral UAVs, and the creation of potential pathogen-specific indices. The purpose of performing correlation analysis between different VIs is to understand the degree of association between these VIs and to assess whether they capture similar or complementary information about the vegetation. This is is also very important for selecting optimal indices, interpreting the VI characteristics, and improving model accuracy. It can also offer a basis for more complex data fusion and MS analyses, and support the selected hypothesis. Greater density values in higher VI interval can represent valuable information about the vegetation indices, and about which of them is available for further investigation. Each VI mean value contains around 4500–5000 px data, and four treatments were performed (CS 5000, CS 7500, CS 10,000), including on non-infected (CS 0) plots in three replications.

Figure 5.
Data distribution in histogram with density for the five VIs. NDVI, GNDVI, ENDVI, NDRE and LCI in sweet maize Dessert R78 hybrid. H + IL stands for hybrid and infection level.
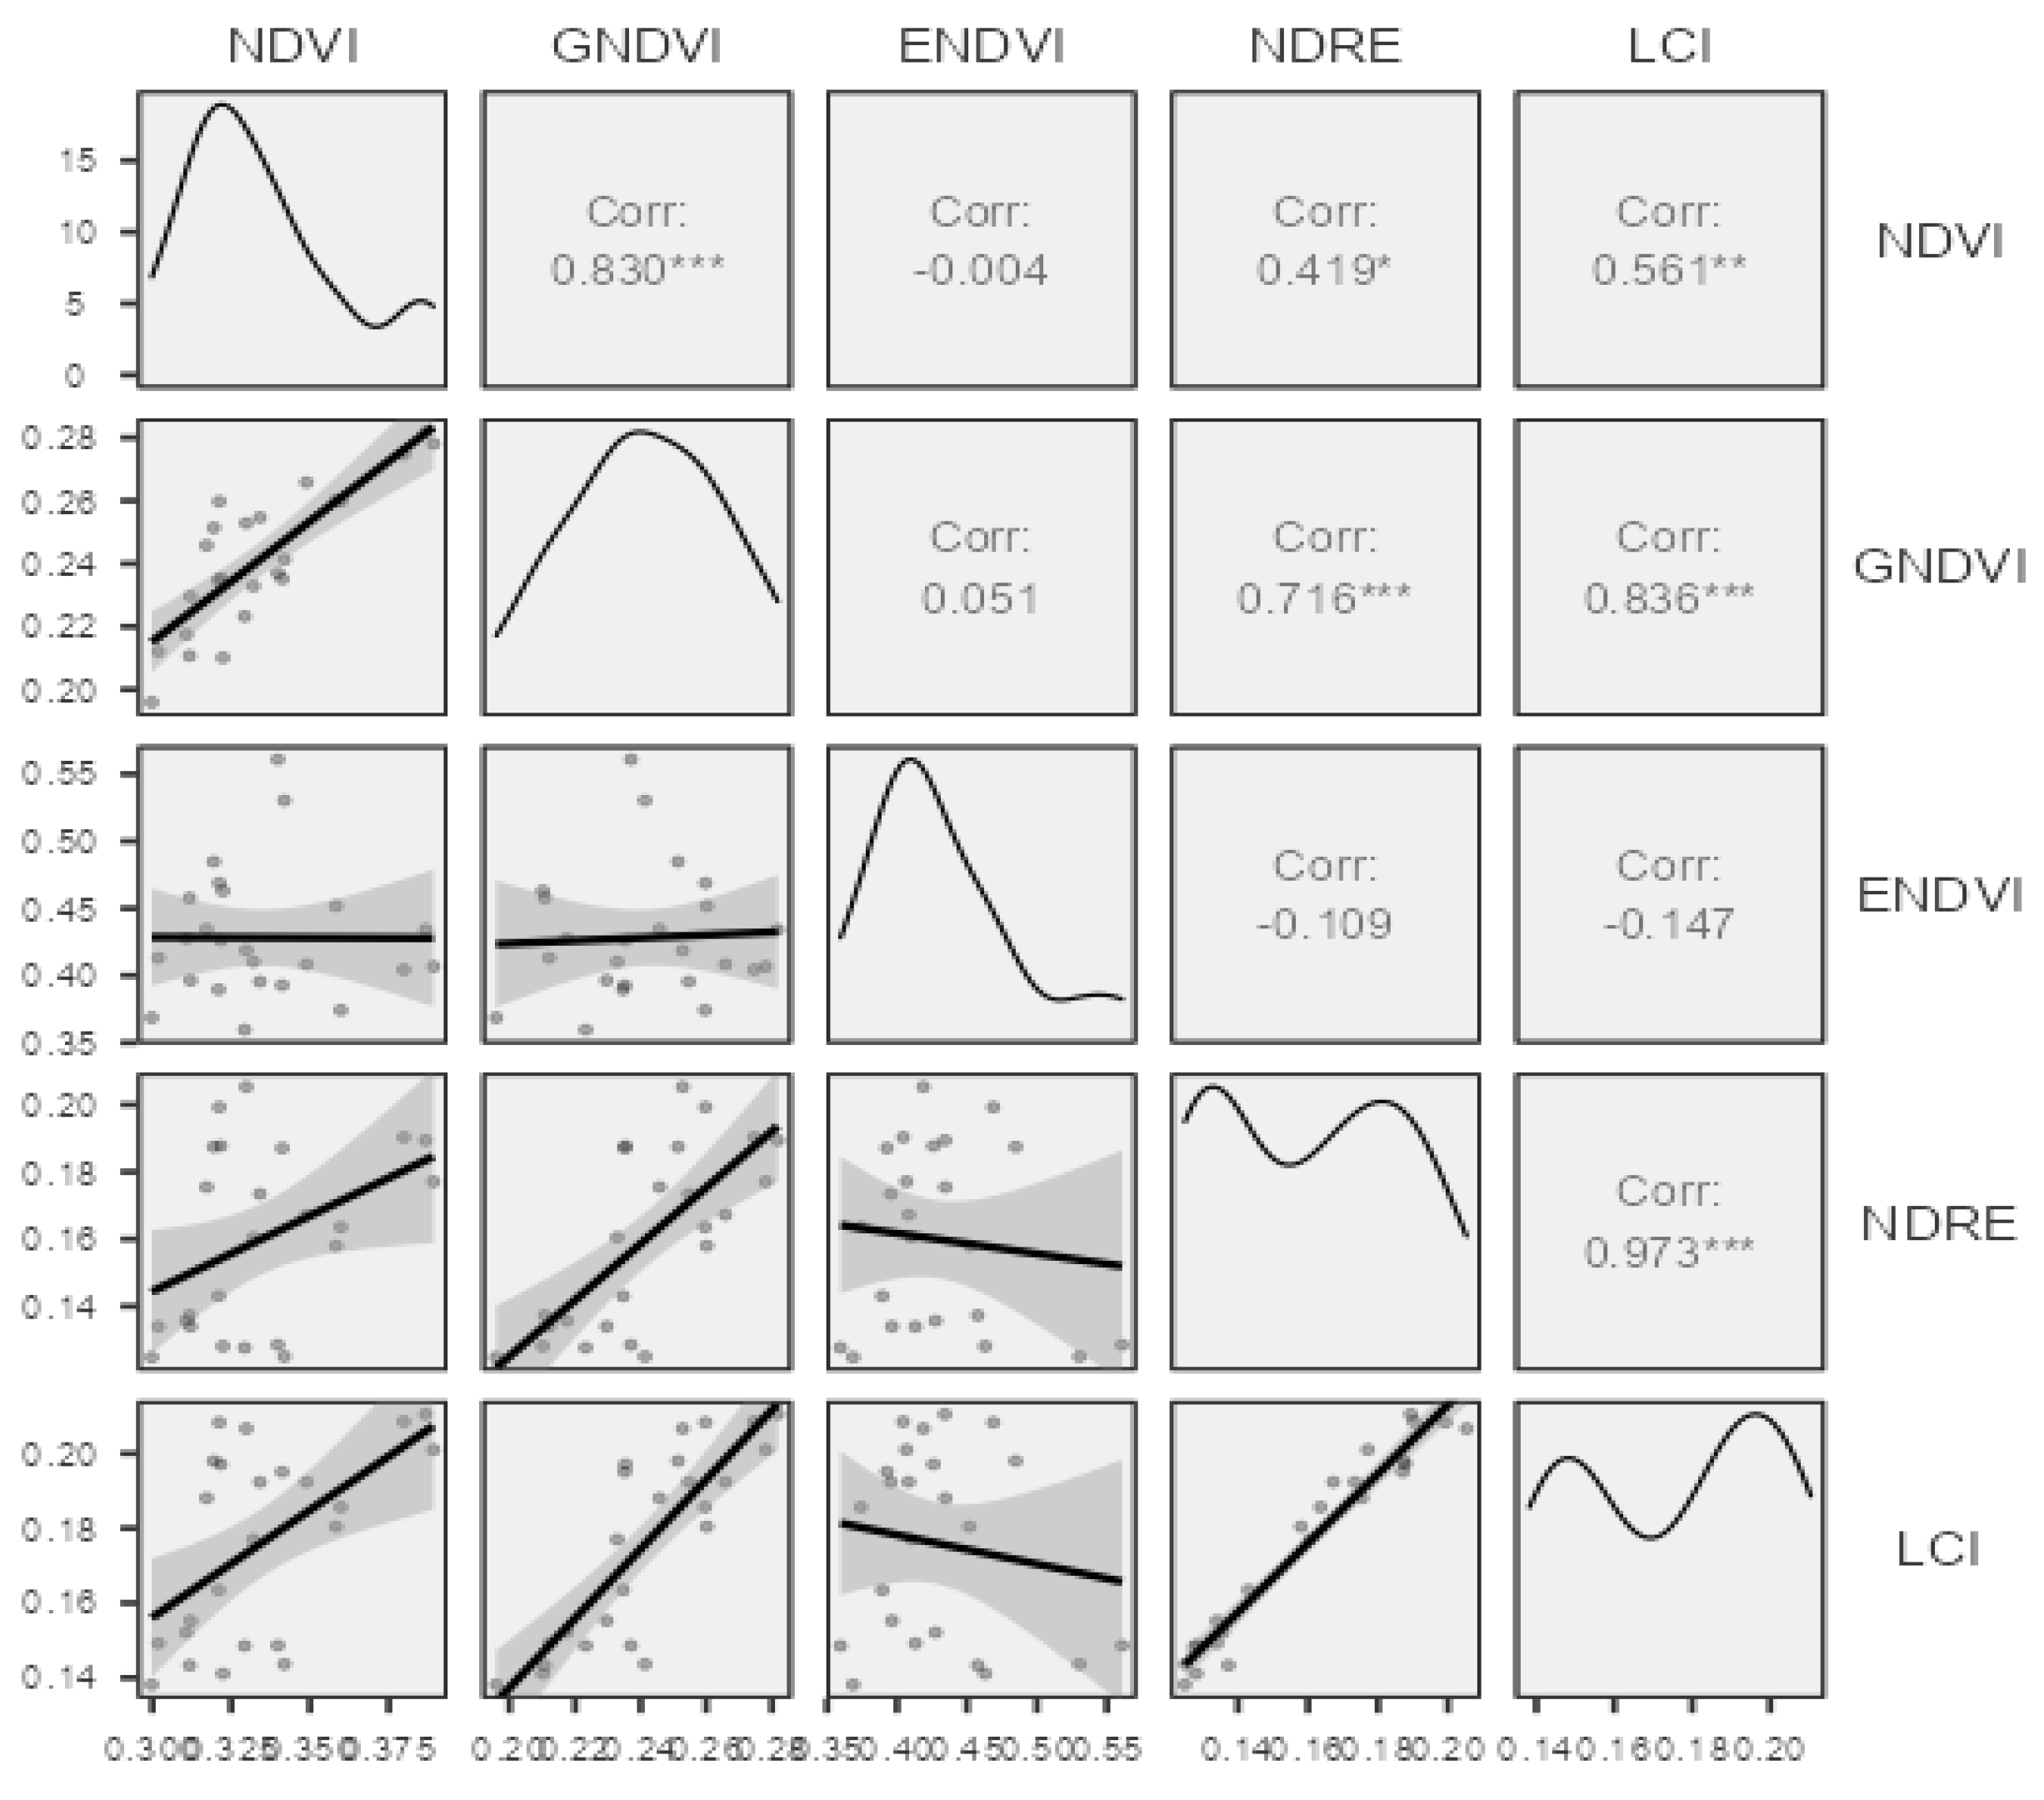
The authors were also interested in the correlation coefficients of the observed vegetation indices (Figure 5), and in determining which correlated positively. NDVI had a strong correlation with GNDVI (r = 0.83), a medium correlation with LCI (r = 0.56) and a weak correlation with NDRE (r = 0.419). There was also a strong correlation between the values in the case of LCI and GNDVI, with a value of r = 0.836. NDRE and GNDVI indices had correlation coefficients with a CCoeff of r = 0.716.
There was strong correlation between GNDVI and NDVI. This value can be attributed to the fact that both indexes used similar wavelengths in their formulae. The RNIR is very important in cases of any disease for which the symptoms include color changes [33]. For the visualization of the data and the R-based Software Jamovi 2.3.28 data analyses, the following packages were used [34,35,36,37,38].
3.2. Variance Analyses of the VI Values of the Dessert R78
One-way ANOVA was performed in R-based Jamovi 2.36. For the normality test (assumption check) of the dataset, we used Shapiro–Wilk and post-hoc Tukey tests for making comparisons of the significance of the variance analysis results, as shown in Table 2.
Table 2.
ANOVA results of NDVI Dessert R78.
One-way ANOVA was conducted to compare the means of the treatments gathered by five different vegetation indices. In Table 2, we can see the results of the NDVI. The NDVI values reveal the best results in the context of these types of infection; we can see that the NDVI values of CS 0 were significantly higher than those of high-dosed infection CS 10,000, with a mean difference of 0.05422 *** and p value of 4.43 × 10⁻⁵. The medium dosage CS 7500 also showed a statistically significantly different value from the non-infected CS 0 plots, with a mean difference of −0.03945 ** and p value 0.0017. Additional statistical differences were shown in the case of the CS 5000 (low dose infection) plots and between the CS 0 healthy parcels, with a mean difference of −0.03175 * and a p value of 0.01147.
In the case of GNDVI (Table 3), the averages measured in healthy areas were also higher than in the other plots, but statistically, the difference could only be verified in the case of the medium-dose CS 7500, with a mean difference of −0.03267 * and p value of 0.047 between the CS 0 healthy plots.
Table 3.
ANOVA results of GNDVI Dessert R78.
3.3. Data Distribution of Forage Maize P9025 Hybrid (T Hybrid)
It was also visible in the experimental area that after the infection there were no particularly obvious symptoms and deviations on the plants. It is well known that the disease can attack forage maize plants. However, fodder corns are much stronger and can produce a larger green mass than sweetcorn hybrids. Fodder corn stocks are basically much less demanding and have a higher stress tolerance against both abiotic and biotic stress. As can be seen in Figure 6, for each treatment, there were no significant differences between the mean values. In addition to these results, the one-way analysis of variance (ANOVA) did not show any significant differences between the mean values. In this case, each mean value was also calculated by means of zonal statistics in QGIS. Every parcel included 5000–5500 px data.
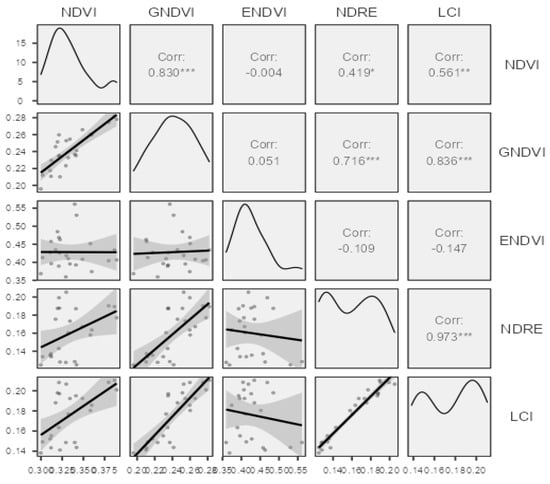
Figure 6.
Correlation matrix of the five different VIs. Note: * p < 0.05, ** p < 0.01, *** p < 0.001, one-tailed.
3.4. Comparison of Values of Hybrids Dessert R78 and P9025
The authors were also interested in comparing the VI values on a hybrid level and in checking their differences.
As is shown in Table 4, the NDVI performed excellently in comparing the values of the different hybrids. The forage maize hybrids showed a very high statistical difference in the mean vegetation values of NDVI. The mean difference of T 10,000 from CS 5000 was 0.05177 ** with a p value of 0.00537, from CS 7500 the mean difference was 0.059467 *** with a p value 9.11 × 10⁻⁴, and from CS 10,000 the mean difference was 0.07423 *** with a p value 2.47 × 10⁻⁵. The mean difference of T 5000 from CS 5000 was 0.05422 ** with a p value of 0.00309, the mean difference from CS 7500 was 0.061917 *** with a p value of 5.07 × 10⁻⁴, and the mean difference from CS 10.000 was 0.07668 *** with a p value of 1.34 × 10⁻⁵. The mean difference of T 7500 from CS 5000 was 0.0504 ** with a p value of 0.00727, while the mean difference from CS 7500 was 0.0581 ** with a p value of 0.00126, and the mean difference from CS 10,000 was 0.07287 *** with a p value of 3.47 × 10⁻⁵. The mean difference of T 0 non-infected from CS 5000 was 0.06703 ***, with a p value of 1.47 × 10⁻⁴, while the mean difference from CS 7500 was 0.074733 *** with a p value of 2.18 × 10⁻⁵, and the mean difference from CS 10,000 was 0.0895 *** with a p value of 5.48 × 10⁻⁷. The boxplot diagram for NDVI is shown in Figure 7.
Table 4.
Comparison of hybrid values of Dessert R78 and P9025 NDVI.
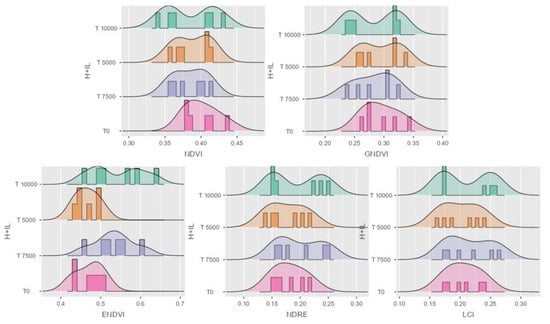
Figure 7.
Data distribution in histogram with density for the five VIs. NDVI, GNDVI, ENDVI, NDRE, and LCI in forage maize P9025 hybrid. H + IL stands for hybrid and infection level.
However, the results of non-treated sweet maize parcels in Figure 8 are not statistically different. The parcels could be distinguished not only morphologically, but also based on the collected digital vegetation index (VI) data. This differentiation is primarily due to the distinct and unique traits of the different hybrids of forage and sweet maize.
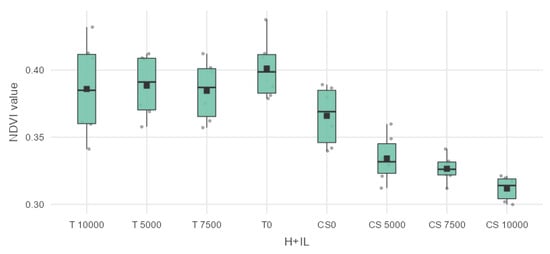
Figure 8.
Box plot and data distribution VI. NDVI for P9025 (T) and Dessert R78 (CS).
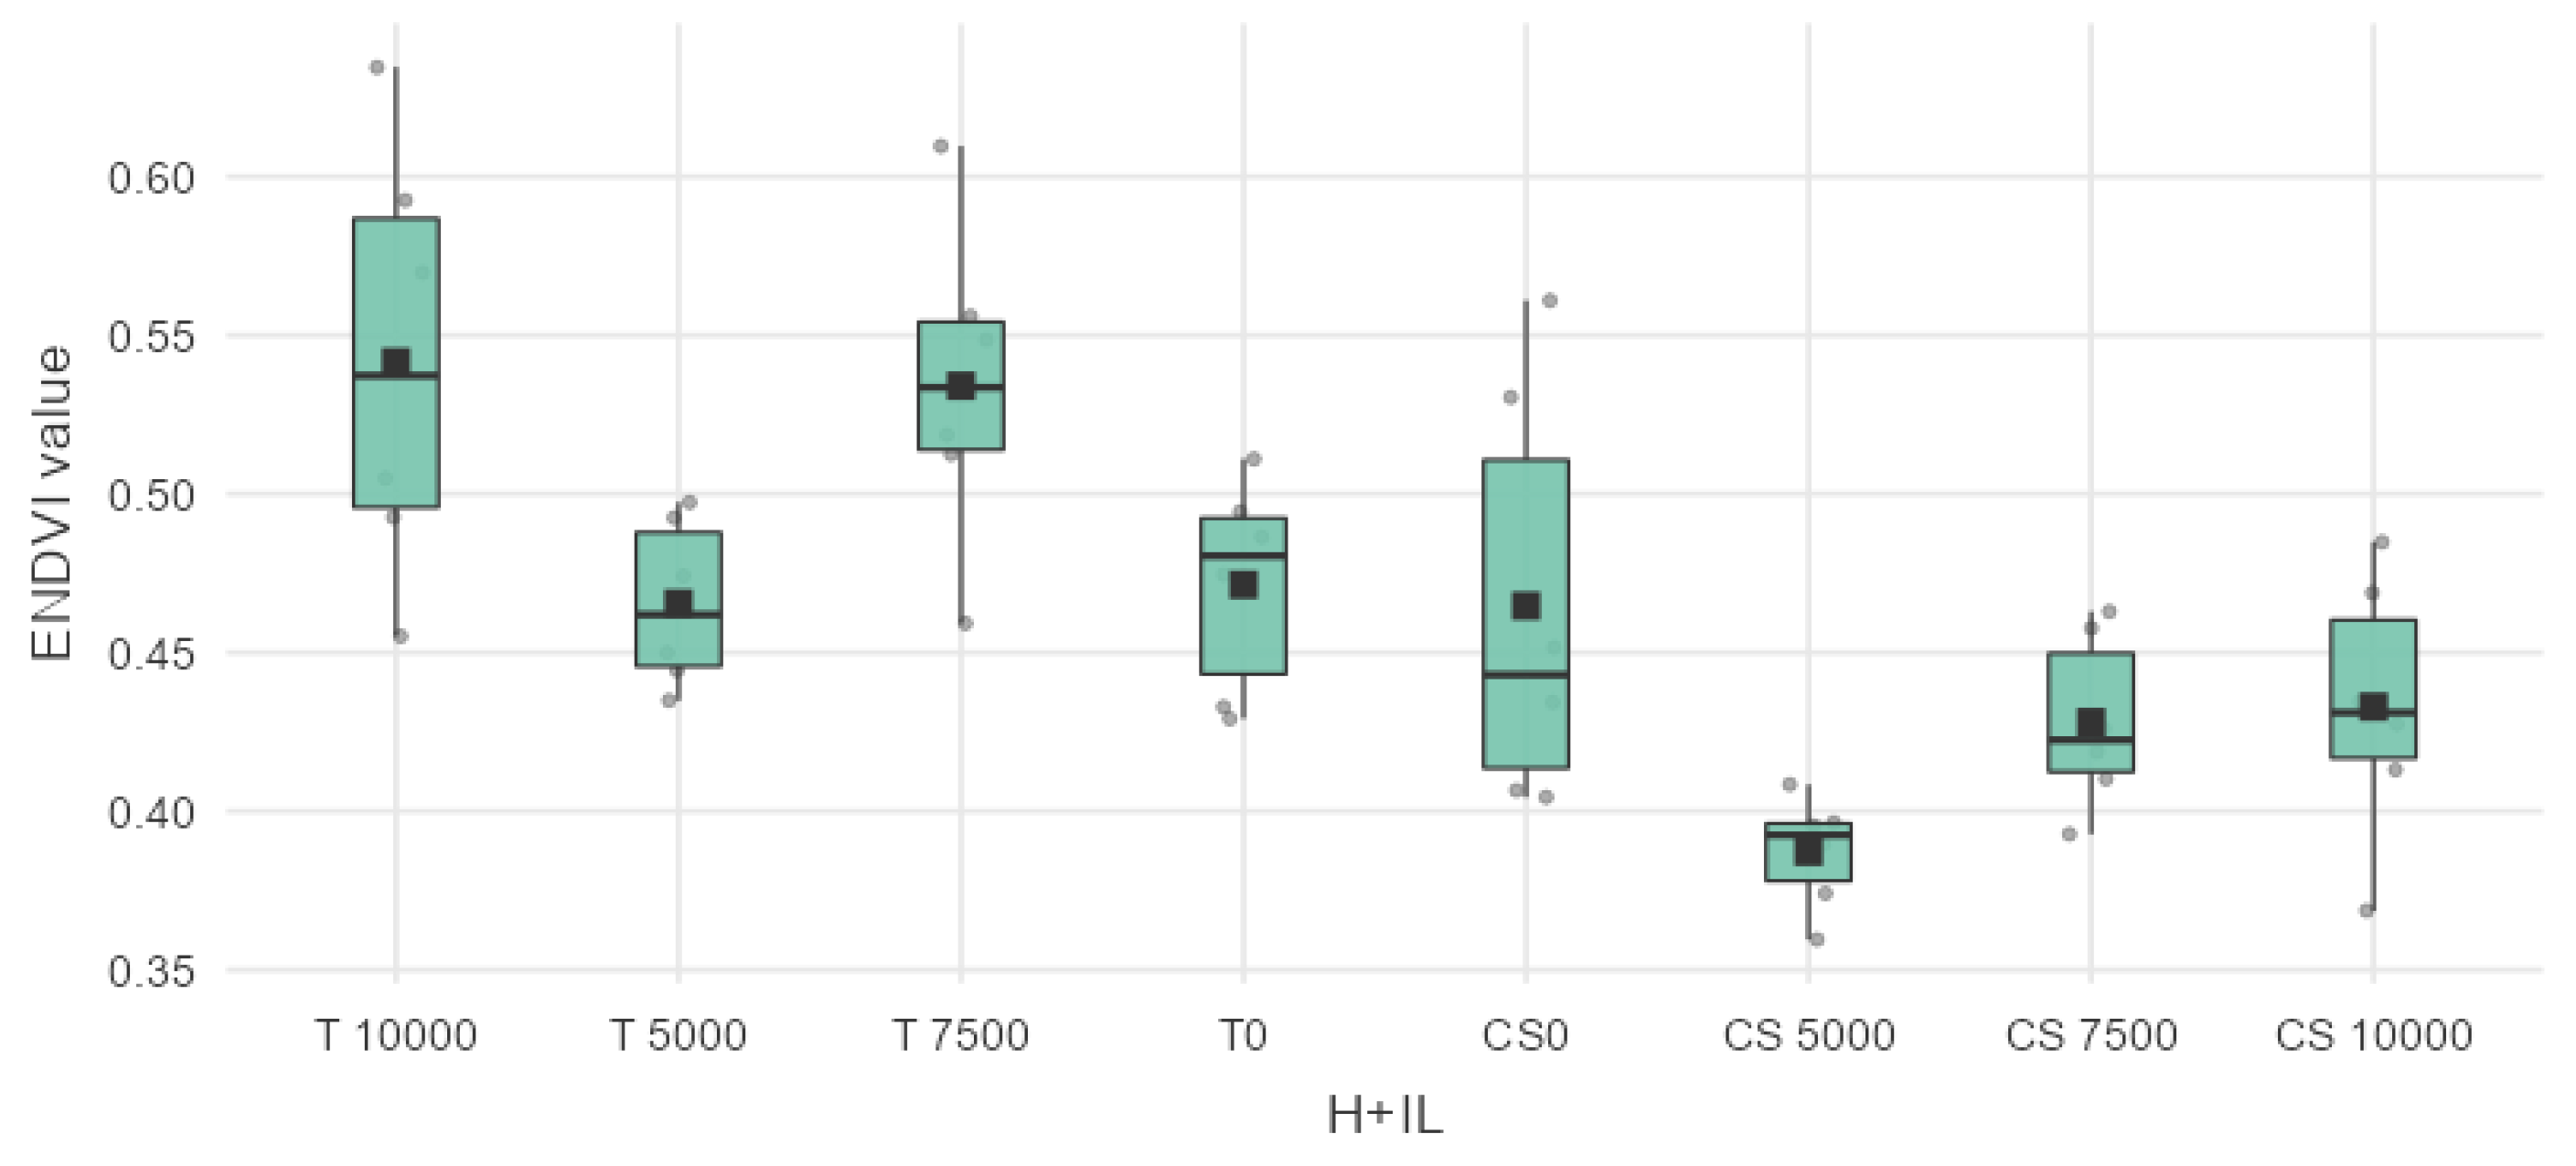
Among the five vegetation indices included in the experiments, the ENDVI (Enhanced Normalized Difference Vegetation Index) in Table 5 shows results worth mentioning in relation to the values of the hybrids.
Table 5.
Comparison of hybrid values of Dessert R78 and P9025 ENDVI.
When the values of ENDVI were as shown in the table, T 10,000 was found to be significantly different from CS 5000 with a mean difference of 0.15432 *** and p value 1.42 × 10⁻⁵, from CS 7500 with a mean difference of 0.11348 ** and a p value of 0.00195, and the high-dosed sweet maize plots CS 10,000 showed a mean difference of 0.108638 ** with a p value of 0.00338. T 5000 showed no statistical difference according to the ENDVI values. However, T 7500 forage maize was significantly different from CS 5000, with a mean difference 0.14681 *** and a p value of 3.59 × 10⁻⁵. T 7500 was also significantly different from CS 7500, with a mean difference of 0.10597 ** and a p value of 0.00456. CS 10,000 had a mean difference from T 7500 of 0.101127 ** with a p value of 0.00777. The non-infected forage maize parcel T 0 was also significantly different from CS 5000, with a mean difference of 0.08413 * and a p value of 0.0442. The results can be seen in the boxplot diagram in Figure 9.
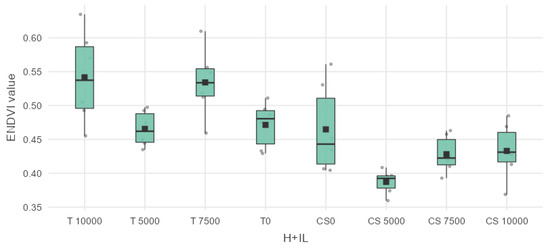
Figure 9.
Box plot and data distribution VI. ENDVI for P9025 (T) and Dessert R78 (CS).
From these results, it can be concluded that the plants can be separated at the hybrid level by applying the appropriate data filtering methods (such as separating soil and shadow pixel values and using only plant pixel values for further statistical analyses) after the monitoring observations were carried out in the appropriate phenological stages and the production of the digital maps. Vegetation indices can provide a useful tool for identifying plants at hybrid levels. In the case of this study, two indices were convincing: NDVI and ENDVI.
4. Discussion
In today’s world, we are surrounded by much data and information, both in our personal as well as our professional lives. In recent years, remote sensing and UAV technology have been developing at a rapid pace, resulting in a lot of scientific results and information being generated every year. The authors of the present research were interested in the application of multispectral technologies, and sought a deeper analysis of vegetation indices and their utility and relationships. This experiment involved two different hybrids, one forage maize hybrid Pioneer P 9025 (T hybrid) and one sweet maize hybrid Dessert R78 (CS hybrid). The research area belongs to the University of Debrecen (UD). There were 24 plots subjected to four treatments with three replications in a randomized order. The recordings were made with DJI Phantom 4 RTK MS UAV two times after the artificial infection. In the case of the sweet maize hybrid Dessert R78, the symptoms of the disease were clear and visible in all of the treated plots. The first aspect of the study concerned the distribution and correlation between the VI and the much more sensitive sweet maize hybrid. Observing spatial data distribution can help in the selection of indices used for further analyses.
The key findings of this study are as follows. The effectiveness of using NDVI in Ustilago infection detection was determined. The NDVI index here differentiated between healthy and treated plots of Dessert R78 (CS Hybrid). NDVI proved to be a reliable tool for assessing disease severity levels, agreeing with several previous studies. GNDVI was also shown to be a great tool in assessing Ustilago infection in the sweet maize hybrid Dessert R78. The high correlations between indices also reinforce the reliability of these indices in identifying different biotic or abiotic stressors in the field environment. The hybrid-specific responses in P9025 and Dessert R78 can also be seen from the VI data, as the forage maize values were consistent throughout and the VI values of the sweet maize varied with different infection levels, especially in terms of NDVI and GNDVI. The differences in the VI values between the observed hybrids (NDVI and ENDVI) suggest that UAV-based multispectral imaging is a promising tool for distinguishing maize hybrids.
A high CorrCoeff. between NDVI and GNDVI (r = 0.83) was also observed by Njane et al. in 2023 [39]. The variance analyses results of the sweet maize Dessert R78 hybrid were very positive in the case of the NDVI. In the case of NDVI, there were significant differences between healthy (CS 0) and infected (CS 5000, 7500, and 10,000) plots. The values of the healthy plot differed from the values of all three diseased plots. Zhao et al. also used NDVI for crop disease severity identification [20]. Bhandari et al. also used UAV-based NDVI for assessing winter wheat foliage disease. This type of disease also has the same symptoms as Ustilago maydis (DC) Corda, affecting the color and cell structure of the plant’s leaves [40].
The results of the GNDVI index were also promising, but only in one case was it possible to detect significant difference between the CS 0 and CS 7500 plots. However, GNDVI is also a great tool for disease severity identification. For example, Luo et al. used this approach to monitor the severity of MDV (maize dwarf mosaic virus), with great results [41]. The results relate the authors’ expectations that this forage maize hybrid P9025 will be much more resistant to the disease and will produce relatively similar values in all treatments. At the field scale, the symptoms were hardly visible, and the plants were vigorous. Comparing the hybrid values yielded a great result also in the case of the NDVI and ENDVI. UAV imagery-based plant hybrid identification is a widely researched area. Santana et al. used UAV-based MS imagery for sorghum hybrid identification, as well as ML techniques [42]. Liu et al. also used UAV-based MS technology for hybrid rice seed production [43]. RS-based techniques, such as analyzing VI values for the identification of plant stress in maize, give very significant results in professional studies. For instance, Wang et al. in 2016 used NDVI for time-based analyses to assess plant stress in maize. NDVI is a very widely analyzed tool [44]. RS-based data collection and the construction of UAV MS imagery with properly applied methods contribute to extracting additional meaningful information for researchers and also for farmers.
5. Conclusions
In summary, it can be concluded from the research that vegetation indices, especially NDVI and GNDVI, are particularly well suited to identifying plant diseases and assessing their severity levels (included in Section 3.1). Plenty of information can be collected from the observed areas with remote sensing (RS) techniques, performed using multispectral camera systems (MCS), and very valuable information can be obtained by the correct application of the appropriate methods. Vegetation indices (VIs) can also play an important role in the identification of different plant hybrids. In the case of the hybrid separation analyses (included in Section 3.4), two indices (NDVI, ENDVI) performed excellently.
Author Contributions
L.R. (László Radócz 1), data curation, methodology, writing of the manuscript and performing measurements; Á.I. and C.J., writing—review and editing; L.R. (László Radócz 2), review and conceptualization; P.R., formal analysis, review; A.T., project administration, corresponding author and review of the manuscript. All authors have read and agreed to the published version of the manuscript.
Funding
This research was supported by the ÚNKP-23-3 new national excellence program of the ministry for culture and innovation from the source of the national research, development and innovation fund.
Institutional Review Board Statement
Not applicable.
Data Availability Statement
All the data supporting the conclusions of this article are included in this article.
Conflicts of Interest
The authors declare no conflicts of interest.
References
- Delgado, J.A.; Short, N.M., Jr.; Roberts, D.P.; Vandenberg, B. Big data analysis for sustainable agriculture on a geospatial cloud framework. Front. Sustain. Food Syst. 2019, 3, 54. [Google Scholar] [CrossRef]
- Berry, J.K.; Delgado, J.A.; Khosla, R.; Pierce, F.J. Precision conservation for environ-mental sustainability. J. Soil Water Conserv. 2003, 58, 332–339. [Google Scholar]
- Aubert, B.A.; Schroeder, A.; Grimaudo, J. IT as enabler of sustainable farming: An empirical analysis of farmers’ adoption decision of precision agriculture technology. Decis. Support Syst. 2012, 54, 510–520. [Google Scholar] [CrossRef]
- Pierpaolia, E.; Carlia, G.; Pignattia, E.; Canavaria, M. Drivers of precision ag-riculture technologies adoption: A literature review. Proc. Technol. 2013, 8, 61–69. [Google Scholar] [CrossRef]
- Gebbers, R.; Adamchuk, V. Precision agriculture and food security. Science 2010, 327, 828–831. [Google Scholar] [CrossRef] [PubMed]
- Zhang, N.; Wang, M.; Wang, N. Precision agriculture—A worldwide overview. Comput. Electron. Agric. 2002, 36, 113–132. [Google Scholar] [CrossRef]
- Bongiovanni, R.; Lowenberg-DeBoer, J. Precision agriculture and sustainability. Precis. Agric. 2004, 5, 359–387. [Google Scholar] [CrossRef]
- Sishodia, R.P.; Ray, R.L.; Singh, S.K. Applications of remote sensing in preci-sion agriculture: A review. Remote Sens. 2020, 12, 3136. [Google Scholar] [CrossRef]
- Whitehead, K.; Hugenholtz, C.H.; Myshak, S.; Brown, O.; LeClair, A.; Tamminga, A.; Barchyn, T.E.; Moorman, B.; Eaton, B. Remote sensing of the environment with small unmanned aircraft systems (UASs), part 2: Scientific and commercial applications. Drone Syst. Appl. 2014, 2, 86–102. [Google Scholar] [CrossRef]
- Chang, C.Y.; Zhou, R.; Kira, O.; Marri, S.; Skovira, J.; Gu, L.; Sun, Y. An Unmanned Aerial System (UAS) for concurrent measurements of solar induced chlorophyll fluo-rescence and hyperspectral reflectance toward improving crop monitoring. Agric. For. Meteorol. 2020, 294, 108145. [Google Scholar] [CrossRef]
- Nagasubramanian, K.; Jones, S.; Singh, A.K.; Sarkar, S.; Singh, A.; Ganapathysubramanian, B. Plant disease identifcation using explainable 3D deep learning on hyperspectral images. Plant Methods 2019, 15, 98. [Google Scholar] [CrossRef] [PubMed]
- Chlingaryan, A.; Sukkarieh, S.; Whelan, B. Machine learning approaches for crop yield prediction and nitrogen status estimation in precision agriculture: A review. Comput. Electron. Agric. 2018, 151, 61–69. [Google Scholar] [CrossRef]
- Available online: https://www.ksh.hu/stadat_files/mez/hu/mez0012.html (accessed on 4 June 2024).
- Huzsvai, L.; Zsembeli, J.; Kovács, E.; Juhász, C. Response of winter wheat (Triticum aestivum L.) yield to the increasing weather fluctuations in a continental re-gion of four-season climate. Agronomy 2022, 12, 314. [Google Scholar] [CrossRef]
- Liu, L.; Dong, Y.; Huang, W.; Du, X.; Ren, B.; Huang, L.; Zheng, Q.; Ma, H. A disease index for efficiently detecting wheat fusarium head blight using sentinel-2 multispec-tral imagery. IEEE Access 2020, 8, 52181–52191. [Google Scholar] [CrossRef]
- Yu, R.; Luo, Y.; Zhou, Q.; Zhang, X.; Wu, D.; Ren, L. Early detection of pine wilt disease using deep learning algorithms and UAV-based multispectral imagery. For. Ecol. Manag. 2021, 497, 119493. [Google Scholar] [CrossRef]
- Kerkech, M.; Hafiane, A.; Canals, R. VddNet: Vine disease detection network based on multispectral images and depth map. Remote Sens. 2020, 12, 3305. [Google Scholar] [CrossRef]
- Zhang, S.; Li, X.; Ba, Y.; Lyu, X.; Zhang, M.; Li, M. Banana fusarium wilt disease detection by supervised and unsupervised methods from UAV-based multi-spectral imagery. Remote Sens. 2022, 14, 1231. [Google Scholar] [CrossRef]
- Bendel, N.; Kicherer, A.; Backhaus, A.; Klück, H.C.; Seiffert, U.; Fischer, M.; Voegele, R.T.; Töpfer, R. Evaluating the suitability of hyper-and multispectral imaging to detect foliar symptoms of the grapevine trunk disease Esca in vineyards. Plant Methods 2020, 16, 142. [Google Scholar] [CrossRef]
- Zhao, H.; Yang, C.; Guo, W.; Zhang, L.; Zhang, D. Automatic estimation of crop disease severity levels based on vegetation index normalization. Remote Sens. 2020, 12, 1930. [Google Scholar] [CrossRef]
- Izzuddin, M.A.; Nisfariza, M.N.; Ezzati, B.; Idris, A.S.; Steven, M.D.; Boyd, D. Analysis of airborne hyperspectral image using vegetation indices, red edge position and continuum removal for detection of ganoderma disease in oil palm. J. Oil Palm Res. 2018, 30, 416–428. [Google Scholar]
- Wu, G.; Fang, Y.; Jiang, Q.; Cui, M.; Li, N.; Ou, Y.; Diao, Z.; Zhang, B. Early identification of strawberry leaves disease utilizing hyperspectral imaging combing with spectral features, multiple vegetation indices and textural features. Comput. Electron. Agric. 2023, 204, 107553. [Google Scholar] [CrossRef]
- Szőke, L.; Moloi, M.J.; Kovács, G.E.; Biró, G.; Radócz, L.; Hájos, M.T.; Kovács, B.; Rácz, D.; Danter, M.; Tóth, B. The application of phytohormones as biostimulants in corn smut infected Hungarian sweet and fodder corn hybrids. Plants 2021, 10, 1822. [Google Scholar] [CrossRef] [PubMed]
- Radócz, L.; Szabó, A.; Tamás, A.; Illés, Á.; Bojtor, C.; Ragán, P.; Vad, A.; Széles, A.; Harsányi, E.; Radócz, L. Investigation of the detectability of corn smut fungus (ustilago maydis dc. Corda) infection based on uav multispectral technology. Agronomy 2023, 13, 1499. [Google Scholar] [CrossRef]
- DJI Sky City, No. 55 Xianyuan Road, Nanshan District, Shenzhen, China. Available online: https://www.dji.com/hu/p4-multispectral/specs (accessed on 4 June 2024).
- Vacca, G. WEB open drone map (WebODM) a software open source to photo-grammetry process. In Proceedings of the Fig Working Week 2020, Smart Surveyors for Land and Water Management, Amsterdam, The Netherlands, 10–14 May 2020. [Google Scholar]
- Congedo, L. Semi-Automatic Classification Plugin: A Python tool for the download and processing of remote sensing images in QGIS. J. Open Source Softw. 2021, 6, 3172. [Google Scholar] [CrossRef]
- Tucker, C.J. Red and photographic infrared linear combinations for monitoring vegetation. Remote Sens. Environ. 1979, 8, 127–150. [Google Scholar] [CrossRef]
- Rasmussen, J.; Ntakos, G.; Nielsen, J.; Svensgaard, J.; Poulsen, R.N.; Christensen, S. Are vegetation indices derived from consumer-grade cameras mounted on UAVs sufficiently reliable for assessing experimental plots? Eur. J. Agron. 2016, 74, 75–92. [Google Scholar] [CrossRef]
- Gitelson, A.A.; Merzlyak, M.N. Remote sensing of chlorophyll concentration in higher plant leaves. Adv. Space Res. 1998, 22, 689–692. [Google Scholar] [CrossRef]
- Barnes, E.M.; Clarke, T.R.; Richards, S.E.; Colaizzi, P.D.; Haberland, J.; Kostrzewski, M.; Waller, P.; Choi, C.; Riley, E.; Thompson, T. Coincident detection of crop water stress, nitrogen status and canopy density using ground based multispectral data. In Proceedings of the 5th International Conference on Precision Agriculture and Other Resource Management, Bloomington, MN, USA, 16–19 July 2000. [Google Scholar]
- Datt, B. A new reflectance index for remote sensing of chlorophyll content in higher plants: Tests using Eucalyptus leaves. J. Plant. Physiol. 1999, 154, 30–36. [Google Scholar] [CrossRef]
- Zahir, S.A.D.M.; Omar, A.F.; Jamlos, M.F.; Azmi, M.A.M.; Muncan, J. A review of visible and near-infrared (Vis-NIR) spectroscopy application in plant stress detection. Sens. Actuators A Phys. 2022, 338, 113468. [Google Scholar] [CrossRef]
- The Jamovi Project. Jamovi. (Version 2.3) [Computer Software]. 2022. Available online: https://www.jamovi.org (accessed on 4 June 2024).
- R Core Team. R: A Language and Environment for Statistical Computing. (Version 4.1) [Computer Software]. (R Packages Retrieved from MRAN Snapshot 2022-01-01). 2021. Available online: https://cran.r-project.org (accessed on 4 June 2024).
- Wickham, H.; Chang, W.; Henry, L.; Pedersen, T.L.; Takahashi, K.; Wilke, C.; Woo, K.; RStudio. Ggplot2: Create Elegant Data Visualisations Using the Grammar of Graphics. [R Package]. 2018. Available online: https://CRAN.R-project.org/package=ggplot2 (accessed on 4 June 2024).
- Patil, I. Ggstatsplot: ‘ggplot2’ Based Plots with Statistical Details. [R Package]. 2018. Available online: https://CRAN.R-project.org/package=ggstatsplot (accessed on 4 June 2024).
- Serdar Balci. ClinicoPath Jamovi Module [R Package]. 2022. Available online: https://github.com/sbalci/ClinicoPathJamoviModule (accessed on 4 June 2024). [CrossRef]
- Njane, S.N.; Tsuda, S.; Sugiura, R.; Katayama, K.; Goto, K.; Tsuchiya, S.; Tsuji, H. Phenotyping system for precise monitoring of potato crops during growth. Eng. Agric. Environ. Food 2023, 16, 24–36. [Google Scholar] [CrossRef]
- Bhandari, M.; Ibrahim, A.M.; Xue, Q.; Jung, J.; Chang, A.; Rudd, J.C.; Maeda, M.M.; Rajan, N.; Neely, H.; Landivar, J. Assessing winter wheat foliage disease severity using aerial imagery acquired from small Unmanned Aerial Vehicle (UAV). Comput. Electron. Agric. 2020, 176, 105665. [Google Scholar] [CrossRef]
- Luo, L.; Chang, Q.; Wang, Q.; Huang, Y. Identification and severity monitor-ing of maize dwarf mosaic virus infection based on hyperspectral measurements. Remote Sens. 2021, 13, 4560. [Google Scholar] [CrossRef]
- Santana, D.C.; Theodoro, G.d.F.; Gava, R.; de Oliveira, J.L.G.; Teodoro, L.P.R.; de Oliveira, I.C.; Baio, F.H.R.; da Silva Junior, C.A.; de Oliveira, J.T.; Teodoro, P.E. A New Approach to Identifying Sorghum Hy-brids Using UAV Imagery Using Multispectral Signature and Machine Learning. Algorithms 2024, 17, 23. [Google Scholar] [CrossRef]
- Liu, H.; Qi, Y.; Xiao, W.; Tian, H.; Zhao, D.; Zhang, K.; Xiao, J.; Lu, X.; Lan, Y.; Zhang, Y. Identifica-tion of male and female parents for hybrid rice seed production using UAV-based mul-tispectral imagery. Agriculture 2022, 12, 1005. [Google Scholar] [CrossRef]
- Wang, R.; Cherkauer, K.; Bowling, L. Corn response to climate stress detected with satellite-based NDVI time series. Remote Sens. 2016, 8, 269. [Google Scholar] [CrossRef]


Disclaimer/Publisher’s Note: The statements, opinions and data contained in all publications are solely those of the individual author(s) and contributor(s) and not of MDPI and/or the editor(s). MDPI and/or the editor(s) disclaim responsibility for any injury to people or property resulting from any ideas, methods, instructions or products referred to in the content. |
© 2024 by the authors. Licensee MDPI, Basel, Switzerland. This article is an open access article distributed under the terms and conditions of the Creative Commons Attribution (CC BY) license (https://creativecommons.org/licenses/by/4.0/).