Article

Model for Detecting Boom Height Based on an Ultrasonic Sensor for the Whole Growth Cycle of Wheat

1
Intelligent Equipment Research Center, Beijing Academy of Agriculture and Forestry Sciences, Beijing 100097, China
2
Information Technology Research Center, Beijing Academy of Agriculture and Forestry Sciences, Beijing 100097, China
3
College of Mechanical and Electrical Engineering, Xinjiang Agricultural University, Urumqi 830052, China
4
National Engineering Research Center for Information Technology in Agriculture, Beijing 100097, China
5
College of Agricultural Engineering, Jiangsu University, Zhenjiang 212013, China
*
Authors to whom correspondence should be addressed.
Agriculture 2024, 14(1), 21; https://doi.org/10.3390/agriculture14010021
Submission received: 26 October 2023 / Revised: 14 December 2023 / Accepted: 15 December 2023 / Published: 22 December 2023
(This article belongs to the Topic Current Research on Intelligent Equipment for Agriculture)

Abstract

:
Ultrasonic feedback energy is affected by the variety, planting, and growth state of crops; therefore, it is difficult to find applications for this energy in precision agriculture systems. To this end, an ultrasonic sensor was mounted in a spray boom height detection system. Winter wheat was used as the test object to obtain feedback energy values for the spray boom height from the top of the wheat in the field during six critical growth stages: the standing stage, the jointing stage, the booting stage, the heading stage, the filling stage, and the maturity stage. The relationship between the actual value of the height from the spray boom at the top of the wheat (Habw) and the detected value of the height from the spray boom at the top of the wheat (Hdbw) was analyzed. A spray boom height detection model based on the ultrasonic sensor during the full growth cycle of wheat was determined. Field validation tests showed that the applicability of the spray boom height detection distance (Dd) of the spray boom height detection model proposed in the present study was 450~950 mm. Within the applicable Dd range, the detection error of the detection model was ≤50 mm during the full growth cycle. This study provides a method for constructing a boom height detection model based on the whole growth cycle of wheat, which improves the reliability and accuracy of ultrasonic boom height detection for different wheat growth stages. The proposed method solves the problem of low accuracy of repeated detection of low-cost ultrasonic sensors in different environments and can provide technical support for improving field applications of the boom height control system based on ultrasonic sensors.

1. Introduction

With the rapid development of smart agriculture in China, automated farms and smart machines have become realistic and essential tools for realizing smart agriculture [1]. As a core technology on automated farms, measurement and control systems composed of various sensors provide important guidance for the development of smart agriculture. The real-time information input for the operation of an automated farm is the direct source of information for smart agricultural machinery to achieve specific operations [2,3]. As the most widely used ground equipment for field spraying on automated farms, the boom sprayer has the advantages of wide working width and high efficiency. However, when spraying narrow-row crops, due to the crop growth, morphology at different growth stages, and uneven ground, regulating the spray boom height poses a great challenge. Boom height is a key parameter for spray uniformity. If it is too low, it will lead to uneven spray dispersion [4,5] and can even cause destructive contact between the spray boom and crops [6]. If it is too high, it will lead to droplet drift [7,8,9]. Therefore, the detection of the height variation between the spray boom and the top of the crop canopy has become particularly important. This is the basis for a regulated spray boom height control system, and the detection accuracy directly affects the regulation performance of the control system. The study of boom height detection technology can provide accurate and effective detection input for spray boom height control systems and is key for improving the spray quality of autonomous boom sprayers and pest control on automated farms.
The height of the spray boom refers to the distance from the spray boom to the top of the crop canopy. At present, the sensors for real-time detection of the height of the spray boom and its own position mostly use laser sensors, angle sensors, infrared sensors, wire sensors, and contact sensors. Ultrasonic sensors, which are not equally affected when working in the field environment, offer different performance. Laser sensors have relatively fast data acquisition speeds [10], but their scattering properties are poor, and it is difficult to provide effective data for wheat with narrow leaves and irregular leaf surfaces [11]. Under indoor conditions, the straight-line characteristics of laser sensors perform better, and the measurement results are reliable. However, the conditions of use in the field environment are more stringent. Sudden changes in the crop canopy will reduce the accuracy of a LiDAR sensor [12]. Ground height estimation can fail when faced with dense plots without exposed soil [13], and LiDAR data require supporting processing software for subsequent data processing [14]. An angle sensor can be used to monitor the tilt angle of a spray boom or machine. It is usually installed at the bottom of the chassis center or the spray boom center as the basis for leveling the spray boom [15]. However, the angle sensor can only monitor the tilt angle of the spray boom relative to terrain changes. Based on the tilt angle of the spray boom itself, when the height of the canopy under the spray boom on both sides is different, the control system also needs to fuse the signal input of other distance sensors to achieve tilt profiling of the spray boom. By using an infrared sensor to observe the position of the nozzle boom, it can be found that the change is related to irregular ground [16], but an infrared sensor is sensitive to ambient light. In a field environment, sunlight and other heat sources can interfere with the measurement results of infrared sensors. A contact sensor can be installed under a spray boom through a mounting plate. When the height of the spray boom changes, the height contact rod will elastically deform [17]. Although this detection method is simple, the contact sensor can only use the field topographic change as the input. Because the height of the spray boom is adjusted, the change in the top height of the canopy cannot be detected, and the growth characteristics of the crops being sprayed are isolated, which can damage the crops. For an ultrasonic sensor, the distance between the object and sensor is calculated based on the time elapsed from the transmitting signal to the receiving reflected signal and the known value of the sound speed in air. For the height detection of some crops, an ultrasonic sensor offers relatively good performance and correlation [18,19,20,21,22], and it is also the main sensor used to detect the height of the spray boom [12]. Ultrasonic sensors have the advantages of high repeatability detection accuracy in the same environment [23], are more user-friendly than LiDAR sensors [14], and are less expensive. Ultrasonic sensors have been used for different agricultural purposes [24] for a long time. However, when applied in the field, the echo energy and distance detection of ultrasonic sensors are still sensitive to the influence of factors such as the measured density, growth change, and crop growth conditions. Considering the influence of canopy density, some researchers have studied the relationship between the echo energy of ultrasonic sounding and crop canopy density to obtain information such as crop biomass and morphology [25,26,27,28]. For crop growth, some researchers have studied the relationship between the changes in crop morphological size and canopy structure under dynamic conditions, applying the detection of ultrasonic sensors to obtain control inputs and modify the target application rate in real time [29,30,31]. In response to changes in individual crop heights, some researchers have used data filtering methods such as crop height comparison and outlier clustering in the field to improve the stability of distance detection by ultrasonic sensors [32,33]. For the field wheat canopy, some researchers have investigated the variation characteristics of spray boom height based on ultrasonic sensing height information acquired at different positions of the spray boom. The K-means clustering algorithm has been used to improve the ultrasonic detection accuracy, which is an important aspect of a boom height automatic adjustment system. This provides a theoretical basis for the development of an automatic boom height adjustment system [34]. However, due to the irregular beam reflecting surface of a wheat canopy, an ultrasonic beam may detect the plant stalks and branches below the canopy, causing Hdbw to be greater than Habw, and when the wheat density is lower, the non-canopy top results detected by the sensor are greater [35]. Different growth stages of wheat cause great differences in plant morphology and density, which makes this problem more prominent. It is difficult to guarantee the stability of detection accuracy using ultrasonic boom height detection.
In summary, ultrasonic detection technology has realized the real-time detection of crop information, but the detection accuracy is still low when repeated detection is performed during different crop growth stages. Current studies still lack consideration of the influence of leaf morphology and plant height of crops in different growth stages on ultrasonic detection, which can form a bottleneck that restricts the application of ultrasonic sensors for accurate control. To address the above problems, a wheat height detection system was built based on an ultrasonic sensor, and field detection experiments during the six main growth stages of wheat were designed to investigate the detection variation in the ultrasonic sensor under different growth stages and different Dd. An ultrasound-based field detection model for the full growth cycle of wheat was built, which provided reliable detection model support for the boom height control system.

2. Materials and Methods

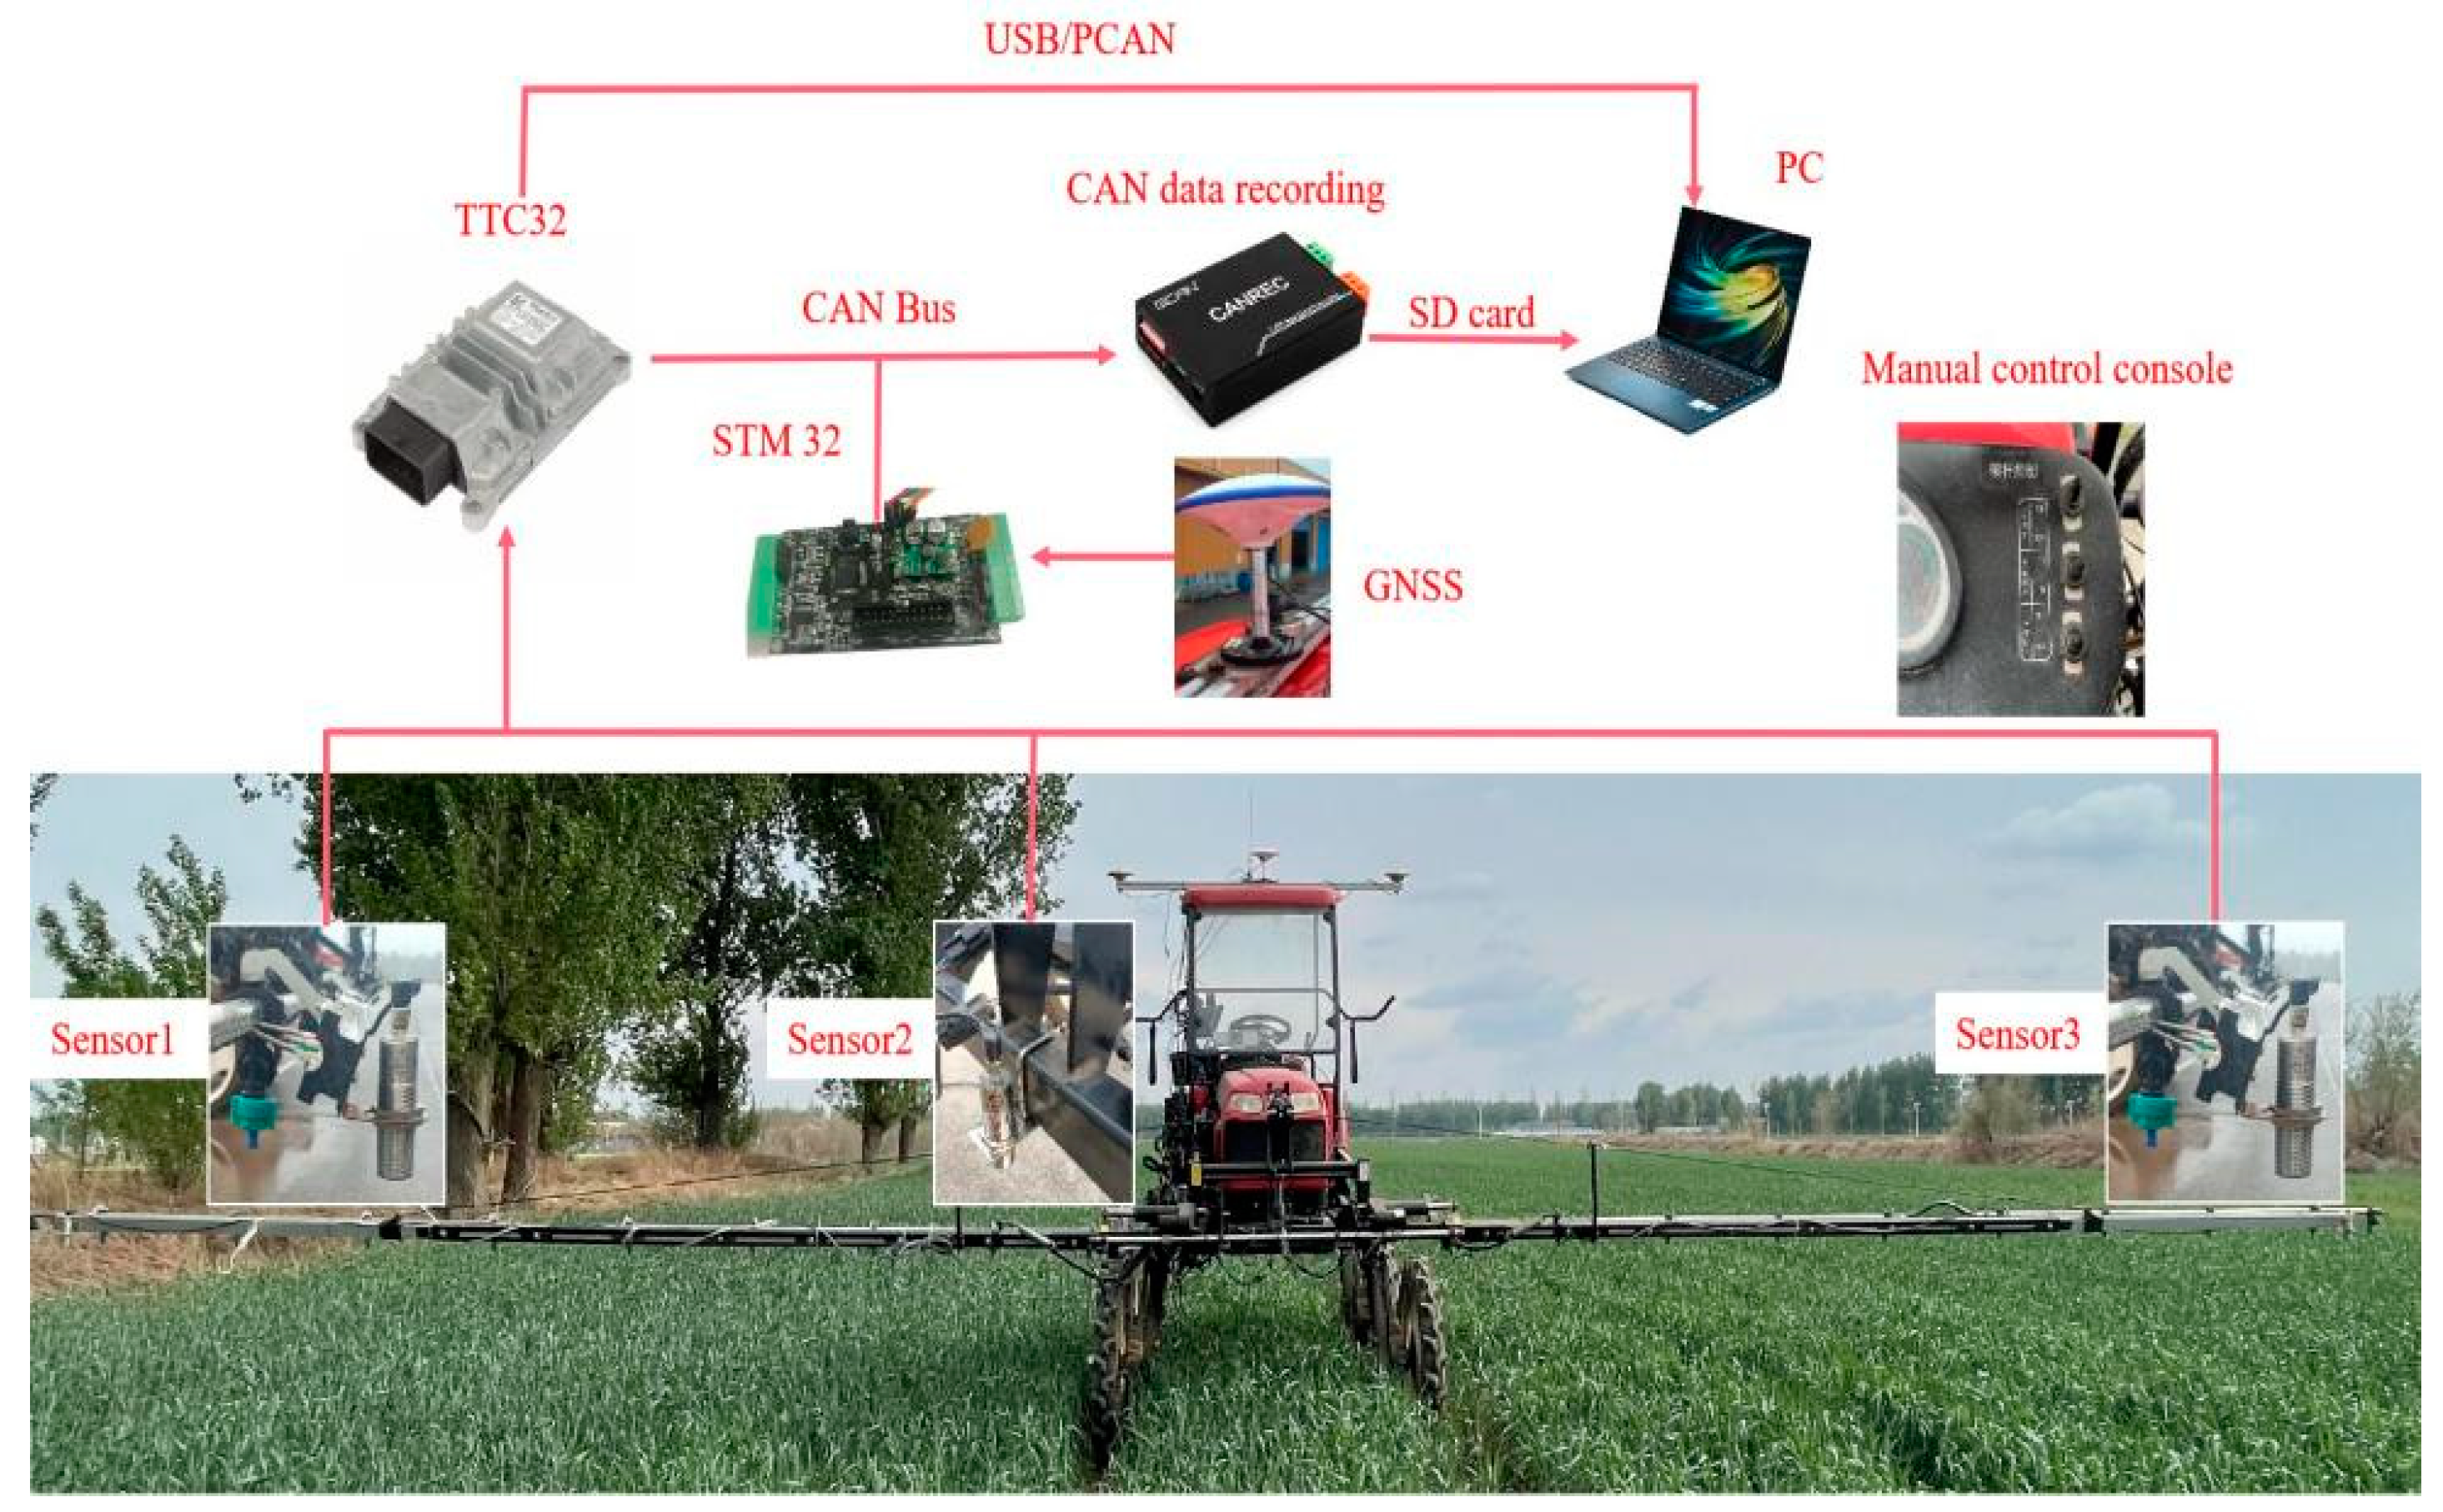
2.1. Design of Boom Height Detection System and Construction of Test Bench

2.1.1. Design of Boom Height Detection System

The test employed a 3WSH-500 sprayer (Yongjia, Linyi, China) with a spray width of 12 m. The spray boom was divided into three parts: the left section, the middle section and the right section. The middle section is hinged to the sprayer through a four-link lifting mechanism. An electronic push rod is responsible for achieving the height control of the entire section of the spray boom. A manual control module is installed in the cab of the sprayer, which can manually control the unfolding, folding and heightening of the spray boom.
To guide the boom sprayer, a boom height detection system was designed, which included a PC (Personal), a TTC32 vehicle control unit (HYDAC Technology, Shanghai, China), an STM32F103RCT6 microcontroller (STMicroelectronics, Shanghai, China), a GNSS antenna (TOPGNSS, Shenzhen, China), three ultrasonic sensors and a CAN data storage device (Guangcheng Technology Co., Ltd., Shenyang, China) (Figure 1). Each ultrasonic sensor (HC175F30GM-I-2000-V1, HC Sensors, Shenzhen, China) has a measuring range of 100~2000 mm and a blind zone of 0~100 mm. An analog current of 4~20 mA reflected the ultrasonic echo energy, the response time is 125 ms, the repetition accuracy is 0.3%, and the working temperature is between −20 and 80 °C. The three ultrasonic sensors were installed at the left, middle and right sections of the spray boom. The ultrasonic sensor on the middle spray boom was at the center of the middle section, the ultrasonic sensors at the spray booms on both sides were all 100 mm from the end, and the three ultrasonic sensors were all installed vertical to the ground to detect the height between the spray boom and the wheat. A GNSS antenna was installed at the top center of the sprayer to record the trajectory position of the test sprayer in the field. The phase center accuracy of the GNSS antenna is ±2 mm, and the operating voltage is 3~12 VDC. The tape measure is used to measure the actual height with a measurement accuracy of mm.
During the test, the ultrasonic sensors at each section of the spray boom input real-time data to the TTC32 on-board control unit, and the real-time latitude and longitude information of the GNSS antenna was input to the STM32F103RCT6 microcontroller. At the same time, the TTC32 on-board control unit and the STM32F103RCT6 microcontroller could communicate in real time with the CAN data storage through the CAN bus. The ultrasonic detection of each section of the spray boom was stored in the SD card of the CAN data storage and was connected to the PC through a USB/PCAN. The real-time detection values and currents of the ultrasonic sensors at the three positions can be directly displayed on the CODESYS V2.3 software interface of the PC. It is able to observe the real-time changes in test data. After the completion of the test, the SD card was imported into the computer for recording. The manual console can control the lifting and deployment of the spray boom through a knob.

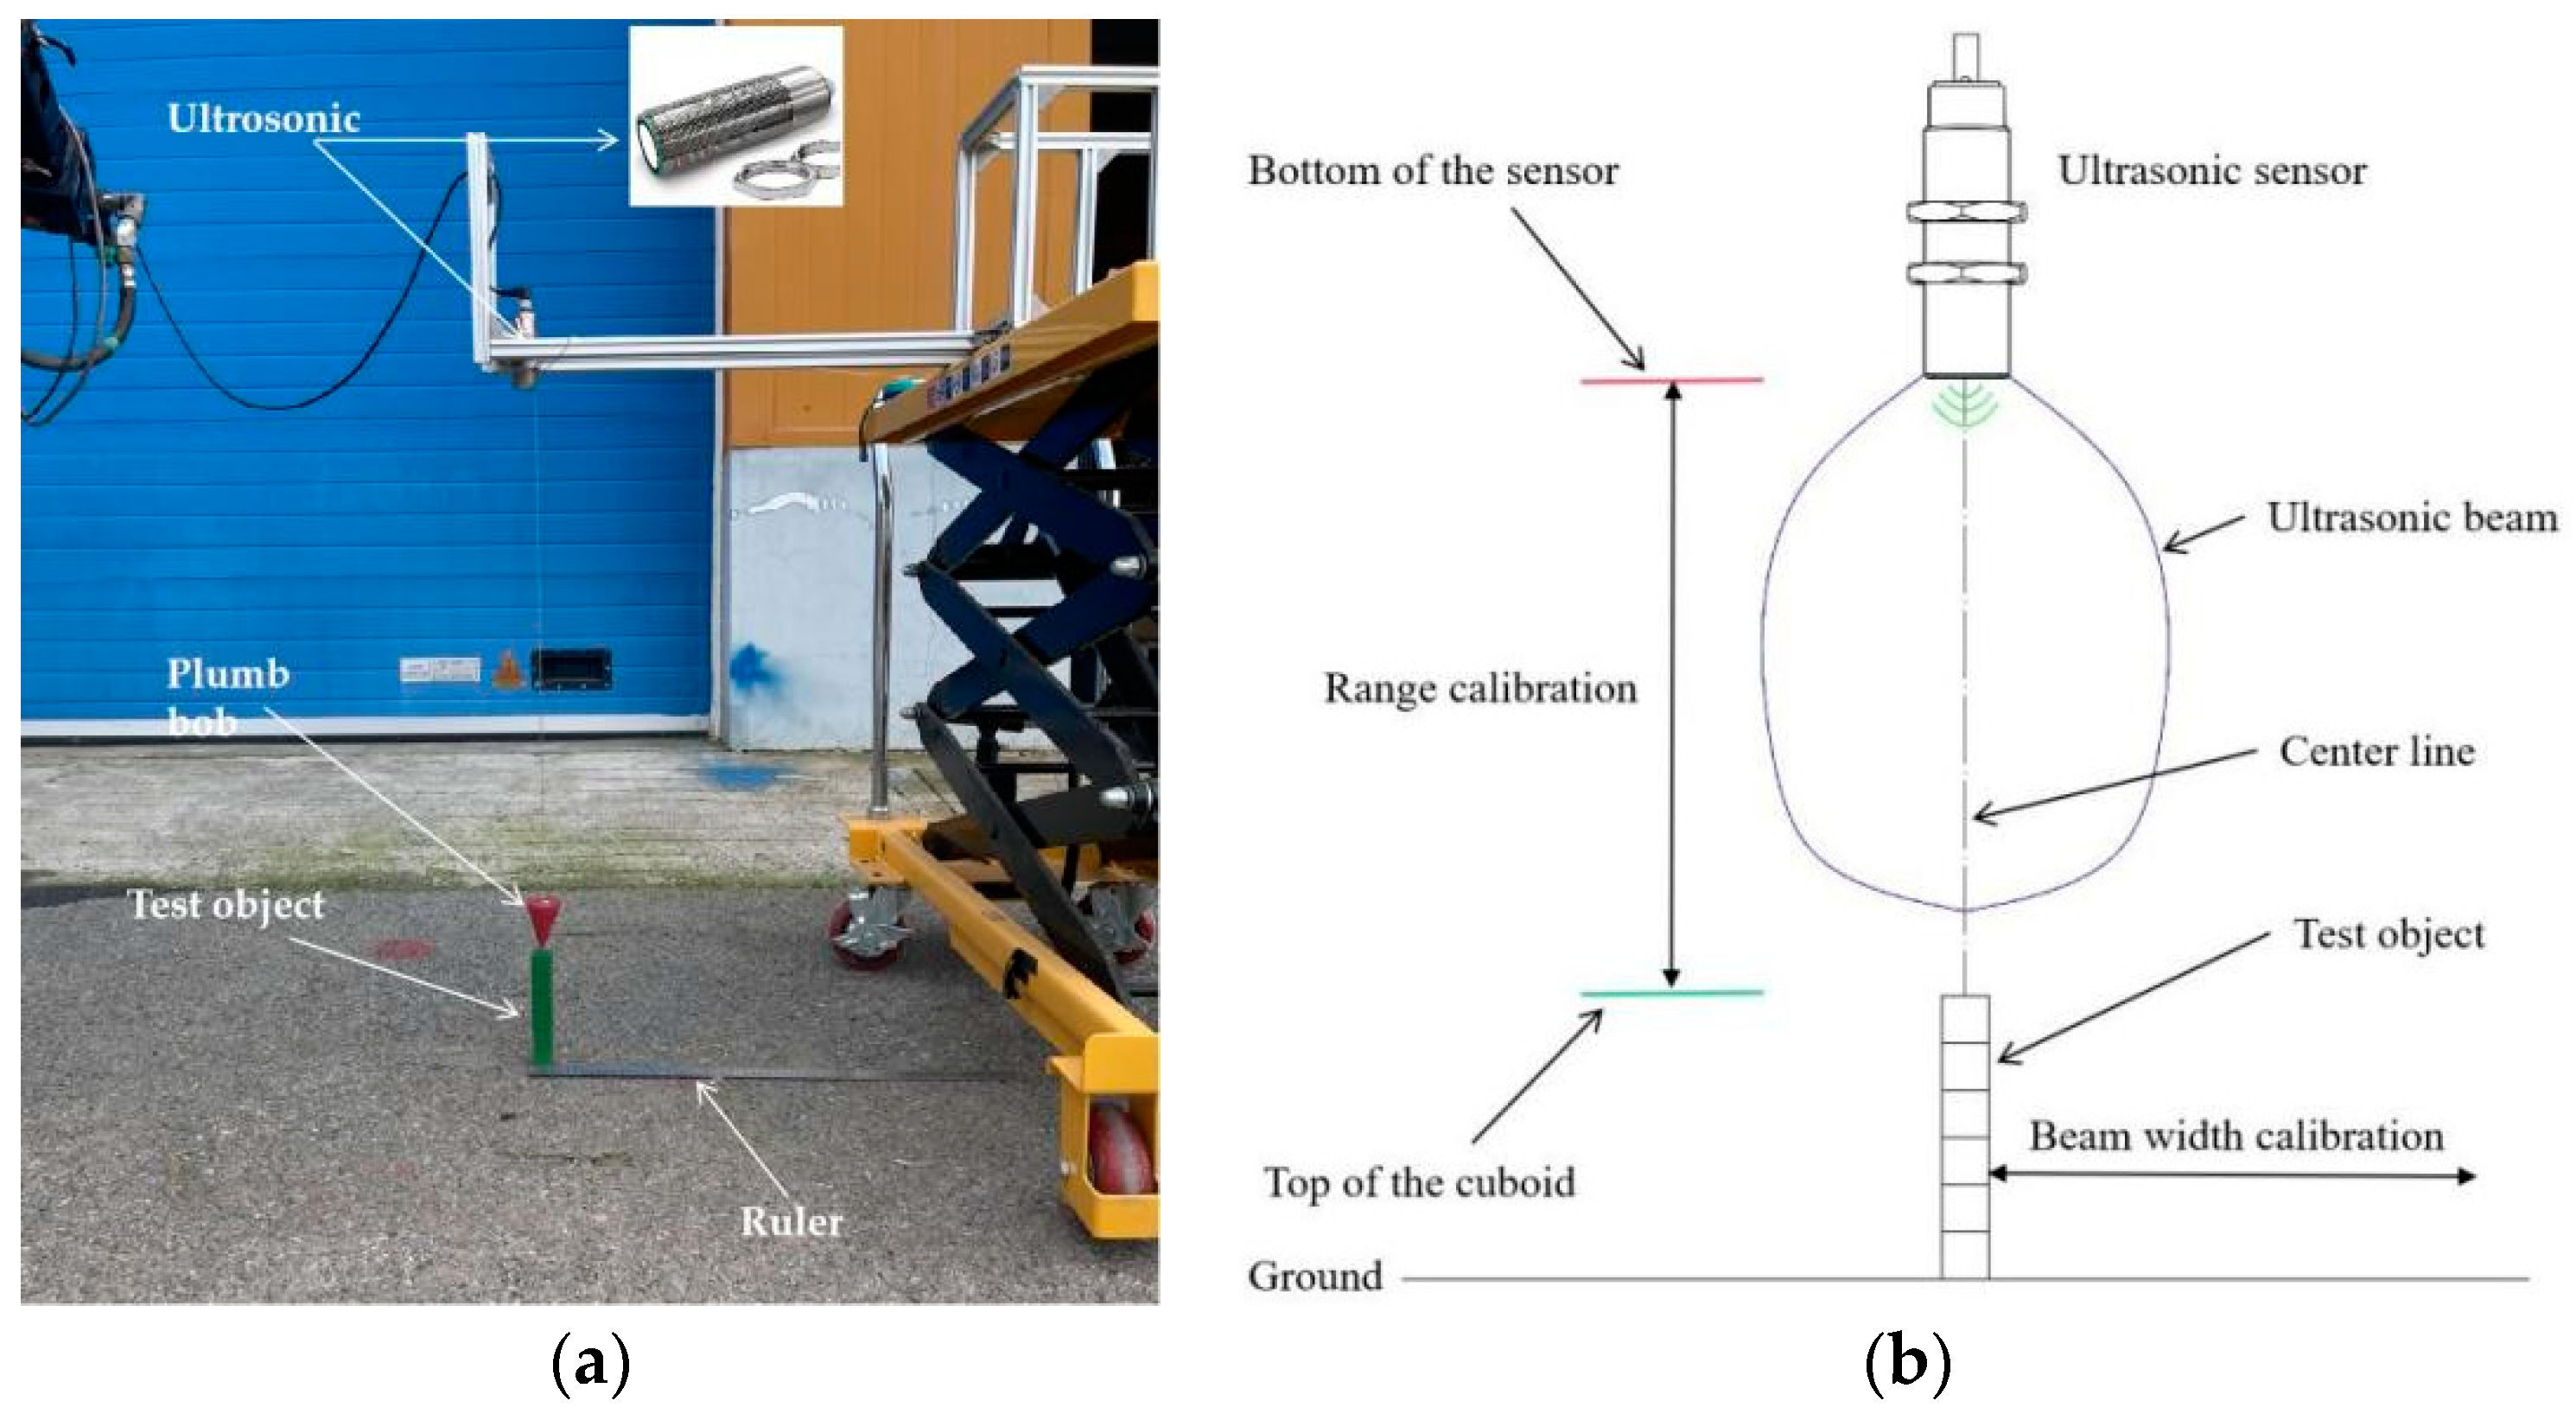
2.1.2. Construction of Ultrasonic Sensor Calibration Test Bench

In order to obtain the initial detection curve (Figure 2) and beam width range (Figure 3) of ultrasonic sensing, we build an ultrasonic sensor calibration platform. Through this platform, we have realized the calibration of the ultrasonic sensor. The platform includes a lifting platform, a ruler, an ultrasonic sensor, a TTC32 controller, a PC, and a measured object.
The initial detection curve of the ultrasonic sensor is calibrated by the ultrasonic calibration test bench. The ultrasonic sensor was installed vertically downward on the extending rod of the lifting platform and took the ground as the measured object. The distance between the ultrasonic sensor and the ground is changed by manually adjusting the height of the lifting platform. During the height adjustment process, the ultrasonic sensor is always oriented vertically downward.
To explore the beam width of the ultrasonic sensor under different Dd, the beam width of the ultrasonic sensor is calibrated by the ultrasonic calibration test bench. The initial detection curve of the ultrasonic sensor is used as input, the measured object is a 25 × 25 × 150 mm cuboidal block.

2.2. Ultrasonic Sensor Calibration Test

The ultrasonic sensor is the most important part of the boom height detection system. Its working principle is that the transmitter emits a beam of ultrasonic signal, and then the ultrasonic signal propagates in the air at a fixed speed until it encounters an object. When the ultrasonic signal encounters an object, part of the energy is reflected back to the sensor by the surface of the object. At this time, the receiver in the sensor will receive the reflected ultrasonic signal. The distance between the object and the sensor can be calculated by measuring the time that the ultrasonic signal passes from transmitting to receiving. In general, the following formulas are used for calculation:
D = T     S 2 ,
where
T is the time that the ultrasonic signal passes from transmitting to receiving;
S is the propagation speed of the ultrasonic wave in the air.
Through this calculation, the distance between the object and the sensor can be obtained, and the height can be calculated.
However, when the ultrasonic signal encounters objects on the ground, reflection, absorption, refraction, and other phenomena will occur, which is also the reason for the low accuracy of repeated detection of ultrasonic sensors in different environments. In order to obtain more accurate ultrasonic sensor detection values, we need to calibrate the beam width and initial detection curve of the ultrasonic sensor and obtain the signal output relationship and beam width range of the ultrasonic sensor.

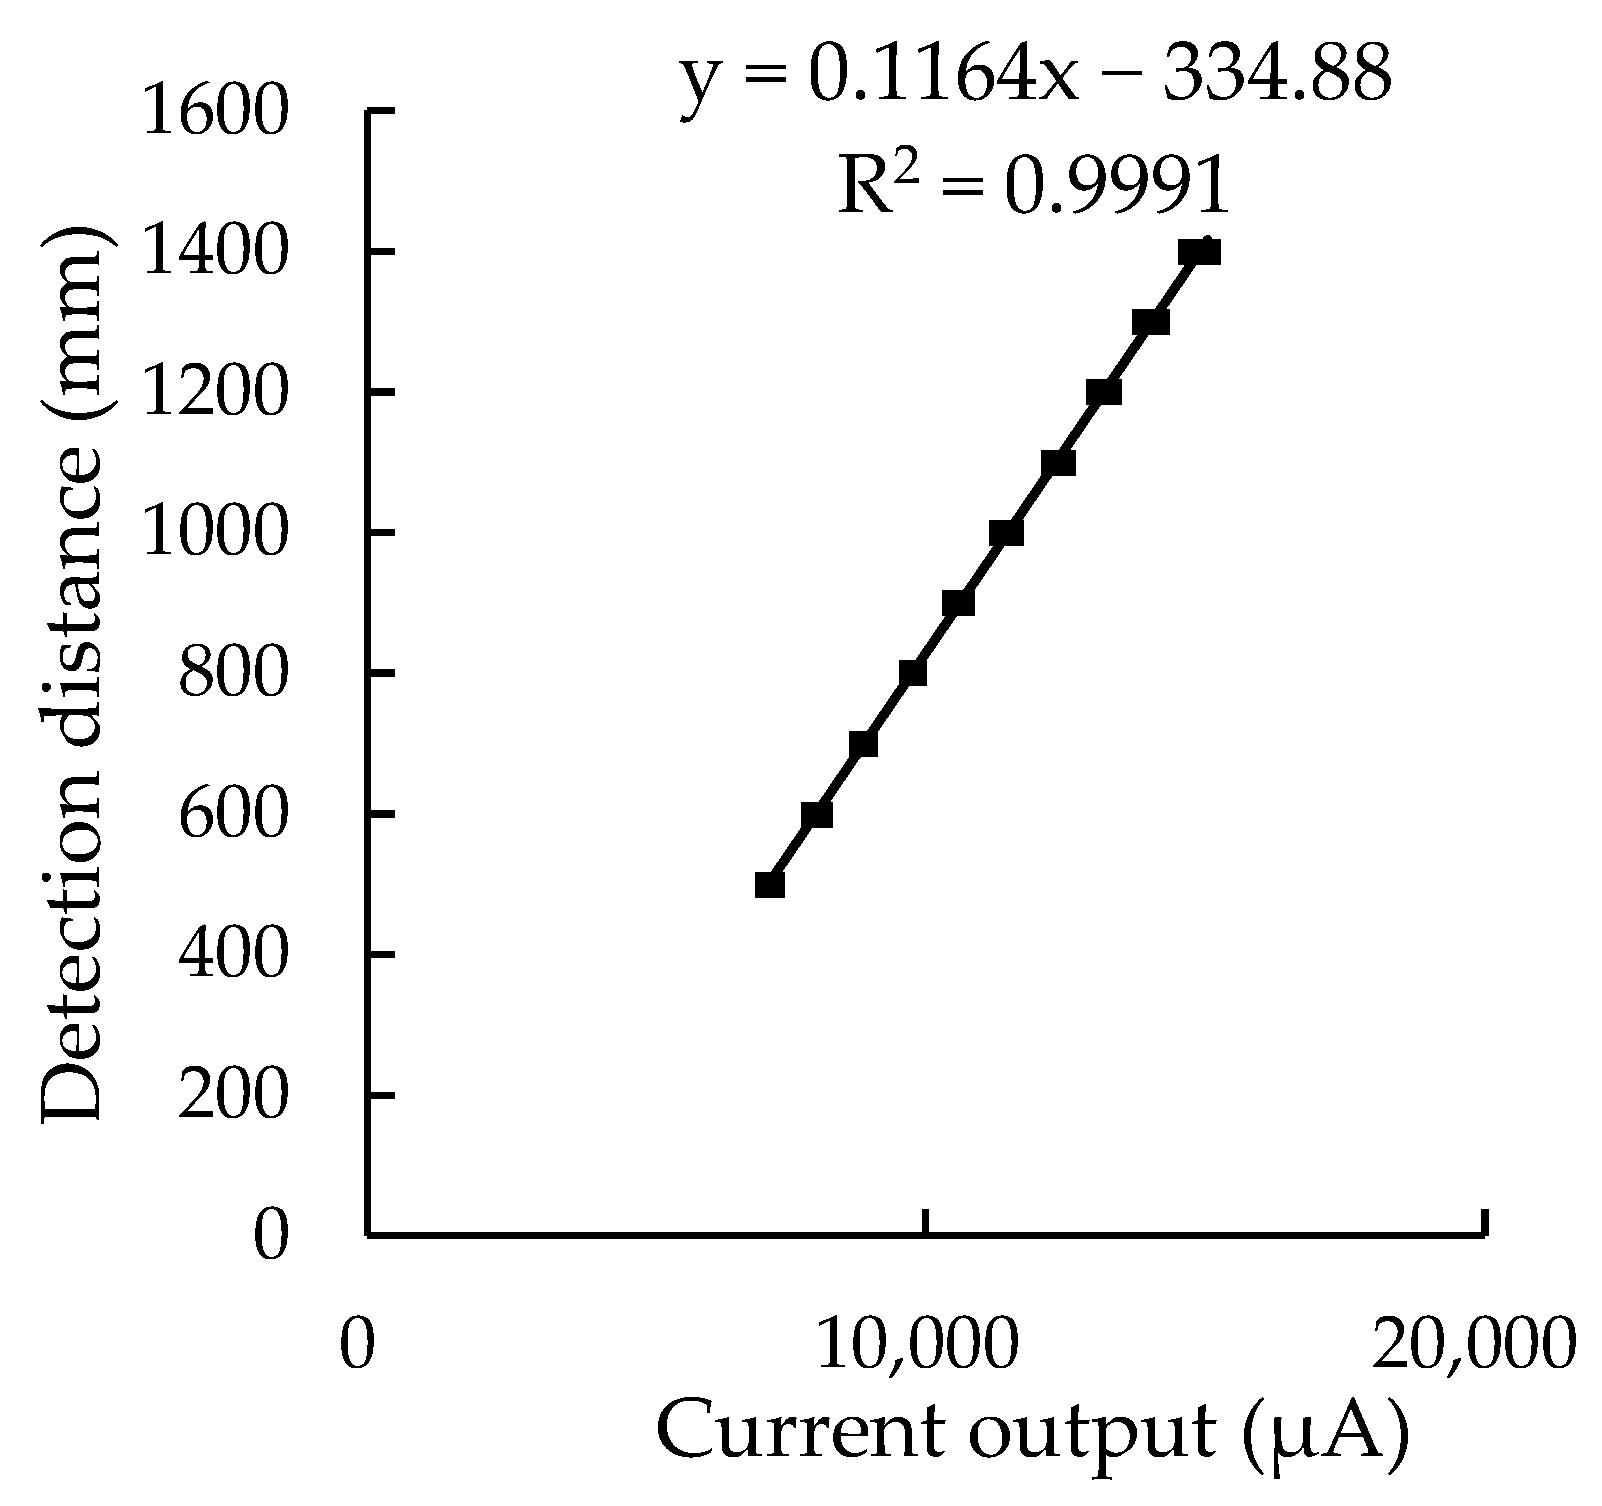
2.2.1. Initial Detection Curve Calibration Test and Data Acquisition

When calibrating the initial detection curve of the ultrasonic sensor, the height adjustment range of the ultrasonic sensor from the ground is 500~1400 mm, and the interval is 100 mm. The PC (personal) was connected to the TTC32 vehicle control unit through the PCAN-USB. The CODESYS V2.3 software interface on the PC was used to display the current signal output of the ultrasonic sensor at the current height in real time, and the actual height measured by a tape measure was recorded. Each group was set at 10 heights, and each height was repeated 3 times. After the mean value was taken, the current input from the ultrasonic sensor was taken as the abscissa, and the actual height from the bottom of the ultrasonic sensor to the actual height from the level ground was taken as the vertical axis. Finally, the initial linear equation between the echo energy of the ultrasonic sensor and the detection height of the level ground was obtained.
In order to obtain more scientific and reasonable results, the variance analysis of the initial detection curve of the ultrasonic sensor is carried out, establishing a simple linear regression equation:
Y = β 0 + β 1 x + ε ,
where
x is the ultrasonic output current, μA;
Y is the distance, mm;
β0 and β1 are regression coefficients;
ε is the error term.
Next, establish the null hypothesis (H0) and the alternative hypothesis (H1). Null hypothesis: the regression coefficient β1 is equal to zero, that is, there is no linear relationship between the output current of the ultrasonic sensor and the distance, and the alternative hypothesis is the opposite.

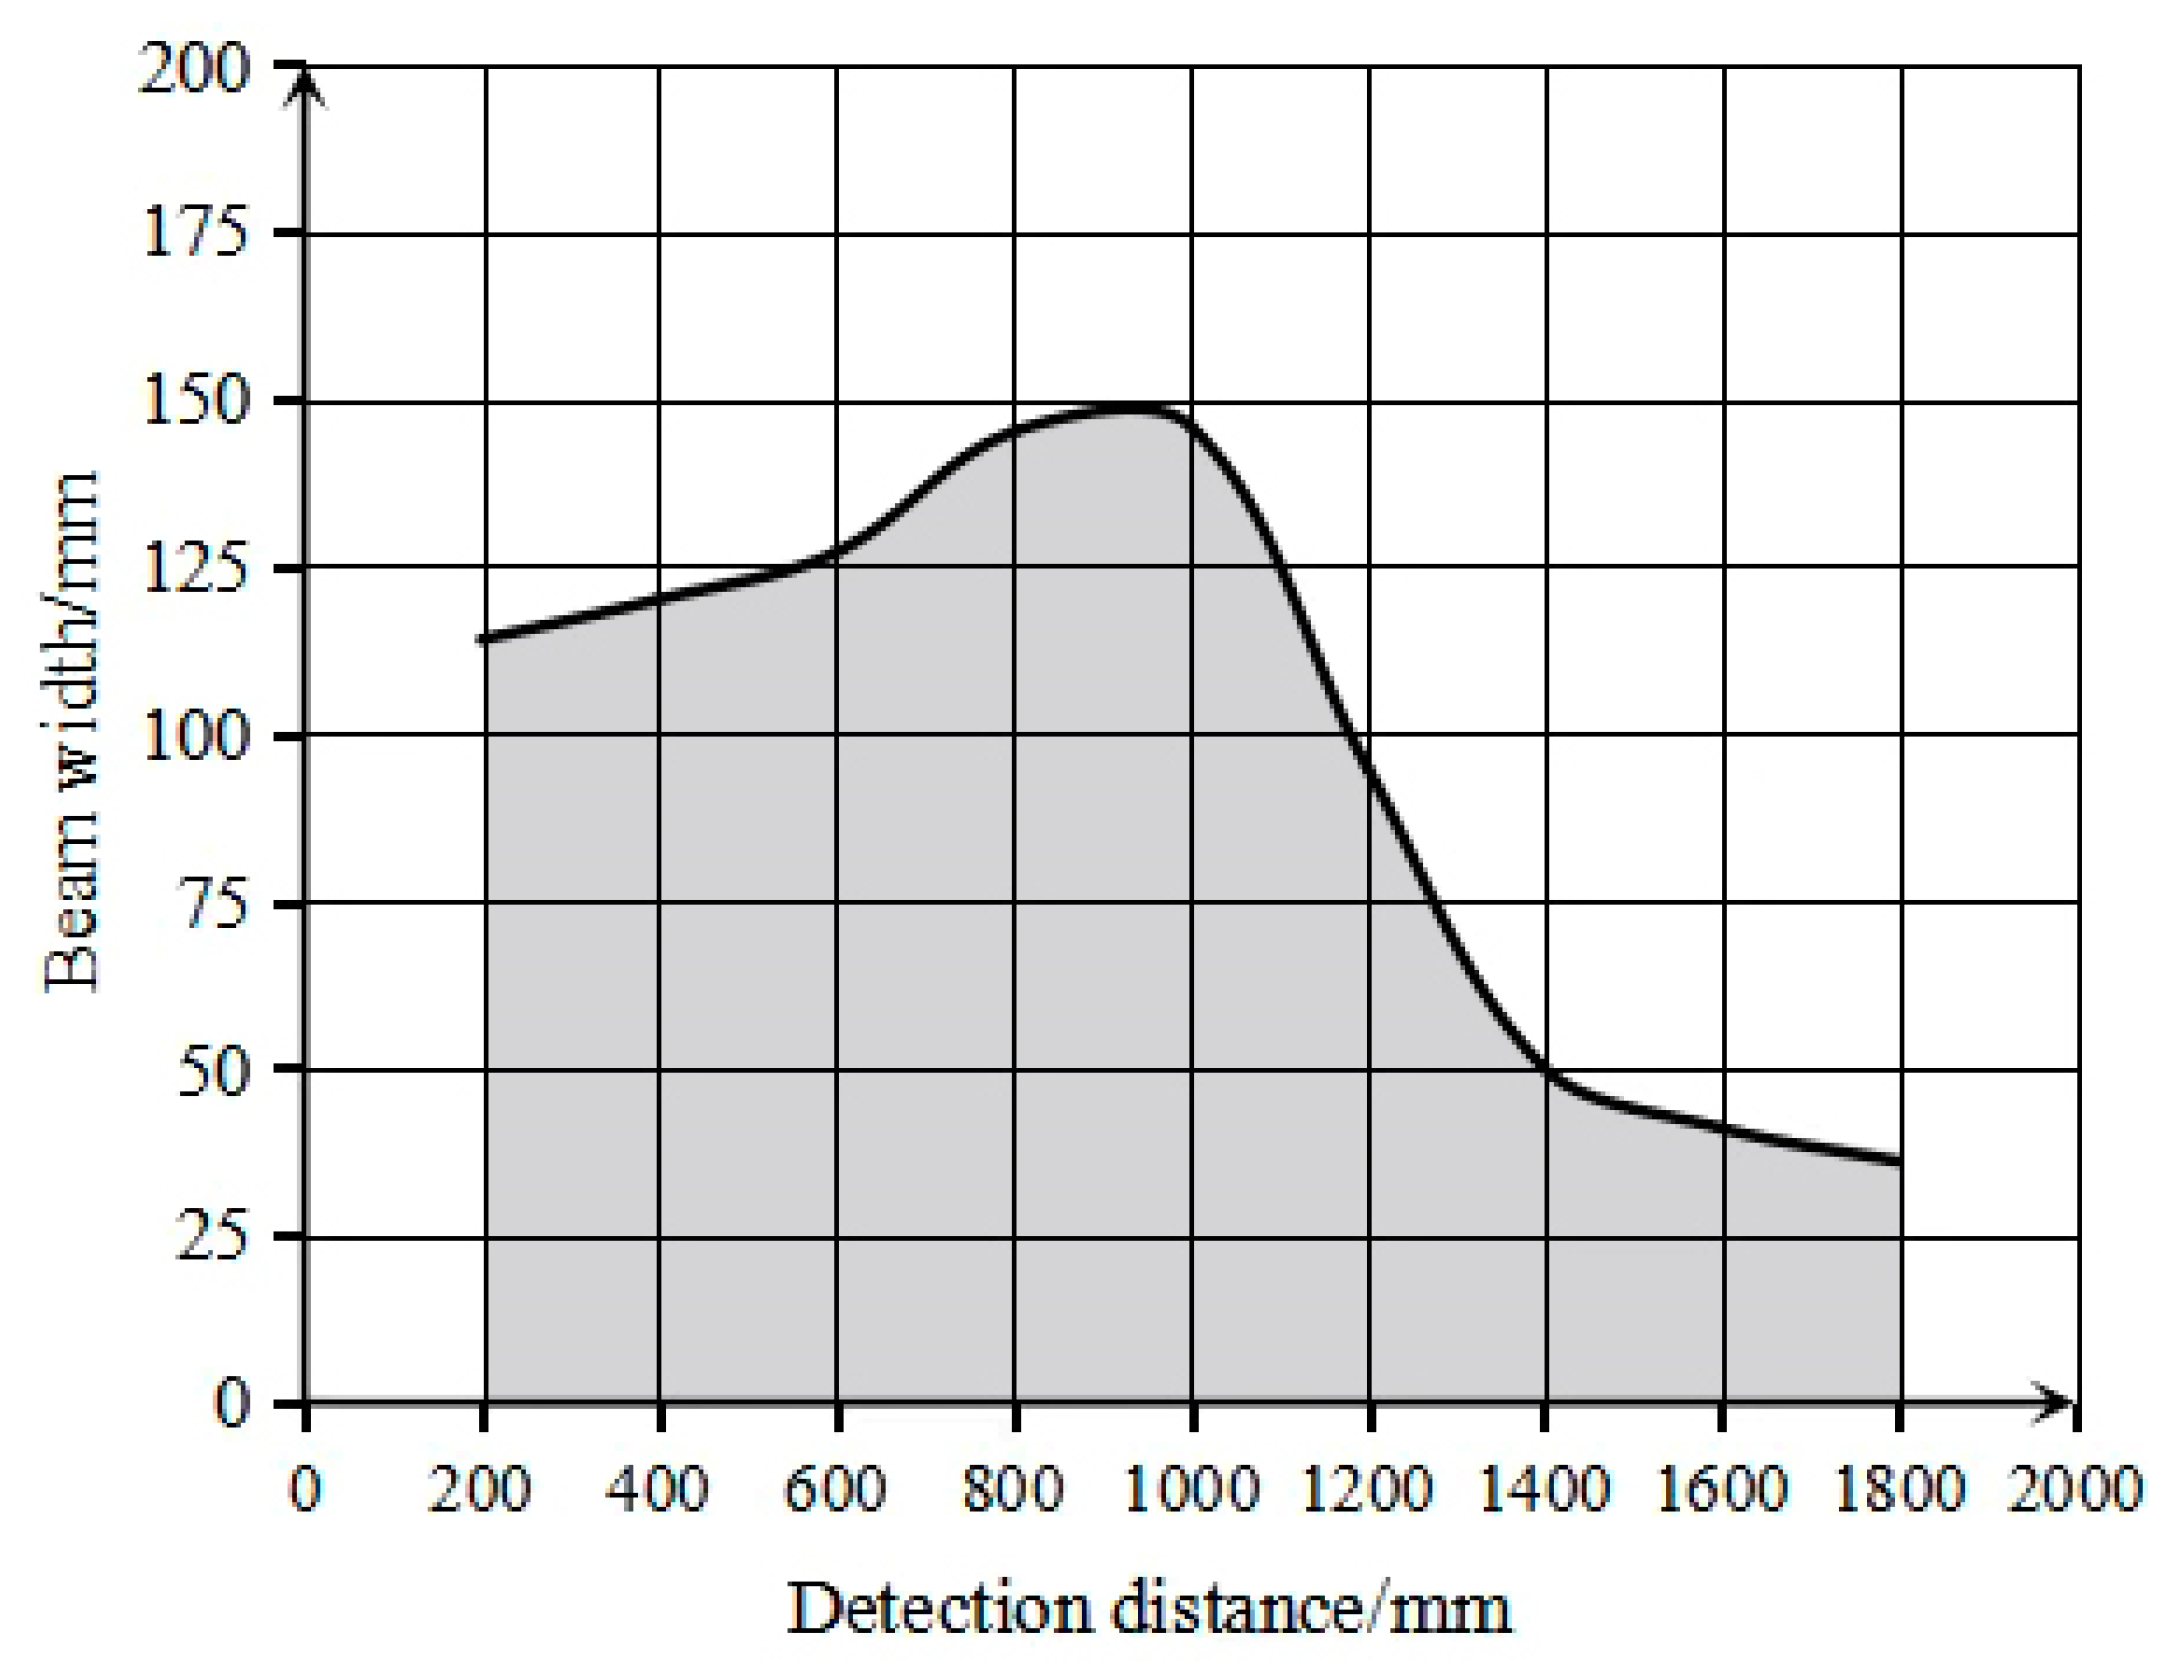
2.2.2. Beam Width Calibration Test and Data Acquisition

During the calibration of ultrasonic sensor beam width, the measured object was a 25 × 25 × 150 mm cuboidal block. Before the test, the ultrasonic sensor was fixed vertically downward with its centerline perpendicular to the ground. The cuboid under test was placed on level ground, and the center point of its square surface overlapped with the center line of the ultrasonic sensor. To ensure the accuracy of the test, an engineering plumb bob was dropped from the center point of the bottom of the ultrasonic sensor to initially fix the square surface of the measured cuboid, and this point was used as the origin. After the positioning was complete, we removed the plumb, the current sensor detecting value was recorded through the CODESYS V2.3 software interface on the PC, and then the origin was moved vertically from the origin to one side. Every 25 mm of movement, the detecting value was compared to determine whether there was an approximately 150 mm change, i.e., the change in wood height, until the detecting value of the ultrasonic sensor was switched to the ground surface, and the current point was set as the estimated point of the detection boundary under the current detection distance. In the next step, the measured rectangular parallelepiped moved toward the origin at an interval of 5 mm at the current estimated point until the detection value of the ultrasonic sensor repeatedly fluctuated between the measured object and the ground. Then, the distance between the current point and the origin was used as the boundary value.
The blind zone of the ultrasonic sensor was 0~100 mm, and the detection range was 100~2000 mm. Considering the working height range between the spray boom and the top of the wheat canopy during field operation, the minimum Dd of the ultrasonic sensor to the object to be measured was set to 200 mm, and the maximum Dd was set to 1800 mm. The height adjustment interval was 200 mm, which was tested at least 9 heights. Finally, the beam width of the ultrasonic sensor within the Dd range of 200~1800 mm was obtained.
In addition, to explore the differences among the same type of ultrasonic sensors and obtain the same type of ultrasonic sensor output consistency results, this paper compared the detection values of the three ultrasonic sensors under the same current input. The purpose of measuring the difference in detection values was to verify whether the same type of sensors could use a unified linear relationship for distance detection.

2.3. Field Detection Test and Detection Model Establishment of Wheat Whole Growth Cycle

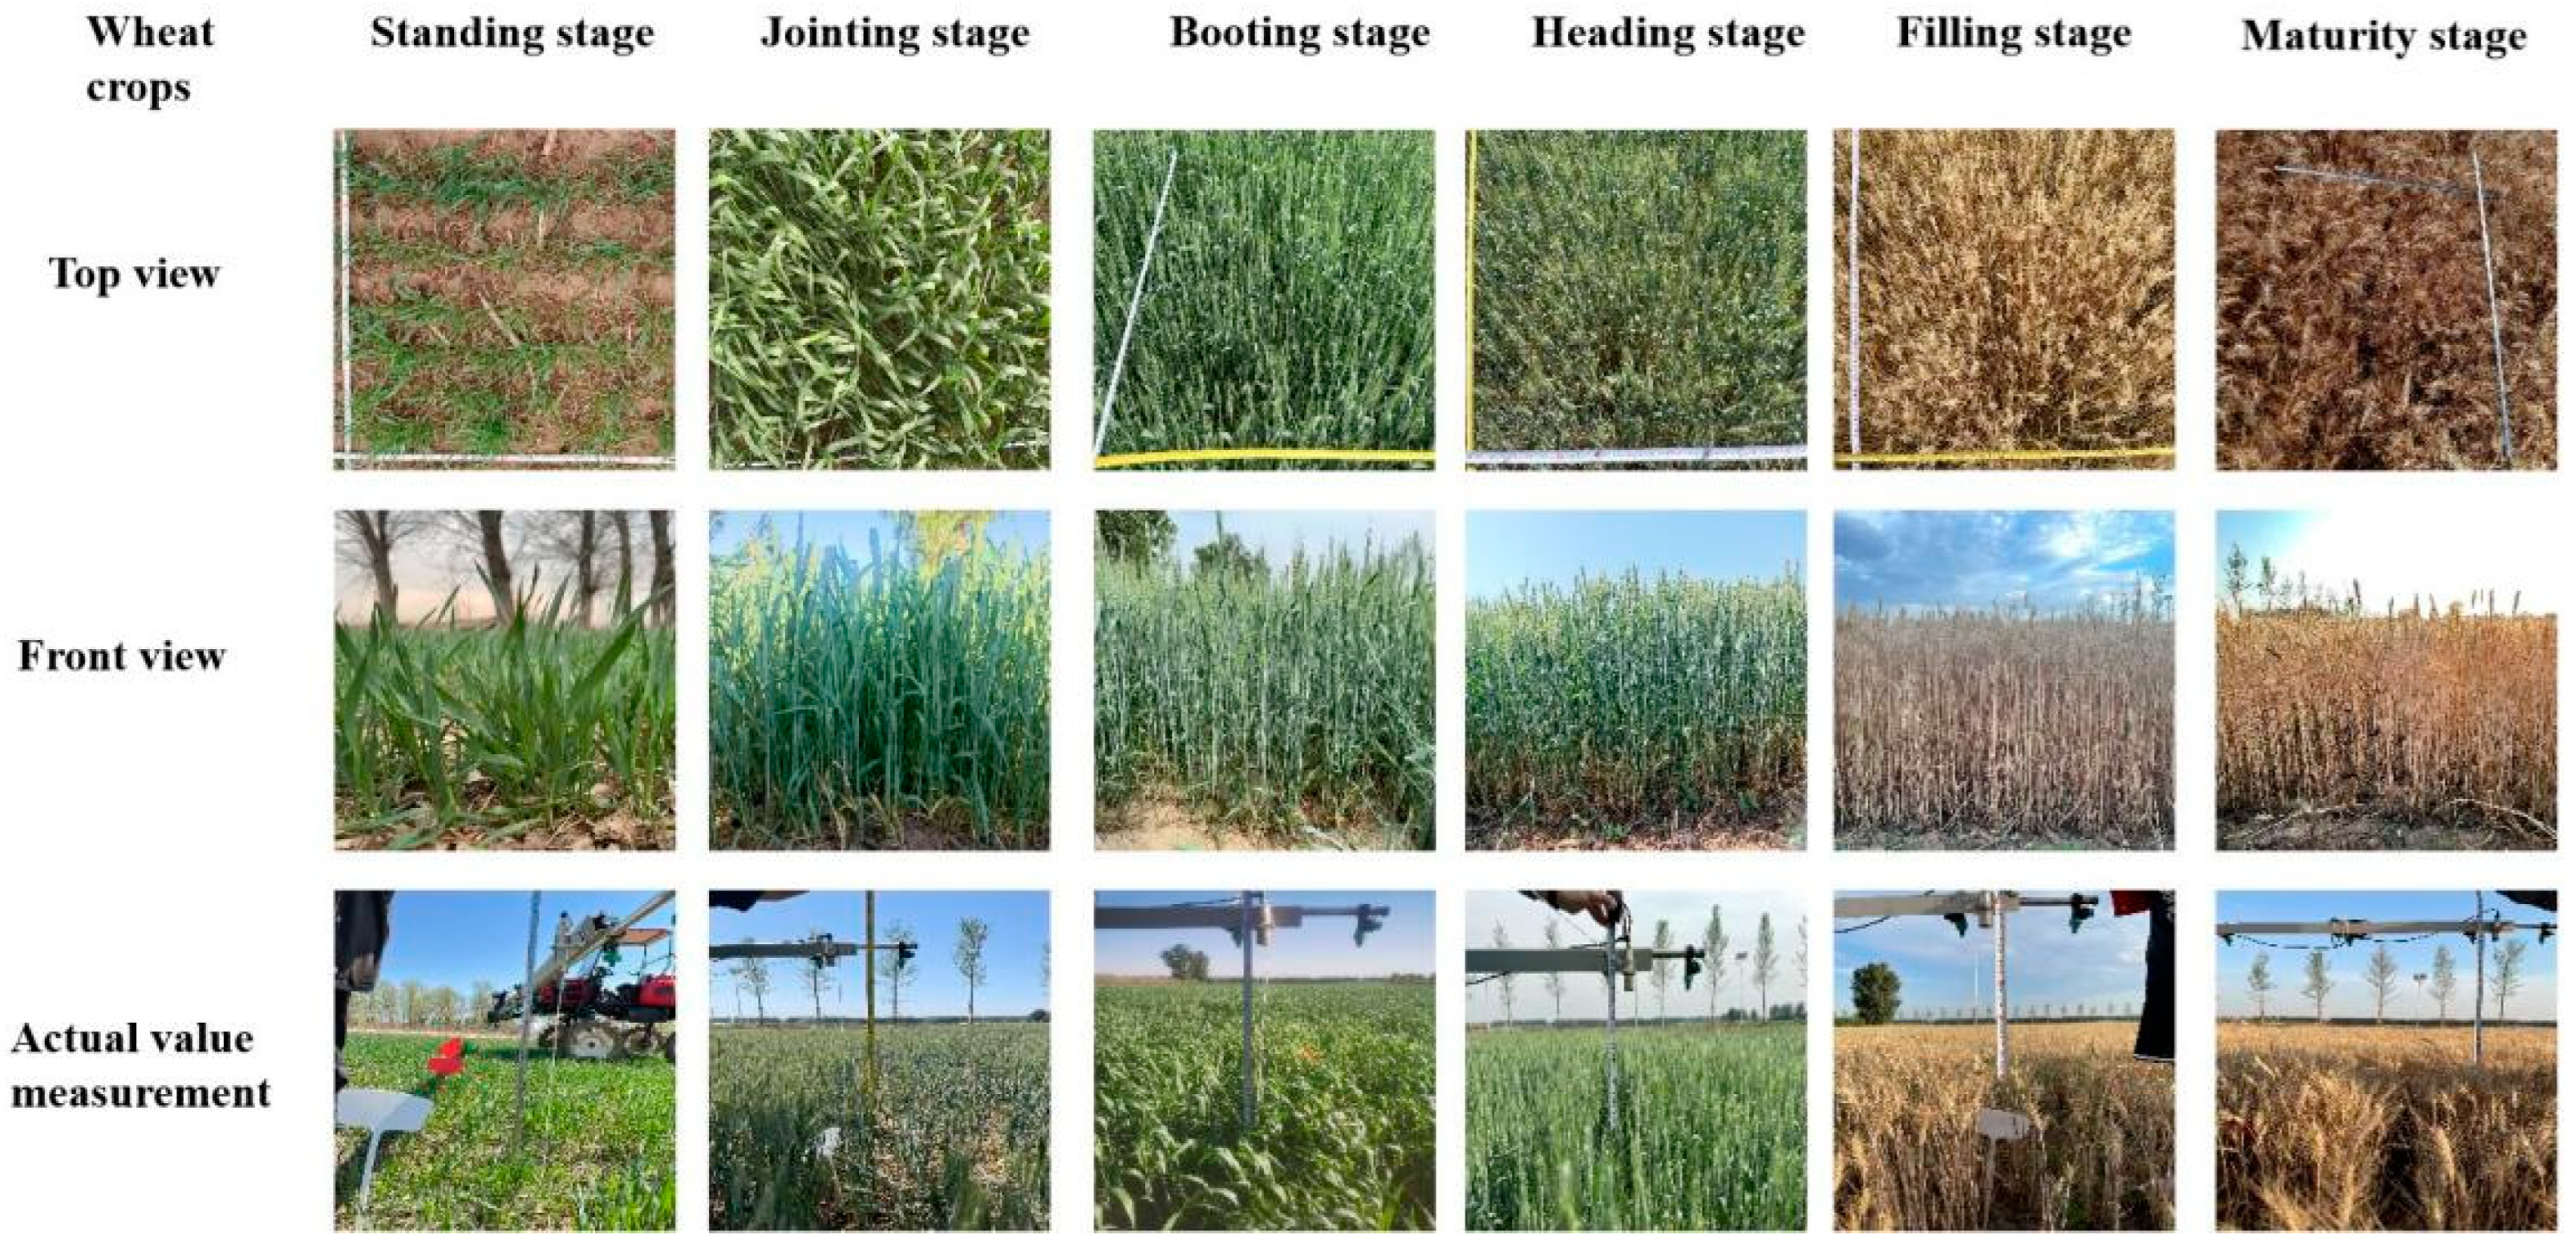
2.3.1. Field Detection Test and Data Collection of Wheat Whole Growth Cycle

To investigate the effect of wheat in the field at different growth stages on the detection of ultrasonic sensors, Jingdong 22 winter wheat was selected for the field detection test. The sowing rate was 225 kg/ha, and the planting time was 20 October 2022 (Beijing time). A field exploration test was conducted at the National Precision Agriculture Research Experimental Base (Beijing, China) using a 3.6 m wide seeder (2BFX-24, Shijiazhuang Agriculture Machinery Co., Ltd., Shijiazhuang, China) (Figure 4). Six main growth stages of wheat were selected: the standing stage (15–31 March 2023), the jointing stage (1–15 April 2023), the booting stage (15–30 April 2023), the heading stage (1–15 May 2023), the filling stage (15–31 May 2023), and the maturity stage (1–15 June 2023). A weather station was used to monitor environmental factors (wind force, wind speed, air temperature, air humidity, and light intensity). The wind force ranged from 1 to 2, the wind speed ranged from 0 m/s to 1.7 m/s, the temperature ranged from 18.1 °C to 37 °C, the air humidity ranged from 11.1% to 46.9%, and the light intensity ranged from 1866 Lux to 104,346 Lux. The adjustment range of the spray boom height was 450~1250 mm, with the interval of each adjustment ≤ 100 mm. After selecting a point in the field where wheat seedling emergence was uniform, the position was recorded with a GNSS antenna and a 1 × 1 m box was placed. At the beginning of the test, the spray boom of the test prototype was unfolded so that the ultrasonic sensor at the middle section of the spray boom was perpendicular to the wheat canopy in the box, and the distance between the spray boom and the wheat tops was adjusted sequentially through the manual console in the cab. Using the CODESYS V2.3 software interface, the Hdbw at each Dd was recorded, and a manual measurement with a tape measure was performed to obtain each Hdbw under Dd and the average value of wheat plant height (Hapw) in the box.
During each wheat growth stage, two sets of data were collected. One set of data was used for model construction. These data contained at least nine boom height values for each stage. At the same position, the test was repeated three times for the ultrasonic sensors at the boom positions on both sides. Another set of data was used for model validation, at each growth stage of wheat, when the model construction data collection was completed. The current value and actual value of the ultrasonic sensor at the position of the middle spray boom are collected at a random position in the wheat field. And data were acquired once from at least nine boom heights for each stage.

2.3.2. Establishment Method of Wheat Whole Growth Cycle Detection Model

To keep Hdbw consistent with Habw and improve the detection input accuracy of the spray boom height control system, the field boom height detection model was selected to construct the set of data; that is, the mathematical relationship between different Dd and the distance from the ultrasonic detection boom to the top of the wheat canopy during each growth stage was compared with the initial detection curve of the ultrasonic sensor under the level ground state to obtain the actual detection position of the wheat determined by the ultrasonic sensor.
For better mathematical analysis, the ultrasonic wheat position percent (UPP) is defined as:
U p p = ( H a p w O f f s e t ) H a p w ,
O f f s e t = H d b w H a b w ,
where
Offset is the position distance of Hdbw compared with Habw, mm;
Hapw is the average plant height of wheat in the detection position box for each growth stage of wheat, mm;
The closer Upp is to 1, the closer the current detection location is to the top of the wheat canopy.
The Dd from the boom to the top of the wheat is within the range of 450~1250 mm, and all the corresponding data are grouped according to the Upp range. Then, for each Dd in the same group, the corresponding Upp values were all within the same setting range (Upp ≥ 85% or Upp < 85%), and A value compensation was made for Hdbw in this group. The model was established based on the initial linear equations of the ultrasonic sensor under the level ground state. The equations were given different A values according to different groupings to establish an ultrasonic sensing-based detection model for wheat’s full-range spray boom height.
Furthermore, due to the versatility of the model being reduced when the number of compensation values is too large, the detection ranges with close compensation values were merged according to the ranges of the compensation values based on the obtained detection models, and the number of groups was reduced to facilitate the field application of the detection model. To ensure that the detection accuracy of the wheat full-range height detection model could maintain a high value during each growth stage of wheat, the detection model was validated. The current analog value in the validation data was imported into the model to obtain the output value of boom height, which was compared with the actual recorded value to calculate the detection error. Finally, the effective detection range of the model was optimized via the fluctuation range of those detection errors.

3. Results

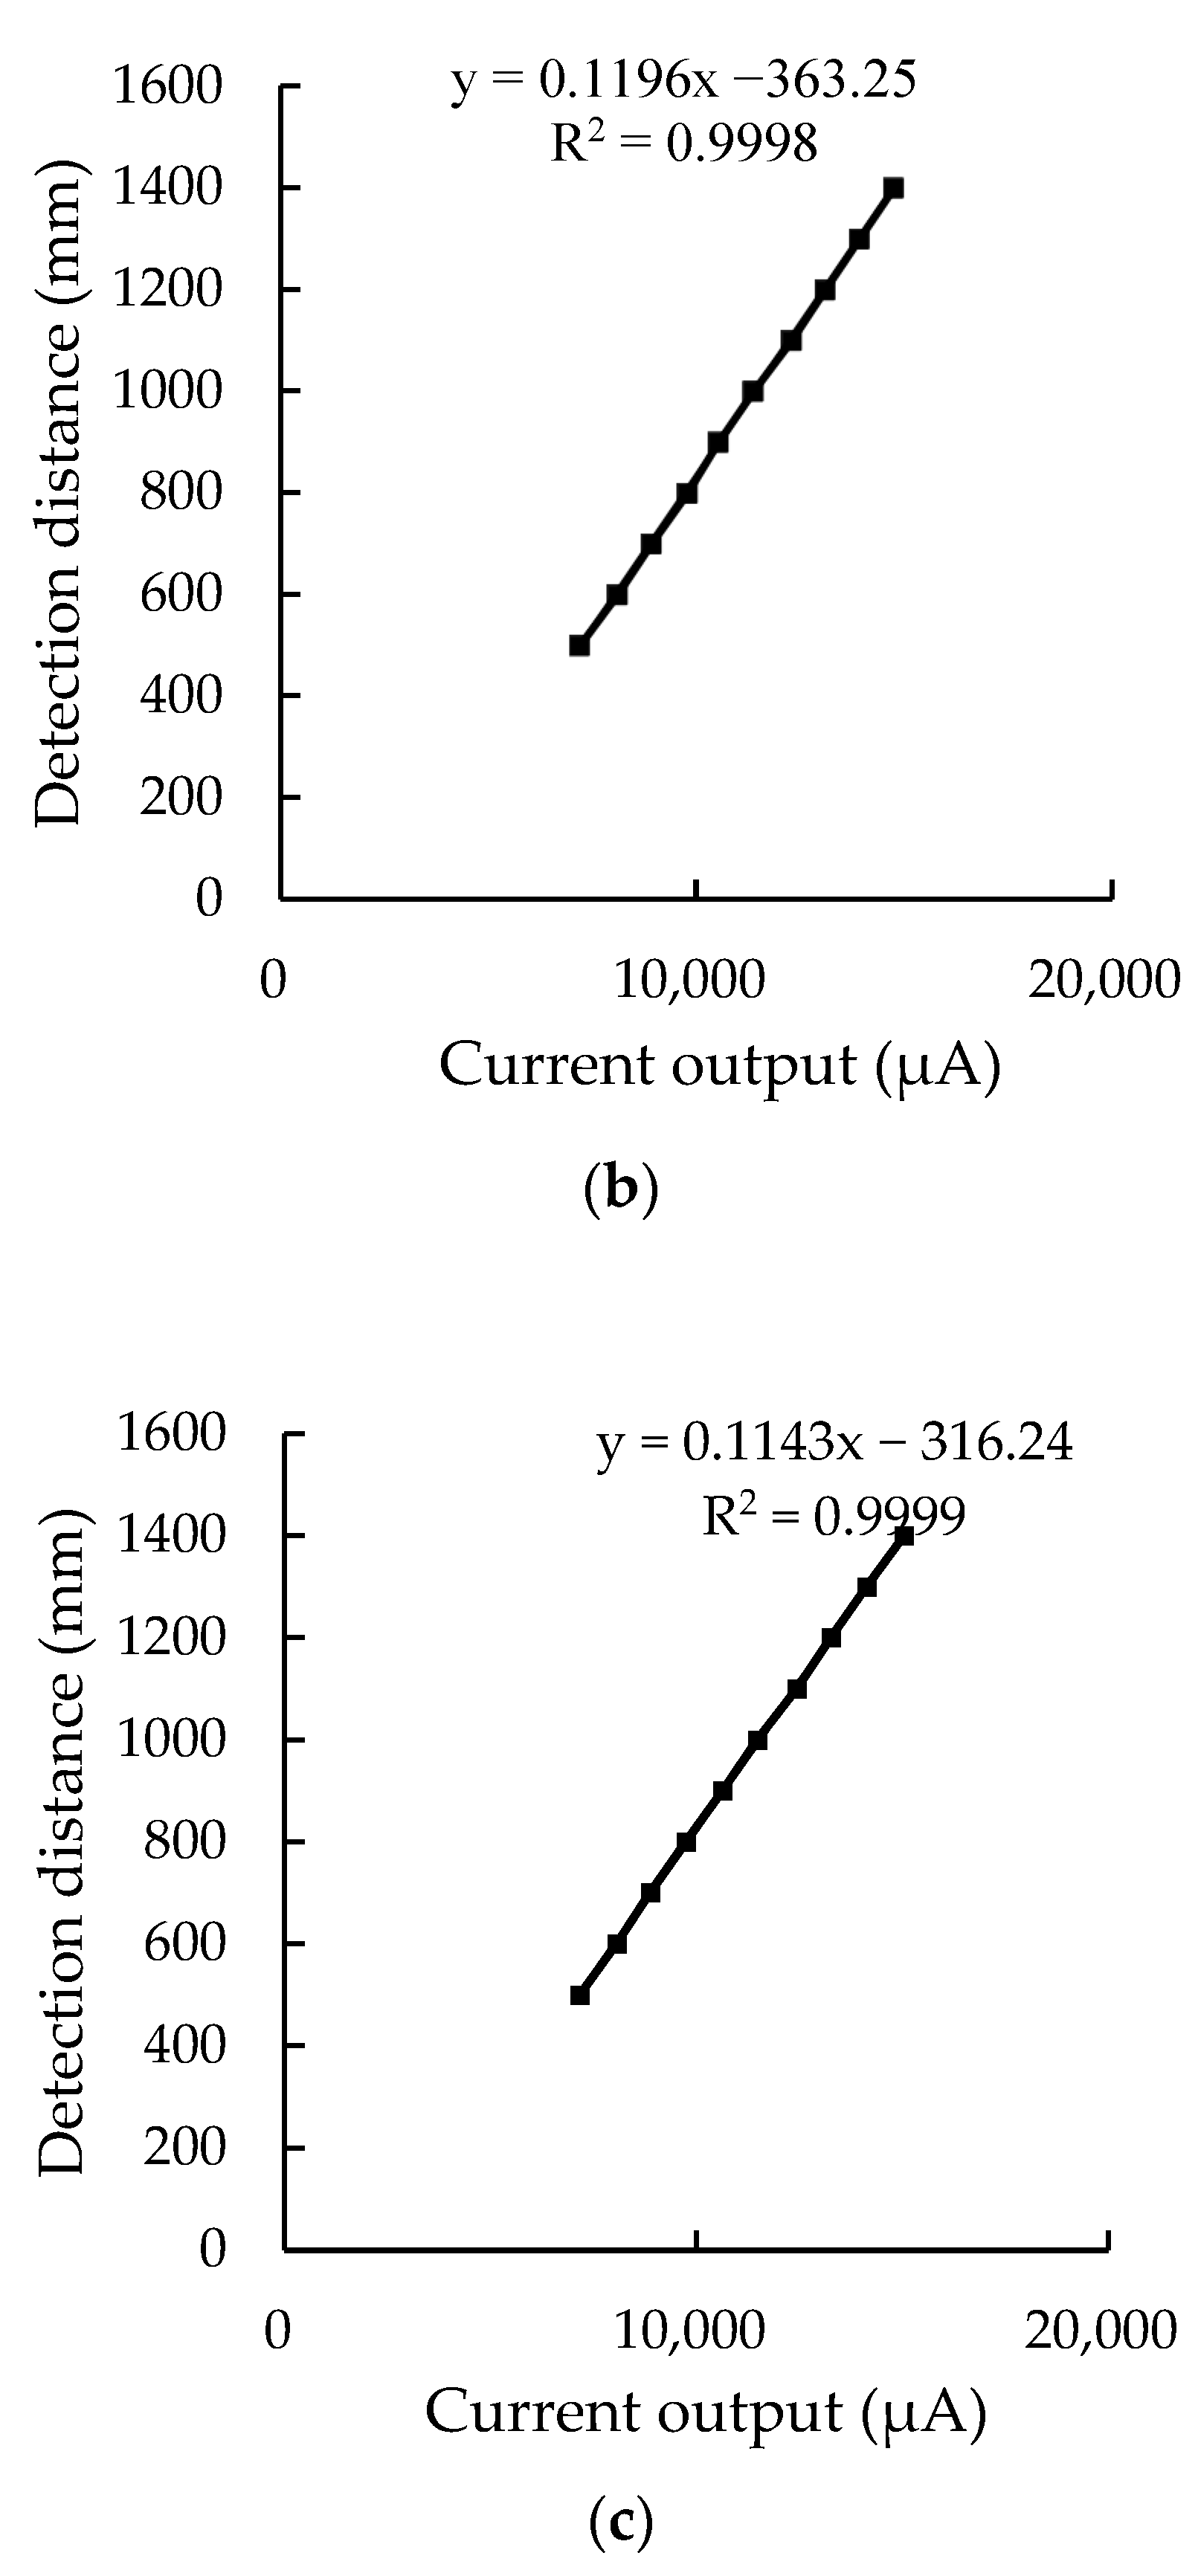
3.1. Initial Detection Curve and Beam width Calibration Test Results of the Ultrasonic Sensor

The ultrasonic sensors installed at three positions of the spray boom were calibrated on level ground (Figure 5) to obtain the linear relationships y = 0.1158x − 328.65, y = 0.1196x − 393.14, and y = 0.1143x − 316.24, where x is the output current, μA, and y is the detection height, mm. The R2 of goodness-of-fit were 0.9995, 0.9998, and 0.9999, respectively. In the figure, Sensor 1, Sensor 2, and Sensor 3 are the ultrasonic sensors installed at the three positions on the spray boom.
In order to obtain more scientific and reasonable results, the variance analysis of the initial detection curve of the ultrasonic sensor was carried out. The results of the variance analysis are shown in Table 1.
The F values were 147.09, 154.82, and 144.34, respectively. The p values were 4.25 × 10⁻¹⁰, 2.81 × 10⁻¹⁰, and 4.95 × 10⁻¹⁰, respectively, which were all less than 0.05. This means that we can reject the null hypothesis and accept the alternative hypothesis. In other words, the regression coefficient in the linear regression model is significantly non-zero (β0 and β1), indicating that there is a certain correlation between the change in the output current and the distance, and the output current of the ultrasonic sensor can better predict the distance.
The ultrasonic sensor was tested on a cuboid measuring 25 × 25 × 150 mm on unobstructed level ground, and the beam widths under different Dd are shown in Figure 6.
In Figure 6, the horizontal axis is Dd, which is the distance between the center of the bottom of the sensor and the center of the object to be measured, and the vertical axis is the unilateral beam width of the ultrasonic sensor at each Dd. Since the ultrasonic beam is symmetric about the centerline, the filled area in Figure 6 is half the ultrasonic.
As shown in Figure 6, when the Dd between the ultrasonic sensor and object was in the range of 200~1000 mm, the vertical axis showed a slowly rising trend, and the unilateral beam width gradually increased from 114 mm to 146 mm. When the range of Dd was 1000~1800 mm, the vertical axis showed a rapidly decreasing trend, and the unilateral beam width decreased rapidly from 146 mm to 36 mm. According to the test results, when the range of Dd was 200~1800 mm, the variation in the unilateral beam width of the ultrasonic sensor increased first and then decreased; the unilateral beam width of the ultrasonic sensor reached the peak value of 146 mm when Dd was 1000 mm and reached the minimum value of 36 mm when Dd was 1800 mm. Therefore, the beam width of the ultrasonic sensor changes with the increase in the ultrasonic detection distance. The change in beam width has an effect on the detection results of the ultrasonic sensor, which provides a basis for the analysis of the detection results of ultrasonic sensors in wheat fields.
Based on the previous calibration of the ultrasonic sensors at three positions on the spray boom on level ground, the linear relationship between the output currents of the three ultrasonic sensors and Dd was obtained. To explore the individual differences among the ultrasonic sensors of the same type, the same current values were introduced into three linear relationships x to obtain the detecting curve of the same type of ultrasonic sensors under the same current (Figure 7). As shown in Figure 7, the three detection curves are very close. When the output current of the ultrasonic sensor is at the maximum value of 20,000 µA, the difference of the detected values reaches the maximum of 59 mm. Considering that the actual current range when ultrasound is used to detect the spray boom height is generally between 6000 µA and 12,000 µA, the maximum detecting difference within this range is only 19 mm. This shows that for the same type of ultrasonic sensors within the range of spray boom heights Dd, the difference in the detecting values was very small. Therefore, after comparing the closeness of the three linear relationships, we fused the scattered relationship between the output current of the three ultrasonic sensors and the Dd (Figure 8) and obtained the unified linear relationship y = 0.1164x − 334.88; the R2 of the goodness-of-fit was 0.9991.
The current value of 4000~20,000 µA is the output current range of the ultrasonic sensor, and Sensor 1, Sensor 2, and Sensor 3 indicate the ultrasonic sensors installed at the three positions on the spray boom.
To determine if the unified linear relationship after fusion is suitable for the height detection of the same type of ultrasonic sensor, its output consistency was verified (Table 2). When the current has a maximum value of 20,000 µA, the detection difference reaches the maximum of 36 mm, and the minimum difference is 6 mm. In the actual detection current range of wheat height detection of 6000~12,000 μA, the corresponding detection difference was a maximum of 10 mm, and the minimum difference was 0 mm. This shows that for wheat height detection, the same type of ultrasonic sensors can share a linear relationship and could meet the requirements of the test.

3.2. Results of the Field Spray Boom Height Detection Test

In the field detection experiment, the heights of wheat at fixed positions in the field were detected during the six wheat growth stages, and the position estimates of ultrasonic detection under multiple Dd were obtained (Table 3). In the tables, S2 is the ultrasonic sensors mounted on the middle part of the spray boom, S1 and S3 are the ultrasonic sensors mounted on both sides of the spray boom, and P1~P6 are the six growth stages of wheat: standing, jointing, booting, heading, filling, and maturity.
In Table 3 above, it was found by comparing Hdbw and Habw that the Hdbw values were all greater than the Habw values. The actual detection position of the detecting value from the ultrasonic sensor was under the wheat top, not the position at the wheat top. The offset of the detection position of the ultrasonic sensor can be obtained by comparing the difference between Hdbw and Habw. The maximum offsets between the standing stage and maturity stage of wheat were 113 mm, 295 mm, 400 mm, 296 mm, 511 mm, and 452 mm. The Hapw of wheat was measured manually with a tape measure. The Hapw values of wheat in the box under the ultrasonic sensor in the middle section were 120 mm, 393 mm, 528 mm, 552 mm, 568 mm, and 654 mm from the standing stage to the maturity stage, respectively. Upp represents the degree to which the detection position of the ultrasonic sensor is close to the top of the wheat, and the larger this value is, the closer the ultrasonic detection position is to the top of the wheat.
From the numerical variation in UPP in the table, in the range of 450–1000 mm Dd, the larger the Dd, the smaller the UPP, which means that the ultrasonic sensor detection value position is gradually close to the wheat root; on the contrary, the Dd decreases, the value of UPP increases, and the ultrasonic sensor detection value position becomes gradually closer to the top of the wheat. There is a significant change in the UPP value and the size of the detection distance. In the range of 450–1000 mm, the maximum offset of Hdbw is 33 mm, 79 mm, 101 mm, 102 mm, 125 mm, and 191 mm, respectively, in the six critical periods of wheat. When the detection distance is more than 1000 mm, UPP fluctuates significantly, Hdbw is unstable, and the change is not obvious. UPP only represents the degree that the position of the ultrasonic sensor monitoring value is close to the top of the wheat, and the larger this value is, the closer the ultrasonic detection position is to the top of the wheat and, therefore, it cannot represent the detection accuracy of the ultrasonic sensor.
In the construction data of the spray boom height detection model in the field, the variation in individual Hdbw did not match the overall results. For example, during the jointing stage, when Dd was 964 mm, the offset of Hdbw should be gradually increased, at least greater than the 72 mm corresponding to the previous Dd (895 mm), and its Upp should gradually decrease and be at least less than 83.89% of the previous Dd (895 mm), but this Dd actually corresponds to an offset of 31 mm, and Upp was 93.06%. Although this is a good detection performance, it is still a very rare individual phenomenon.
The corresponding Dd was in the range of 450~701 mm during the standing stage when Upp was above 85%. From the jointing stage to the maturity stage, the range of Dd corresponding to Upp above 85% expanded to approximately 450~850 mm, and in the maturity stage, Upp corresponding to a Dd of 450~850 mm reached more than 90%.

3.2.1. Construction of the Detection Model

As shown from the results in Table 3, when Upp > 98%, the difference between the corresponding Hdbw and Habw is very small, and the detection position is very close to the top of the wheat. Based on Formula (3), which can be obtained when the UPP is 98%, the offsets of the middle ultrasonic sensor during the six growth stages of the wheat were 2.4 mm, 7.86 mm, 10.56 mm, 11.04 mm, 11.36 mm, and 13.08 mm, respectively. Therefore, when the position percentage was greater than 98%, the detection position was considered at the top of the wheat. No compensation was performed for the ultrasound initial calibration curve. When the distance between the ultrasonic sensor and the top of the wheat was Dd ≥1000 mm, the downward movement distance of the ultrasonic sensor was irregular, and the position percentage was unstable. To ensure the accuracy of the established wheat detection model, when Dd ≥ 1000 mm (Upp ≤ 70%), no compensation was performed to the ultrasound initial calibration curve, and the applicable range of the model was preliminarily set to be within the detection distance of 450~1000 mm.
In Table 3, all the data within the range of 450 mm to 1000 mm between the ultrasonic sensor and the top of the wheat were divided into two groups according to Upp ranges of 85~98% and 70~84%. The grouping results are shown in Table 4.
As shown in Table 4, the values from the standing stage to the maturity stage were divided into 12 groups. The mean value of the offset for each group was used as the compensation value A to establish a preliminary model for wheat full-range detection (Table 5).
The preliminary model equation for boom height detection is:
y = 0.1164 x 334.88 A ,
where
y is Hdbw, mm;
x is the ultrasonic sensor output current, μA;
A is the detection compensation value, mm.
The preliminary model for boom height detection is limited by the different growth stages and Dd of wheat and lacks versatility in the whole growth cycle of wheat. Due to the large number of compensation A values, it is cumbersome to replace the values in the application of the model. To reduce the limitations of the model, it is necessary to expand the versatility of the model between the wheat standing stage and the wheat maturity stage and to make the application of the full-range wheat detection model more convenient and faster. The merged model for wheat full-range detection was obtained by merging the compensation A values in the model equations, as shown in Table 6.
As shown in Table 5, the two groups of compensation A values of the preliminary model for boom height detection during the wheat standing stage were 13.85 mm and 26 mm, respectively. Within the Dd of 450~1000 mm, the compensation difference A was only 12.15 mm. Therefore, the two groups of wheat standing stages were merged into one group. The detection distance range was expanded to 450~1000 mm, and the corresponding compensation value A was the mean value of the two groups of compensation values, which was 19.18 mm. Table 5 shows that the boundary values of the Dd range between the two groups of wheat jointing stages to the wheat maturity stages were very close. The left-end boundary values of the first set of Dd ranges were 450 mm at each growth stage of wheat, and the right-end boundary values were 850 mm, 858 mm, 850 mm, 867 mm, and 850 mm according to the stage of wheat growth. The compensation values of the first group from the standing stage to the maturity stage were 27.75 mm, 40.58 mm, 46.44 mm, 47.53 mm, and 36.88 mm, respectively, with a maximum difference of 19.78 mm. There is no need to give compensation values separately. Therefore, the first group of wheat samples from the standing stage to the maturity stage were merged. The Dd range of the first group after merging is 450~850 mm. The compensation value is the average of the compensation values of the first group for the stages before the merging, 39.84 mm. The merge method of the second group was the same as that of the first group. The difference between the compensation values between the two groups was the maximum at 50.75 mm between the standing stage and the maturity stage. In the higher range of Dd, 50.75 mm was not a large value. The range of Dd for the second group after merging was 851~1000 mm, and the compensation value was the mean value of the second group of compensation values in each stage before merging, 96.39 mm.
The boundary values of the two groups of Dd ranges for the preliminary model were not continuous. This is because, in the field exploration experiments, the Dd between the spray boom and the wheat top was adjusted at an interval of ≤100 mm, not at a fixed value as the interval. In the practical application of the preliminary model, it may occur that some Dd is in the adjustment interval, and there is no corresponding compensation value. For example, at the jointing stage of wheat, the user set Dd to be 860 mm to detect wheat, but Dd is 860 mm, which is neither within the range of 450–850 mm in the first group of Dd at the jointing stage of the preliminary model, nor within the range of 864–973 mm in the second group of Dd. Therefore, there is no corresponding compensation value for Dd = 860 mm, resulting in the inapplicability of the preliminary model. To improve the continuity of the model, the adjacent boundary values of the two groups of Dd ranges in the boom height merged model were continuous, ensuring that within the use range of the model, each detection distance can be given a compensation value.

3.2.2. Validation and Optimization Results of the Spray Boom Height Detection Model

Compared with the preliminary model, the merged model for boom height detection simplifies the number of equations to compensate for the A values and improves the versatility of the model during the full growth cycle of wheat. However, as the detection model is the regulation basis of the control system, its detection accuracy is very important. Therefore, validating the detection model is essential. The field validation data reserved for each growth stage of wheat were introduced into the preliminary model and the merged model to compare the variation in the detection error. The model was optimized, and the validation results are shown in Table 7.
In Table 7, Habw was obtained through manual measurement with a tape measure. The output current of the ultrasonic sensor in the verification data was introduced into the equations of the preliminary detection model and the merged detection model to obtain Hdbw1 and Hdbw2. The detection error and average detection error of the preliminary detection model were Ev1 and Aev1, respectively; the detection error and average detection error of the merged detection model were Ev2 and Aev2, respectively.
The maximum detection errors of the preliminary detection model in the six growth stages of wheat were 30 mm, 60 mm, 57 mm, 49 mm, 85 mm, and 62 mm, respectively. These maximum errors occurred when Dd > 950 mm. The maximum errors of the merged detection model in the six growth stages of wheat were 24 mm, 34 mm, 51 mm, 53 mm, 72 mm, and 37 mm, respectively. These errors also appeared in the case of Dd > 950 mm. In the case of Dd ≤ 950 mm, the maximum errors of the preliminary detection model and the merged detection model in the six growth stages of wheat were 53 mm and 42 mm, respectively. The average error of the two detection models was less than 30 mm, and the average error of the merged detection model was better than that of the initial detection model in the six growth stages of wheat. In order to ensure the detection accuracy of the model and reduce the influence of Dd on the detection model, the merged detection model was further optimized, and the applicable Dd range of the detection model was determined to be 450 mm~950 mm. In the field detection test, the data of 950 mm ≤ Dd < 1000 mm are still valuable for the determination of the compensation value of the detection model. Therefore, the compensation value of the optimized boom height detection model remains unchanged, and the maximum applicable Dd range of the model was changed from 1000 mm to 950 mm, as shown in Table 8.
The final model for boom height detection has three fixed values during the six wheat growth stages. The applicable Dd of the model was within the range of 450~950 mm. According to the validation results of the model, the detection error of the model was ≤50 mm within the applicable detection distance. This can provide effective and accurate detection input for wheat from the standing stage to the maturity stage.

4. Discussion

4.1. The Distance between the Ultrasonic Sensor and the Top of the Wheat Canopy within a Certain Range Can Guarantee the Detection Accuracy

Field exploration tests conducted during six different wheat stages showed that the Hdbw of the ultrasonic sensor was greater than the Habw under multiple Dd, indicating that the detection position corresponding to Hdbw was below the canopy. Zhao and Zhai [35] also reached the same result when detecting the top height of the wheat canopy. They suggested that for the thin and narrow leaf characteristics of wheat, the canopy was an irregular reflection of ultrasonic energy. The ultrasound beam may detect other objects, such as branches below the canopy, causing Hdbw > Habw. To obtain a more accurate canopy top height, the values detected by the ultrasonic sensor should be corrected. For this reason, researchers have proposed a method of best height estimation percentile, which can better indicate the positional relationship between Hdbw and Habw. For example, Scotford and Miller et al. [36] proposed that 90% of the detection data could be used as the best estimate of the height of wheat plants. Bronson et al. [21] suggested that for the height detection of cotton, the 75 percentile of the detection data has better accuracy than the mean or median. However, whether this is applicable to wheat leaves still needs further study. According to the field exploration test carried out on wheat crops in the present study, the offset amount of Hdbw under different Dd was different; the higher the distance between the spray boom and the canopy top was, the closer the corresponding position of Hdbw was to the wheat roots. Therefore, the height estimate percentile can provide a better height estimate within the lower range of Dd, but under the higher Dd range, the fixed height estimate percentile is not necessarily suitable, and its accuracy is affected by variations in Dd.
Through the detection of cuboids on level ground, it was found that the unilateral beam widths of an ultrasonic sensor gradually increase within the Dd range of 200~1000 mm and rapidly decrease within the Dd range of 1000~1800 mm. When detecting wheat height in the field, it was found that when the ultrasonic sensor was in the range of Dd 450~1000 mm, there was a clear variation between the position corresponding to Hdbw and Dd; however, as Dd gradually increased ≥ 1000 mm, Hdbw fluctuated greatly. A comparison of the detection results in the level ground and the field shows that when Dd is within 200~1000 mm, the lower Dd is, the more concentrated the ultrasonic echo energy and, therefore, a smaller object can still provide effective detection values. When Dd is larger, the ultrasonic divergence angle and field of view are larger, which reduces the detection accuracy of the ultrasonic sensor [37]. When Dd increases, the number of wheat leaves within the range of the ultrasonic divergence angle increases correspondingly, and the size of wheat leaves increases. The morphology becomes complicated, and it is difficult to provide a stable ultrasonic energy-reflecting surface. Considering that the ultrasonic sensor may be affected by attenuation, scattering, and other interference during propagation, the possibility of interference is more likely when Dd is longer, and the ultrasonic waves may even be reflected or scattered by the wheat leaves multiple times, resulting in a larger signal fluctuation. Therefore, according to the variation in the detection position under different Dd, the Hdbw within the range of different detection Dd was revised separately to estimate Habw more accurately and improve the detection accuracy. For a larger Dd, no compensation was made. The optimal Dd range for the model was set; this is one of the reasons why the single A value of the model cannot be applied to all growth stages of wheat.

4.2. Effects of Different Wheat Growth Stages on the Detection of the Location of Wheat in the Field by the Ultrasonic Sensor

This paper used an accurate and nondestructive test method to detect the height of wheat during its six growth stages in a field exploration test. The effects of changes in leaf spatial morphology, plant height, and canopy density during the growth process of wheat on detection by ultrasonic sensors were obtained. From the perspective of Upp, during the different growth stages of wheat, the corresponding range of Dd within the same Upp range gradually increased. At the standing stage, the range of Dd corresponding to Upp above 85% was 450~701 mm. From the jointing stage to the maturity stage, the range of Dd corresponding to the Upp above 85% expanded to 450~850 mm, indicating that with the extension of the wheat growth cycle, the Dd corresponding to the same UPP began to expand. The effect of the change in Dd on the ultrasonic detection position gradually decreased with the prolongation of the growth cycle. From the perspective of Dd, during the wheat maturity stage, the UPP corresponding to the Dd range of 450~850 mm increased to 90%, indicating that the ultrasonic detection position was closer to the top of the wheat. Considering that during the growth of wheat, Hapw in the box at the fixed position detected in the field exploration experiment gradually increased, while the number of wheat plants in the box remained unchanged, the change in Hapw caused the wheat canopy to gradually change from sparse to dense, which is the reason why Hdbw and Habw gradually approached each other as the growth cycle lengthened. Regarding the effect of canopy density on the ultrasonic sensor, Zhao and Zhai et al. [35] obtained the change in wheat canopy density by four different degrees of pruning of wheat branches and leaves and detected the variation in wheat canopy with different densities. Their results showed that as the canopy density decreased, the Hdbw offset increased, and the ultrasonic sensor detected more non-canopy top results. Otherwise, the canopy density increased, and the sensor detected more canopy top results. This test method was consistent with the results obtained in the present study at different growth stages of wheat in the field. However, destructive pruning of the wheat canopy was performed, and the leaf morphological changes in different growth stages of wheat were ignored, especially leaf morphological changes before and after the heading stage. Although the specific value of canopy density obtained by weighing the weight of branches and leaves could reflect the difference in canopy density, it changed the original variation in wheat growth.
From the perspective of Hdbw offset, the offset of wheat in the later stages was significantly larger than that in the early stages. However, this does not mean that with the increase in the wheat growth stage, the position of Hdbw is closer to the wheat root because, with the progress of the crop growth stage, the plant height of the wheat also increases, which is the objective reason for the increase in the wheat offset. During the standing stage, the wheat Hapw was between 110 mm and 140 mm. The offset of Hdbw was always <140 mm even if the detection position of the ultrasonic sensor was at the wheat root. In the latter stages of wheat growth, the wheat plant height was approximately 500~700 mm. The offset was greater than 140 mm even if the detection position was in the upper-middle region of the wheat. Combined with the change in UPP, the detection distance corresponding to the better UPP also increases with the progression of the crop growth stage (here the better UPP refers to the UPP ≥ 85). Therefore, it is very important to consider the variation in crop height and UPP when analyzing the offset of detection values in different growth stages of wheat. In addition, the offset of different wheat growth stages is also different, which is another reason why it is difficult to establish a single A value for the model.

5. Conclusions

(1)
The ultrasonic sensor detects the top of the wheat canopy, and its detection position is actually under the top of the canopy. If Hdbw is directly used as the control input of the spraying operation, it leads to a large detection position offset, and the offset of Hdbw can reach 191 mm when Dd is in the range of 450~1000 mm. Under the influence of environmental wind, ultrasonic detection of crops cannot guarantee the vertical relationship, resulting in fluctuations in the detection value, which may affect the detection results. In future work, the influence of field environmental wind on the detection of ultrasonic sensors is a direction to be considered.
(2)
When the Dd of the ultrasonic sensor is within 450~1000 mm, the larger the Dd is, the closer the detection position is to the root of the wheat, and vice versa; the smaller the Dd is, the closer the detection position is to the top of the wheat. When the detection distance was more than 1000 mm, the detection value fluctuated violently and the position offset reached a maximum of 511 mm. Therefore, when the detection distance is greater than 1000 mm, it is not suitable for the height detection of wheat.
(3)
Different growth stages of wheat also affect detection by the ultrasonic sensor. During the standing stage, the Dd range had a higher Upp only in the range of 450~701 mm (Upp ≥ 85%), which means that only when Dd is in this range can the detection position corresponding to Hdbw be close to the top of the wheat. However, as the wheat growth cycle extends, Hdbw can also have a higher Upp in the larger Dd range of 450~850 mm. Even at the maturity stages, Upp corresponding to Dd in the range of 450~850 mm was both ≥90%.
(4)
This study obtained detection compensation values considering different wheat growth stages and different detection heights. Based on the compensation values, a wheat full-range detection model was established, the model was validated and optimized, the applicable range Dd of the model was determined to be 450~950 mm, and the error of the optimized model was <50 mm. The detection model established in this paper, which was designed according to the differences in the growth stages of crops with the aim of building a data model targeted to adjust the sensor application, is expected to improve the reliability and accuracy of the sensor in the agricultural machinery control system.

Author Contributions

Conceptualization, C.Z. and J.W.; methodology, J.W., S.Y. and C.Z.; validation, S.Y.; formal analyses, S.Y. and C.L.; investigation, J.W., C.L., X.P., X.W. and X.Z.; resources, C.Z. and S.Y.; data curation, J.W. and Y.G.; writing—original draft: J.W.; writing—review and editing, C.Z. and S.Y.; funding acquisition, C.Z., S.Y. and X.W.; supervision. C.Z. and S.Y. All authors have read and agreed to the published version of the manuscript.

Funding

Support for this study was provided by (1) the Research and Application of Key Technologies for Intelligent Farming Decision Platform, An Open Competition Project of Heilongjiang Province, China (grant number: 2021ZXJ05A03); (2) the National Natural Science Foundation of China (grant number: 32201661); (3) the Youth Science Foundation of Beijing Academy of Agricultural and Forestry Sciences (grant number: QNJJ202210); and (4) the Jiangsu Province and Education Ministry Cosponsored Synergistic Innovation Center of Modern Agricultural Equipment (grant number: XTCX1002).

Institutional Review Board Statement

Not applicable.

Data Availability Statement

The data presented in this study are available upon request from the corresponding author.

Conflicts of Interest

The authors declare no conflict of interest.

References

  1. Luo, X.W.; Liao, J.; Hu, L.; Zhou, Z.Y.; Zhang, Z.G.; Zang, Y.; Wang, P.; He, J. Research Progress of Intelligent Agricultural Machinery in China and Practice of Unmanned Farming Fields. South China Agric. Univ. J. 2021, 42, 8–17+5. [Google Scholar] [CrossRef]
  2. Li, D.L.; Li, Z. Analysis and Development Prospects of Unmanned Farming Systems. J. Agric. Mach. 2020, 51, 1–12. [Google Scholar] [CrossRef]
  3. Zhao, C.J. Current Development and Future Prospects of Smart Agriculture. South China Agric. Univ. J. 2021, 42, 1–7. [Google Scholar] [CrossRef]
  4. Speelman, L.; Jansen, J.W. The effect of spray-boom movement on the liquid distribution of field crop sprayers. J. Agric. Eng. Res. 1974, 19, 117–129. [Google Scholar] [CrossRef]
  5. Ramon, H.; De Baerdemaeker, J. Spray boom motions and spray distribution: Part 1, derivation of a mathematical relation. J. Agric. Eng. Res. 1997, 66, 23–29. [Google Scholar] [CrossRef]
  6. Griffith, J.; Strelioff, B.; Schnaider, J. The Hockley Index. ASABE Annu. Int. Meet. 2012, 2012, 1325–1332. [Google Scholar] [CrossRef]
  7. Holterman, H.J.; van de Zande, J.C.; Porskamp, H.A.; Huijsmans, J.F. Modelling spray drift from boom sprayers. Comput. Electron. Agric. 1997, 19, 1–22. [Google Scholar] [CrossRef]
  8. Nuyttens, D.; De Schampheleire, M.; Baetens, K.; Sonck, B. The influence of operator-controlled variables on spray drift from field crop sprayers. Trans. ASABE 2007, 50, 1129–1140. [Google Scholar] [CrossRef]
  9. Baetens, K.; Ho, Q.T.; Nuyttens, D.; De Schampheleire, M.; Endalew, A.M.; Hertog, M.L.; Nicolaï, B.; Ramon, H.; Verboven, P. A validated 2-D diffusion-advection model for prediction of drift from ground boom sprayers. Atmos. Environ. 2009, 43, 1674–1682. [Google Scholar] [CrossRef]
  10. Tumbo, S.D.; Salyani, M.; Whitney, J.D.; Wheaton, T.A.; Miller, W.M. Investigation of laser and ultrasonic ranging sensors for measurements of citrus canopy volume. Appl. Eng. Agric. 2002, 18, 367–372. [Google Scholar] [CrossRef]
  11. Ehlert, D.; Adamek, R.; Horn, H.J. Laser rangefinder-based measuring of crop biomass under field conditions. Precis. Agric. 2009, 10, 395–408. [Google Scholar] [CrossRef]
  12. Dou, H.J.; Wang, S.L.; Zhai, C.Y.; Chen, L.P.; Wang, X.; Zhao, X.G. A 1idar sensor based spray boom height detection method and the corresponding experimenta1 va1idation. Sensors 2021, 21, 2107. [Google Scholar] [CrossRef] [PubMed]
  13. Jimenez-Berni, J.A.; Deery, D.M.; Rozas-Larraondo, P.; Condon, A.G.; Rebetzke, G.J.; James, R.A.; Bovill, W.D.; Furbank, R.T.; Sirault, X.R.R. High throughput determination of plant height, ground cover, and above-ground biomass in wheat with LiDAR. Front. Plant Sci. 2018, 9, 237. [Google Scholar] [CrossRef] [PubMed]
  14. Llorens, J.; Gil, E.; Llop, J.; Escolà, A. Ultrasonic and LIDAR Sensors for Electronic Canopy Characterization in Vineyards: Advances to Improve Pesticide Application Methods. Sensors 2011, 11, 2177–2194. [Google Scholar] [CrossRef] [PubMed]
  15. Cui, L.F.; Xue, X.Y.; Ding, S.M.; Le, F.X. Development of a DSP-based electronic control system for the active spray boom suspension. Comput. Electron. Agric. 2019, 166, 105024. [Google Scholar] [CrossRef]
  16. Sinfort, C.; Miralles, A.; Sevila, F.; Maniere, G.M. Study and development of a test method for spray boom suspensions. J. Agric. Eng. Res. 1994, 59, 245–252. [Google Scholar] [CrossRef]
  17. Wang, S.L.; Zhao, C.J.; Wang, X. Design and test of boom height adjustment system. J. Agric Mech. Res. 2014, 36, 161–164+173. [Google Scholar] [CrossRef]
  18. Pittman, J.J.; Arnall, D.B.; Interrante, S.M.; Moffet, C.A.; Butler, T.J. Estimation of biomass and canopy height in bermudagrass, alfalfa, and wheat using ultrasonic, laser, and spectral sensors. Sensors 2015, 15, 2920–2943. [Google Scholar] [CrossRef]
  19. Barmeier, G.; Mistele, B.; Schmidhalter, U. Referencing laser and ultrasonic height measurements of barleycultivars by using a herbometre as standard. Crop Pasture Sci. 2016, 67, 1215–1222. [Google Scholar] [CrossRef]
  20. Chang, Y.K.; Zaman, Q.U.; Rehman, T.U.; Farooque, A.A.; Esau, T.; Jameel, M.W. A real-time ultrasonic system to measure wild blueberry plant height during harvesting. Biosyst. Eng. 2017, 157, 35–44. [Google Scholar] [CrossRef]
  21. Bronson, K.F.; French, A.N.; Conley, M.M.; Barnes, E.M. Use of an ultrasonic sensor for plant height estimation in irrigated cotton. Agron. J. 2021, 113, 2175–2183. [Google Scholar] [CrossRef]
  22. Farooque, A.A.; Chang, Y.K.; Zaman, Q.U.; Groulx, D.; Schumann, A.W.; Esau, T.J. Performance evaluation of multiple ground based sensors mounted on a commercial wild blueberry harvester to sense plant height, fruit yield and topographic features in real-time. Comput. Electron. Agric. 2013, 91, 135–144. [Google Scholar] [CrossRef]
  23. Schumann, A.W.; Zaman, Q.U. Software Development for Real-Time Ultrasonic Mapping of Tree Canopy Size. Comput. Electron. Agric. 2005, 47, 25–40. [Google Scholar] [CrossRef]
  24. Escolà, A.; Planas, S.; Rosell, J.R.; Pomar, J.; Camp, F.; Solanelles, F.; Gràcia, F.; Llorens, J.; Gil, E. Performance of an ultrasonic ranging sensor in apple tree canopies. Sensors 2011, 11, 2459–2477. [Google Scholar] [CrossRef] [PubMed]
  25. Zaman, Q.U.; Salyani, M.; Zaman, Q.U.; Salyani, M. Effects of foliage density and ground speed on ultrasonic measurement of citrus tree volume. Appl. Eng. Agric. 2004, 20, 173–178. [Google Scholar] [CrossRef]
  26. Aziz, S.A.; Steward, B.L.; Birrell, S.J.; Kaspar, T.C.; Shrestha, D.S. Ultrasonic sensing for corn plant canopy characterization. In Proceedings of the ASAE Annual International Meeting, Cobo Center in, Detroit, Detroit, MI, USA, 8–11 July 2024. [Google Scholar] [CrossRef]
  27. Li, H.Z.; Zhai, C.Y.; Weckler, P.; Wang, N.; Yang, S.; Zhang, B. A Canopy Density Model for Planar Orchard Target Detection Based on Ultrasonic Sensors. Sensors 2017, 17, 31. [Google Scholar] [CrossRef] [PubMed]
  28. Nan, Y.L.; Zhang, H.C.; Zheng, J.Q.; Bian, L.M.; Li, Y.X.; Yang, Y.; Zhang, M.; Ge, Y. Estimating leaf area density of Osmanthus trees using ultrasonic sensing. Biosyst. Eng. 2019, 186, 60–70. [Google Scholar] [CrossRef]
  29. Gil, E.; Escolà, A.; Rosell, J.R.; Planas, S.; Val, L. Variable rate application of plant protection products in vineyard using ultrasonic sensors. Crop Prot. 2007, 26, 1287–1297. [Google Scholar] [CrossRef]
  30. Maghsoudi, H.; Minaei, S.; Ghobadian, B.; Masoudi, H. Ultrasonic sensing of pistachio canopy for low-volume precision spraying. Comput. Electron. Agric. 2015, 112, 149–160. [Google Scholar] [CrossRef]
  31. Zhou, H.T.; Jia, W.D.; Li, Y.; Ou, M.X. Method for estimating canopy thickness using ultrasonic sensor technology. Agriculture 2021, 11, 1011. [Google Scholar] [CrossRef]
  32. Andújar, D.; Weis, M.; Gerhards, R. An Ultrasonic System for Weed Detection in Cereal Crops. Sensors 2012, 12, 17343–17357. [Google Scholar] [CrossRef] [PubMed]
  33. Li, B.; Bai, X.H.; Li, Y.K. A crop canopy localization method based on ultrasonic ranging and iterative self-organizing data analysis technique algorithm. Sensors 2020, 20, 818. [Google Scholar] [CrossRef] [PubMed]
  34. Dou, H.J.; Zhai, C.Y.; Chen, L.P.; Wang, S.L.; Wang, X. Field variation characteristics of sprayer boom height using a newly designed boom height detection system. IEEE Access 2021, 9, 17148–17160. [Google Scholar] [CrossRef]
  35. Zhao, X.G.; Zhai, C.Y.; Wang, S.L.; Dou, H.J.; Yang, S.; Wang, X.; Chen, L. Sprayer boom height measurement in wheat field using ultrasonic sensor: An exploratory study. Front. Plant Sci. 2022, 13, 1008122. [Google Scholar] [CrossRef]
  36. Scotford, I.M.; Miller, P.C.H. Combination of Spectral Reflectance and Ultrasonic Sensing to monitor the Growth of Winter Wheat. Biosyst. Eng. 2004, 87, 27–38. [Google Scholar] [CrossRef]
  37. Wei, J.; Salyani, M. Development of a Laser Scanner for Measuring Tree Canopy Characteristics: Phase 1. Prototype Development. Trans. ASAE 2004, 47, 2101–2107. [Google Scholar] [CrossRef]
Figure 1. Boom height detection system.
Agriculture 14 00021 g001
Figure 2. Ultrasonic sensor initial detection curve calibration: (a) Calibration process of initial detection curve; (b) Codesys V2.3 software interface.
Agriculture 14 00021 g002
Figure 3. Ultrasonic sensor detection beam width calibration: (a) Calibration process of beam width; (b) Schematic diagram of beam width calibration.
Agriculture 14 00021 g003
Figure 4. Field exploration test.
Agriculture 14 00021 g004
Figure 5. Calibration of the initial detection curve of the ultrasound sensor: (a) Sensor 1; (b) Sensor 2; and (c) Sensor 3.
Agriculture 14 00021 g005aAgriculture 14 00021 g005b
Figure 6. Calibration of ultrasonic sensor beam widths.
Agriculture 14 00021 g006
Figure 7. Output consistency results from the same type of sensor.
Agriculture 14 00021 g007
Figure 8. The initial detection curve fusion results from the same type of ultrasonic sensors.
Agriculture 14 00021 g008
Table 1. The results of variance analysis.
SensorsAnalysis of VarianceFp-Value
Sensor1Between-group variance147.094.25 × 10−10
Sensor2Between-group variance154.822.81 × 10−10
Sensor3Between-group variance144.344.95 × 10−10
Table 2. Consistency verification results of fusion curve output.
Current Values/μADetection Values/mmDifference/mm
Sensor 1Sensor 2Sensor 3FusionMaxMin
4000135115141131164
6000366354370364102
800059859459859622
10,00082983382782940
12,0001061104210551062201
14,0001293131112841295162
16,0001524155015131528224
18,0001756179017411760304
20,0001987202919701993366
Table 3. Ultrasonic detection of the boom height in the standing stage to maturity stage of wheat.
StageHdbw/mmHabw/mmOffset/mmHapw/mmUpp/%
S1S2S3S1S2S3S1S2S3S1S2S3S1S2S3
P146847146045046045018111013912011387.0590.8391.15
5425145305325005231014713912011392.8188.3393.81
64061359562559858015151713912011389.2187.586.73
69969463168068061519141613912011386.3388.3385.84
75881971573479970124201413912011382.7383.3387.61
81588781878486579631222213912011377.781.6780.53
86598998084096194725283313912011382.0176.6770.8
920111011208911058107529524513912011379.1456.6760.18
112112001214100811601138113407613912011318.7166.6732.74
123113741300113512741231961006913912011330.9416.6738.94
133114871450122013971357111909313912011320.142517.7
P25355784505105524452526544739344294.4193.3898.87
56762654854061052027162844739344293.9695.9393.67
64870165162067063028312144739344293.7492.1195.25
68678070366475067822302544739344295.0892.3794.34
83784284379880080539423844739344291.2889.3191.4
94492689187186485073624144739344283.6784.2290.72
96795293389589086572626844739344283.8984.2284.62
9951045105296497197331747944739344293.0681.1782.13
11421218128310071096106513512221844739344269.868.9650.68
12651317132910891136114317618118644739344260.6353.9457.92
13761450146811791248117319720229544739344255.9348.633.26
P354053447151550045025342151552852195.1593.5695.97
61859451857154548547493351552852190.8790.7293.67
68063853564360050837382751552852192.8292.894.82
75075058771670055034503751552852193.490.5392.9
955788741869764620862412151552852183.395.4576.78
101186466492781263784522751552852183.6990.1594.82
103491476295185871583564751552852183.8889.3990.98
10871031791991930729961016251552852181.3680.8788.1
150010819011100989830400927151552852122.3382.5886.37
138913201030121711589431721628751552852166.670.0883.3
P448051148745049547030161752655260394.397.197.18
59554354057052052025232052655260395.2595.8396.68
73968070169063065049505152655260390.6890.9491.54
82978170076071065769714352655260386.8887.1492.87
84680076978076073066403952655260387.4592.7593.53
89489794183582085059779152655260388.7886.0584.91
959948102587086093289889352655260383.0884.0684.58
973103510508939349488010110252655260384.7981.783.08
1041123810479511030970902087752655260382.8962.3287.23
12411358132110241062107621729624552655260358.7546.3859.37
P556048348653345545027283654256862295.0295.0794.21
60853956356051053048293354256862291.1494.8994.69
78063465472058059060546454256862288.9390.4989.71
89472772081869067076375054256862285.9893.4991.96
89983584484678479053515454256862290.2291.0291.32
1035950865930867840105832554256862280.6385.3995.98
1079991974968895880111969454256862279.5283.1084.89
147210411000102594089944710110154256862217.5382.2283.76
1625114311001160100097546514312554256862214.2174.8279.90
1700150213541189104010005114623545425686225.7218.6643.09
P661254146058051045032311063865468894.9895.2698.55
72063756067060052350373763865468892.1694.3494.62
7947306307407236175471363865468891.5498.9398.11
85980475281076070049445263865468892.3293.2792.44
96282378086579076597331563865468884.8094.9597.82
1000915871890850810110656163865468882.7690.0691.13
1063103096495093086011310010463865468882.2984.7184.88
130410951050100196493030313112063865468852.5179.9782.56
1465132211571013104996645227319163865468829.1558.2672.24
Table 4. Preliminary grouping by Upp.
StagesUpp/%Dd/mmAverage Offset/mmStandard Deviation/mm
Standing stage85~98450~70113.853.48
70~84734~961264.47
Jointing stage85~98450~85027.759.59
70~84864~97370.00 6.35
Booting stage85~98450~85840.5813.83
70~84869~99189.866.72
Heading stage85~98450~85046.4422.35
70~84860~95191.867.69
Filling stage85~98450~86747.5317.21
70~84880~1000109.516.7
Maturity stage85~98450~85036.8818.26
70~84860~966120.7530.45
Table 5. Preliminary model for boom height detection.
Model EquationCompensation Value/mmApplicable Scope
Dd/mmStage
y = 0.1164x − 334.88 − A13.85450~701Standing
26734~961
27.75450~850Jointing
70864~973
40.58450~858Booting
89.86869~991
46.44450~850Heading
91.86860~951
47.53450~867 Filling
109.5880~1000
36.88450~850 Maturity
120.75860~966
Table 6. Merging model for boom height detection.
Model EquationCompensation Value/mmApplication Scope
Dd/mmStage
y = 0.1164x − 334.88 − A19.93450~1000Standing stage
39.84450~850Jointing stage to maturity stage
96.39851~1000
Table 7. Verification results of the boom height detection model.
StageHabw/mmHdbw1/mmHdbw2/mmEv1/mmEv2/mmAev1/mmAev2/mm
Standing460463457339.509.10
5185075011117
552545539713
64565064451
7177337271610
764773779915
79979179782
89588989560
96196196706
9989689743024
Jointing51350849651719.8919.67
5405635512311
59860158939
6206045921628
6536976854432
800793781719
805800788517
96410249986034
99610129861610
Booting454490491363727.7026.30
5205095101110
6005625633837
500490491109
6706326333837
7007207212021
7747607611413
8408728733233
8999209142115
953101010045751
Heading448427434211423.4424.33
55054855525
5905725791811
6205825893831
67066767434
7467817883542
7758058123037
8428578641522
9649159114953
Filling47047948591524.6718.44
55054254882
63062463060
68067167793
7107287341824
8007697753125
84584885439
9008479165316
9708858988572
Maturity4304244216919.3018.90
5004724692831
5505385351215
7307157121518
7507407371013
790800797107
8508788752825
930911936196
940943968328
9809189436237
Table 8. The final model for boom height detection.
Model EquationCompensation Value/mmApplicable Scope
Dd/mmStage
y = 0.1164x − 334.88 − A19.93450~950Standing stage
39.84450~850Jointing stage to maturity stage
96.39851~950
Disclaimer/Publisher’s Note: The statements, opinions and data contained in all publications are solely those of the individual author(s) and contributor(s) and not of MDPI and/or the editor(s). MDPI and/or the editor(s) disclaim responsibility for any injury to people or property resulting from any ideas, methods, instructions or products referred to in the content.

