


Phosphorus Balance in Sandy Soil Subjected to 12 Years of Successive Applications of Animal Manure and Mineral Phosphate Fertilizer in Subtropical Climate

 ,
,  ,
,  , and
, and 
Abstract
:
1. Introduction
2. Materials and Methods
2.1. Location of Experiment and Treatments
2.2. Collecting Soil Samples
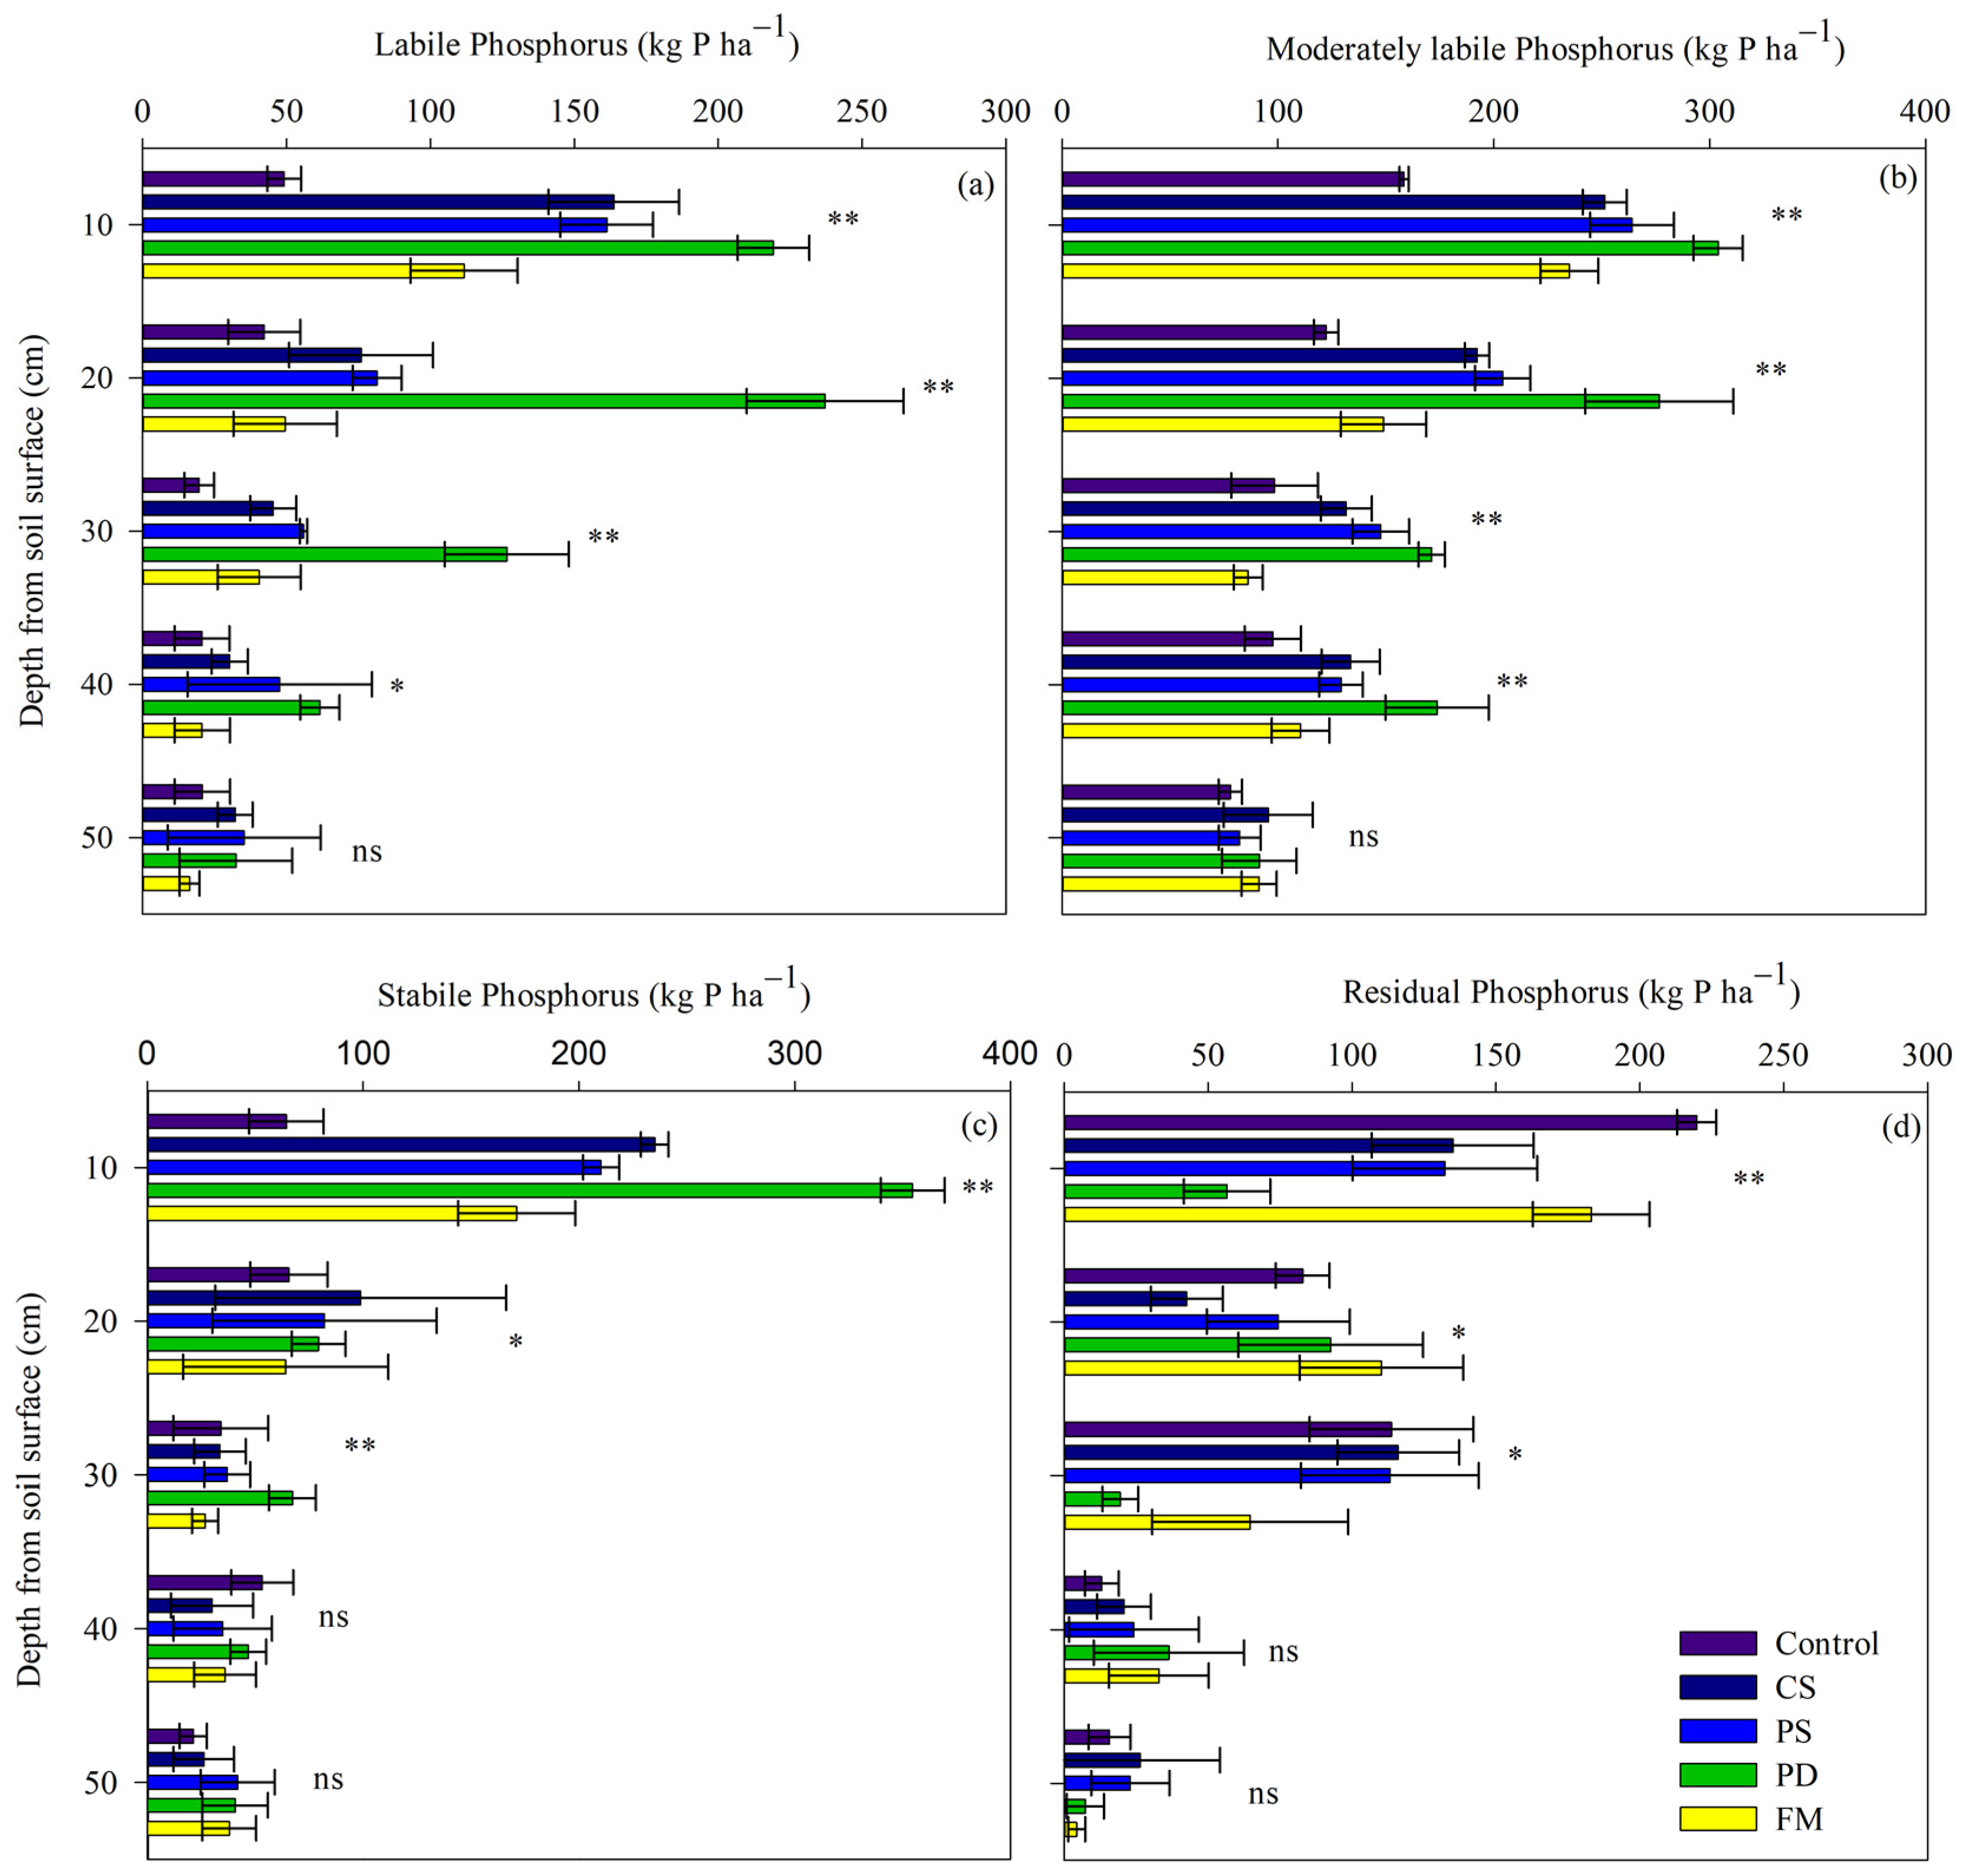
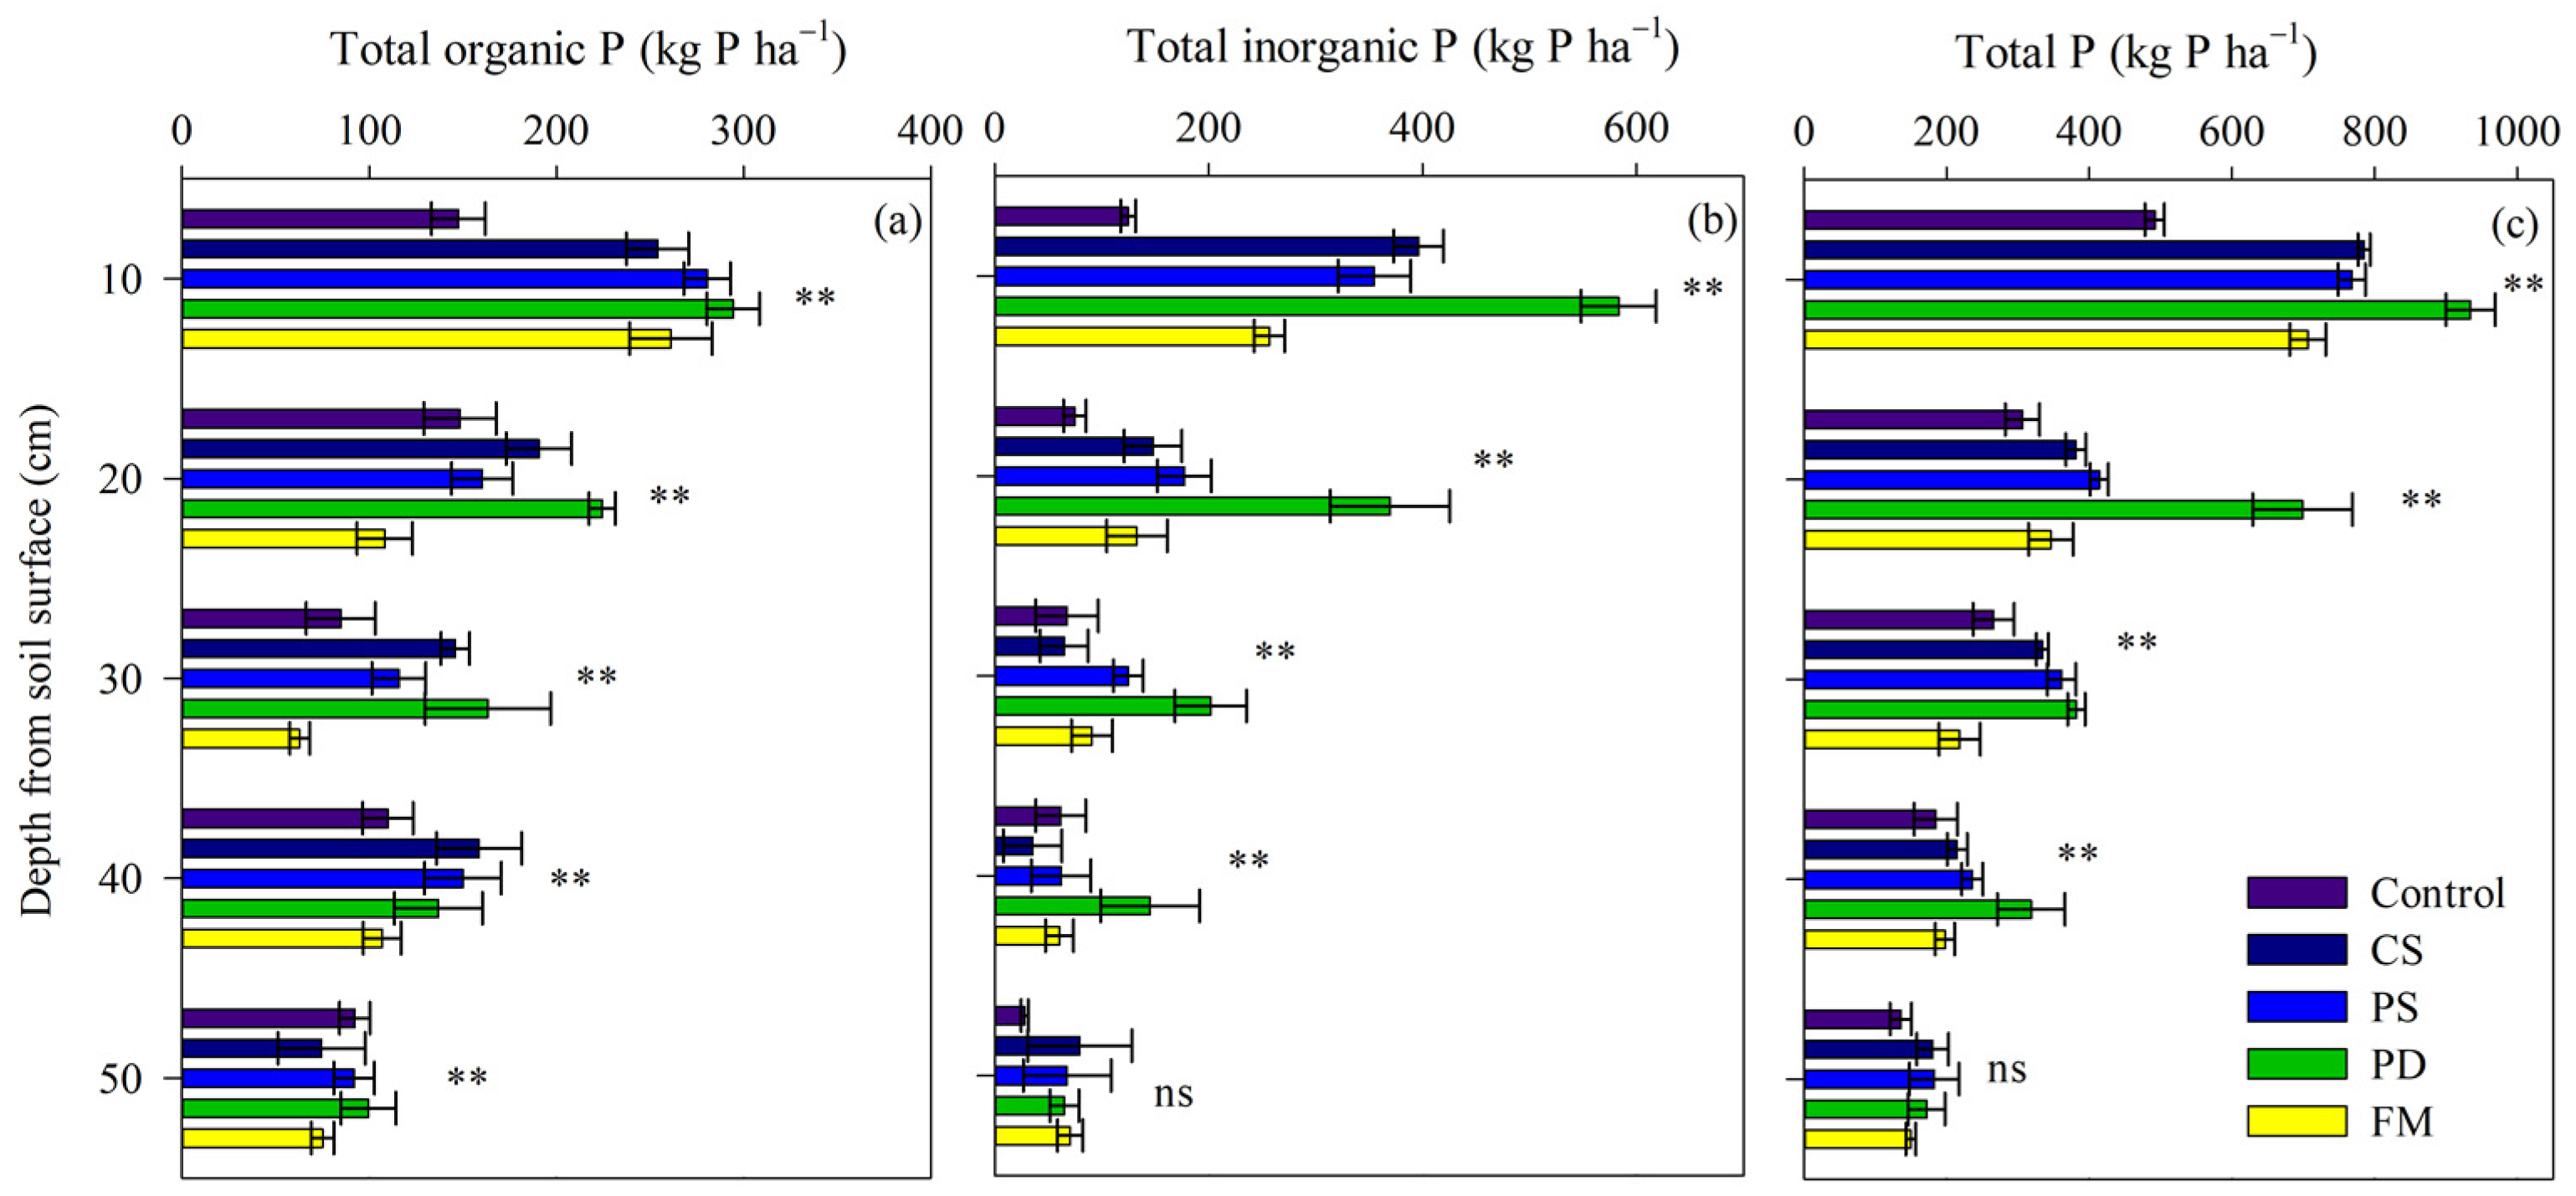
2.3. P Fractionation in Soil
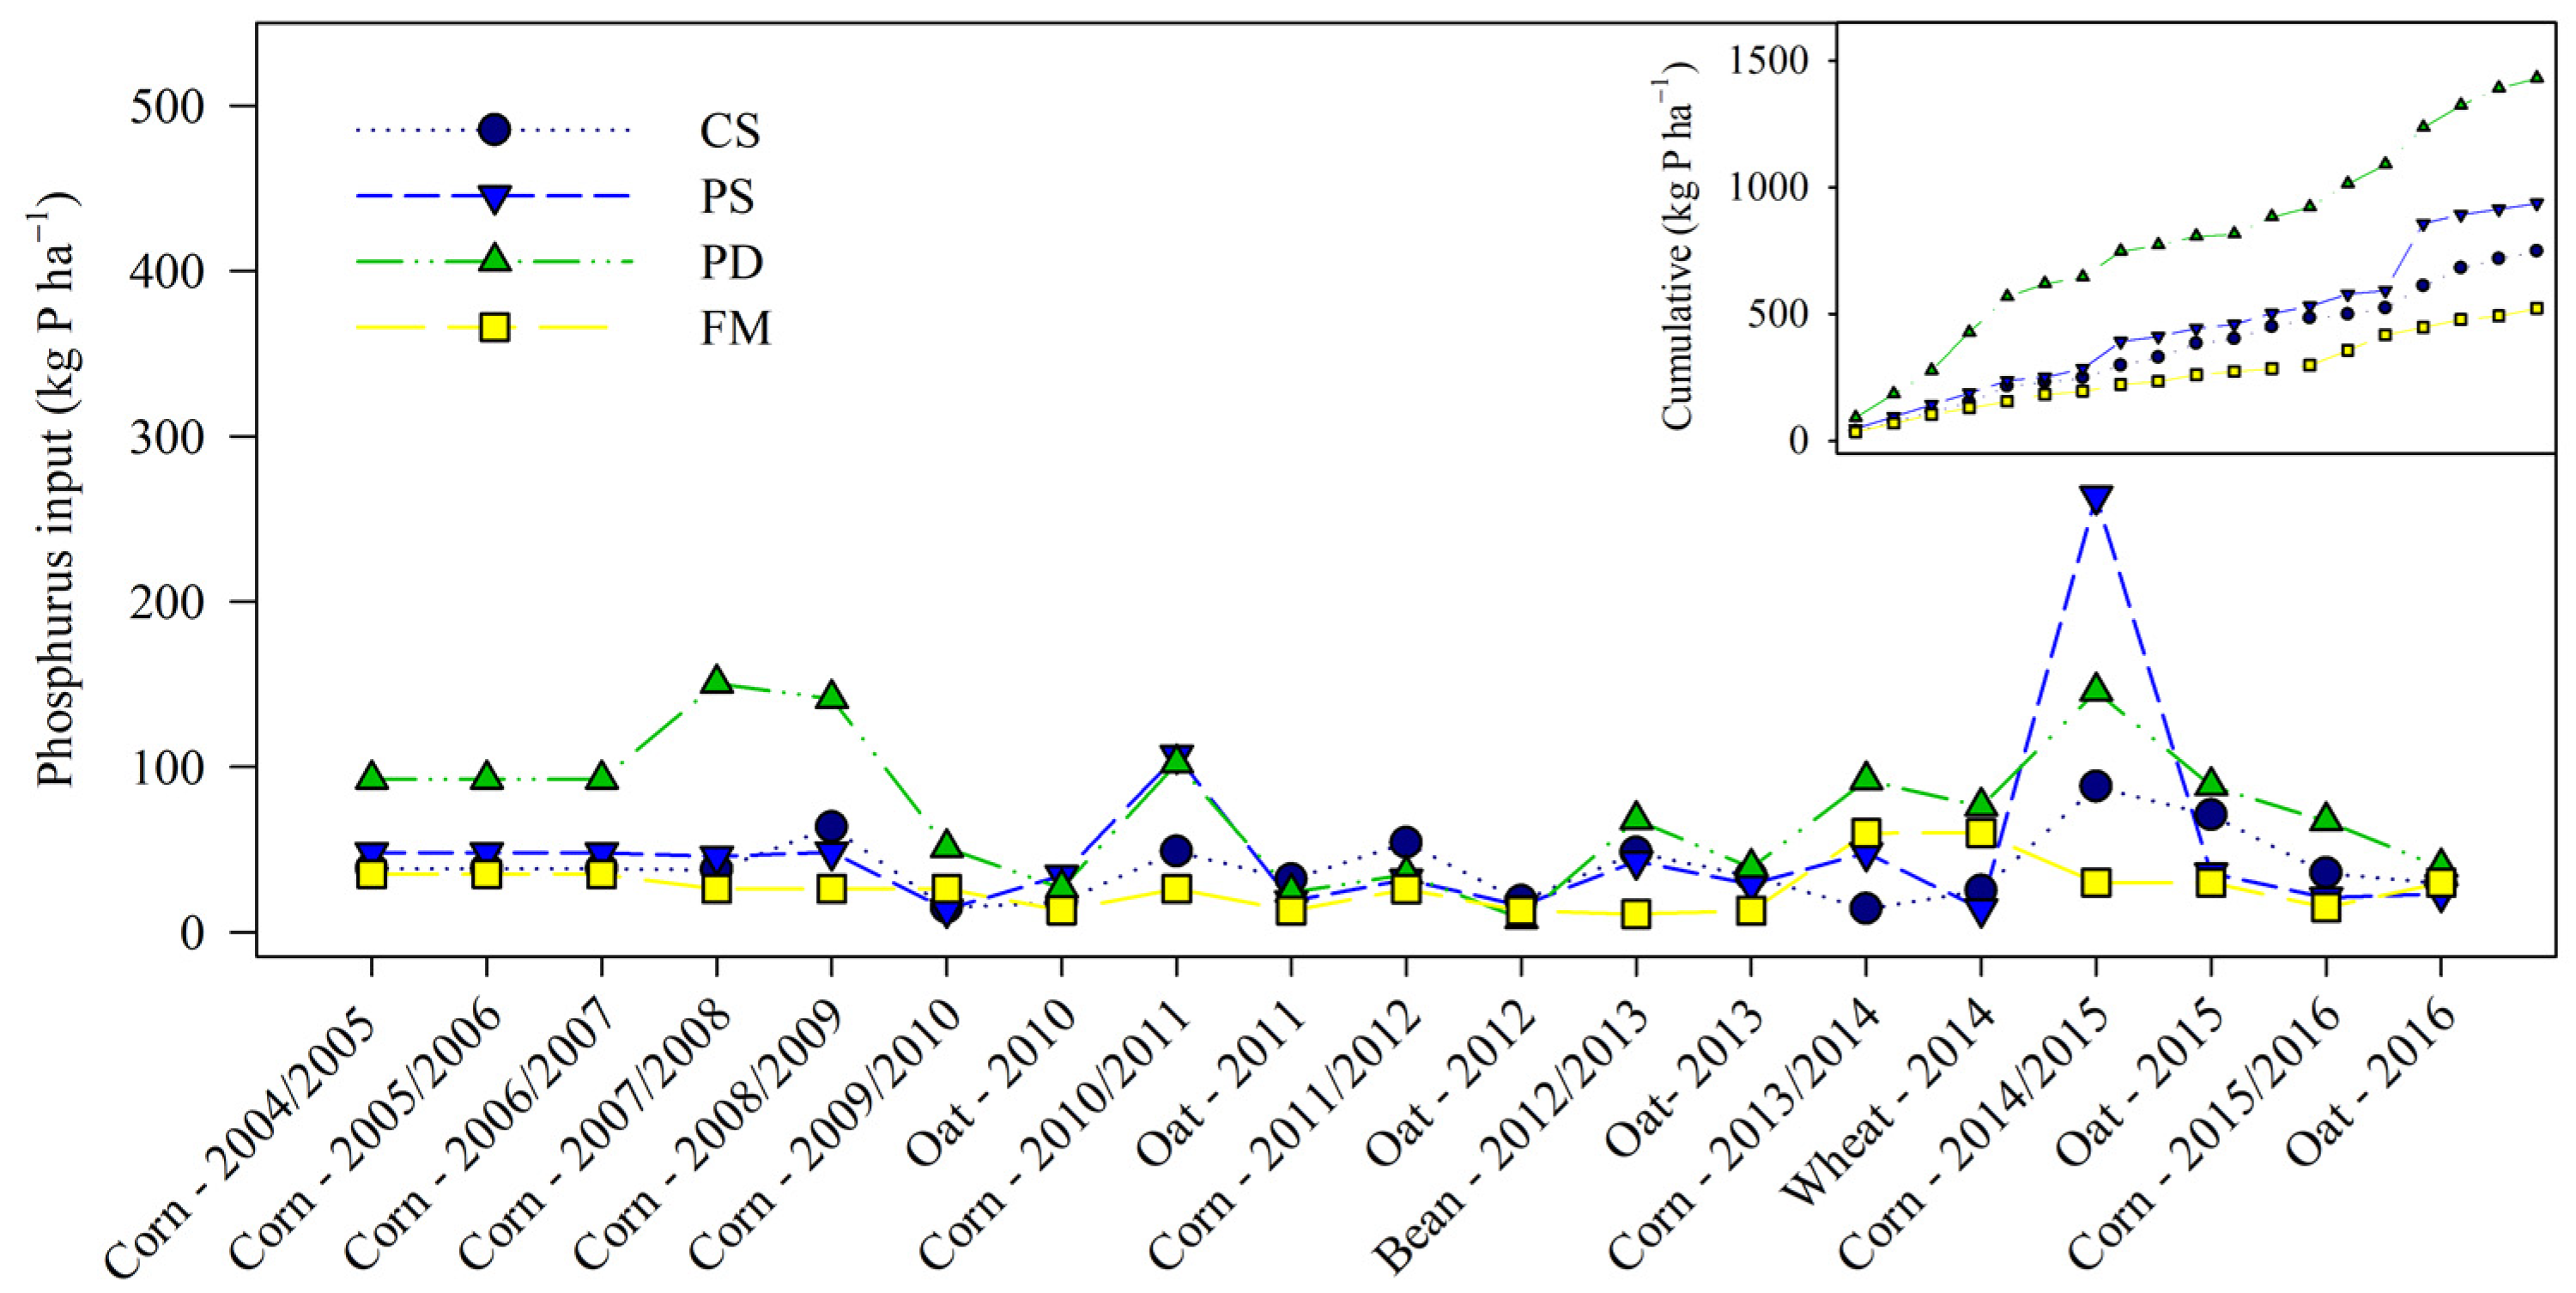
2.4. P Added by Manure and Mineral Fertilizer
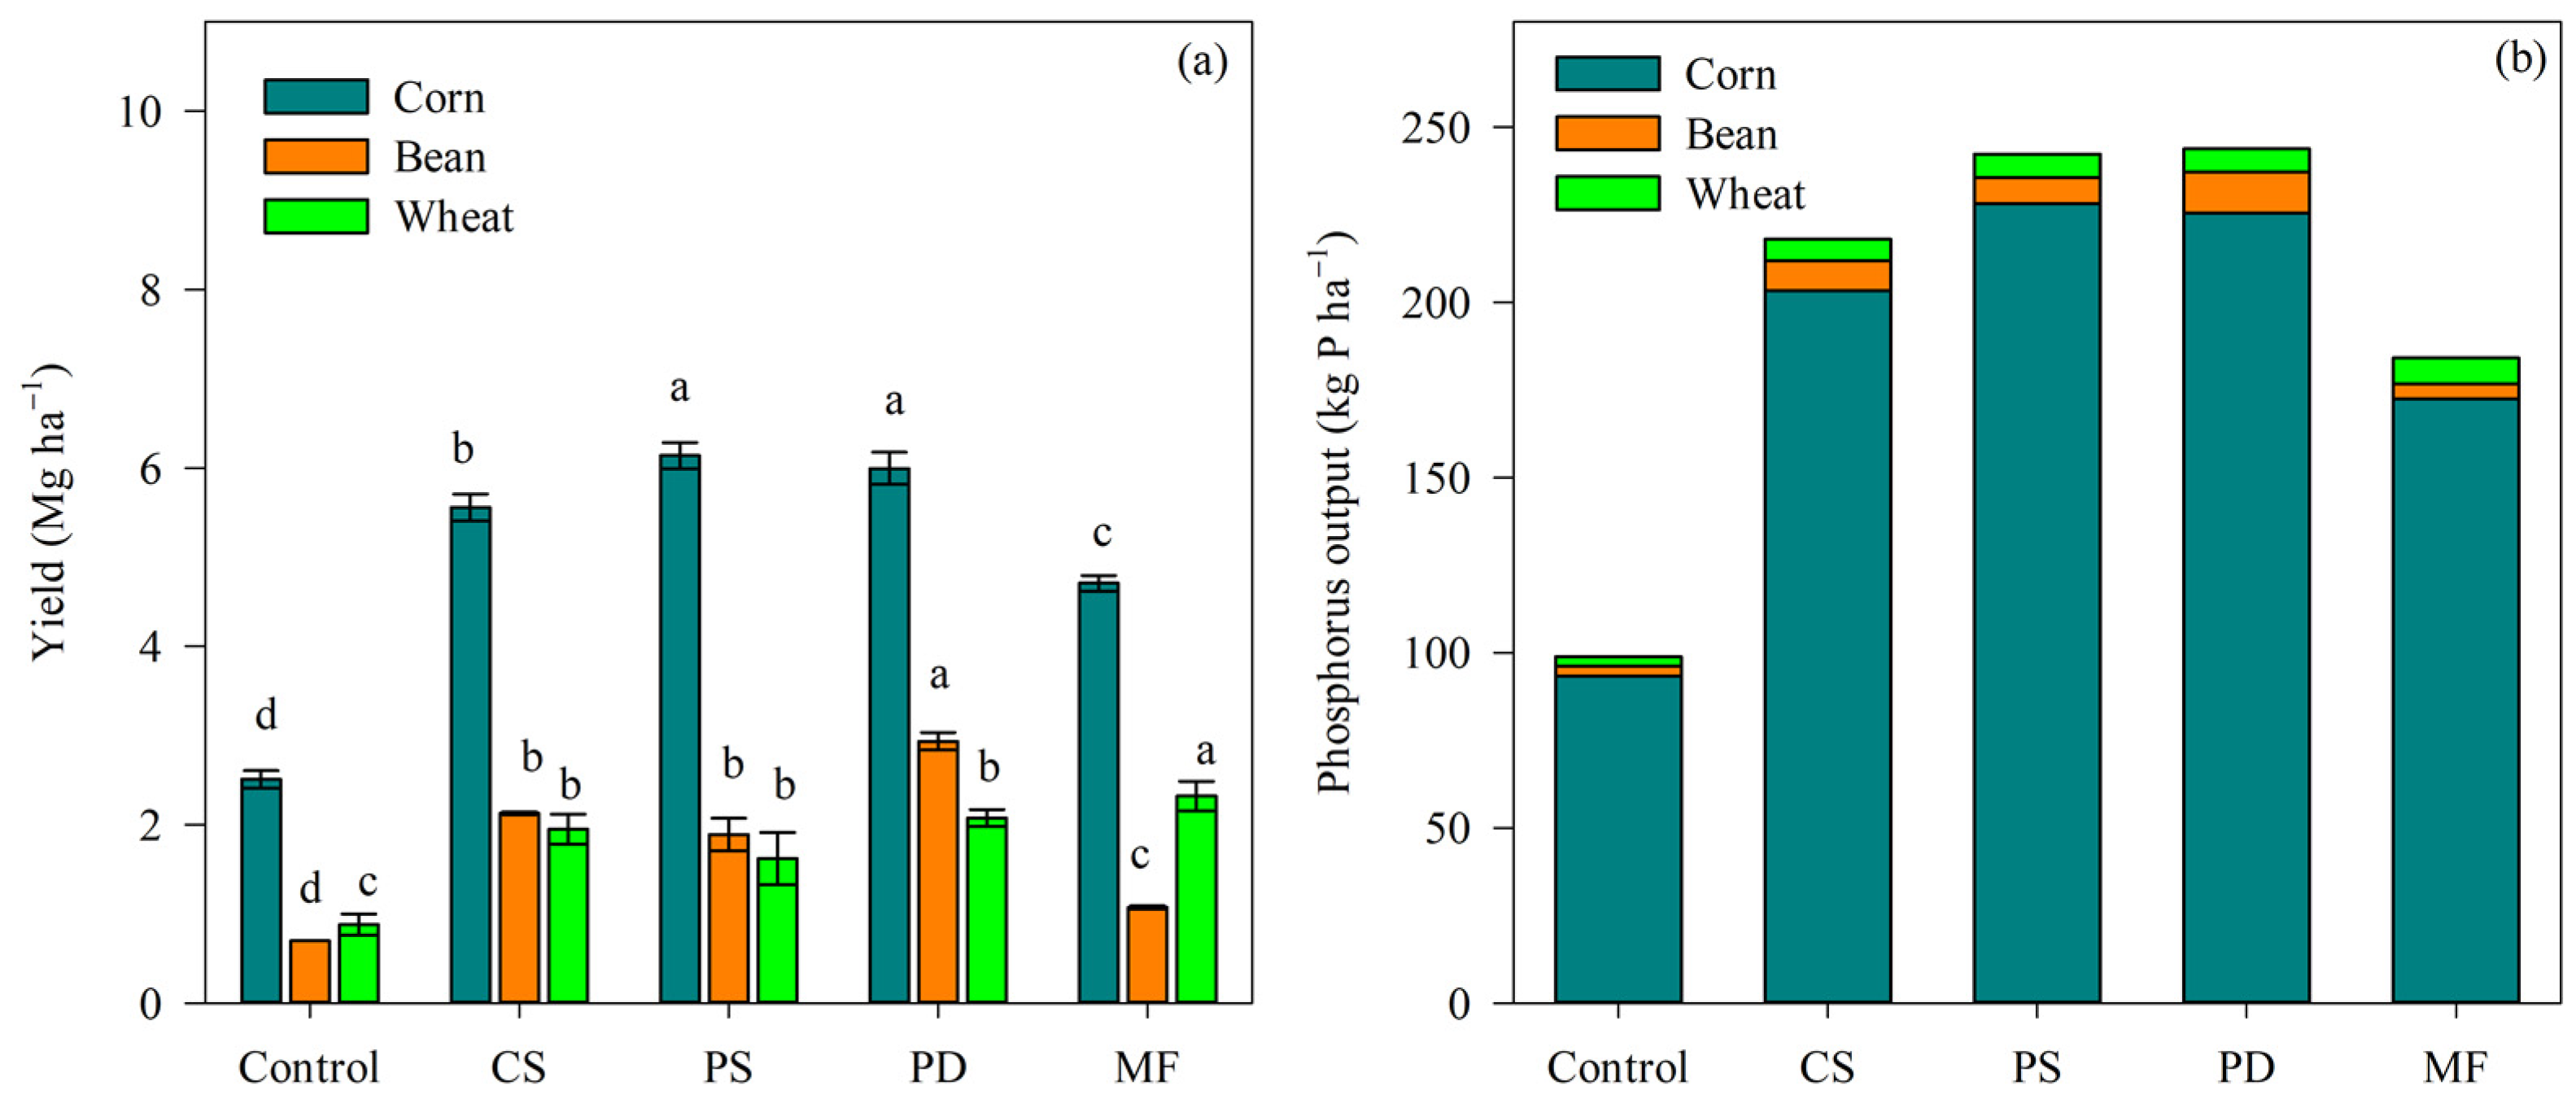
2.5. P in Residue and Exported by Crops
2.6. P Balance
2.7. Statistical Analysis
3. Results
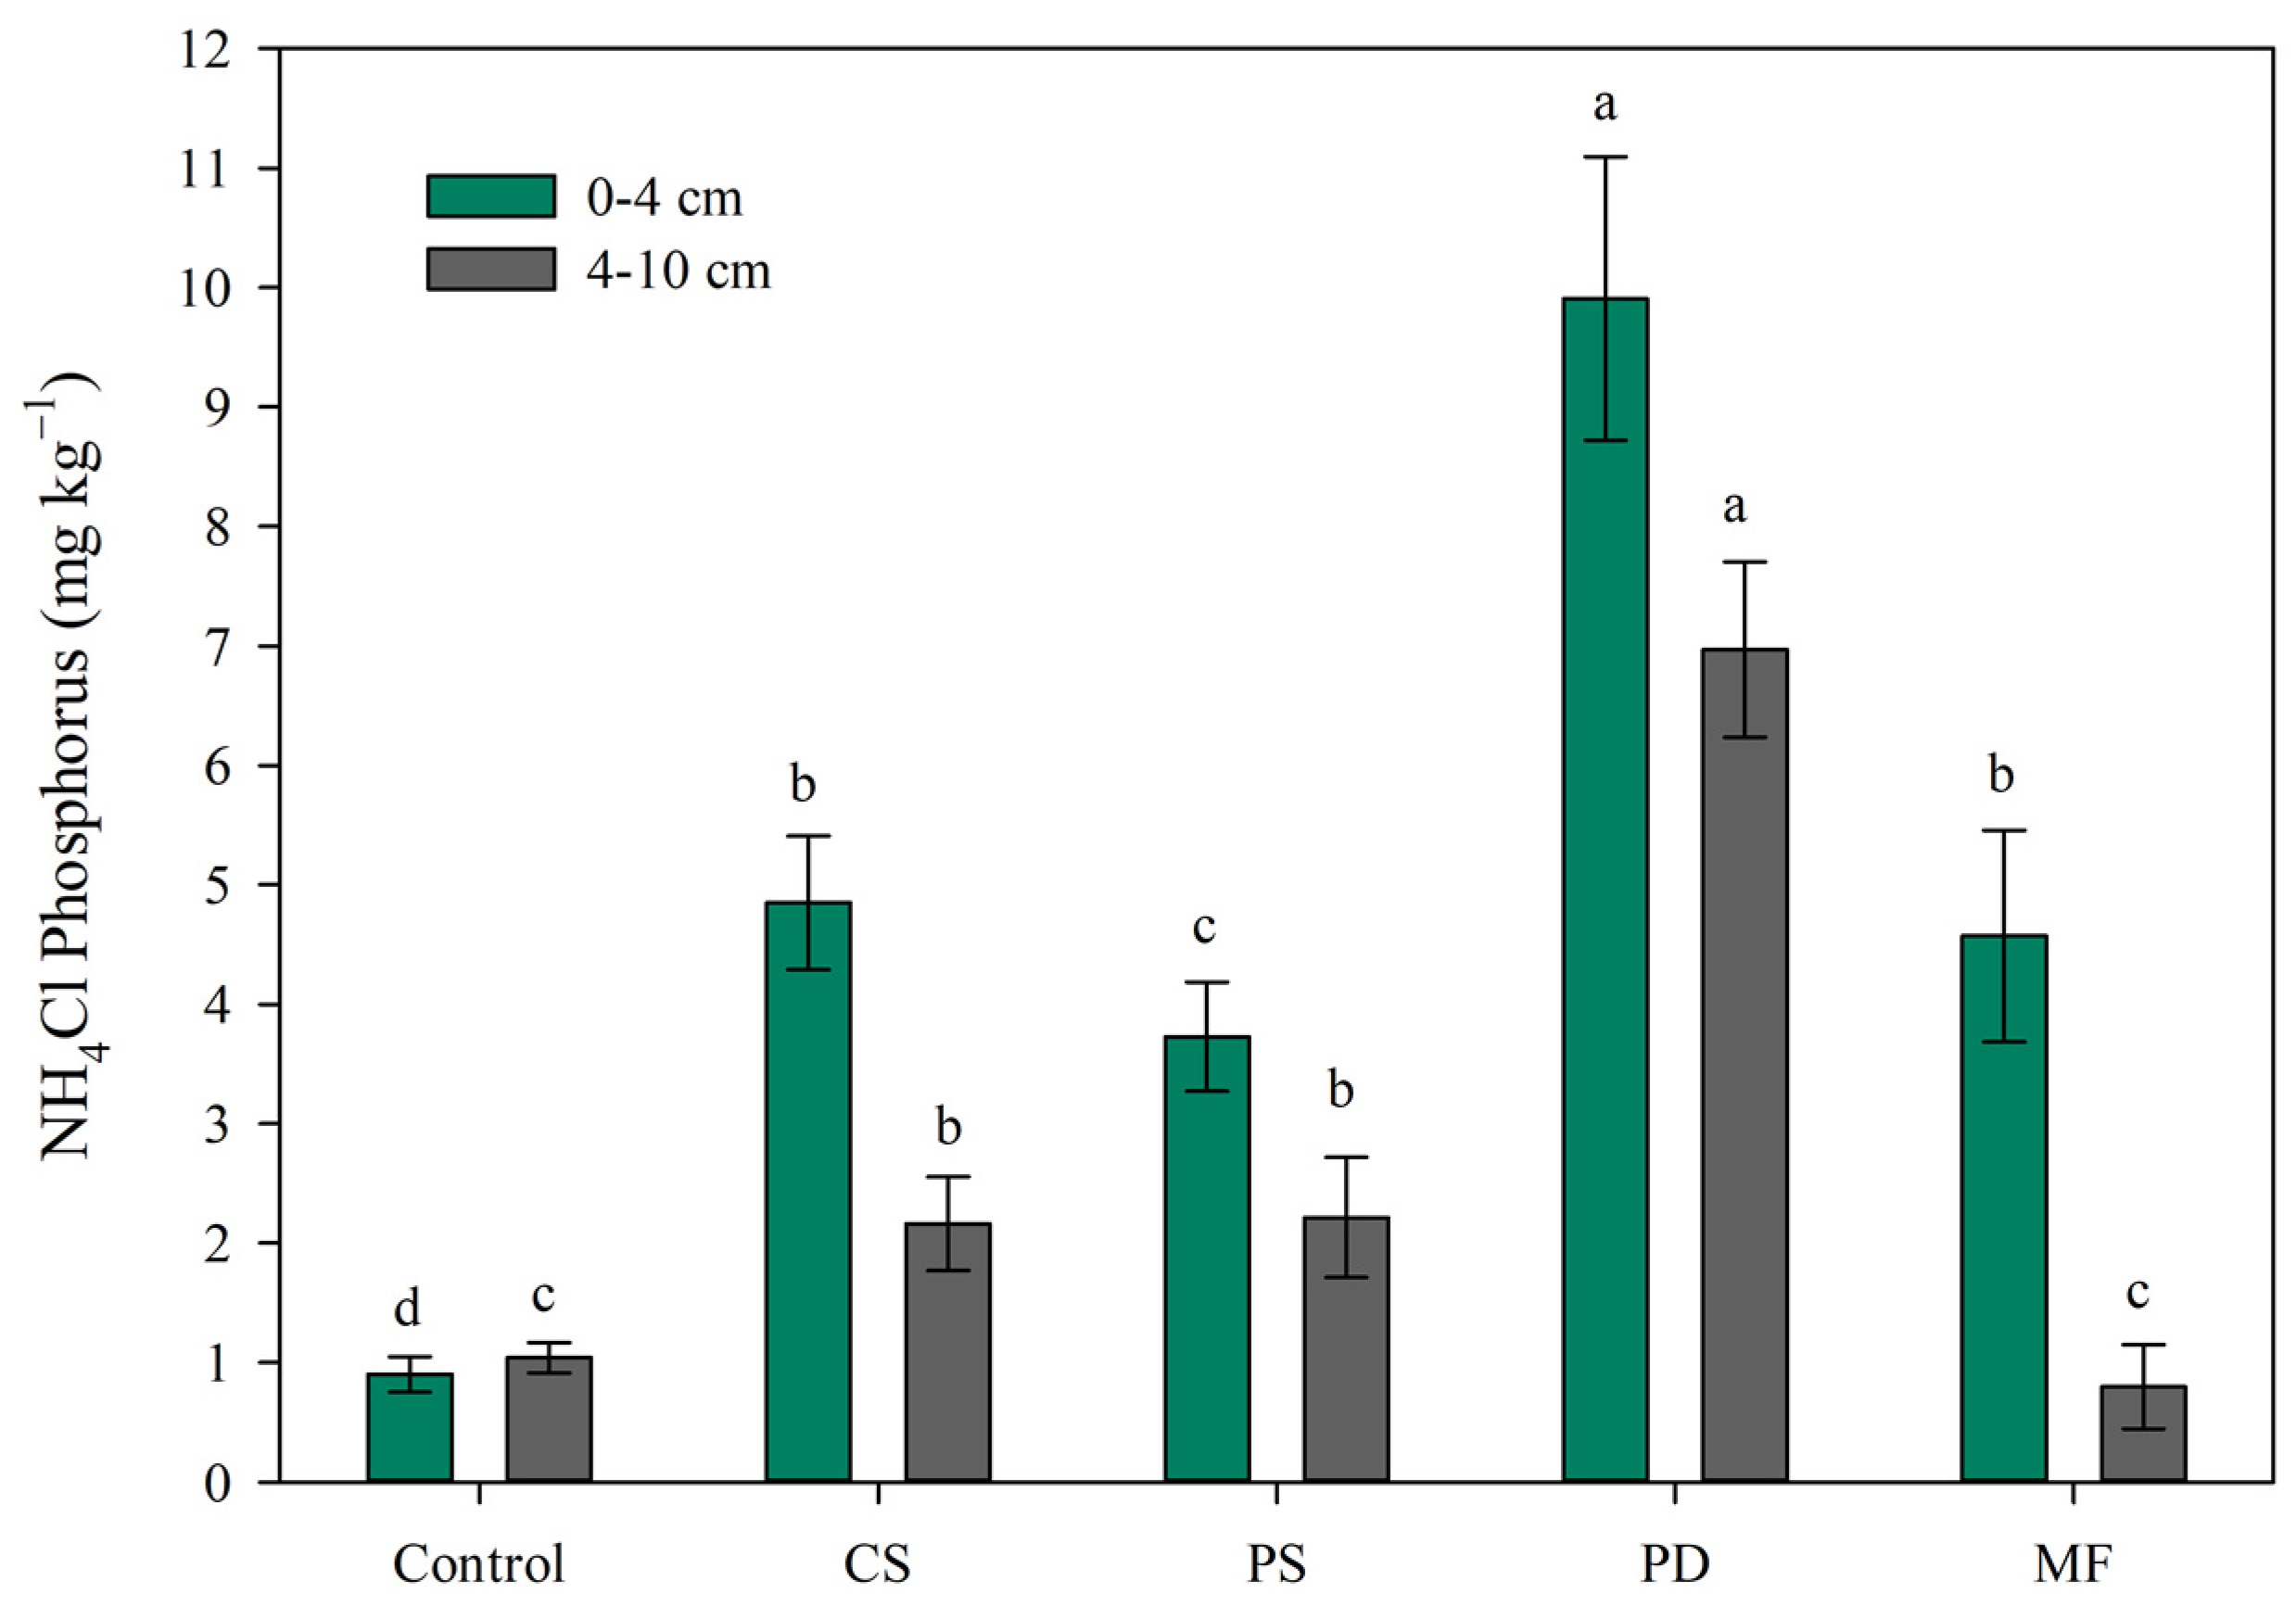
3.1. P in Soil
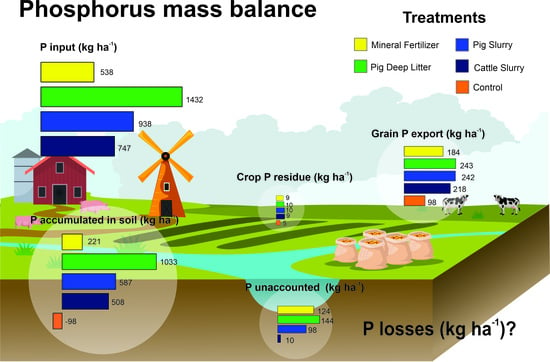
3.2. P Mass Balance
4. Discussion
4.1. Soil P Balance
4.2. Environmental and Agronomic Implications
5. Conclusions
Supplementary Materials
Author Contributions
Funding
Institutional Review Board Statement
Data Availability Statement
Conflicts of Interest
References
- Scholz, R.W.; Ulrich, A.E.; Eilittä, M.; Roy, A. Sustainable Use of Phosphorus: A Finite Resource. Sci. Total Environ. 2013, 461–462, 799–803. [Google Scholar] [CrossRef] [PubMed]
- Scholz, R.W.; Wellmer, F.W. Approaching a Dynamic View on the Availability of Mineral Resources: What We May Learn from the Case of Phosphorus? Glob. Environ. Change 2013, 23, 11–27. [Google Scholar] [CrossRef]
- Cordell, D.; Drangert, J.-O.; White, S. The Story of Phosphorus: Global Food Security and Food for Thought. Glob. Environ. Change 2009, 19, 292–305. [Google Scholar] [CrossRef]
- Geissler, B.; Mew, M.C.; Steiner, G. Phosphate Supply Security for Importing Countries: Developments and the Current Situation. Sci. Total Environ. 2019, 677, 511–523. [Google Scholar] [CrossRef] [PubMed]
- Cordell, D.; Rosemarin, A.; Schröder, J.J.; Smit, A.L. Towards Global Phosphorus Security: A Systems Framework for Phosphorus Recovery and Reuse Options. Chemosphere 2011, 84, 747–758. [Google Scholar] [CrossRef]
- Schneider, K.D.; Thiessen Martens, J.R.; Zvomuya, F.; Reid, D.K.; Fraser, T.D.; Lynch, D.H.; O’Halloran, I.P.; Wilson, H.F. Options for Improved Phosphorus Cycling and Use in Agriculture at the Field and Regional Scales. J. Environ. Qual. 2019, 48, 1247–1264. [Google Scholar] [CrossRef] [PubMed]
- ABPA Relatório Anual; Associação Brasileira de Proteína Animal: São Paulo, Brazil, 2020; Volume 160.
- IBGE Pesquisa Trimestral Do Leite—Primeiros Resultados Dados Da Quantidade de Leite Cru Processado Pela Indústria; IBGE: Rio de Janeiro, Brazil, 2019.
- Haygarth, P.M.; Jarvie, H.P.; Powers, S.M.; Sharpley, A.N.; Elser, J.J.; Shen, J.; Peterson, H.M.; Chan, N.-I.; Howden, N.J.K.; Burt, T.; et al. Sustainable Phosphorus Management and the Need for a Long-Term Perspective: The Legacy Hypothesis. Environ. Sci. Technol. 2014, 48, 8417–8419. [Google Scholar] [CrossRef]
- Embrapa Sistema Brasileiro de Classificação de Solos; 5a.; Embrapa: Rio de Janeiro, Brazil, 2018; ISBN 978-85-7035-800-4.
- Soil Survey Staff Keys to Soil Taxonomy. Soil. Conserv. Serv. 2014, 12, 410. [CrossRef]
- Lourenzi, C.R.; Ceretta, C.A.; Ciancio, N.H.R.; Tiecher, T.L.; da Silva, L.O.S.; De Conti, L.; Girotto, E.; Ferreira, P.A.A.; Vidal, R.F.; Scopel, G.; et al. Forms of Nitrogen and Phosphorus Transfer by Runoff in Soil under No-Tillage with Successive Organic Waste and Mineral Fertilizers Applications. Agric. Water Manag. 2021, 248, 106779. [Google Scholar] [CrossRef]
- Ferreira, P.A.A.; Ceretta, C.A.; Lourenzi, C.R.; De Conti, L.; Marchezan, C.; Girotto, E.; Tiecher, T.L.; Palermo, N.M.; Parent, L.É.; Brunetto, G. Long-Term Effects of Animal Manures on Nutrient Recovery and Soil Quality in Acid Typic Hapludalf under No-Till Conditions. Agronomy 2022, 12, 243. [Google Scholar] [CrossRef]
- Marchezan, C.; Ferreira, P.A.A.; Silva, L.S.; Bacca, A.; Krug, A.V.; Nicoloso, F.T.; Tarouco, C.P.; Tiecher, T.L.; Brunetto, G.; Ceretta, C.A. Nitrogen Availability and Physiological Response of Corn After 12 Years with Organic and Mineral Fertilization. J. Soil. Sci. Plant Nutr. 2020, 20, 979–989. [Google Scholar] [CrossRef]
- Manual de Métodos de Análise de Solo; Embrapa: Brasília, Brazil, 1997; Volume 2, ISBN 8585864036.
- Hedley, M.J.; Stewart, J.W.B.; Chauhan, B.S. Changes in Inorganic and Organic Soil Phosphorus Fractions Induced by Cultivation Practices and by Laboratory Incubations1. Soil Sci. Soc. Am. J. 1982, 46, 970. [Google Scholar] [CrossRef]
- Condron, L.M.; Davis, M.R.; Newman, R.H.; Cornforth, I.S. Influence of Conifers on the Forms of Phosphorus in Selected New Zealand Grassland Soils. Biol. Fertil. Soils 1996, 21, 37–42. [Google Scholar] [CrossRef]
- Condron, L.M.; Newman, S. Revisiting the Fundamentals of Phosphorus Fractionation of Sediments and Soils. J. Soils Sediments 2011, 11, 830–840. [Google Scholar] [CrossRef]
- Olsen, S.R.; Sommers, L.E. Phosphorus. Methods of Soil Analysis, Part 2. In Chemical and Microbiological Properties; Page, A.L., Miller, R.H., Keeney, D.R., Eds.; Soil Science Society of America: Madison, WI, USA, 1982; pp. 403–430. [Google Scholar]
- Dick, W.A.; Tabatabai, M.A. Determination of Orthophosphate in Aqueous Solutions Containing Labile Organic and Inorganic Phosphorus Compounds 1. J. Environ. Qual. 1977, 6, 82. [Google Scholar] [CrossRef]
- Murphy, J.; Riley, J.P. A Modified Single Solution Method for the Determination of Phosphate in Natural Waters. Anal. Chim. Acta 1962, 27, 31–36. [Google Scholar] [CrossRef]
- Cross, A.F.; Schlesinger, W.H. A Literature Review and Evaluation of the. Hedley Fractionation: Applications to the Biogeochemical Cycle of Soil Phosphorus in Natural Ecosystems. Geoderma 1995, 64, 197–214. [Google Scholar] [CrossRef]
- McDowell, R.W.; Sharpley, A.N. Approximating Phosphorus Release from Soils to Surface Runoff and Subsurface Drainage. J. Environ. Qual. 2001, 30, 508. [Google Scholar] [CrossRef] [PubMed]
- Sharpley, A.N.; Mcdowell, R.W.; Kleinman, P.J.A. Phosphorus Loss from Land to Water: Integrating Agricultural and Environmental Management. Proc. Plant Soil 2001, 237, 287–307. [Google Scholar] [CrossRef]
- Gatiboni, L.C.; Smyth, T.J.; Schmitt, D.E.; Cassol, P.C.; de Oliveira, C.M.B. de Soil Phosphorus Thresholds in Evaluating Risk of Environmental Transfer to Surface Waters in Santa Catarina, Brazil. Rev. Bras. Cienc. Solo 2015, 39, 1225–1234. [Google Scholar] [CrossRef]
- Gatiboni, L.C.; Nicoloso, R.d.S.; Mumbach, G.L.; de Souza Junior, A.A.; Dall’orsoletta, D.J.; Schmitt, D.E.; Smyth, T.J. Establishing Environmental Soil Phosphorus Thresholds to Decrease the Risk of Losses to Water in Soils from Rio Grande Do Sul, Brazil. Rev. Bras. Cienc. Solo 2020, 44, 1–14. [Google Scholar] [CrossRef]
- Manual of Liming and Fertilization for the States of Rio Grande do Sul and Santa Catarina; Brazilian Soil Science Society: Viçosa, Brazil, 2016; 376p, ISBN 978-85-66301-80-9.
- Boitt, G.; Schmitt, D.E.; Gatiboni, L.C.; Wakelin, S.A.; Black, A.; Sacomori, W.; Cassol, P.C.; Condron, L.M. Fate of Phosphorus Applied to Soil in Pig Slurry under Cropping in Southern Brazil. Geoderma 2018, 321, 164–172. [Google Scholar] [CrossRef]
- Lourenzi, C.R.; Ceretta, C.A.; Cerini, J.B.; Ferreira, P.A.A.; Lorensini, F.; Girotto, E.; Tiecher, T.L.; Schapanski, D.E.; Brunetto, G. Available Content, Surface Runoff and Leaching of Phosphorus Forms in a Typic Hapludalf Treated with Organic and Mineral Nutrient Sources. Rev. Bras. Cienc. Solo 2014, 38, 544–556. [Google Scholar] [CrossRef]
- RStudio Team. 2015. RStudio: Integrated Development for R. RStudio, PBC, Boston, MA. Available online: https://www.rstudio.com/ (accessed on 27 August 2023).
- Filho, J.d.S.O.; Ferrari, A.C.; Pereira, M.G.; Pinto, L.A.d.S.R.; Pinto, L.A.d.S.R.; Matos, T.S. Phosphorus Accumulation in Soil after Successive Applications of Swine Manure: A Long-Term Study in Brazil. Environ. Earth Sci. 2020, 79, 62. [Google Scholar] [CrossRef]
- Oyeleke Azeez, M.; Therese Christensen, J.; Ravnskov, S.; Johann Heckrath, G.; Labouriau, R.; Christensen, B.T.; Holton Rubaek, G. Phosphorus in an Arable Coarse Sandy Soil Profile after 74 Years with Different Lime and P Fertilizer Applications. Geoderma 2020, 376, 114555. [Google Scholar] [CrossRef]
- Parfitt, R.L. Phosphate Reactions with Natural Allophane, Ferrihydrite and Goethite. J. Soil. Sci. 1989, 40, 359–369. [Google Scholar] [CrossRef]
- Barrow, N.J. Landmark Papers A Mechanistic Model for Describing the Sorption and Desorption of Phosphate by Soil. Eur. J. Soil. Sci. 2015, 66, 9–18. [Google Scholar] [CrossRef]
- Oliveira, P.; Soares, W. Produção e Manejo de Dejetos de Suínos. Produção Anim. Visão Bras. 2001, d, 72–90. [Google Scholar]
- Baxter, C.A.; Joern, B.C.; Ragland, D.; Sands, J.S.; Adeola, O. Phytase, High-Available-Phosphorus Corn, and Storage Effects on Phosphorus Levels in Pig Excreta. J. Environ. Qual. 2003, 32, 1481. [Google Scholar] [CrossRef] [PubMed]
- Wienhold, B.J.; Miller, P.S. Phosphorus Fractionation in Manure from Swine Fed Traditional and Low-Phytate Corn Diets. J. Environ. Qual. 2004, 33, 389–393. [Google Scholar] [CrossRef]
- Pagliari, P.H.; Laboski, C.A.M. Investigation of the Inorganic and Organic Phosphorus Forms in Animal Manure. J. Environ. Qual. 2012, 41, 901–910. [Google Scholar] [CrossRef]
- Hallama, M.; Pekrun, C.; Lambers, H.; Kandeler, E. Hidden Miners—The Roles of Cover Crops and Soil Microorganisms in Phosphorus Cycling through Agroecosystems. Plant Soil. 2019, 434, 7–45. [Google Scholar] [CrossRef]
- de Oliveira, R.A.; José Comin, J.; Tiecher, T.; Piccin, R.; Michelon Somavilla, L.; Loss, A.; Rogério Lourenzi, C.; Brunetto, G. Release of Phosphorus Forms from Cover Crop Residues in Agroecological No-Till Onion Production. Artic. Rev. Bras. Cienc. Solo 2017, 41, 160272. [Google Scholar] [CrossRef]
- Pausch, J.; Kuzyakov, Y. Carbon input by roots into the soil: Quantification of rhizodeposition from root to ecosystem scale. Glob. Chang. Biol. 2018, 24, 1–12. [Google Scholar] [CrossRef]
- Pierzynski, G.M.; McDowell, R.W.; Sims, J.T. Chemistry, Cycling, and Potatial Movemet of Inorganic Phosphorus in Soil. Phosphorus Agric. Environ. 2005, 46, 53–86. [Google Scholar]
- Mcdowell, R.; Mcdowell, R.W.; Sharpley, A.N. Soil Phosphorus Fractions in Solution: Influence of Fertiliser and Manure, Filtration and Method of Determination. Chemosphere 2014, 45, 737–748. [Google Scholar] [CrossRef]
- Ceretta, C.A.; Girotto, E.; Lourenzi, C.R.; Trentin, G.; Vieira, R.C.B.; Brunetto, G. Nutrient Transfer by Runoff under No Tillage in a Soil Treated with Successive Applications of Pig Slurry. Agric. Ecosyst. Environ. 2010, 139, 689–699. [Google Scholar] [CrossRef]
- Tiecher, T.L.; Lourenzi, C.R.; Girotto, E.; Tiecher, T.; De Conti, L.; Marques, A.C.R.; Silva, L.O.S.; Marchezan, C.; Brunetto, G.; Ceretta, C.A. Phosphorus Forms Leached in a Sandy Typic Hapludalf Soil under No-Tillage with Successive Pig Slurry Applications. Agric. Water Manag. 2020, 242, 106406. [Google Scholar] [CrossRef]
- Girotto, E.; Ceretta, C.A.; Lourenzi, C.R.; Lorensini, F.; Tiecher, T.L.; Vieira, R.C.B.; Trentin, G.; Basso, C.J.; Miotto, A.; Brunetto, G. Nutrient Transfers by Leaching in a No-Tillage System through Soil Treated with Repeated Pig Slurry Applications. Nutr. Cycl. Agroecosyst. 2013, 95, 115–131. [Google Scholar] [CrossRef]
- Toor, G.S.; Sims, J.T. Phosphorus Leaching in Soils Amended with Animal Manures Generated from Modified Diets. J. Environ. Qual. 2016, 45, 1385–1391. [Google Scholar] [CrossRef] [PubMed]
- Khan, A.; Lu, G.; Ayaz, M.; Zhang, H.; Wang, R.; Lv, F.; Yang, X.; Sun, B.; Zhang, S. Phosphorus Efficiency, Soil Phosphorus Dynamics and Critical Phosphorus Level under Long-Term Fertilization for Single and Double Cropping Systems. Agric. Ecosyst. Environ. 2018, 256, 1–11. [Google Scholar] [CrossRef]
- Guardini, R.; Comin, J.J.; Schmitt, D.E.; Tiecher, T.; Bender, M.A.; dos Santos, D.R.; Mezzari, C.P.; Oliveira, B.S.; Gatiboni, L.C.; Brunetto, G. Accumulation of Phosphorus Fractions in Typic Hapludalf Soil after Long-Term Application of Pig Slurry and Deep Pig Litter in a No-Tillage System. Nutr. Cycl. Agroecosyst. 2012, 93, 215–225. [Google Scholar] [CrossRef]
- Vanden Nest, T.; Vandecasteele, B.; Ruysschaert, G.; Cougnon, M.; Merckx, R.; Reheul, D. Effect of Organic and Mineral Fertilizers on Soil P and C Levels, Crop Yield and P Leaching in a Long Term Trial on a Silt Loam Soil. Agric. Ecosyst. Environ. 2014, 197, 309–317. [Google Scholar] [CrossRef]
- Requejo, M.I.; Eichler-Löbermann, B. Organic and Inorganic Phosphorus Forms in Soil as Affected by Long-Term Application of Organic Amendments. Nutr. Cycl. Agroecosyst. 2014, 100, 245–255. [Google Scholar] [CrossRef]
- Tian, J.; Boitt, G.; Black, A.; Wakelin, S.; Condron, L.M.; Chen, L. Accumulation and Distribution of Phosphorus in the Soil Profile under Fertilized Grazed Pasture. Agric. Ecosyst. Environ. 2017, 239, 228–235. [Google Scholar] [CrossRef]
- De Conti, L.; Ceretta, C.A.; Ferreira, P.A.A.; Lorensini, F.; Lourenzi, C.R.; Vidal, R.F.; Tassinari, A.; Brunetto, G. Effects of Pig Slurry Application and Crops on Phosphorus Content in Soil and the Chemical Species in Solution. Rev. Bras. Ciência Solo 2015, 39, 774–787. [Google Scholar] [CrossRef]
- Cassol, P.C.; da Costa, A.C.; Ciprandi, O.; Pandolfo, C.M.; Ernani, P.R. Disponibilidade de Macronutrientes e Rendimento de Milho Em Latossolo Fertilizado Com Dejeto Suíno. Rev. Bras. Cienc. Solo 2012, 36, 1911–1923. [Google Scholar] [CrossRef]
- Rheinheimer, D.S.; Anghinoni, I.; Conte, E.; Kaminski, J.; Gatiboni, L.C. Dessorção de Fósforo Avaliada Por Extrações Sucessivas Em Amostras de Solo Provenientes Dos Sistemas Plantio Direto e Convencional. Ciência Rural. 2003, 33, 1053–1059. [Google Scholar] [CrossRef]
- Chen, M.; Graedel, T.E. A Half-Century of Global Phosphorus Flows, Stocks, Production, Consumption, Recycling, and Environmental Impacts. Glob. Environ. Change 2016, 36, 139–152. [Google Scholar] [CrossRef]
- Penn, C.; Bowen, J.M. Design and Construction of Phosphorus Removal Structures for Improving Water Quality. In Design and Construction of Phosphorus Removal Structures for Improving Water Quality; Springer: Berlin/Heidelberg, Germany, 2017; pp. 1–228. [Google Scholar] [CrossRef]
- Ferreira, P.A.A.; Coronas, M.V.; Dantas, M.K.L.; Somavilla, A.; Brunetto, G.; Ceretta, C.A.; Giacomini, S.J.; Gubiani, P.I.; Boitt, G.; Soares, C.R.F.S.; et al. Repeated Manure Application for Eleven Years Stimulates Enzymatic Activities and Improves Soil Attributes in a Typic Hapludalf. Agronomy 2021, 11, 2467. [Google Scholar] [CrossRef]
- Sharpley, A.; Jarvie, H.P.; Buda, A.; May, L.; Spears, B.; Kleinman, P. Phosphorus Legacy: Overcoming the Effects of Past Management Practices to Mitigate Future Water Quality Impairment. J. Environ. Qual. 2013, 42, 1308–1326. [Google Scholar] [CrossRef] [PubMed]
- Wironen, M.B.; Bennett, E.M.; Erickson, J.D. Phosphorus Flows and Legacy Accumulation in an Animal-Dominated Agricultural Region from 1925 to 2012. Glob. Environ. Change 2018, 50, 88–99. [Google Scholar] [CrossRef]
- Peryea, F.J.; Burrows, R.L. Soil Acidification Caused by Four Commercial Nitrogen Fertilizer Solutions and Subsequent Soil PH Rebound. Commun. Soil. Sci. Plant Anal. 1999, 30, 525–533. [Google Scholar] [CrossRef]
- Schroder, J.L.; Zhang, H.; Girma, K.; Raun, W.R.; Penn, C.J.; Payton, M.E. Soil Acidification from Long-Term Use of Nitrogen Fertilizers on Winter Wheat. Soil. Sci. Soc. Am. J. 2011, 75, 957–964. [Google Scholar] [CrossRef]
- Barrow, N.J. The Effects of PH on Phosphate Uptake from the Soil. Plant Soil. 2017, 410, 401–410. [Google Scholar] [CrossRef]
- Haygarth, P.M.; Bardgett, R.D.; Condron, L.M. Nitrogen and Phosphorus Cycles and Their Management; Gregory, P.J., Nortcliff, S., Eds.; Soil Conditions and Plant Growth; Blackwell Publishing Ltd.: Oxford, UK, 2013. [Google Scholar]
- Sattari, S.Z.; Bouwman, A.F.; Giller, K.E.; van Ittersum, M.K. Residual Soil Phosphorus as the Missing Piece in the Global Phosphorus Crisis Puzzle. Proc. Natl. Acad. Sci. USA 2012, 109, 6348–6353. [Google Scholar] [CrossRef]

| Chemical Properties | Treatments (2016) | |||||
|---|---|---|---|---|---|---|
| Initial Soil (2004) * | Control | CS | PS | PD | FM | |
| pHH2O | 4.9 | 5.2 | 5.3 | 4.9 | 5.7 | 4.5 |
| SOM (g kg−1) (1) | 19 | 14.0 | 21.9 | 16.9 | 20.9 | 15.9 |
| Available P (mg kg−1) (2) | 20.3 | 9.7 | 76.5 | 72.9 | 93.2 | 55.1 |
| Available K (mg kg−1) (2) | 60 | 29.0 | 117.0 | 71.8 | 116.8 | 75.0 |
| Exchangeable Ca (cmolc dm−3) (3) | 0.8 | 2.2 | 3.3 | 2.1 | 4.4 | 1.4 |
| Exchangeable Mg (cmolc dm−3) (3) | 0.3 | 1.8 | 2.6 | 1.7 | 2.8 | 1.0 |
| Exchangeable Al (cmolc dm−3) (3) | 0.03 | 0.5 | 0.2 | 0.6 | 0.1 | 1.3 |
| H+Al (cmolc kg−1) | 3.7 | 3.7 | 3.7 | 3.3 | 1.9 | 4.1 |
| CECeffective (cmolc kg−1) | 1.3 | 4.6 | 6.4 | 4.5 | 7.6 | 3.9 |
| CECpH 7.0 (cmolc kg−1) | 5 | 7.8 | 9.9 | 7.2 | 9.5 | 6.7 |
| Base Saturation (%) | 25.4 | 53.7 | 63.5 | 56.3 | 80.0 | 38.8 |
| Aluminum Saturation (%) | 2 | 11.0 | 2.9 | 12.9 | 1.3 | 33.2 |
| P Budget in the System | Treatments | |||||
|---|---|---|---|---|---|---|
| Control | CS | PS | PD | FM | ||
| kg P ha−1 | ||||||
| Inputs | P added via treatments a | 0 | 747.5 | 938.2 | 1431.1 | 538.71 |
| Pools | Soil P pools b | 1383.9 e * | 1892.9 c | 1971.1 b | 2417.1 a | 1605.5 d |
| Crop P residue c | 4.8 d | 10.3 a | 10.3 a | 9.5 b | 8.7 c | |
| Outputs | Grain P export d | 98.88 d | 218.08 b | 242.28 a | 243.87 a | 184.22 c |
| Total P accounted e | 1487.6 e | 2121.3 c | 2223.7 b | 2670.5 a | 1798.4 d | |
| P unaccounted f | 0 | 10.1 b | 98.4 a | 144.4 a | 124.2 a | |
| Accounted P in the system (%) g | 0 | 98.6 a | 89.5 b | 89.9 b | 76.9 c | |
| Added P accumulated in soil (%) h | 0 | 68.1 b | 62.6 c | 72.2 a | 41.1 d | |
| P balance efficiency (%) i | 0 | 30.0 b | 29.2 b | 19.1 c | 45.5 a | |
Disclaimer/Publisher’s Note: The statements, opinions and data contained in all publications are solely those of the individual author(s) and contributor(s) and not of MDPI and/or the editor(s). MDPI and/or the editor(s) disclaim responsibility for any injury to people or property resulting from any ideas, methods, instructions or products referred to in the content. |
© 2023 by the authors. Licensee MDPI, Basel, Switzerland. This article is an open access article distributed under the terms and conditions of the Creative Commons Attribution (CC BY) license (https://creativecommons.org/licenses/by/4.0/).
Share and Cite
Marchezan, C.; Ferreira, P.A.A.; Boitt, G.; Palermo, N.M.; Thoma, A.L.; Vidal, R.F.; Scopel, G.; Lourenzi, C.R.; Ceretta, C.A.; Brunetto, G. Phosphorus Balance in Sandy Soil Subjected to 12 Years of Successive Applications of Animal Manure and Mineral Phosphate Fertilizer in Subtropical Climate. Agriculture 2023, 13, 1762. https://doi.org/10.3390/agriculture13091762
Marchezan C, Ferreira PAA, Boitt G, Palermo NM, Thoma AL, Vidal RF, Scopel G, Lourenzi CR, Ceretta CA, Brunetto G. Phosphorus Balance in Sandy Soil Subjected to 12 Years of Successive Applications of Animal Manure and Mineral Phosphate Fertilizer in Subtropical Climate. Agriculture. 2023; 13(9):1762. https://doi.org/10.3390/agriculture13091762
Chicago/Turabian StyleMarchezan, Carina, Paulo Ademar Avelar Ferreira, Gustavo Boitt, Natalia Moreira Palermo, Ana Laura Thoma, Ricardo Fagan Vidal, Gustavo Scopel, Cledimar Rogério Lourenzi, Carlos Alberto Ceretta, and Gustavo Brunetto. 2023. "Phosphorus Balance in Sandy Soil Subjected to 12 Years of Successive Applications of Animal Manure and Mineral Phosphate Fertilizer in Subtropical Climate" Agriculture 13, no. 9: 1762. https://doi.org/10.3390/agriculture13091762
APA StyleMarchezan, C., Ferreira, P. A. A., Boitt, G., Palermo, N. M., Thoma, A. L., Vidal, R. F., Scopel, G., Lourenzi, C. R., Ceretta, C. A., & Brunetto, G. (2023). Phosphorus Balance in Sandy Soil Subjected to 12 Years of Successive Applications of Animal Manure and Mineral Phosphate Fertilizer in Subtropical Climate. Agriculture, 13(9), 1762. https://doi.org/10.3390/agriculture13091762