Article

The Productivity of Crop Rotation Depending on the Included Plants and Soil Tillage

Institute of Soil and Plant Sciences, Latvia University of Life Sciences and Technologies, LV-3001 Jelgava, Latvia
*
Author to whom correspondence should be addressed.
Agriculture 2023, 13(9), 1751; https://doi.org/10.3390/agriculture13091751
Submission received: 20 July 2023 / Revised: 30 August 2023 / Accepted: 31 August 2023 / Published: 3 September 2023
(This article belongs to the Section Crop Production)

Abstract

:
Crop diversification in rotations is an important part of sustainable crop production. The aim of this research was to analyse soil tillage and crop rotation influence on the yield (t ha−1) of different field crops, their energy yield (GJ ha−1) and the economical profitability (EUR ha−1) of crop rotation. The field trial was conducted in Latvia during four harvest seasons (2017–2020) in a long-term experiment that started in 2009. Three crop rotations with a different share of winter wheat (Triticum aestivum) were studied: 100% wheat (repeated sowings), 67% wheat (three-year rotation with winter oilseed rape (Brassica napus ssp. oleifera) and two years following wheat) and 25% wheat (four-year rotation: field bean (Vicia faba)–wheat–winter oilseed rape–spring barley (Hordeum vulgare). Conventional and reduced soil tillage systems were used for rotation variants. Crop rotations “67% wheat” and “25% wheat” ensured significantly higher average wheat grain yields in comparison to “100% wheat”. Wheat and oilseed rape were the most valuable crops in terms of accumulated energy and economic value in this trial. Higher energy yields were gained from variants in the rotations “67% wheat” and “25% wheat”. Average gross profit was higher from crop rotations with diverse crops, mainly due to the positive forecrop effect on winter wheat.

1. Introduction

A sustainable cropping system can be obtained by using diversified crop rotations [1]. Crops used in rotations are strongly related to the most consumed food products, which limits the agro-food system around a few field crop species; these species have become economically more beneficial than others because of high demand [2]. The most valuable crops by gross production value in the world are rice (Oryza), maize (Zea mays) and wheat (Triticum), but in Europe convincingly in first place is wheat [3]. About 30 crop species provide 90% of food resources [4]. In research carried out in the United States of America (USA), it is claimed that crop diversity over more than 30 years had decreased in most cases, and this will have an effect on the provision of ecological system services for agricultural systems and also influence food system sustainability [5]. Increasing the diversity of crop species and varieties cultivated in agroecosystems is a way to achieve more sustainable land use [6].
The decrease in crop diversity is also related to the yield stability of the used crops. The yield stability of various groups of field crops has been studied in Europe and it was concluded that the instability of spring-sown legume yields is about 30%, which is only slightly more than for spring-sown cereals (27%). Winter crops have the lowest yield volatility (19%). As legume seed yields are predictable as summer crops, farmers should consider including legumes in crop rotations [7]. Higher yield stability can be achieved when crops are grown in intercropping systems [8] or mixtures [9].
The economic profitability of crop cultivation systems is compared using gross profit, which is calculated as revenue from crop production minus variable production costs (fertiliser, plant protection products, fuel, labour, etc.) [10,11]. Different crop species have different yield levels, but at the same time their production has different market values. The productivity of individual crops is usually evaluated as its economic value, but it is important to evaluate the whole crop rotation in full cycle, depending on the included plants, to prove the rotation’s economic sustainability [12]. Incorporating legumes into an oilseed–cereal rotation is an effective method to improve the economic status of a farm and influence the environmental impact [13]. More diverse crop rotations and longer rotations have a longer-lasting effect, improving both soil quality and nutrient cycling and reducing dependence on external inputs, which are particularly important in organic farming systems [14]. The common agricultural policy in the European Union offers additional agricultural support payments for the cultivation of various crops in diversified crop rotations, as well as for the growing of legume crops [15]. Legume introduction in crop rotations leads to a reduction in nitrogen fertiliser use and lower greenhouse gas emissions [16,17].
A large part of the variable costs in crop production is labour costs and the total energy input used for tillage and field operations. One of the possibilities to reduce the cost of agricultural production is the simplification of a production’s technological processes by introducing a reduced tillage system [18].
The total energy yield obtained per unit area depends on the energy value of the biomass and the mass of the grain/seed and post-harvest residues [19]. Different plants have distinct energy values (MJ kg−1) [20]. Similarly, energy values from different parts of the plant biomass differ—such as grain, straw, seeds and stalks—because of their chemical composition [21,22]. The number of substances accumulated in plant parts is influenced by external factors, including agrotechnical measures chosen by humans (seed material, fertilisation system, etc.) [23]. The concentration of biomass components varies depending on the type of tissue, the phase of plant development in which the biomass is harvested and the growing conditions [21]. Automatic equipment such as an oxygen bomb calorimeter can be used to determine the plant biomass energy value [22]. The energy yield from winter wheat (Triticum aestivum) biomass is generally higher when grown in crop rotation with crops of other species [24].
Crop rotation can be evaluated by crop yields, energy output and economic indicators. The objective of this research was to analyse soil tillage systems and study crop rotation influence on (1) the yield of different field crops included in rotation, (2) the energy yield and (3) the average economic profitability of variants over a four-year period.

2. Materials and Methods

2.1. General Information about the Trial

The research was conducted at the Peterlauki Research and Study Farm (RSF) of the Latvia University of Life Sciences and Technologies (56°30.658’ N; 23°41.580’ E). The two-factorial trial was started in 2009 with three crop rotations and two tillage systems. This paper presents results from harvest seasons 2017–2020.
Analysed soil tillage systems were:
  • Conventional tillage system (CT) with mould-board ploughing at a depth to 24 cm;
  • Reduced tillage system (RT) with soil disc harrowing at a depth to 10 cm.
Three different variants of crop rotation containing different wheat proportions were studied:
  • Repeated winter wheat (Triticum aestivum) rotation (W–W; 100% wheat);
  • Three-year rotation with oilseed rape (Brassica napus ssp. oleifera) and two years of winter wheat (OR–W–W; 67% wheat);
  • Four year rotation with four different crops in rotation (sequence: field bean (Vicia faba)–winter wheat–oilseed rape–spring barley (Hordeum vulgare) (FB–W–OR–B; wheat proportion in rotation—25%)).
The field trial was arranged in split-plot design in two blocks. Each plot was split in half, forming four replications.
The soil type at the site was Cambic Calcisol, silt [25]. At a soil depth of 0–20 cm, average soil organic matter content was high (on average 3.5%), soil reaction pHKCl 6.7; content of available P2O5 for plants was medium (125.9 mg kg−1), and K2O content was high (233.0 mg kg−1).
The basic soil tillage was carried out after harvesting the pre-crop. In CT after soil ploughing, a soil compactor was used to level the topsoil and one more cultivation took place before sowing was completed. The RT system consisted of soil harrowing using disc harrows twice, and one more soil cultivation with a soil compactor, as was executed in the CT system, before sowing.
Winter wheat was sown at optimum term in 2016 (19 September), 2018 (6 September) and 2019 (10 September), but sowing time was delayed in 2017 (30 September) due to a high amount of precipitation which disturbed the soil treatment. Sowing rates used were 500 germinable seeds per m2, except in 2018/2019 (450 seeds per m2) because the sowing term was at the beginning of September. Seeds were treated with fungicide. Bread baking quality varieties were sown (“Zentos” harvested in 2017 and “Skagen” in the other years). Complex fertiliser was spread before sowing (N 25 kg ha−1, P2O5 65 kg ha−1, K2O 40–65 kg ha−1). Nitrogen top-dressing rates in spring were 172 kg ha−1 in 2017, and 154 kg ha−1 in 2018, 2019 and 2020 using ammonium nitrate split in two portions (first at GS 23–29, second at GS 31–32, according to BBCH). Foliar fertilisers were also used. Herbicide was used each spring (GS 31). Two plant growth regulators were used in each trial year at GS 30 and GS 33. Fungicide treatment was carried out each year at heading (GS 51–55). The necessity for insecticide treatment was only in summer 2018 (GS 55).
For oilseed rape, basic fertilisation was performed before sowing using complex fertiliser with a low nitrogen proportion (N 18–23 kg ha−1, P2O5 50–65 kg ha−1, and K2O 60–70 kg ha−1). The nitrogen rate at top-dressing was used depending on yield potential (172 kg ha−1 in 2017; 152 kg ha−1 in 2018 and 2019; 192 kg ha−1 and 48 kg ha−1 of sulfur in 2020 (first at GS 23–29, second at GS 32–35)). The sowing rate was 80 germinable seeds m−2, using hybrid varieties at the following times: 28 August 2016, 18 August 2017, 17 August 2018, and 19 August 2019. Crop protection consisted of weed control with herbicides each year in autumn, and in addition herbicide was applied in spring 2017, 2019, and 2020 (GS 31–33). Plant growth regulator was used in autumn in the first three trial years (GS 14–16). Insecticide was used every year at least once, but in 2020 insecticide was used three times (during flowering, GS 60–69). Foliar fertilisers with boron were used in 2017, 2019 and 2020.
Spring barley was sown in three of the four research years: 2017, 2018 and 2019. The sowing rate was 450 germinable seeds per m2. The sowing term was in the third ten-day period of April. The variety “Tocada” was used. The total nitrogen rate in 2017 was 99.4 kg ha−1, in 2018 it was 106 kg ha−1, and in 2019 it was 91.5 kg ha−1. Basic fertilisation was performed before sowing using complex fertiliser (N 38 kg ha−1, P2O5 38 kg ha−1, and K2O 38 kg ha−1). Top-dressing with nitrogen (N 54–67 kg ha−1) was completed at the tillering stage (21–23). Weed control was achieved using herbicide once in spring, fungicide was applied in two years (2017 and 2019) at GS 45–49 and insecticide was applied in 2019 at the heading stage (GS 55).
Field beans were sown in 2018, 2019 and 2020 with a rate of 45 germinable seeds per m2. The variety “Laura” was used. Sowing time was optimal in 2019 (6 April) and 2020 (30 March), but delayed in 2018 (24 April) because of soil moisture conditions in spring which did not allow earlier sowing. Basic fertilisation was performed during sowing time using monoammonium phosphate in 2018 (N 18 kg ha−1, P2O5 62.4 kg ha−1) and complex fertiliser was applied in 2019 and 2020 (N 30 kg ha−1, P2O5 30 kg ha−1, K2O 30 kg ha−1). For weed control, herbicides were used (three sprays in 2018 and 2019 because of the long field germination period, and two in 2020). Insects were controlled once during the flowering stage (GS 60–69) each year.

2.2. Yield

The grain/seed yield (t ha−1) for winter wheat, spring barley and field beans harvested at GS 89–92 was calculated by direct combining, but the yield of oilseed rape was detected by an indirect method: calculation from sample sheaf analysis. Yield was recalculated to 100% cleanness and standard moisture (14% for wheat, barley and bean; 8% for oilseed rape). Straw yield was calculated from a sample sheaf analysed in combination with the detected grain/seed yield. The grain:straw ratio was determined from sample sheafs, and then using detected grain/seed yield, straw mass per ha was recalculated. Sample sheafs for cereals were taken at three locations randomly selected in each replication from a 0.125 m2 area, but for oilseed rape and field bean, they were taken from two locations with an area of 0.5 m2 in each replication. The harvest index was calculated from sample sheaf analysis for all included crops as the grain/seed proportion in the total above-ground biomass.

2.3. Energy Yield

Energy yield (GJ ha−1) was calculated from crop seed and post-harvest residue dry matter yield (t ha−1), and the respective energetic values (kJ kg−1) by the Formula (1). The energetic value of the crop seeds and post-harvest residues were determined using the standard method for the determination of the gross calorific value of a solid biofuel, a bomb calorimeter (EN ISO 18125:2017). In every year, a total of 12 average grain/seed and 12 straw samples were analysed. The energetic value was determined separately for grain/seed and straw, and the average samples of seeds and post-harvest residues from four replicates for each variant was formed. The energy yield of the crops was converted from kJ ha−1 to GJ ha−1.
Ren = (Rbs × Ev)/106
where Ren is the seed or post-harvest residue energy yield, GJ ha−1; Rbs is the dry matter yield of grain or post-harvest residue, t ha−1; and Ev is the seed or post-harvest residue energetic value, kJ ha−1.
Crop rotation variants included in the trial were compared by the average obtained energy yield in full rotation length. The average energy yield from each crop was calculated in each crop rotation separately to obtain the average value annually from all included plants in full rotation. The average energy yield was multiplied by the proportion of the crop in the crop rotation and to determine the proportional distribution of energy from each crop in the crop rotation.

2.4. Economic Profitability

The economic profitability of crop production in different crop rotations and tillage systems was assessed using the gross profit calculation. Gross margin was obtained by deducting variable costs for raw materials and machine and manual operations from the sales revenue for production of grains or seeds. Production realisation prices (Table 1) were taken into account from average calculated prices from the Latvian Rural Advisory and Training Centre, Ltd. (LRAT) [26,27,28,29]. Variable cost prices for raw materials in 2016, 2017, 2018, 2019 and 2020 were taken from accounting documents of RSF Peterlauki and the average prices were from the LRAT [26,27,28,29,30].
Machine and manual operations expenditures were calculated using the average prices of tractor and machinery operations in the Zemgale region (where RSF Peterlauki is located) in 2016, 2017, 2018, 2019 and 2020 collected by the LRAT. For winter wheat, grain prices were used according to the obtained quality group: either food or feed according to the procurement requirements of major grain purchasers.
The average annual economic profitability of each crop in the rotation and tillage systems was calculated. The average annual economic profitability of crop rotation was calculated separately for CT and RT.

2.5. Mathematical Data Processing

The computer programs MS Excel and RStudio were used for the mathematical processing of data, for performing dispersion and correlation analyses. The significance of the differences in results was evaluated at the 95% confidence level using either the lowest significant difference (RS0.05) value or the Bonferroni test.

2.6. Meteorological Conditions during the Study Period

The average annual air temperature in Latvia is +6.8 °C and the precipitation norm is 686 mm.
Season 2016/2017 was characterised by moderate air temperatures and optimal precipitation in August, but reduced precipitation in the autumn months. The winter was warmer than long-term observations. Spring and summer were characterised by moderate temperatures, with optimum rainfall in spring and early summer, heavy rains in July and low-to-moderate rainfall in August and during harvest time.
In season 2017/2018, September and October were very rainy, with warm air temperatures. February was the coldest of the winter months, but the average temperature in December and January was higher than long-term average data (hereinafter the norm). April was rich with precipitation but very warm. In the following months until the crop ripening time, there was a moisture deficit with increased air temperatures. During the spring and summer period, there was low precipitation throughout the growing season, which was only 64% of the norm in the spring months and 33% of the norm in the summer months. Air temperature in the growing period was increased.
Season 2018/2019 continued with a pronounced moisture deficit from autumn 2018 until July in 2019. In July, a relatively large amount of precipitation was observed which, however, was only slightly higher than the norm in July. Air temperatures were moderate until January in 2019, after which temperatures started to increase more than long-term observations. Extreme heat was observed in June, while the other summer months had moderate temperatures, although slightly warmer than normal.
Season 2019/2020 differed from the others, being warmer and with more precipitation in the autumn months: 2.4 times higher than the long-term observations. In the winter period, the average temperature per month did not fall below 0 °C. Temperatures were moderate in spring and summer, but June was hotter than long-term observations. The amount of precipitation from April to July was insufficient for crop production, reaching 50% of that recorded in long-term observations.

3. Results

3.1. Wheat Grain and Straw Yield

The winter wheat grain yield was significantly affected by the conditions of the season (p < 0.001) and crop rotation (p < 0.001), but the yield did not differ significantly between the investigated tillage systems (p = 0.33) (see Table 2). Significant interaction effects between studied factors were found. The highest yields were obtained in 2017, which were characterised by the most optimal humidity and temperature conditions. Mathematically, the lowest average yield was obtained in 2019, but it did not differ significantly from the yields in 2018 and 2020. Growing wheat in crop rotations, compared to long-term repeated wheat sowings, yielded a higher level of winter wheat. The average yield of winter wheat when grown in 100% wheat rotation was 5.39 t ha−1, which was significantly lower (p < 0.001) than that when wheat was grown in crop rotation with rapeseed (67% wheat) (average yield 6.40 t ha−1) or in the rotation of four different crops (25% wheat) (average yield 6.77 t ha−1).
The tillage variants compared in this study led to the conclusion that it is possible to obtain equivalent yields of winter wheat with both tillage systems, in which the average yields from four seasons did not differ significantly (p = 0.33), obtaining 6.28 t ha−1 in the CT system and 6.35 t ha−1 in the RT system. The obtained results indicated the possibility of tillage intensity reduction. In the experiment, it was found that winter wheat yields in most cases were higher after oilseed rape and field bean in RT, and higher after cereal crops in CT.
Although significant yield differences depending on the soil tillage were not confirmed for average winter wheat yields, when analysing yields separately for each year, differences in yield were found depending on which tillage system was used for the forecrop. Higher yields using RT were found if the forecrop was rapeseed or field bean, but yields were higher for CT in variants when wheat was grown in repeated wheat sowings (100% wheat) (except for 2017).
The average winter wheat straw dry matter yield during the research period, similarly to the grain yield, did not differ significantly between the CT and the RT variants (p = 0.087); however, it was observed that in 2017 the winter wheat straw yield was significantly higher in the RT variant. The average straw yield in the rotation with 25% wheat (8.66 t ha−1) was significantly higher (p < 0.001) than that in the other two studied crop rotations (67% wheat, 7.21 t ha−1; 100% wheat, 6.49 t ha−1). The highest straw yield was obtained in 2017, when significantly higher grain yields were also obtained, followed by 2020 (8.38 t ha−1), but the lowest yields were obtained in 2018 and 2019, of 5.93 and 5.74 t ha−1, respectively. Similar to the grain yield of wheat, the average straw yields among the studied pre-crops were significantly higher when the pre-crops were oilseed rape or field bean, but significantly lower when the pre-crop was wheat (p < 0.001).
A significant effect of the forecrop on the HI was found (p = 0.0007). The results showed that the highest winter wheat HI was in variants with wheat as the previous crop, but the lowest in variants with field bean and oilseed rape as the forecrop (0.46 and 0.45, respectively). According to the obtained results, despite the lower HI, a higher biomass yield ensured higher grain yields of winter wheat, but the proportion of grain in the whole biomass was lower. The amount of straw yield had a significant negative relationship with the HI (r = ǀ−0.826ǀ > r0.05 = 0.196, n = 96).

3.2. Oilseed Rape, Barley and Field Bean Seed and Straw Yield
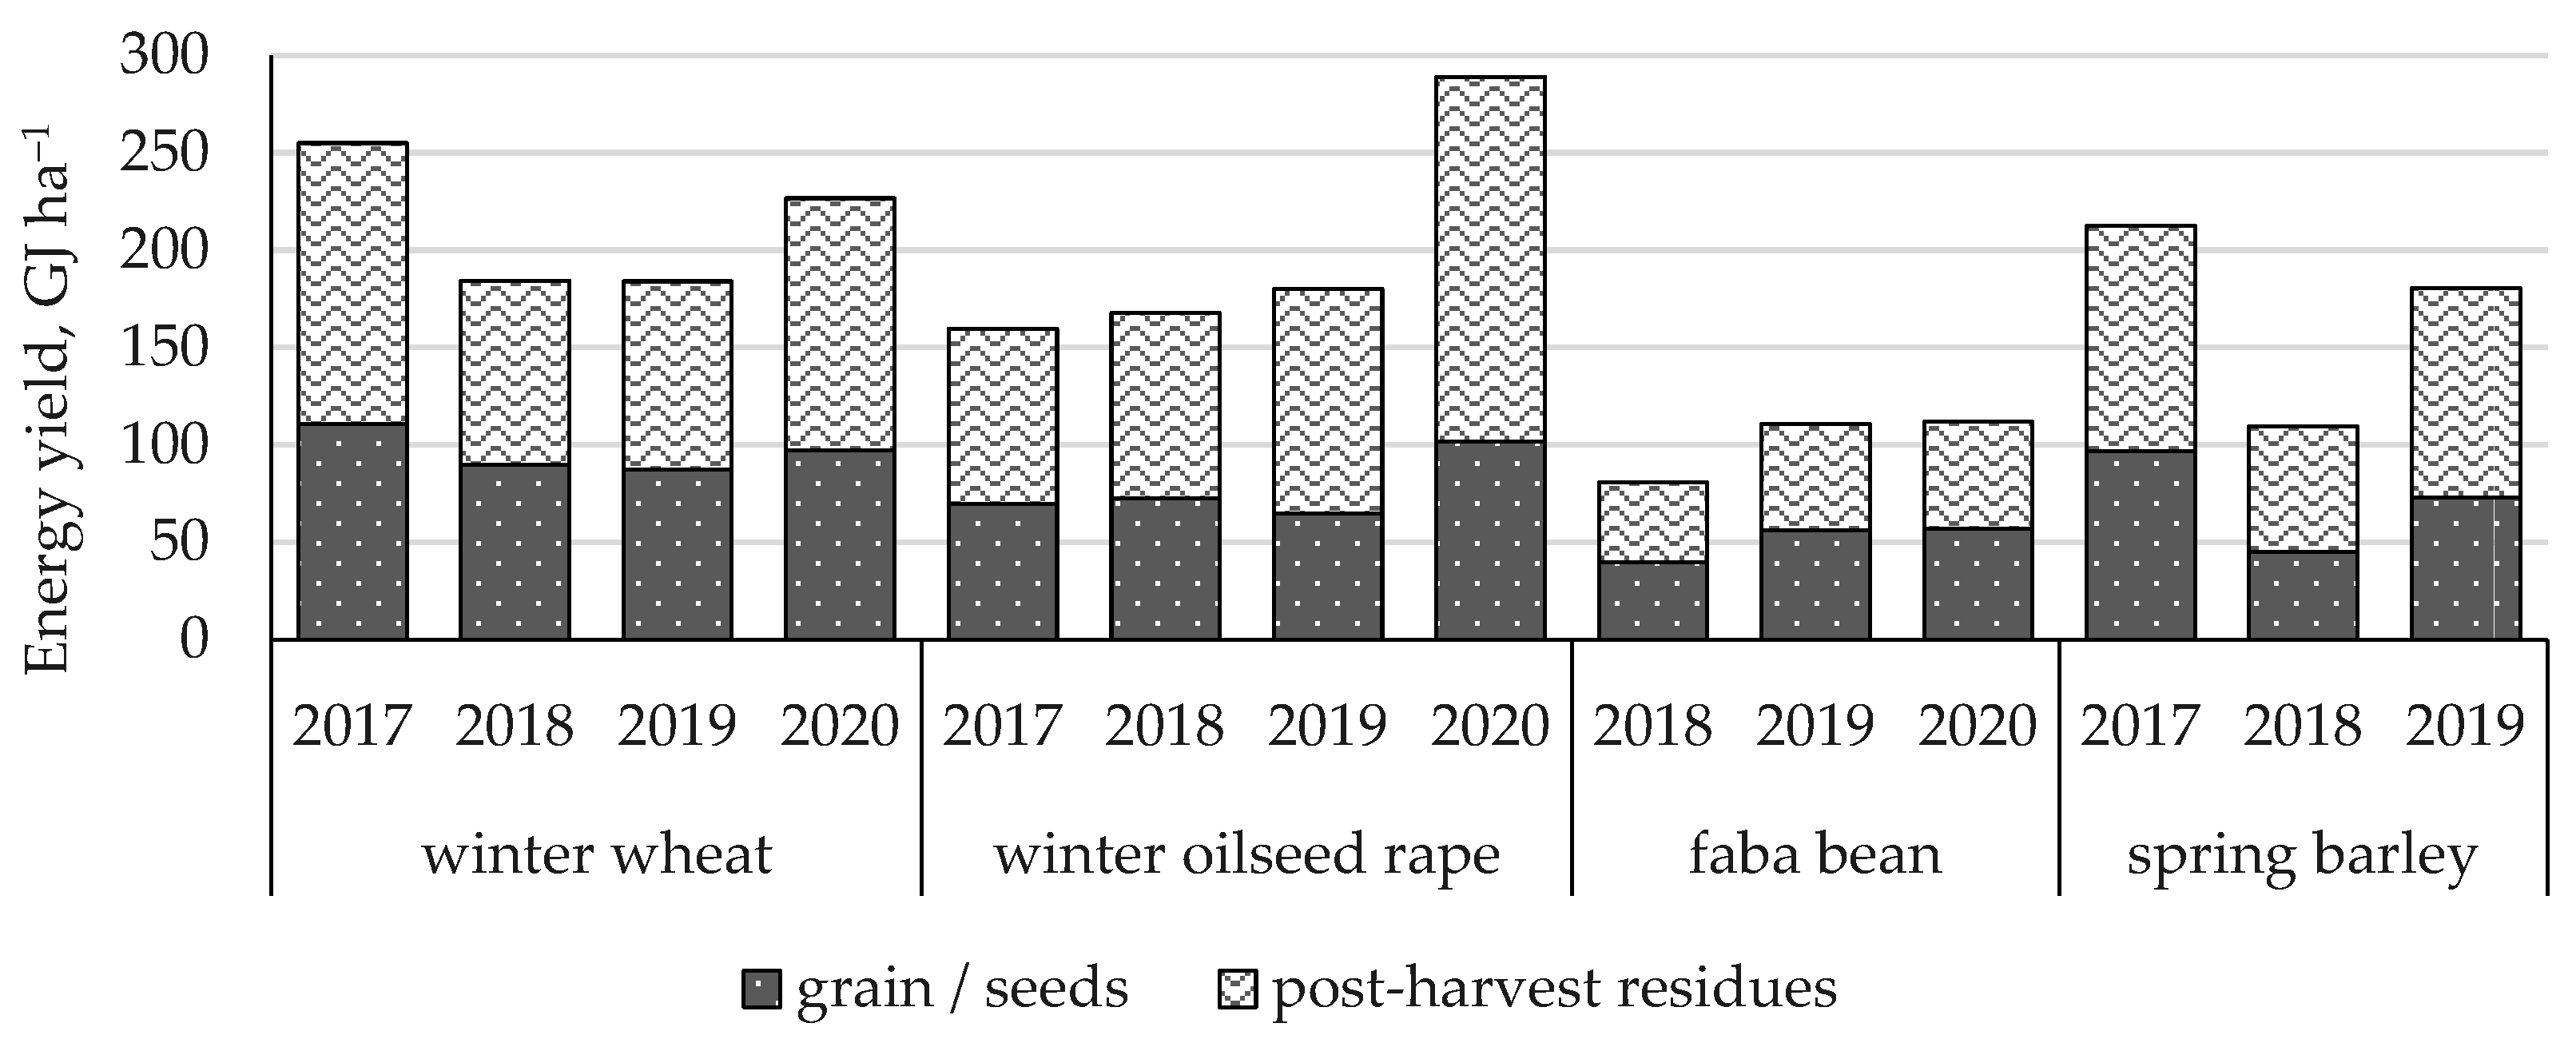
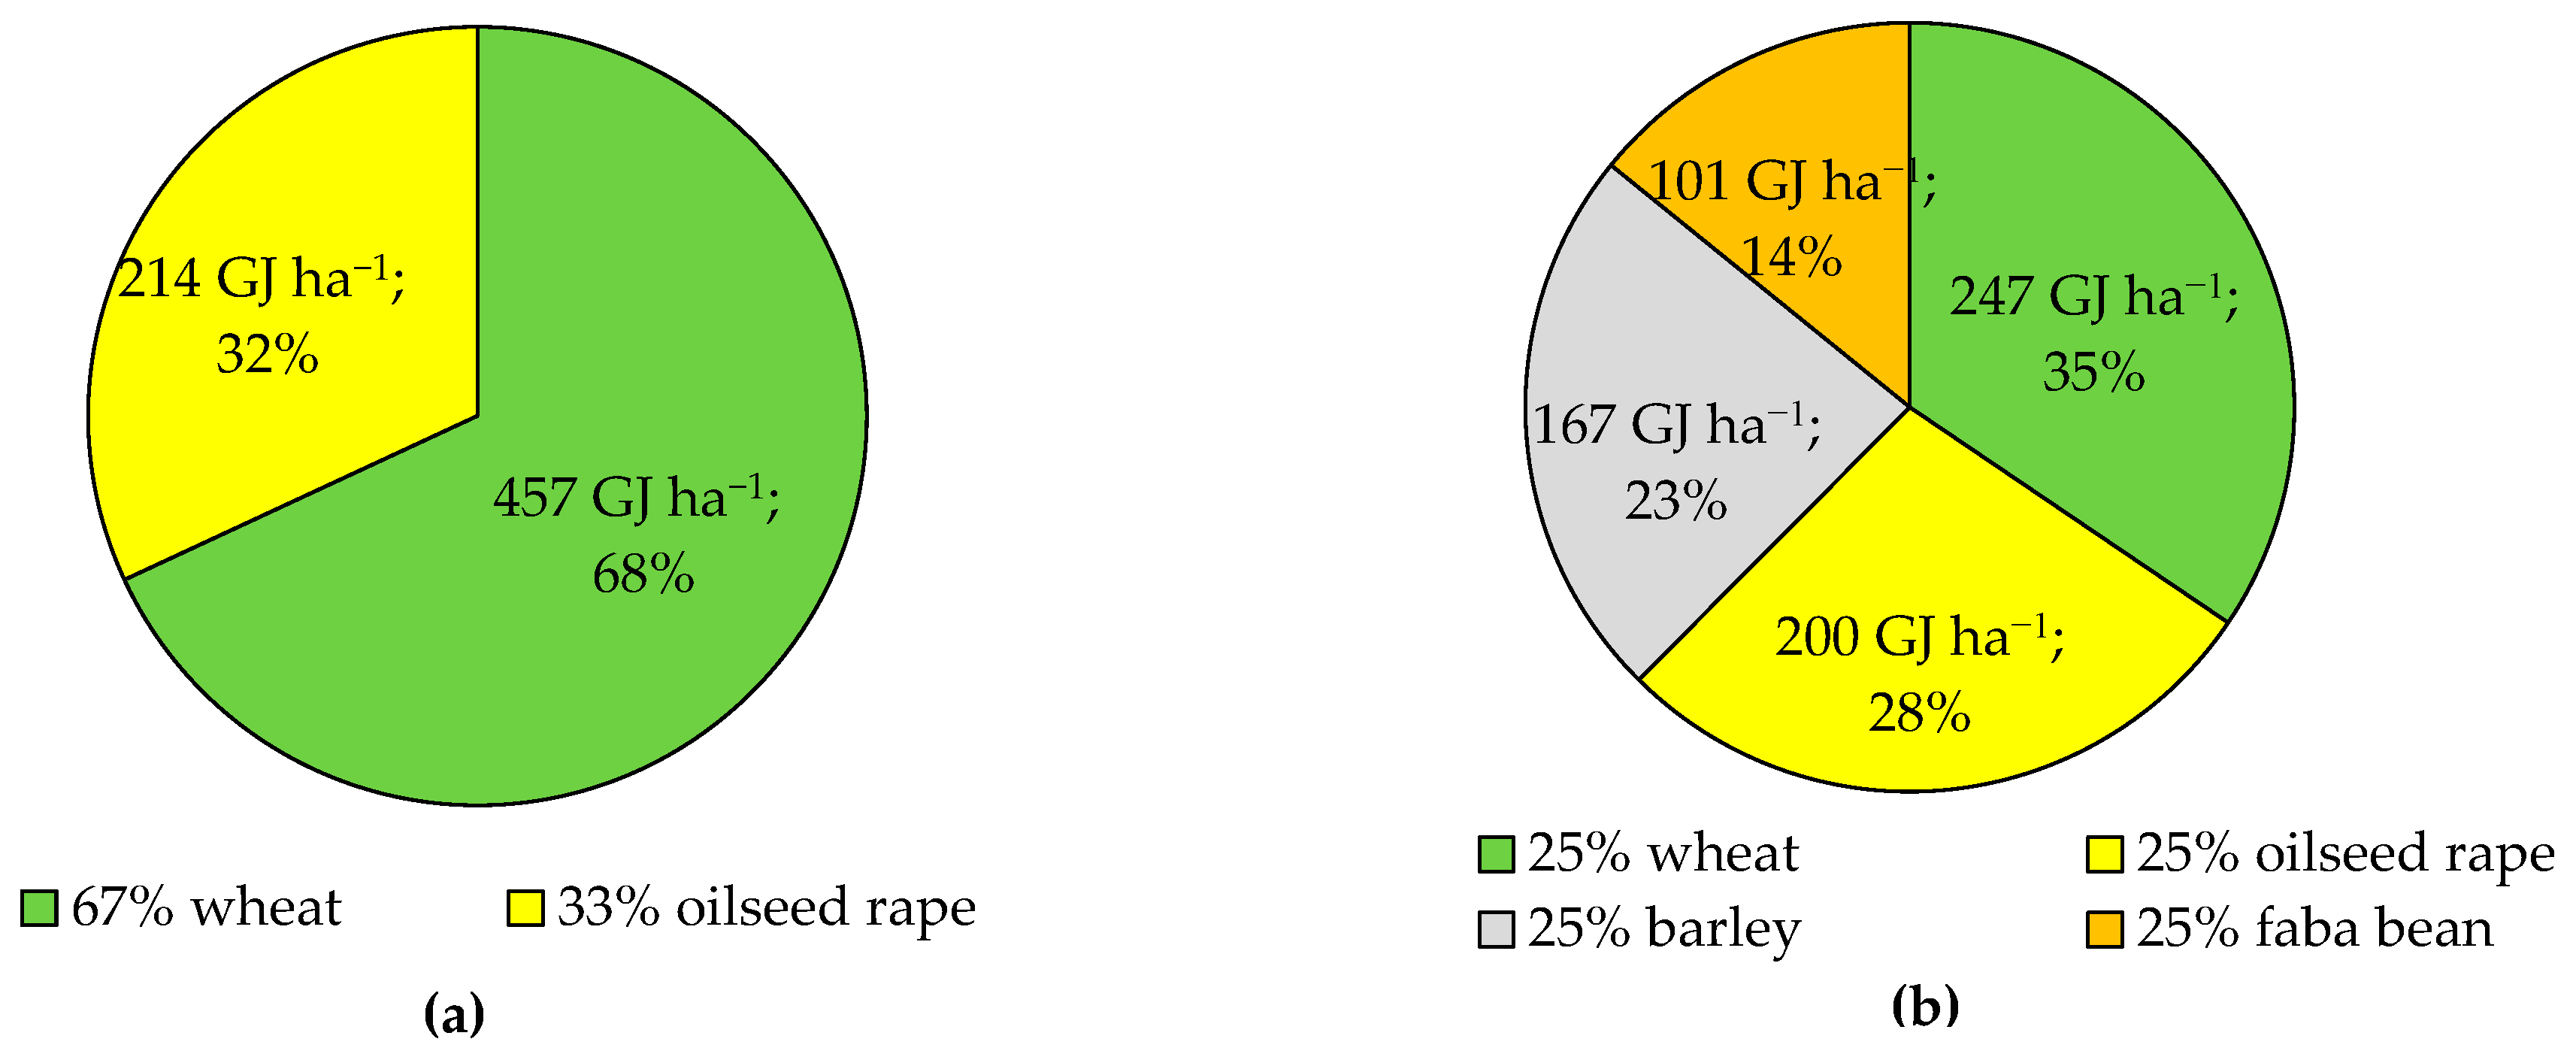
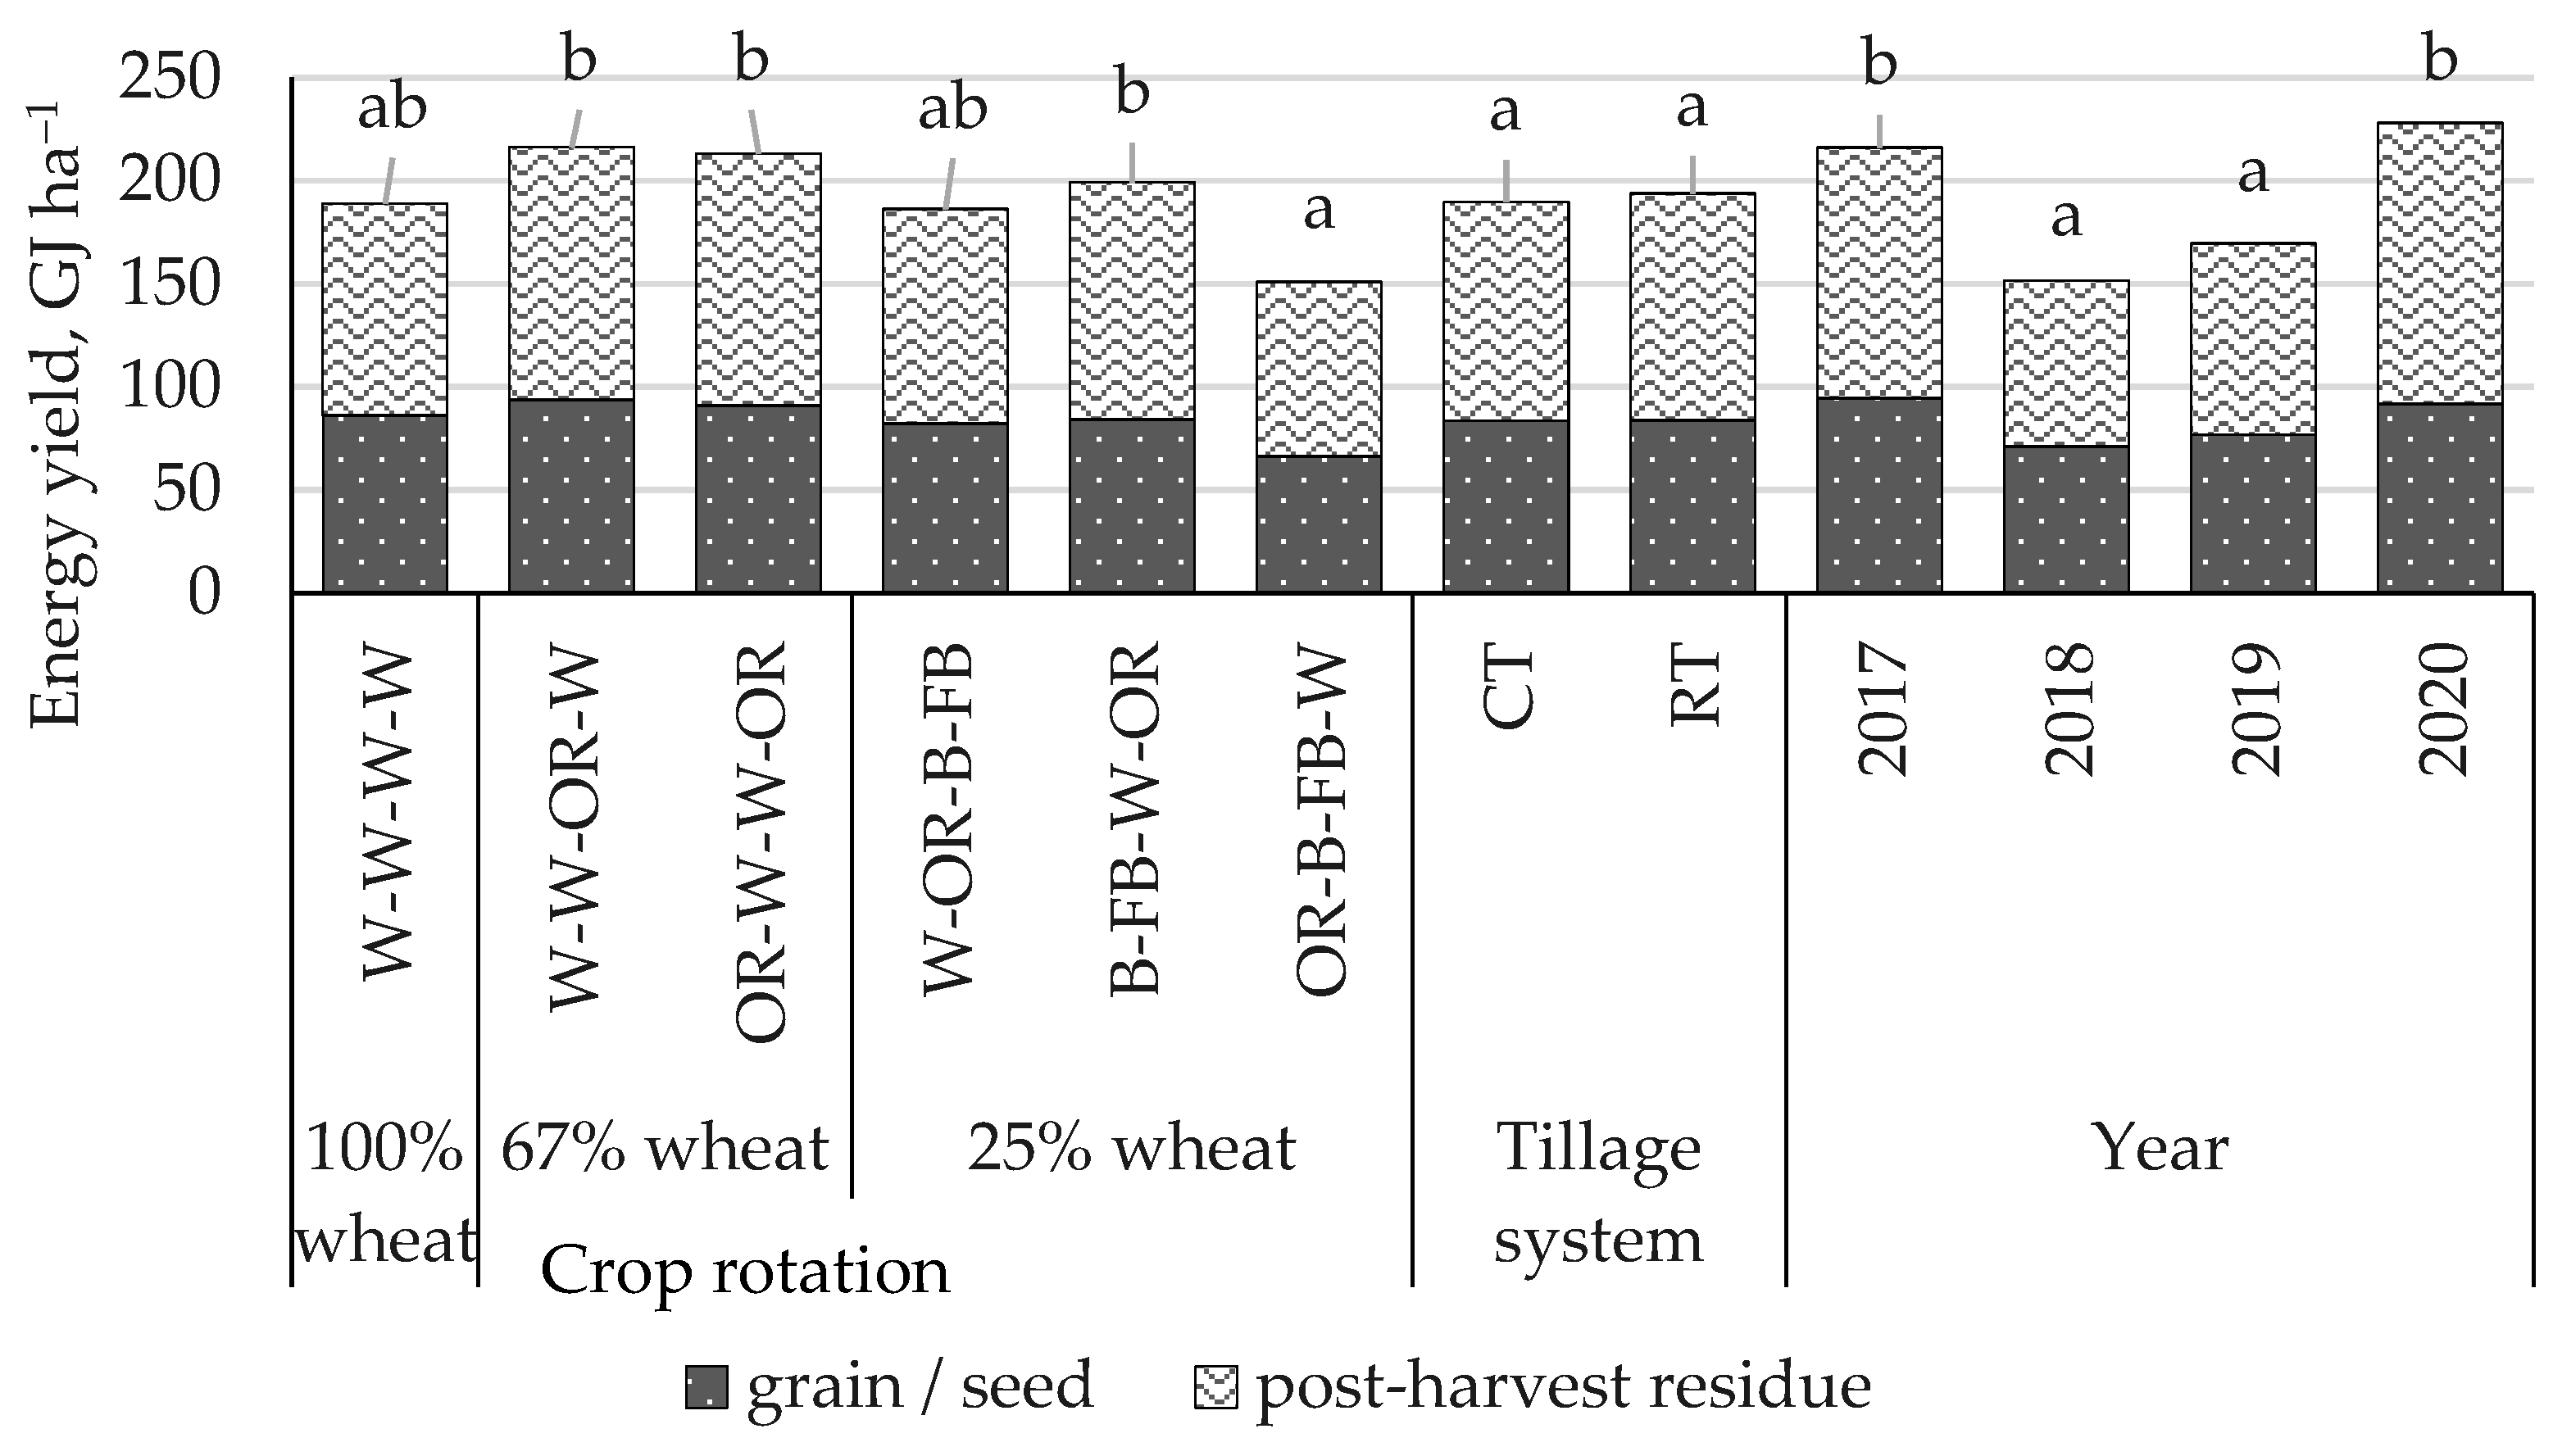
The seed yield of winter oilseed rape, spring barley and field bean differed significantly between the studied seasons (p < 0.001). Significant differences were not observed between yields of oilseed rape depending on the studied tillage systems. In contrast, the yield of field bean differed significantly depending on the soil tillage systems (Table 3), and higher yields were obtained with a traditional tillage system. Despite the barley grain yield difference of 0.50 t ha−1 depending on soil tillage system, this difference was not significant at the 95% level. Significant yield differences for spring barley were found in the dry 2018 season, where higher yields were found using the reduced tillage system, and these results also influenced the average yields per trial period.
The obtained results indicate the possibility of tillage intensity reduction for oilseed rape and spring barley in Cambic Calcisol soil. Field crop yield was mostly affected by weather conditions in the studied years (p < 0.001 for all crops) than researched factors—crop rotation and/or tillage system. Harvest index for studied crops was 0.43 on average for spring barley, 0.30 for oilseed rape and 0.49 for field beans.

3.3. Energy Yield

The highest energetic value among the crops included in the study and their biomass parts was for winter oilseed rape seeds: on average 28.58 MJ kg−1; the highest was in 2019 (29.23 MJ kg−1) and the lowest was in 2020 (27.90 MJ kg−1). The average energetic value of field bean seeds was 18.96 MJ kg−1, but significant differences in the energetic value of bean seeds depending on the trial year were found: the highest was in 2020 (20.09 MJ kg−1) and the lowest was in 2018 (17.84 MJ kg−1). The energetic value of grains of cereal species was, on average, for winter wheat 17.75 MJ kg−1 and for spring barley 17.46 MJ kg−1, which was lower than the energetic value of straw of the same species (for winter wheat 18.37 MJ kg−1 and for spring barley 17.83 MJ kg−1). When comparing the energetic value of the post-harvest residues between included plants, there were no big differences. The highest average energetic value was observed for winter wheat straw and the lowest was for field bean post-harvest residues (17.82 MJ kg−1 on average). The effect of soil treatment on the energetic value of crop seeds and post-harvest residues was not found (p > 0.05). A significant influence of the forecrop (p < 0.001) was found on the average energetic values of winter wheat grains and straw during the study period. Winter wheat grown after field beans had the highest energetic value for grain (18.01 MJ kg−1), while winter wheat straw grown after field beans had the lowest energetic value (18.21 MJ kg−1) among the studied variants.
The crops included in the study differed from each other in the amount of obtained average energy yield (GJ ha−1) in each of the study seasons (see Figure 1). Evaluating the average energy yields among crops (p < 0.001), it was found that the highest energy yield was obtained from winter wheat (average energy yield 212.43 GJ ha−1) and winter oilseed rape (on average 209.99 GJ ha−1); a significantly lower average energy yield was obtained from spring barley (on average 167.42 GJ ha−1) and the lowest (significantly different from barley energy yield level, p < 0.001) was that from field beans (101.13 GJ ha−1).
The obtained energy yield (GJ ha−1) was variable over the years depending on the crop rotation and tillage system (see Figure 2). No significant differences in energy yield were found during the study period depending on soil tillage variant (p = 0.553). The average energy yield obtained over a four-year period in the CT variant was 188.9 GJ ha−1 and in RT variant was 193.9 GJ ha−1.
The average annual energy yield according to the results obtained in each plot of the trial variant depended on crop sequence and the meteorological conditions in particular years. It was found that the lowest energy yield was obtained in the crop rotation “25% wheat” (crop sequence: oilseed rape–spring barley–field beans–winter wheat), where spring crops, barley and field beans, were grown in 2018 and 2019, respectively, which resulted in a low biomass yield and in its turn, low energy yield. The average annual energy yield for crop sequence OR–B–FB–W was 150.96 GJ ha−1, of which only 66.36 GJ ha−1 was the energy obtained from primary production, and 84.60 GJ ha−1 from post-harvest residues. The highest average annual energy yield was obtained in the two crop sequence variants included in the rotation “67% wheat” (W–W–OR–W 216.27 GJ ha−1; OR–W–W–OR 213.23 GJ ha−1).
The energy yield of the crops included in the crop rotations and its share in the total energy obtained from full rotation was not proportional to the share of the crop rotation (see Figure 3). In the three-year rotation “67% wheat”, the average energy yield from the two-year winter wheat energy yields (average 457 GJ ha−1) made up 68% of the total energy, while the energy yield from winter oilseed rape was 32% (214 GJ ha−1), and oilseed rape occupied 33% of the rotation length. Analysing the “25% wheat” rotation of four different crops, it was concluded that the energy yield of winter wheat made up 35% of the total energy gained from four-year rotation, despite the fact that the share of wheat in the rotation makes up only 25%. However, it should be emphasised that the energy accumulated in the biomass of winter wheat and its forecrop (field bean) together made up 49% of the total energy obtained in the crop rotation, and the high winter wheat energy yield was obtained due to the influence of the forecrop on the wheat biomass.
The second largest proportion of the energy accumulated in the crop rotation “25% wheat” was from winter oilseed rape (28%, on average 200 GJ ha−1). On average, during the four-year research period, spring barley had produced almost as big an energy yield proportion (23%) as its proportion in crop rotation (25%). Its energy yield was 167 GJ ha−1. In order to determine which crop is the most beneficial in terms of energy yield, one cannot forget about the effect of pre-crops in the crop rotation.

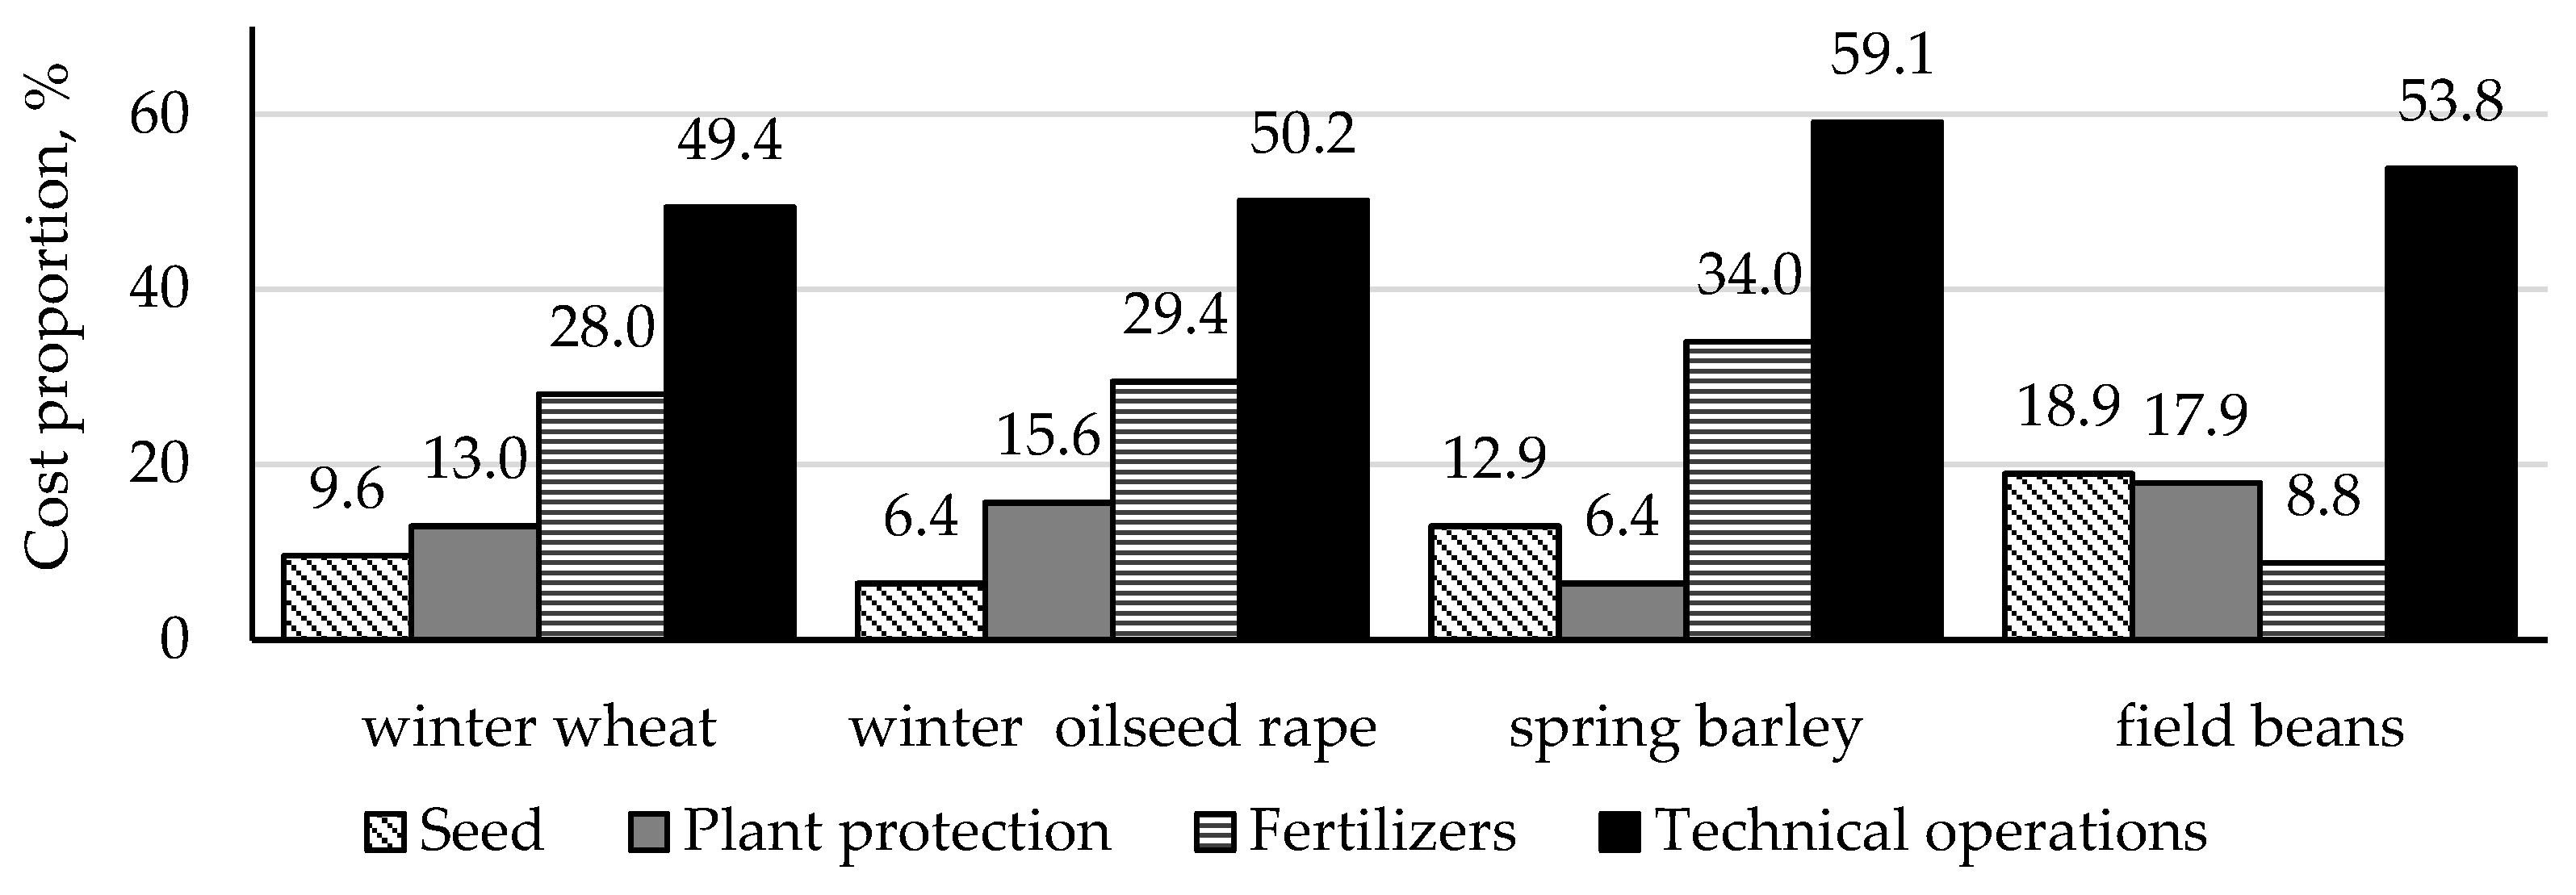
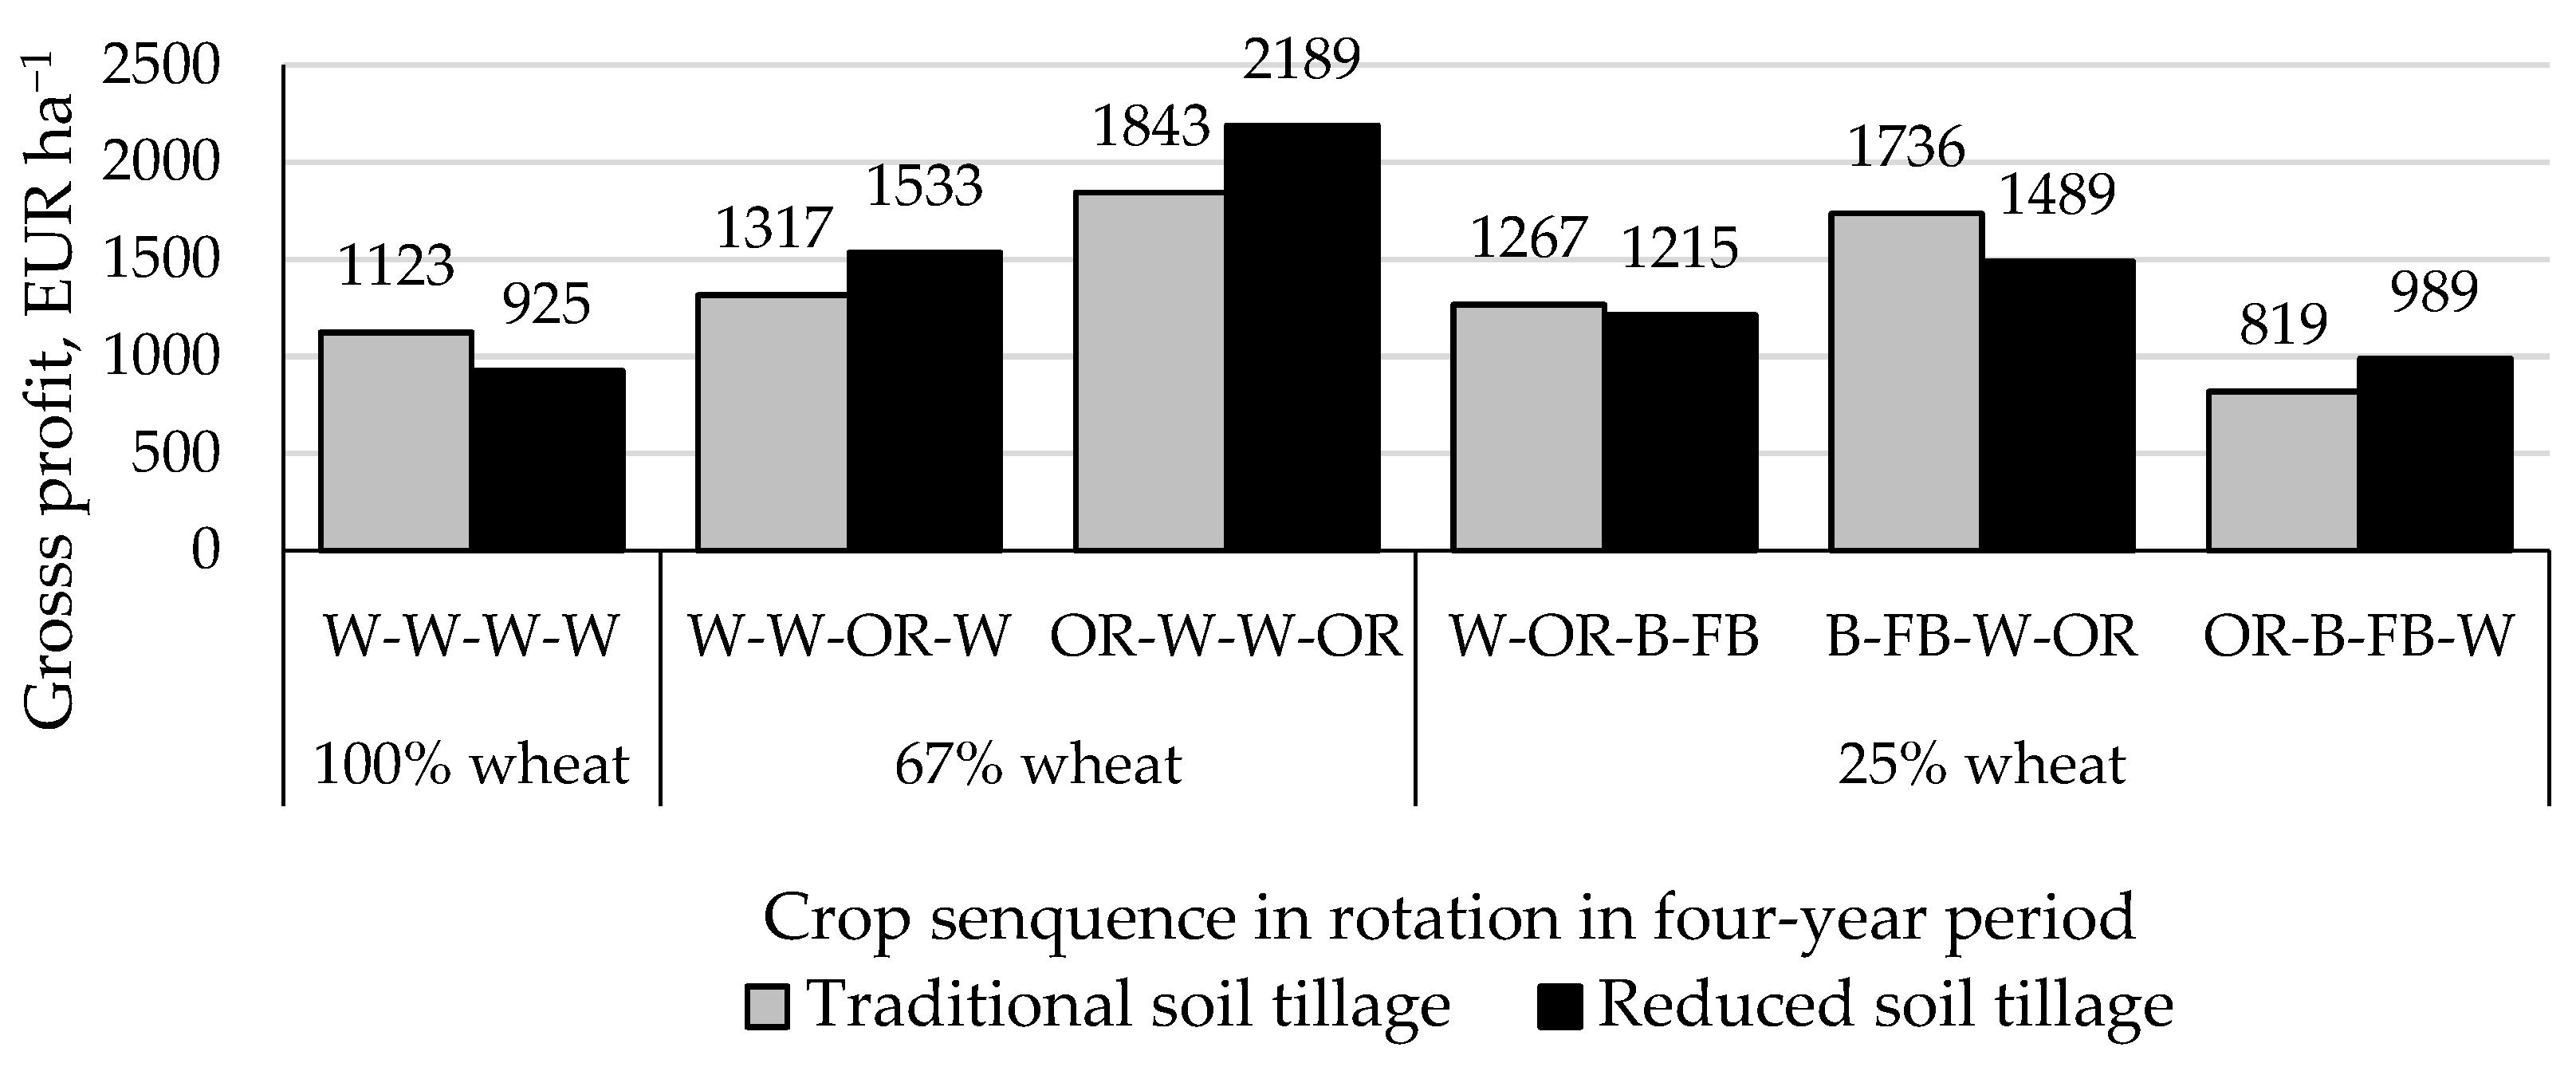
3.4. Economic Assessment

The crop production systems’ expenses and revenues differed between the included crops due to the market prices and yield level in each year. The average purchase prices were variable between the years of the study according to the market situation. The highest purchase price in all trial years was for rapeseed (359 EUR t−1 on average) and the second highest purchase price was for field bean seeds (213 EUR t−1 on average), followed by wheat grains that met the requirements for food quality (167 EUR t−1 on average) or feed quality (on average 151 EUR t−1). The lowest purchase price was for barley grain (on average, 144 EUR t−1). The largest price fluctuation between the years of the study was for barley grain, which was around 47 EUR t−1 between the purchase prices of 2017 and 2018.
The expenses depending on the compared crop production costs differed only in the area “Technical operations costs” due to different tillage operations in studied tillage systems. There were small differences in value between tillage options due to the fact that the soil harrowing used in the reduced tillage variant was performed twice and was followed by soil treatment with a cultivator, which was the same as in the traditional tillage variant after ploughing. The need for double disc harrowing of the soil is explained by the granulometric composition of the soil: silt, which is heavy with fine soil particles; therefore, several soil tillage passes were necessary. If the disc harrowing was performed only once, the cost difference between CT and RT would be 39.70 EUR ha−1 in 2017, 34.39 EUR ha−1 in 2018, 41.43 EUR ha−1 in 2019 and 37.08 EUR ha−1 in 2020. During the four-year study period there were no large price fluctuations for any of the highlighted positions compared to those observed during the COVID-19 pandemic after 2020, and those due to the war that started in Ukraine in 2022, all resulting in a comprehensive energy crisis from 2022.
Due to minimal cost differences in tillage expenses, the average crop production expenses by the outcome groups were calculated as the average value for “Technical operations costs”. The costs of technical operations made proportionally the highest cost position for all included crops (Figure 4). For crops with lower total average cultivation costs (barley and field beans compared to winter wheat and rapeseed), the area “Technical operations costs” accounted for a larger share: 57.9% for spring barley and 52.9% for field beans.
The second largest area in the variable costs for cereals and rapeseed was “Mineral fertilisation”, which for winter wheat and spring barley made up from 28.0% to 34.0% of the total, respectively. In the field bean cultivation technology, mineral fertilisation was proportionally the smallest cost (8.8%). The smallest expenditure section for winter wheat and winter rapeseed cultivation technologies was for seed material, while 13.0–17.9% was spent on plant protection products. For spring barley, the smallest position was raw materials for “Plant protection”, because only herbicide was used annually, but the use of fungicide and insecticide depended on the distribution of harmful organisms in the field in a specific season. Winter oilseed rape cultivation technology did not include fungicide spraying in any of the years of the study, which reduced the share of cost of plant protection products in total, as fungicide is often the most expensive product for plant protection. Cultivation technology for field beans provided a high seed material proportion in raw material costs (18.9%) and a little lower expenditure (18.2%) was on plant protection products: herbicides, insecticides and fungicide were not used.
The most profitable crop sequence in the four-year (2017–2020) study period (Figure 5) was oilseed rape–wheat–wheat–oilseed rape in the crop rotation “67% wheat”. The gross coverage in four years amounted to 2189 EUR ha−1 if the RT system was used, and 1843 EUR ha−1 in the CT system. The next most profitable variant was in the crop rotation “25% wheat” with the crop sequence barley–field beans–wheat–rapeseed in the CT system (1736 EUR ha−1).
In the studied four-year period, the least profitable crop sequence was oilseed rape–spring barley–field beans–winter wheat in the crop rotation “25% wheat” in the CT system, in which the four-year profit amounted to only to 819 EUR ha−1, which was 2.67 times less than the most economically valuable option (OR–W–W–OR, RT). The most economically disadvantageous crop rotation options were “100% wheat”, where the average gross profit between both tillage systems in four years was 1024 EUR ha−1 and the rotation “25% wheat” with the crop sequence winter oilseed rape–barley–field beans–winter wheat–904 EUR ha−1, due to the low spring crop yield in the dry 2018 and 2019 seasons.
Comparing the crop rotation average gross profits per year, and taking into account the length of each crop rotation and taking into account the proportion of each crop in the crop rotation, it was found that the highest average annual gross coverage was for the crop rotation “67% wheat” in the CT variant (446 EUR ha−1) and the second most economically beneficial crop rotation was “25% wheat”, where 424 EUR ha−1 in CT and 411 EUR ha−1 in RT were obtained on average per year. The most economically disadvantageous option during the trial period was the long-term repeated sowings of wheat (on average 256 EUR ha−1 per year).

4. Discussion

The obtained results confirm the positive effect of crop diversification in rotation on winter wheat yield compared to long-term repeated wheat sowings. Higher wheat grain yields were gained in crop rotation where oilseed rape was included (6.40 t ha−1) and after field bean in four different crop rotations (6.77 t ha−1) compared to wheat in long-term repeated wheat sowings (5.39 t ha−1). Similar results were also obtained in the UK in a long-term trial, where wheat yields were significantly lower in the variant where wheat was repeatedly sown for a long time, compared to winter wheat yield in crop rotation [31]; this was also proved in Poland [32] and the Czech Republic [33]. In the study where winter oilseed rape and soybean (Glycine max) were included in wheat rotation, a significantly higher wheat yield was obtained after soybean [34]. A global data analysis gathered information and concluded that reduced tillage and no-tillage variants reduced crop yields in most cases, but in many conservation soil tillage practice cases, yields were equivalent to those obtained in traditional tillage systems [35]. The results of the trial in Lithuania were similar to our results described in this article, that equivalent yields were obtained in the CT and RT variants [36]. In Poland, it was found that average wheat yields were higher using CT but this tillage effect was significantly related to the meteorological conditions of the year [37]. The same could be said of the spring crop yields in our trial, where the effect of soil tillage depended on meteorological conditions.
Oilseed rape can yield differently in different soil and meteorological conditions. In Romania, it was found that higher oilseed rape yields can be obtained in traditional and reduced tillage compared to a no-till system [38]. By increasing the interval between sowing oilseed rape in the same field, the harvested yield can be increased [39,40]. Field bean yield, depending on the soil tillage treatment, did not differ significantly in the experiment in Lithuania, but at the same time, mathematically higher yields were gained in deep cultivation variants [41]. In field experiments in Poland, higher spring barley yield and yield components were gained in CT and RT, compared to no-till practice. The yield difference between RT and CT variants was not significant, but higher yield was gained in the CT system [42].
Similar to our results, previous research has not found significant differences in energy yield levels depending on tillage practices [24,43,44,45]. At the same time, diversifying field crops in rotations and using different tillage systems can increase yield and energy efficiency [21].
The gross profit from a one-year legume harvest was lower compared to growing wheat or rapeseed, and similar results were also found in other research [12,46]. Nevertheless, the inclusion of legume or oilseed rape in crop rotation contributes to higher yields for the succeeding crop. In this study, this is case for winter wheat, and higher yield can be obtained without additional expenses for nitrogen as concluded by other researchers as well [12,47]. A possibility for reducing the costs of agricultural production is the simplification of tillage system [18], which was not approved in this study in silt soil, because of the need for more than once soil disc harrowing operation for a well-prepared seed bed for sowing. Whereas technical operations constitute the largest part of costs, the economic profitability in terms of gross profit is strongly related to oil prices, which directly affect other energy source prices and inevitably also the final agricultural product prices [48]. Such crises as the COVID-19 pandemic also may have an influence on crop production sale prices, which depend basically on demand [49]. The price fluctuations during the research period 2017–2020 were low.
Complex research for crop rotation evaluation from the aspect of energy yield potential and economic profit in diverse meteorological conditions has not been widely documented in recent papers. The benefits of plant diversification in crop rotation to evaluate the productivity (yield of basic product as well as obtained energy) need to be studied in the long-term to obtain more convincing results about the importance of diversified crop rotation, but economic profitability is strongly related to the market situation which can change year by year.

5. Conclusions

Average winter wheat grain and straw yields were equivalent in conventional and reduced tillage systems where significantly higher average wheat yields were obtained in the rotation “67% wheat” and “25% wheat” compared to the repeated wheat sowings. The average yield of winter oilseed rape and spring barley in the trial was equivalent in both tillage systems while the average yield of field beans was significantly higher in the conventional tillage system.
The most energetically productive crops included in crop rotations were winter wheat (212.43 GJ ha−1) and winter oilseed rape (209.99 GJ ha−1). The energy yields of the crop rotation variants differed significantly, but no significant differences were found depending on the tillage system used.
The highest energy yield (GJ ha−1) during the four years (2017–2020) of the crop rotation variants studied was provided by the crop rotation “67% wheat”, while the crop rotation “25% wheat” provided a similar energy yield to the non-rotation variant of wheat (100% wheat). The low average energy yield in the rotation “25% wheat” during the specific study period was directly related to the low spring crop yields in the dry seasons of 2018 and 2019.
Crop rotation variants with two or more crops provided higher gross profit compared to long-term no-rotation crops. During the study period, the most economically beneficial crop rotation was “67% wheat” using reduced tillage. The economic result over the years was affected by both the changing prices of raw materials and changing crop yields.

Author Contributions

M.D.: field and laboratory investigations, data analysis, writing and editing; Z.G.: conceptualisation, methodology, writing and editing. All authors have read and agreed to the published version of the manuscript.

Funding

This article was funded by European Social Fund project No. 8.2.2.0/20/I/001 “LLU Transition to a new funding model of doctoral studies funded”.

Institutional Review Board Statement

Not applicable.

Data Availability Statement

The data presented in this study are available on request from the corresponding author.

Conflicts of Interest

The authors declare no conflict of interest.

References

  1. Renard, D.; Tilman, D. National food production stabilized by crop diversity. Nature 2019, 571, 257–260. [Google Scholar] [CrossRef]
  2. Revoyron, E.; Le Bail, M.; Meynard, J.-M.; Gunnarsson, A.; Seghetti, M.; Colombo, L. Diversity and drivers of crop diversification pathways of European farms. Agric. Syst. 2022, 201, 103439. [Google Scholar] [CrossRef]
  3. FAOStat, Value of Agricultural Production. Available online: https://www.fao.org/faostat/en/#data/QV (accessed on 3 July 2023).
  4. Zörb, C.; Geilfus, C.-M.; Dietz, K.-J. Salinity and crop yield. Plant Biol. 2019, 21 (Suppl. 1), 31–38. [Google Scholar] [CrossRef] [PubMed]
  5. Aguilar, J.; Gramig, G.G.; Hendrickson, J.R.; Archer, D.W.; Forcella, F.; Liebig, M.A. Crop Species Diversity Changes in the United States: 1978–2012. PLoS ONE 2015, 10, e0136580. [Google Scholar] [CrossRef]
  6. Beillouin, D.; Ben-Ari, T.; Malézieux, E.; Seufert, V.; Makowski, D. Positive but variable effects of crop diversification on biodiversity and ecosystem services. Glob. Chang. Biol. 2021, 27, 4697–4710. [Google Scholar] [CrossRef] [PubMed]
  7. Reckling, M.; Döring, T.F.; Bergkvist, G.; Stoddard, F.L.; Watson, C.A.; Seddig, S.; Chmielewski, F.-M.; Bachinger, J. Grain legume yields are as stable as other spring crops in long-term experiments across northern Europe. Agron. Sustain. Dev. 2018, 38, 63. [Google Scholar] [CrossRef] [PubMed]
  8. Raseduzzaman; Jensen, E.S. Does intercropping enhance yield stability in arable crop production? A meta-analysis. Eur. J. Agron. 2017, 91, 25–33. [Google Scholar] [CrossRef]
  9. Ločmele, I.; Legzdiņa, L.; Gaile, Z.; Kronberga, A. Estimation of yield and yield stability of spring barley genotype mixtures. In Proceedings of the Research for Rural Development, 2, 19–25, Jelgava, Latvia, 17–19 May 2017. [Google Scholar] [CrossRef]
  10. Ghorbani, R.; Mondani, F.; Amirmoradi, S.; Feizi, H.; Khorramdel, S.; Teimouri, M.; Sanjani, S.; Anvarkhah, S.; Aghel, H. A case study of energy use and economical analysis of irrigated and dryland wheat production systems. Appl. Energy 2011, 88, 283–288. [Google Scholar] [CrossRef]
  11. Dimitrijević, A.; Gavrilović, M.; Ivanović, S.; Mileusnić, Z.; Miodragović, R.; Todorović, S. Energy Use and Economic Analysis of Fertilizer Use in Wheat and Sugar Beet Production in Serbia. Energies 2020, 13, 2361. [Google Scholar] [CrossRef]
  12. Xing, H.; Liu, D.L.; Li, G.; Wang, B.; Anwar, M.R.; Crean, J.; Lines-Kelly, R.; Yu, Q. Incorporating grain legumes in cereal-based cropping systems to improve profitability in southern New South Wales, Australia. Agric. Syst. 2017, 154, 112–123. [Google Scholar] [CrossRef]
  13. MacWilliam, S.; Wismer, M.; Kulshreshtha, S. Life cycle and economic assessment of Western Canadian pulse systems: The inclusion of pulses in crop rotations. Agric. Syst. 2014, 123, 43–53. [Google Scholar] [CrossRef]
  14. Wieme, R.A.; Carpenter-Boggs, L.A.; Crowder, D.W.; Murphy, K.M.; Reganold, J.P. Agronomic and economic performance of organic forage, quinoa, and grain crop rotations in the Palouse region of the Pacific Northwest, USA. Agric. Syst. 2020, 177, 102709. [Google Scholar] [CrossRef]
  15. Cortignani, R.; Dono, G. Greening and legume-supported crop rotations: An impacts assessment on Italian arable farms. Sci. Total Environ. 2020, 734, 139464. [Google Scholar] [CrossRef] [PubMed]
  16. Reckling, M.; Bergkvist, G.; Watson, C.A.; Stoddard, F.L.; Zander, P.M.; Walker, R.L.; Pristeri, A.; Toncea, I.; Bachinger, J. Trade-Offs between Economic and Environmental Impacts of Introducing Legumes into Cropping Systems. Front. Plant Sci. 2016, 7, 669. [Google Scholar] [CrossRef]
  17. Lötjönen, S.; Ollikainen, M. Does crop rotation with legumes provide an efficient means to reduce nutrient loads and GHG emissions? Rev. Agric. Food Environ. Stud. 2017, 98, 283–312. [Google Scholar] [CrossRef]
  18. Romaneckas, K.; Avižienytė, D.; Adamavičienė, A.; Bogužas, V.; Sinkevičienė, A.; Šarauskis, E.; Jasinskas, A.; Kimbirauskienė, R.; Balandaitė, J.; Minajeva, A.; et al. Impact of reduced tillage on spring oil seed rape, winter wheat, maize and barley production in Lithuania. In Proceedings of the 47th Symposium ”Actual Tasks on Agricultural Engineering”, Opatija, Croatia, 21–24 February 2019; pp. 61–67. [Google Scholar]
  19. Darguza, M.; Gaile, Z. Productivity of crop rotation measured as energy produced by included plants: A review. In Proceedings of the Annual 24th International Scientific Conference “Research for Rural Development 2018”, Jelgava, Latvia, 16–18 May 2018; Volume 2, pp. 20–27. [Google Scholar] [CrossRef]
  20. Alluvione, F.; Moretti, B.; Sacco, D.; Grignani, C. EUE (energy use efficiency) of cropping systems for a sustainable agriculture. Energy 2011, 36, 4468–4481. [Google Scholar] [CrossRef]
  21. Zhang, L.; Xu, C.C.; Champagne, P. Overview of recent advances in thermo-chemical conversion of biomass. Energy Convers. Manag. 2010, 51, 969–982. [Google Scholar] [CrossRef]
  22. Erol, M.; Haykiri-Acma, H.; Küçükbayrak, S. Calorific value estimation of biomass from their proximate analyses data. Renew. Energy 2010, 35, 170–173. [Google Scholar] [CrossRef]
  23. Dai, J.; Bean, B.; Brown, B.; Bruening, W.; Edwards, J.; Flowers, M.; Karow, R.; Lee, C.; Morgan, G.; Ottman, M.; et al. Harvest index and straw yield of five classes of wheat. Biomass Bioenergy 2016, 85, 223–227. [Google Scholar] [CrossRef]
  24. Zentner, R.; Lafond, G.; Derksen, D.; Nagy, C.; Wall, D.; May, W. Effects of tillage method and crop rotation on non-renewable energy use efficiency for a thin Black Chernozem in the Canadian Prairies. Soil Tillage Res. 2004, 77, 125–136. [Google Scholar] [CrossRef]
  25. Karklins, A. Soil organic carbon content and stock depending on used soil tillage methods. In Proceedings of the Connecting People and Soil, Geneva, Switzerland, 23–27 August 2021. [Google Scholar]
  26. Gross Coverage Calculation for 2017, Latvian Rural Advisory and Training Center. Available online: https://new.llkc.lv/lv/nozares/augkopiba-ekonomika-lopkopiba/sagatavoti-bruto-segumi-par-2017-gadu (accessed on 3 July 2023).
  27. Gross Coverage Calculation for 2018, Latvian Rural Advisory and Training Center. Available online: https://new.llkc.lv/lv/nozares/augkopiba-ekonomika-lopkopiba/sagatavoti-bruto-segumi-par-2018-gadu (accessed on 3 July 2023).
  28. Gross Coverage Calculation for 2019, Latvian Rural Advisory and Training Center. Available online: https://new.llkc.lv/lv/nozares/augkopiba-ekonomika-lopkopiba/sagatavoti-bruto-segumi-par-2019-gadu (accessed on 3 July 2023).
  29. Gross Coverage Calculation for 2020, Latvian Rural Advisory and Training Center. Available online: https://new.llkc.lv/lv/nozares/augkopiba-ekonomika-lopkopiba/sagatavoti-bruto-segumi-par-2020-gadu (accessed on 3 July 2023).
  30. Gross Coverage Calculation for 2016, Latvian Rural Advisory and Training Center. Available online: https://new.llkc.lv/lv/nozares/ekonomika/sagatavoti-bruto-segumi-par-2016-gadu (accessed on 3 July 2023).
  31. Macholdt, J.; Piepho, H.P.; Honermeier, B.; Perryman, S.; Macdonald, A.; Poulton, P. The effect of cropping sequence, fertilization and straw management on the yield stability of winter wheat (1986–2017) in the Broadbalk wheat experiment, Rothamsted, UK. J. Agric. Sci. 2020, 58, 65–79. [Google Scholar] [CrossRef]
  32. Pszczółkowska, A.; Okorski, A.; Olszewski, J.; Fordoński, G.; Krzebietke, S.; Chareńska, A. Effects of pre-preceding leguminous crops on yield and chemical composition of winter wheat grain. Plant Soil Environ. 2018, 64, 592–596. [Google Scholar] [CrossRef]
  33. Vrtilek, P.; Smutny, V.; Dryšlova, T.; Neudert, L.; Kren, J. The effect of agronomic measures on grain yield of winter wheat in drier conditions. Plant Soil Environ. 2019, 65, 63–70. [Google Scholar] [CrossRef]
  34. Gawęda, D.; Haliniarz, M. Grain Yield and Quality of Winter Wheat Depending on Previous Crop and Tillage System. Agriculture 2021, 11, 133. [Google Scholar] [CrossRef]
  35. Pittelkow, C.M.; Linquist, B.A.; Lundy, M.E.; Liang, X.; van Groenigen, K.J.; Lee, J.; van Gestel, N.; Six, J.; Venterea, R.T.; van Kessel, C. When does no-till yield more? A global meta-analysis. Field Crop. Res. 2015, 183, 156–168. [Google Scholar] [CrossRef]
  36. Seibutis, V.; Deveikytė, I.; Feiza, V. Effects of short crop rotation and soil tillage on winter wheat development in central Lithuania. Agron. Res. 2009, 7, 471–476. [Google Scholar]
  37. Woźniak, A.; Rachoń, L. Effect of Tillage Systems on the Yield and Quality of Winter Wheat Grain and Soil Properties. Agriculture 2020, 10, 405. [Google Scholar] [CrossRef]
  38. Răus, L.; Jităreanu, G.; Ailincăi, C.; Pârvan, L.; Ţopa, D. Impact of different soil tillage systems and organo-mineral fertilization on physical properties of the soil ans on crops yiels in pedoclimatic conditions on Moldovian pedoclimatic condition of Moldovian plateau. Rom. Agric. Res. 2016, 33, 111–123. [Google Scholar]
  39. Hegewald, H.; Wensch-Dorendorf, M.; Sieling, K.; Christen, O. Impacts of break crops and crop rotations on oilseed rape productivity: A review. Eur. J. Agron. 2018, 101, 63–77. [Google Scholar] [CrossRef]
  40. Bennett, A.J.; Hilton, S.; Chandler, D.; Mills, P.; Bending, G.D. Relationships between yield, rotation length, and abundance of Olpidium brassicae and Pyrenochaeta sp. in the rhizosphere of oilseed rape. Appl. Soil Ecol. 2019, 147, 103433. [Google Scholar] [CrossRef]
  41. Šarauskis, E.; Romaneckas, K.; Jasinskas, A.; Kimbirauskienė, R.; Naujokienė, V. Improving energy efficiency and environmental mitigation through tillage management in faba bean production. Energy 2020, 209, 118453. [Google Scholar] [CrossRef]
  42. Malecka, I.; Blecharczyk, A.; Sawinska, Z.; Dobrzeniecki, T. The effect of various long-term tillage systems on soil properties and spring barley yield. Turk. J. Agric. For. 2012, 36, 217–226. [Google Scholar] [CrossRef]
  43. Nagy, C.N.; Jonhston, A.M.; Wall, D.D.; Zentner, R.P.; Gill, R. Influence of tillage method on non-renewable energy use efficiency in the black and gray soil zones in Regina. In Proceedings of the Climate Change Workshop, Saskatchewan Agriculture and Food, Saskatoon, SK, Canada, 11–12 December 2000. [Google Scholar]
  44. Kroģere, R.; Liepiņš, J.; Ausmane, M.; Melngalvis, I. Augsnes pamatapstrādes minimalizācija augsekā I Augsekas produk-tivitāte. LLU Raksti 2005, 13, 18–25. [Google Scholar]
  45. Strašil, Z.; Vach, M.; Smutný, V. The Energy Effectiveness Of Crops In Crop Rotation Under Different Soil Tillage Systems. Agriculture 2015, 61, 77–87. [Google Scholar] [CrossRef]
  46. Preissel, S.; Reckling, M.; Schläfke, N.; Zander, P. Magnitude and farm-economic value of grain legume pre-crop benefits in Europe: A review. Field Crops Res. 2015, 175, 64–79. [Google Scholar] [CrossRef]
  47. Weiser, C.; Fuß, R.; Kage, H.; Flessa, H. Do farmers in Germany exploit the potential yield and nitrogen benefits from preceding oilseed rape in winter wheat cultivation? Arch. Agron. Soil Sci. 2017, 64, 25–37. [Google Scholar] [CrossRef]
  48. Miljkovic, D.; Vatsa, P. On the linkages between energy and agricultural commodity prices: A dynamic time warping analysis. Int. Rev. Financ. Anal. 2023, 90, 102834. [Google Scholar] [CrossRef]
  49. Upite, I.; Bite, D.; Pilvere, I.; Nipers, A. Impacts of COVID-19 on the Food Supply Chain for Arable Crops in Latvia. Rural Sustain. Res. 2022, 47, 47–60. [Google Scholar] [CrossRef]
Figure 1. Average energy yield (GJ ha−1) from grains/seeds and post-harvest residues of the crops included in the crop rotations during the study years in which the crops were grown.
Agriculture 13 01751 g001
Figure 2. Average annual energy yield (GJ ha−1) depending on combinations of crops included in crop rotations and tillage system in trial period from 2017 to 2020 (W—wheat, OR—oilseed rape, B—barley, FB—beans; CT—conventional tillage; RT—reduced tillage), ab – significant (p < 0.05) differences within the studied factors (crop rotation, tillage system, year) are indicated by different letters.
Agriculture 13 01751 g002
Figure 3. Gained average energy yield (GJ ha−1) and energy yield proportion (%) from included crops depending on crop rotation variant. (a) crop rotation 67% wheat; (b) crop rotation 25% wheat.
Agriculture 13 01751 g003
Figure 4. Cost group proportion (%) of the total average costs for winter wheat, winter rapeseed, spring barley, and field bean cultivation.
Agriculture 13 01751 g004
Figure 5. Potential gross profit (EUR ha−1) of crop rotation and tillage variants over a four-year period without subsidies (from 2017–2020) (W—winter wheat; OR—oilseed rape; B—spring barley; FB—field bean).
Agriculture 13 01751 g005
Table 1. Average purchase prices (EUR t−1) of crops obtained in the trial from 2017 to 2020.
Grain/Seed Type2017201820192020
Wheat grains, food152.00185.00162.00169.00
Wheat grains, feed134.00175.00144.00151.00
Oilseed rape seeds352.00351.00373.00356.00
Barley grains129.00176.37133.60137.00
Field bean seeds, feed200.00225.00225.00220.00
Table 2. Winter wheat grain yields (t ha−1) depending on crop rotation and soil tillage in 2017–2020.
Year (Y)Soil Tillage (ST)Crop Rotation (CR)Average, p < 0.001
Conventional Tillage (CT)Reduced
Tillage (RT)
100% Wheat 67% Wheat25% Wheat
20176.87 a7.48 b6.38 a7.08 a8.06 b7.17 B
20186.24 a6.11 a5.23 a6.65 b-6.18 A
20195.70 a5.66 a4.93 a5.46 b6.64 c5.68 A
20206.30 a6.16 a6.06 a6.22 ab6.41 b6.23 A
Average6.28 A6.35 A5.39 A6.40 B6.77 B×
p-value0.33<0.001
Interactions: ST × CR: p < 0.001; ST × Y: p = 0.0006; CR × Y: p < 0.001. AB—different uppercase letters in the superscript denote significant differences between mean values within factors; abc—different lowercase letters in the superscript denote significant differences between the average values in crop rotation and tillage variant within each year of the study.
Table 3. Oilseed rape, barley and field bean seed yield (t ha−1) in conventional and reduced soil tillage.
Soil TillageField Crop
Oilseed RapeSpring BarleyField Bean
Conventional3.03 a4.50 a3.17 b
Reduced3.09 a5.00 a3.03 a
p-value0.850.070.01
ab—different letters in the superscript indicate significant differences in field crop average yields depending on soil tillage system.
Disclaimer/Publisher’s Note: The statements, opinions and data contained in all publications are solely those of the individual author(s) and contributor(s) and not of MDPI and/or the editor(s). MDPI and/or the editor(s) disclaim responsibility for any injury to people or property resulting from any ideas, methods, instructions or products referred to in the content.

