Article

The Impact of Digital Financial Inclusion on Green and Low-Carbon Agricultural Development

College of Economics, Sichuan Agricultural University, Chengdu 611130, China
*
Author to whom correspondence should be addressed.
These authors contributed equally to this work.
Agriculture 2023, 13(9), 1748; https://doi.org/10.3390/agriculture13091748
Submission received: 5 July 2023 / Revised: 29 August 2023 / Accepted: 31 August 2023 / Published: 2 September 2023
(This article belongs to the Section Agricultural Economics, Policies and Rural Management)

Abstract

:
Under the “two-carbon” goal, the green and low-carbon development of agriculture is a critical way to consummate agricultural modernization and high-quality economic establishment. Digital inclusive finance eases credit restrictions. It enhances the availability of funds for farmers. It promotes the integration of agricultural industries and talent gathering through digitalization, improves the standard of agricultural production and promotes the development of green and low-carbon agricultural modernization in China. This paper uses panel data for 2011–2021, which includes 31 provinces in China. Green and low-carbon development indicators of agriculture were constructed and calculated, and the comprehensive horizontal spatial differentiation map of GIS technology was used for analysis. A spatial panel model was set up at the same time, to explore the impact and mechanism test of digital financial inclusion on the green and low-carbon development of agriculture, and regional heterogeneity was analyzed. (1) Digital financial inclusion can promote the green and low-carbon development of agriculture, and its influence has a positive spatial spillover effect. (2) The education level of the labor force plays an intermediary role and is the transmission mechanism of digital financial inclusion and the green and low-carbon development of agriculture. (3) The impact of digital financial inclusion on green and low-carbon agricultural development has regional heterogeneity.

1. Introduction

Due to the development of the times, modern agriculture, which uses modern science and technology and modern means of production and equipment, is gradually replacing traditional agriculture. The birth of modern agricultural techniques has led to an increase in agricultural productivity; however, in modern agriculture, excessive use of chemicals has caused long-term harm to the environment. In the background of China’s “Double Carbon” goal and rural revitalization, green and low-carbon agricultural development is a crucial way to realize agricultural modernization and high-quality economic development [1]. Green and low-carbon agricultural development will gradually reduce extensive production and effectively protect natural resources, which are a solid foundation for agricultural production and life. And the concept of green and low-carbon development promotes agricultural production to produce the highest yield at the lowest cost, innovate green agricultural technology and improve green production efficiency. In terms of resources and concepts, the green and low-carbon development of agriculture has continuously promoted regional development. This development is sustainable and long-term.
With the continuous innovation of the digital economy, promoting the green and low-carbon development of agriculture by digitalization has gradually become the focus of scholars [2]. The green and low-carbon development of agriculture, in addition to needing the support of the digital economy, also needs an organic combination of financial elements and market mechanisms. The use of financial leverage can stimulate the optimization of financial factors and improve the total factor productivity of agriculture, thereby promoting green, low-carbon and high-quality development. Because traditional finance pays more attention to the market environment and economic effects, the problem of difficult rural financing cannot be effectively solved [3]. Although inclusive finance can effectively increase the income of rural residents [4], the lack of digital technology has led to a limited spread of inclusive finance to rural areas. With the rise of internet finance and electronic payments, inclusive finance that has joined digital technology has gradually penetrated the market. China’s digital financial inclusion average index rose from 36.2 to 218.9, with an average annual growth rate of 43.3%, which is due to the increase in the number of users and the entry of funds from 2011 to 2015. From 2015 to 2016, the development trend of digital financial inclusion slowed down, and the average annual growth rate declined. After 2016, with the introduction of normative documents and the enhancement of the risk supervision system, digital inclusive finance has developed at a steady annual growth rate of about 7.8% in a healthy market environment. The steady development of digital financial inclusion has effectively reduced the cost of financial risk identification, made the financial sector reach deeper and wider regions, and contributed to national economic development.
As a new financial model, digital inclusive finance uses digital technology to improve the efficiency of traditional finance and green finance services and provides a convenient and efficient financing channel for the majority of vulnerable agricultural production groups [5]. Based on this, agricultural production efficiency has improved, agricultural carbon dioxide emissions and agricultural pollution have reduced [6] and agricultural green output can be improved. In addition, digital inclusive finance can promote the industrialization of digital science and technology to optimize the industry [7], promote the integration of the agricultural industry and talent agglomeration, facilitate the formation of green agriculture and enhance the new kinetic energy of agricultural green development. Therefore, against the background of vigorously developing a digital economy and accelerating the digital transformation of traditional industries, the study on the impact of digital inclusive finance on the green and low-carbon development of agriculture is not only a critical method for upgrading the level of green development in agriculture but also an important issue to be considered in realizing the sustainable development of agricultural modernization.
How can digital financial inclusion promote the green and low-carbon development of agriculture? Is there any difference between different regions? By measuring the agricultural green and low-carbon development levels of 31 provinces in China and matching them with the provincial space based on the Peking University Digital Inclusive Finance Index, this paper focuses on exploring the effect and transmission mechanism of digital inclusive finance on agricultural green and low-carbon development, with a view to providing theoretical guidance and empirical evidence support for better promoting the development of digital inclusive finance and promoting agricultural green and low-carbon transformation. This paper may make a marginal contribution in the following three aspects: First, in terms of index construction, the evaluation index system of agricultural green and low-carbon development should be constructed from the dimensions of agricultural social and economic development, resource utilization, environmental ecology and green and low-carbon production. It should measure the level of agricultural green and low-carbon development in different regions of our country and conduct spatial differentiation analysis, therefore enriching the relevant literature and theoretical connotation. The second aspect is the transmission mechanism, which reveals the transmission effect of the development of digital inclusive finance on the green and low-carbon development of agriculture through the education level of the labor force and provides empirical evidence to support the scientific evaluation of the green, low-carbon and high-quality development of agriculture enabled by digital inclusive finance. Third, from the perspective of space, the latest data and GIS technology are used to draw a comprehensive horizontal spatial differentiation map to explore its spatial effect. The spatial panel model was constructed and analyzed to provide new ideas for analyzing the brunt of digital inclusive finance on the green and low-carbon development of agriculture.

2. Literature Review and Research Hypothesis

2.1. Literature Review

The low-carbon development of agriculture in China is the premise of rural revitalization and the key to realizing the green transformation of the social economy [8]. The relevant literature mainly includes research related to digital inclusive finance, research related to the green and low-carbon development of agriculture, and research related to digital inclusive finance in the green and low-carbon development of agriculture.
The first kind of research is on digital financial inclusion. A large number of works have studied high-quality economic development, the upgrading of industrial structure and rural household income related to digital inclusive finance. First of all, the digital economy is steadily becoming a new engine for China’s high-quality development. Yating [9] studied evidence from 30 provinces in China and indicated that digital financial inclusion is of direct and far-reaching significance to high-quality economic development. And it also has a positive impact on China’s economic transition by easing financial constraints through leverage [10]. Secondly, most scholars believe that digital inclusive finance has a great promoting effect on provincial and municipal industrial structure upgrading [11,12]. In addition, digital inclusive finance also plays a positive role in the integration of rural three industries [13]. Finally, digital inclusive finance faces farmers directly, so it plays an increasingly crucial role in improving residents’ income levels and optimizing income structure. Liu et al. [14] analyzed the data from a Chinese household finance survey from a micro perspective and indicated that digital inclusive finance significantly increased residents’ income. Fanqi et al. [15] suggest that digital financial inclusion will regulate residents’ understanding and financial cognition of finance, thus affecting farmers’ income.
Secondly, there are many research studies on the green and low-carbon development of agriculture, which mainly focus on its index construction, its influencing factors and its role. First of all, the overall goal of green and low-carbon agricultural development is coordination and realizing the transformation from agriculture with high resource consumption and high environmental cost to green and low-carbon agriculture and rural areas with high productivity, high resource utilization efficiency and low environmental impact [16]. Scholars have different indicators, but they basically follow the overall goal of green and low-carbon agricultural development. Fan [17] and others constructed the indicators of agricultural green development from four aspects: economic and social development, resource conservation and investment, resource recycling and resource-environment friendliness. He et al. [18] constructed an agricultural green and low-carbon development index system from the dimensions of resource conservation, environmental friendliness, high quality and living security. Jin [19] constructed an agricultural green and low-carbon development index system in China from the aspects of agricultural green production, green products, the ecological environment and people’s quality of life and living. Secondly, there are many factors affecting the green and low-carbon development of agriculture. The government plays an important role in promoting low-carbon agricultural development. Reasonable subsidies and carbon taxes can mobilize the enthusiasm of agricultural enterprises and farmers to participate in low-carbon agriculture, thereby promoting low-carbon agricultural development [20]. Finance also plays an important role in promoting the green development of agriculture. Bregje [21] and others believe that the development of green finance is conducive to promoting the development of low-carbon agriculture. Dainan and Xin [22], based on the provincial panel data of China from 2007 to 2019, think that agricultural insurance can inhibit the green development of agriculture. In addition, the application of digital information technology in agricultural activities and the green planting and consumption of farmers have promoted the green development of agriculture [23,24]. Finally, the development of green and low-carbon agriculture is not only conducive to the substantial growth of green assets from natural resources but also conducive to coping with climate change and achieving sustainable agricultural development [25,26]. It is also conducive to other social benefits, such as the level of labor education and urbanization [27].
Third, based on the impact of digital inclusive finance on the development of green and low-carbon agriculture, scholars mainly focus on financial support, technological innovation and green industry system construction. First of all, digital inclusive finance plays an important role in agricultural ecological efficiency and agricultural technological innovation. With the development of digital inclusive finance, the accessibility of financial services between urban and rural areas has increased, and digital inclusive finance will better meet the needs of people who struggle to obtain financial services [28]. Jiehua & Zhenghui [29] pointed out that there is a positive U-shaped nonlinear relationship between digital inclusive finance and agricultural ecological efficiency, and the investment in agricultural R&D will strengthen the promotion of digital inclusive finance for agricultural ecological efficiency. Digital inclusive finance promotes technological innovation through mechanisms such as financing constraints and market efficiency [30]. Moreover, digital inclusive finance can significantly improve farmers’ adoption of agricultural technology [31], and the green technologies and services generated are applied to agricultural production, which greatly reduces agricultural pollution and significantly improves resource utilization efficiency. Secondly, digital inclusive finance also plays an important role in the construction of agricultural green industrial systems. On the one hand, digital inclusive finance can reduce the occurrence of “credit mismatch” and “financial exclusion”, realize the accurate matching of supply and demand funds, improve the utilization rate of factors, optimize industrial supply and product quality, and thus promote the integrated development of the agricultural industry [32,33]. On the other hand, as a form of modern finance, digital inclusive finance can organically participate in the process of agricultural industry organization transformation and human capital transformation and promote the continuous development and growth of new intermediary industries such as agricultural social services [34,35]. By exerting the effects of talent gathering and technological innovation, digital inclusive finance has accelerated the process of establishing an agricultural, green industrial system [36].
The existing literature is rich and insightful, but there is much more to be performed to answer the question of how digital financial inclusion impacts the green and low-carbon development of agriculture: First, from the perspective of research, a large number of studies focus on the impact of traditional financial and digital technologies on the green and low-carbon development of agriculture. However, studies on the direct impact and transmission mechanisms of digital financial inclusion on the green and low-carbon development of agriculture are relatively weak. How digital financial inclusion can enable the green and low-carbon development of agriculture and the related research of digital inclusive finance on its transmission mechanism still needs to be further refined and expanded. Second, in terms of index construction, previous studies on agricultural green and low-carbon development indicators were not uniform, and each scholar focused on different aspects, mostly from the perspective of economic development, resource conservation and living ecology [37]. In addition to development and resources, green and low-carbon production should also be considered as the goal of the green and low-carbon development of agriculture. Few literature studies focus on this dimension. In this paper, green and low-carbon production is added to the index to explore the level of green and low-carbon agricultural development in China from the perspective of the production process and results.

2.2. Research Hypothesis

The green and low-carbon development of agriculture needs the coordinated development of a social economy and the overall development of agriculture. The emergence of digital inclusive finance has eased the credit constraint, reduced the digital divide of the income gap between urban and rural residents and increased farmers’ income and financial literacy [38]. Compared with traditional inclusive finance, digital inclusive finance promotes the coverage and availability of financial services for rural residents, alleviates urban–rural dual differentiation, coordinates the economic and social development of urban and rural areas, enhances the financial literacy of farmers, adjusts their understanding and cognition of finance, improves their income and optimizes their income structure [15]. Considering the provision of funds for the scale and specialization of agriculture, from the market aspect, it has promoted the technological innovation of R&D departments and improved the marketization degree of agricultural products, thus stimulating the economic vitality of rural areas and agriculture and the overall development of agriculture and rural areas. From the point of view of macroeconomic development, the development of digital inclusive finance can promote the high-quality development of the economy and the upgrading of industrial structures. Through the integrated development of rural three industries, the prosperity of rural industries can be promoted, the core competitiveness of rural areas can be enhanced, and the fragility of rural financial ecology can be alleviated, thus providing stable support for agricultural development and agricultural production. With the improvement of the economy, the basic literacy of farmers has improved, and farmers’ ecological awareness has been gradually awakened [39]. At the same time, for the purpose of adapting to the development of the economy, the agricultural market will be flooded with more capital and talent in line with the market, and the awareness of environmental protection development in the whole rural area and agricultural industry will be enhanced, thus promoting the green and low-carbon development of agriculture. Therefore, this paper puts forward the following assumptions:
Hypothesis 1.
Digital inclusive finance promotes the green and low-carbon development of agriculture.
The development of modern society cannot be separated from human resources. Human resources have the function of creating value. Meanwhile, they are also important means of production in agricultural production activities [40]. Digital financial inclusion integrates financial services with rural households in a deeper and more comprehensive way, alleviates the digital divide, improves the financial literacy of rural households and promotes the education level of the labor force. The quality of agricultural production has improved to further promote the green and low-carbon development of agriculture. The analysis of the specific influence mechanism is as follows: first, the inequality of educational opportunities restricts the education level of rural residents to a large extent, leading to a gap between urban and rural education levels. Digital financial inclusion can effectively promote equal educational opportunities; alleviate the inequality of educational opportunities caused by gender discrimination, urban and rural differences, income stratification, etc.; and enhance the educational expectations of families, thus promoting the educational level of the labor force [41]. Second, credit constraints to a large extent restrict the families’ investment in their children’s education. Digital finance, on the other hand, can break the restrictions of traditional finance through digital technology, improve the availability of products and services, make up for the deficiencies of traditional finance, relieve credit constraints and thus promote the investment of families in education [42] and therefore education attainment. When the education level of rural residents is relatively equal and families invest more in their children’s education, the education level of the labor force will improve. The labor force will use more knowledge in production labor, agricultural production efficiency and quality will be improved [43], social products and services will be innovative and the social atmosphere will be improved, enhancing the green and low-carbon development level of regional agriculture. Therefore, the following hypothesis is proposed:
Hypothesis 2.
The education level of the labor force plays an intermediary role in promoting the green and low-carbon development of agriculture by digital inclusion finance.

3. Measurement and Analysis of Green and Low-Carbon Agricultural Development Level

3.1. Construction of Agricultural Green and Low-Carbon Development Index System

In China’s green agricultural development plan, the implications of the green and low-carbon development of agriculture are relatively rich and clearly show that the construction of spatial patterns, industrial structures and production modes for resource conservation and environmental protection will be accelerated. Five clear goals were put forward, namely, the level of resource utilization was remarkably improved, the environmental quality of the production area was conspicuously improved, the agricultural ecosystem was significantly improved, the supply of green products was dramatically increased, and the carbon emission reduction and sequestration capacity were significantly enhanced [44]. On this basis, this paper constructs agricultural green and low-carbon development indicators based on four dimensions: agricultural socio-economic development, resource utilization, environmental ecology and green and low-carbon development.
The green and low-carbon development of agriculture cannot be separated from the word “development”: Green and low-carbon development refers to the maximum development with the least resources, while “green” should also pay attention to “development”. Therefore, in terms of agricultural social and economic development, this paper selects gross agricultural product, per capita net income of farmers and land yield rate to measure agricultural social and economic development. Promoting agricultural development is not extensive development but development that matches the carrying capacity of resources and environment, and three important indicators of multiple cropping index of cultivated land, water-saving irrigation and grain output per unit area are selected to reflect the situation in terms of resource utilization. Agricultural non-point source pollution is an important part of the battle against pollution prevention and control, and it is also an important problem to be solved in the green and low-carbon development of agriculture. At present, China has made positive progress in the treatment of pollution, but the structural and root causes of pollution are still great. Therefore, this paper selected forest coverage rate, intensity of pesticide use, fertilizer application intensity and agricultural film use intensity to reflect the agricultural environment and ecology. Green and low-carbon production is an indispensable part of low-carbon agricultural development. Therefore, this paper uses green production of food and low-carbon production on cultivated land to reflect green and low-carbon production indicators and mainly uses production results and processes to reflect the green and low-carbon development of agriculture. On this basis, this paper constructs an index system for measuring the level of green and low-carbon development in China’s agriculture from 2011 to 2021, as shown in Table 1.
This index is constructed according to the connotation and characteristics of the low-carbon agricultural economy and the development status for low-carbon agriculture in China, and with reference to the existing research results of the evaluation index system of the low-carbon agricultural economy. After a large number of literature reviews, basically every scholar’s index is different. Generally, there are three primary indexes: agricultural socio-economic development, resource utilization and environmental ecology, and the secondary indexes are slightly different. There is almost no measure of green and low-carbon production, which is what distinguishes this index from other indexes.

3.2. Data Processing and Calculation

Taking the research of Wang Fuxi et al. as a reference [45], this paper uses the entropy method to determine the weight of each evaluation index and then uses the calculated index weight to measure the green and low-carbon development level of China’s agriculture. The measurement steps of this method are as follows:
The first step is data standardization. Since there are differences in measurement units among indexes and the evaluation index of agricultural green development in the table includes both positive and negative indicators, the negative indicators must be treated in a positive way. For the positive indicator, bigger is better, while for the negative indicator, smaller is better. The following two formulas were used to standardize the data:
Positive indicators:
X ij = x ij x min x max x min
Negative indicators:
X i j = x m a x x i j x m a x x m i n
where Xij represents the standardized value of the j index of province i, xij represents the value of j index of province i, xmax and xmin represent the maximum and minimum values of the j index, respectively. The maximum and minimum values refer to the maximum and minimum values of all provinces.
The second step is to determine the specific gravity Ri of the index value under the j index.
R i = X i j i = 1 n j = 1 m X i j
The third step is to calculate the entropy value Ej of the j index.
E j = i = 1 n ( R i l n R i ) l n m
The fourth step is to calculate the difference coefficient Gj of the j index.
G j = 1 E j
The fifth step is to calculate the weight Wj of each index.
W j = G j j = 1 m G j
The sixth step is to calculate the comprehensive score Pi of agricultural green and low-carbon development level of each province according to the calculated weight of each index.
P i = i = 1 n j = 1 m W j × X i j

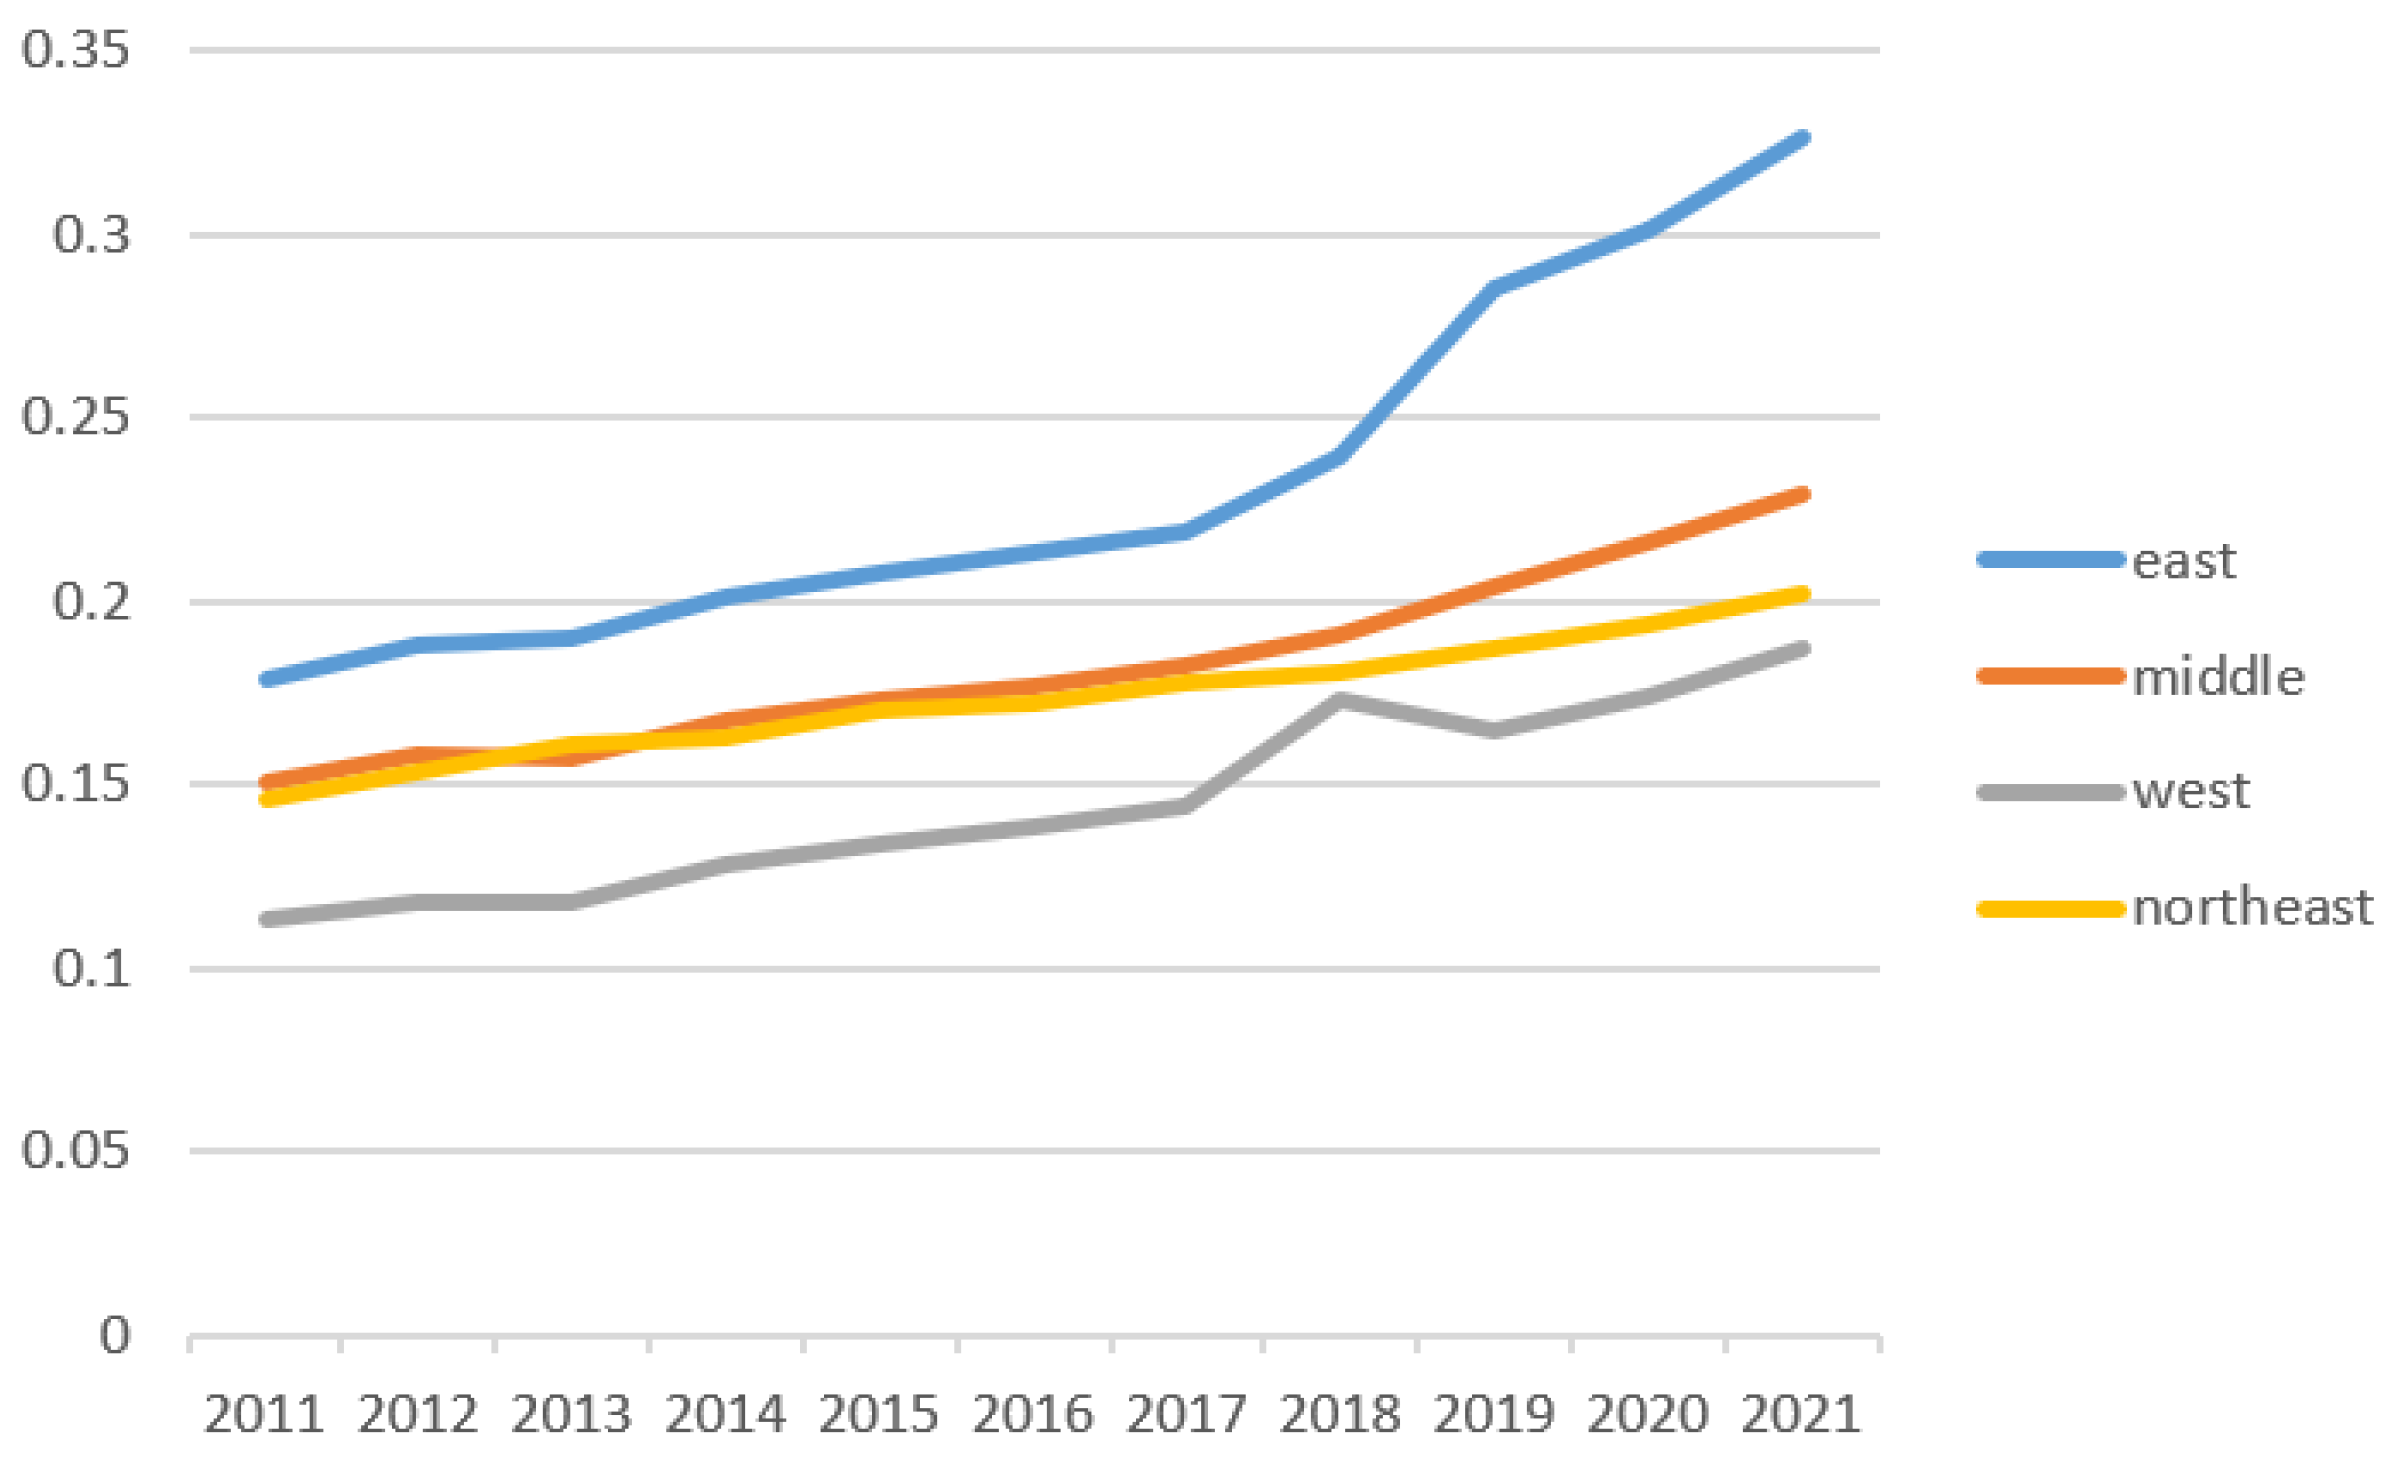
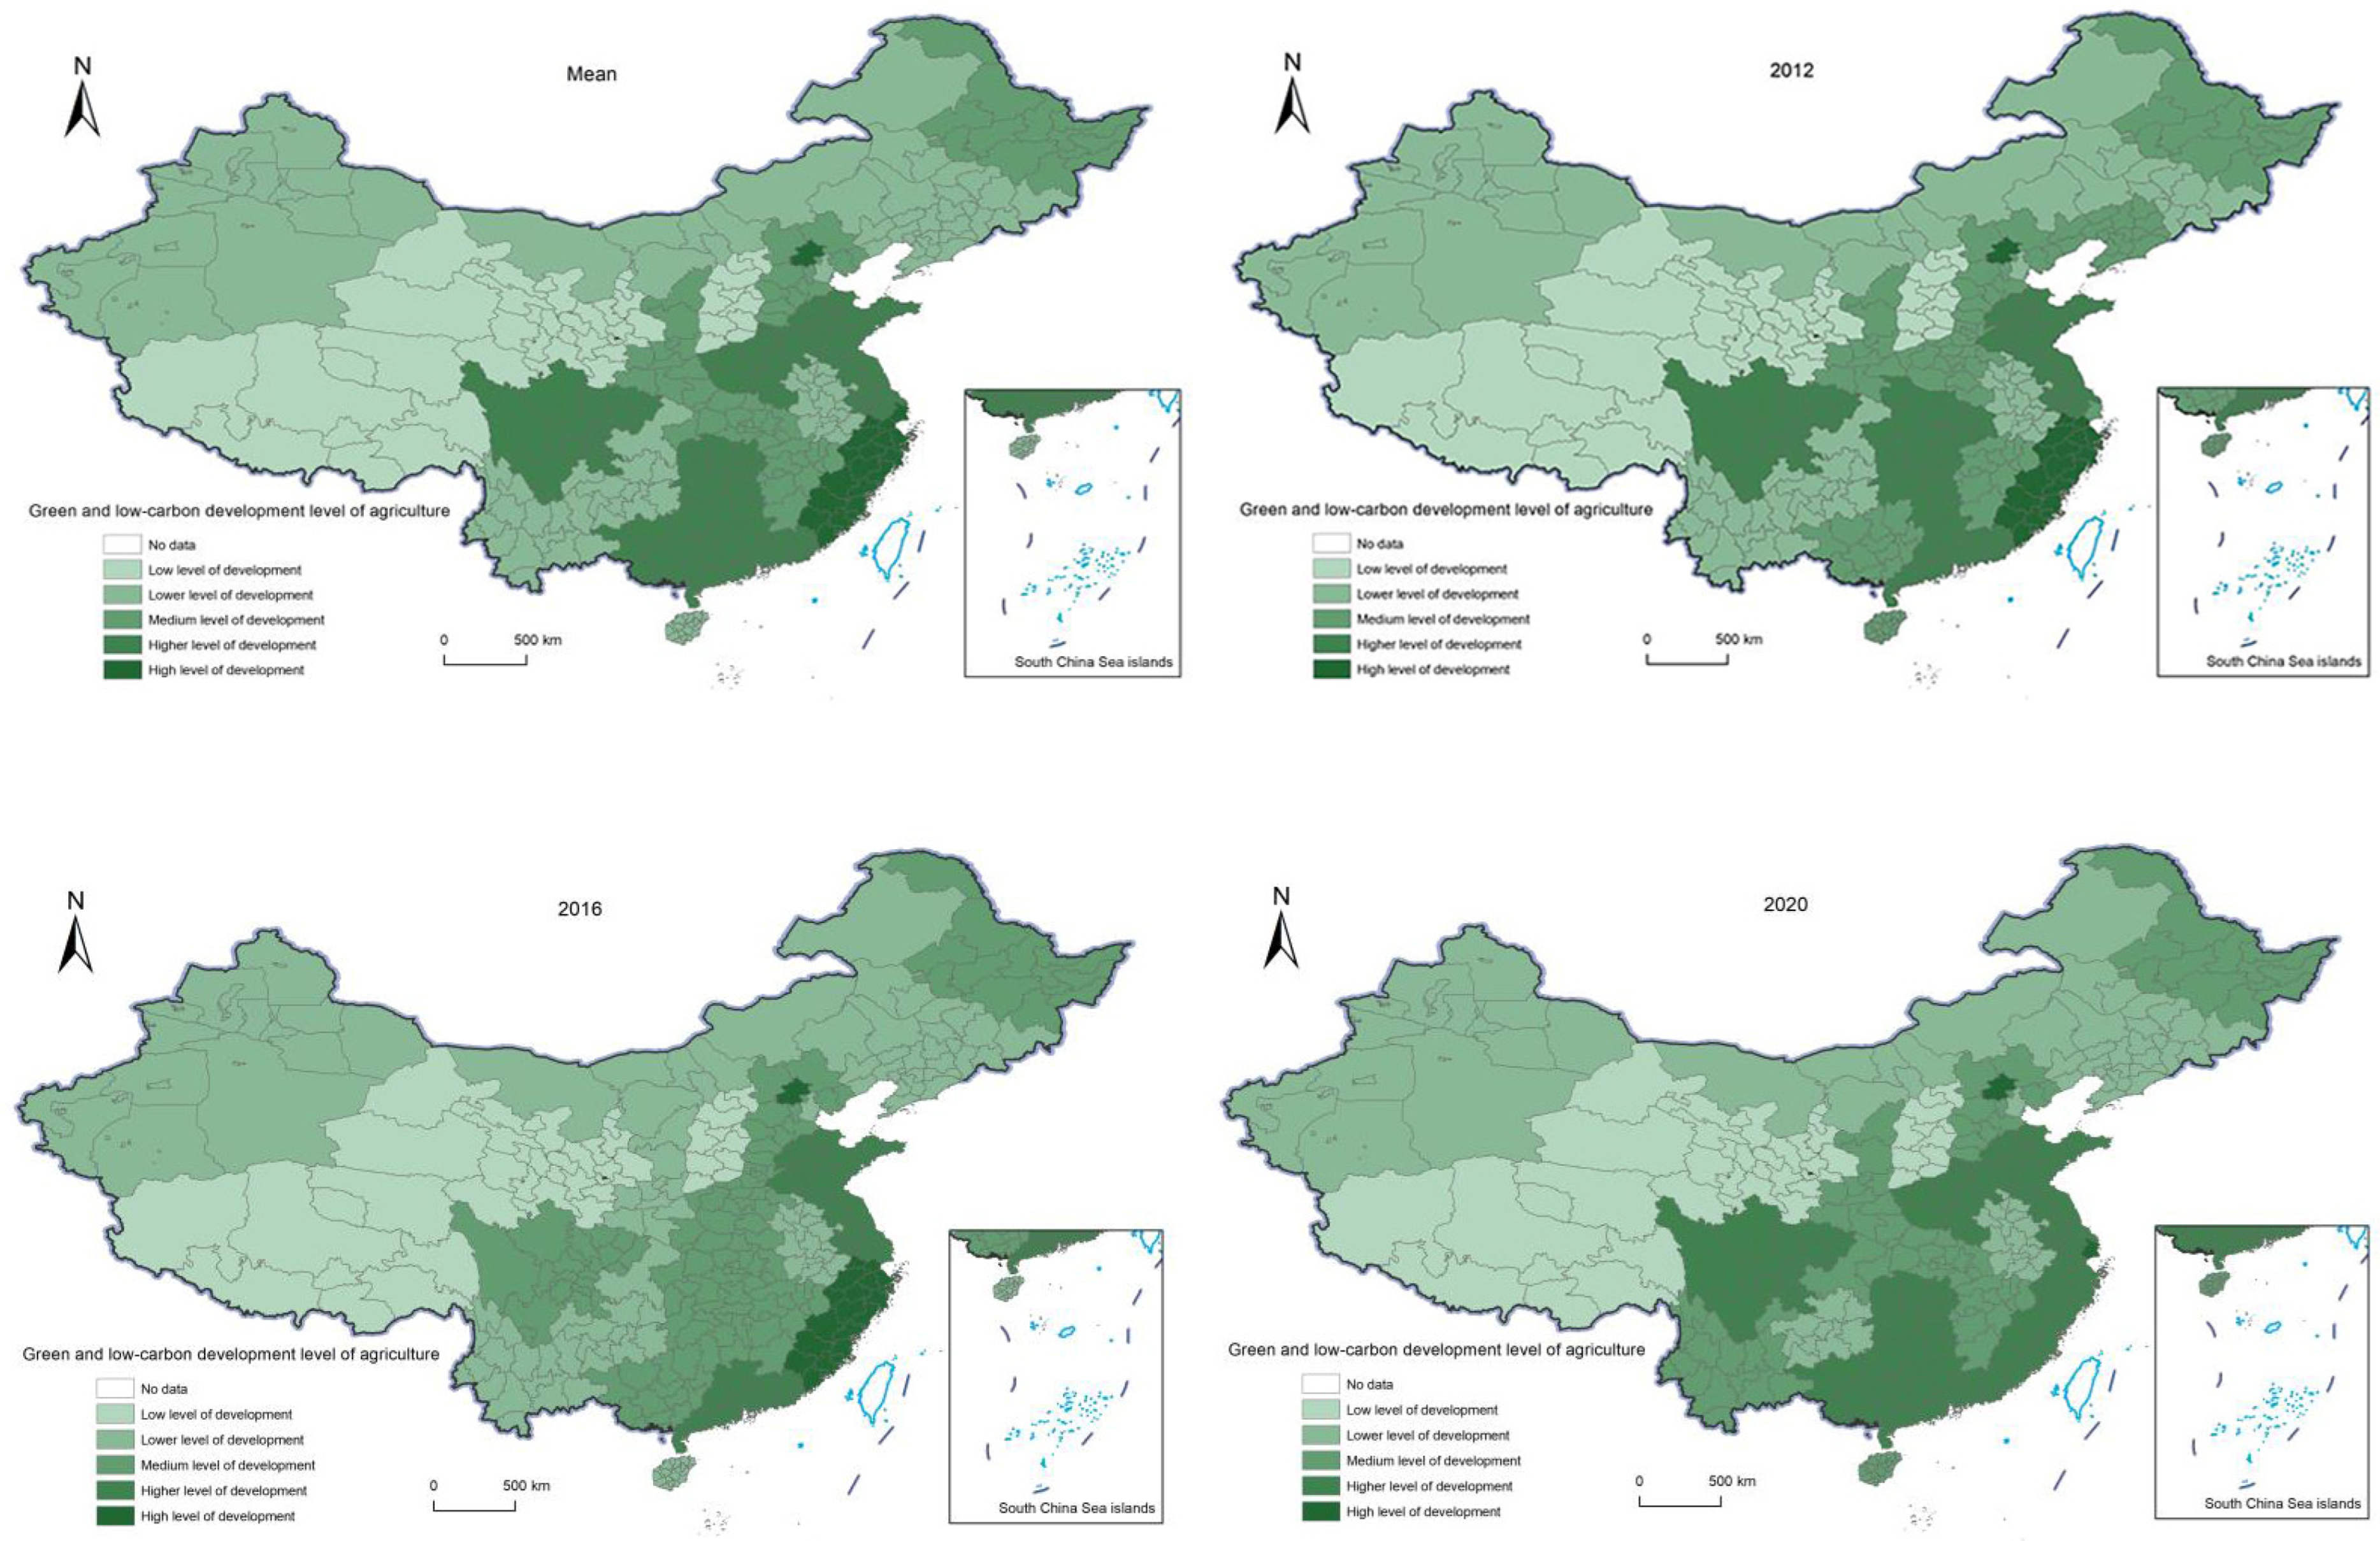
3.3. Analysis of the Measurement Results of Agricultural Green and Low-Carbon Development Level

Based on the constructed evaluation index system of agricultural green and low-carbon development levels, the calculation results of the entropy weight scores of each index are shown in Table 2. Overall, the weight of the environmental ecological indicator (0.413723) is the largest, indicating that the environment has an important impact on the green and low-carbon development of agriculture. The indicator weight of agricultural social and economic development (0.3003) is the second, which is also an important part of measuring the level of agricultural green production. Then, there is the weight of the resource utilization indicator (0.264072), which is not very different from the previous index. The weight of the green and low-carbon production indicator (0.021906) is the smallest. The possible reason for this is that the number of green food labels per unit area and the amount of carbon sequestered have small differences among different regions, so the impact is little. However, as an indicator of production and output, the green and low-carbon production index is still indispensable.
The score of the comprehensive indicators and the score of each index of the agricultural green and low-carbon development levels were obtained by means of the weight score of the entropy value, as shown in Table 3. According to the mean value, Beijing, Shanghai, Zhejiang, Fujian, Jiangsu, Guangdong, Shandong, Sichuan, Henan and Hunan ranked as the top 10, while Xinjiang, Jilin, Tianjin, Guizhou, Inner Mongolia, Shanxi, Ningxia, Gansu, Qinghai and Tibet ranked as the bottom 10, showing a certain gradient and level of green and low-carbon agricultural development. And most of the provinces in the front rank had better economic development, followed by regions with slower economic development. The average score of the green and low-carbon agricultural development level in Beijing was 0.290, while that of Xizang was only 0.078, reflecting the great differences in the green and low-carbon agricultural development levels among different provinces.
According to the development strategy of the country’s first rich region to drive the later rich region, the eastern region takes the lead in development, and then the eastern region is fed back to the central and western regions. However, after decades of development, there is still a gap between the eastern and central and western regions, and there is an imbalance in which the economies that are more developed and those that are less developed coexist. Therefore, this paper divides 31 provinces in China into eastern, central, western and northeastern regions and analyzes the changes in green and low-carbon agricultural development in four regions from 2011 to 2021. From Figure 1, it can be seen that the level of green and low-carbon development of agriculture in all regions has steadily increased over time, indicating that the green development advocated by China is steadily being implemented and has achieved initial results in recent years. The level of green and low-carbon agricultural development in the eastern region is steadily becoming higher than that in the central and western regions and the northern regions. The western region has the lowest level of green and low-carbon agricultural development. Possible reasons for this include: First, the economic development of the western region is relatively backward, and the response of the economically backward region to the policy is slow and its development mode is slow to change, so its agricultural green and low-carbon development level is low. Second, its resource utilization rate and production level are low, and there is no efficient production mode to provide the basis for the green and low-carbon development of agriculture, so its agricultural green and low-carbon development level is low.
In addition, this paper uses GIS visualization technology and the Jenks natural breakpoint classification method to divide the comprehensive index score from high to low into five types: low level of development, lower level of development, medium level of development, higher level of development and high level of development area. The comprehensive index was divided using the Jenks natural breakpoint classification method in ArcGIS software (https://www.esri.com/en-us/arcgis/about-arcgis/overview, accessed on 4 July 2023). Finally, the comprehensive spatial differentiation map of the mean value of green and low-carbon agricultural development in 31 provinces and the comprehensive spatial differentiation map of 2012, 2016 and 2020 were obtained.
As shown in Figure 2, from the perspective of mean distribution, the spatial difference of green and low-carbon development of agriculture is obvious and is mainly manifested in the increasing direction from southwest to southeast, with the north being generally lower than the south. The reason is that, in terms of topography, Tibet, Qinghai, Gansu, Ningxia and other regions belong to the plateau zone, their climate is relatively complex, agriculture is difficult to scale, and they do not have the cost advantage brought by resource endowments, such as agricultural scale. Culturally speaking, there are many ethnic minorities in these areas, and the implementation of policies is difficult. Although Xinjiang and the three northeastern provinces are not economically developed areas, their agricultural resources are abundant, the environment is suitable, and their agricultural scale is the core of the high level of green and low-carbon agricultural development. From the three time dimensions of 2012, 2016 and 2020, it can be seen that, with time, the level of green and low-carbon development of agriculture is increasing, but the basic situation of the region has not changed, and its development level is still increasing from southwest to southeast. The level of green and low-carbon agricultural development in the entire southeast region is constantly changing, but there is basically no change in other regions. The possible reason for this is that the southeastern provinces are in the core area of economic development and have been greatly affected by economic development in the past 10 years.

4. Variable Description and Model Setting

4.1. Data Sources and Description

The sample data from 31 provincial levels in China from 2011 to 2021 were selected in this paper. Data on digital financial inclusion came from the Digital Financial Inclusion Index (2011–2021), and data on the calculation and control variables of green and low-carbon agricultural development came from the official website of the National Bureau of Statistics of China, the China Statistical Yearbook and the China Rural Statistical Yearbook over these years. In the course of data processing, the missing data were searched for and completed in the regional Statistical Yearbook, and the interpolation method was not used to complete the missing data. Finally, 341 sample data were obtained, and the empirical samples in this paper are consistent.

4.2. Definition of Variables

4.2.1. Explained Variables

Green and low-carbon agricultural development (GLCA) is estimated according to the index system and method established in the previous paper.

4.2.2. Explanatory Variables

The Digital Financial Inclusion Index (DIF) is based on the relevant data of the Digital Inclusive Finance Index (2011–2021) compiled by the Digital Finance Research Center of Peking University. This paper draws on the methods of Guo Feng et al. [46] on the construction of a digital inclusive finance index and adopts the compilation index to describe the development status of digital inclusive finance in various provinces. Therefore, this paper chooses this set of indexes to measure the development status of digital inclusive finance in China.

4.2.3. Control Variables

(1)
Government environmental management input (HJ). Reflects the government’s investment in energy conservation and environmental protection and calculates the proportion of the expenditure on energy conservation and environmental protection in the local general public budget.
(2)
Urbanization level (CZ). In the process of urbanization, problems such as population loss and waste of land resources will also be raised. Therefore, the higher the level of urbanization, the more unfavorable the green and low-carbon development of agriculture will be. Urban population/total population was used for calculations.
(3)
Economic development level (GDPR). The higher the level of economic development in a region, the more inclined it is toward green and low-carbon agricultural development. Regional per capita GDP was used to measure the level of economic development.
(4)
State of agricultural infrastructure (NY). Agricultural infrastructure plays an important role in transforming traditional agriculture and realizing the green and low-carbon transformation of agriculture. The total power of agricultural machinery was selected to measure the situation of agricultural production infrastructure.

4.2.4. Intermediary Variables

The education level of the labor force (JY) refers to high-quality talents being one of the necessary conditions for the economic development of a region but also one of the key factors for the development of various industries. High-quality talents are also the core elements that promote scientific and technological innovation and the basic conditions for the green and low-carbon development of agriculture. In this paper, Cheng Qiuwang et al. [47] were referred to calculate the educational level of the labor force in each region by multiplying the proportion of the number of people at each education stage by the time taken for each, among which the years of education of primary school, junior high school, high school, college and above (including master’s and doctorate) are calculated as 6 years, 9 years, 12 years and 16 years, respectively.

4.3. Model Method

4.3.1. Spatial Metering Model

According to the needs of the actual research problems, the LM test, Husman test and LR test of the applicability of the model were carried out by referring to the research methods of [48]. The test results show that the spatial error model (SEM) with fixed effects is more suitable for this paper. Therefore, this paper constructs the following spatial error model:
Y it = α 0 + j = 1 n α j X itj + ε it
ε it = γ W ε it + μ it
μ i t ~ N ( 0 , σ 2 I )
In the above formula, footmarks i and t represent the observation years of each province and sample, respectively. Y is the dependent variable; Xj is a series of arguments; εit and μit are random error terms obeying a normal distribution; α0 is the intercept and αj is the coefficient; W is the space weight matrix. Due to the limitation of freedom in practical operation, the spatial weight matrix cannot be generated by the data or model, so geographical distance is used to represent it in this paper.

4.3.2. Mediation Effect Model

This paper aims to explore the mediating effect of labor education levels in promoting the green and low-carbon development of agriculture through digital inclusion finance. Therefore, the mediating effect model is constructed by referring to Wen Zhonglin’s [49] Analysis of the Mediating Effect: Methods and Model Development:
M i t = β 1 + j = 1 n μ j X i t j + ε i t ,   ( ε i t = γ W ε i t + μ i t )
Y i t = β 2 + β 3 M i t + j = 1 n δ j X i t j + ε i t ,   ( ε i t = γ W ε i t + μ i t )
In the above equation, M represents the intermediary variable, and the other settings are basically consistent with the spatial measurement model above. According to the stepwise test of the intermediary effect, the above spatial measurement model is tested first; if it is significant, the regression test of Equations (1) and (2) in the intermediary effect model is performed. When the coefficients of both the core explanatory variable in Equation (1) and the mediator variable in Equation (2) are significant, an indirect effect exists. Then, if the coefficient of the core explanatory variable in Equation (2) is significant, the direct effect is significant. Finally, if the product of the coefficient of the core explanatory variable in Equation (1) and the intermediary variable in Equation (2) has the same sign as the coefficient of the core explanatory variable in Equation (2), it indicates that the intermediary effect is significant. It can also disclose the proportion of the mediating effect to the total effect.

5. Empirical Analysis

5.1. Descriptive Statistics

The descriptive statistical analysis of each study variable is shown in Table 4. It can be seen in the table that the observed value of green and low-carbon agricultural development (GLCA) of the explanatory variable is 341, the minimum value is 0.0583, the maximum value is 0.591 and the standard deviation is 0.07. It can be seen that there is a certain gap between the level of green and low-carbon development of agriculture in different regions and different periods, which is related to the different economic and environmental development of different places, but on the whole, the differences are not particularly large. The minimum value of the education level of the labor force (JY) of the intermediary variable is 4.666 and the maximum value is 12.70, which shows that there are large differences in the quality of labor in different regions, which is related to the level of regional economic development. The standard deviation is 1.082. Although the value of the standard deviation is not particularly large, due to the small value of the education level of the labor force, this standard deviation has reflected a certain gap in the education level of the labor force among provinces, which may lead to the widening of the development gap between regions. The standard deviation of the digital financial inclusion index (DIF) is 103.4, the minimum value is 16.22 and the maximum value is 459, which shows that the development of digital financial inclusion varies greatly by region or year. In general, the observed values of the data in this paper are 314, the data gap is not large and there is strong stability.

5.2. Spatial Autocorrelation Test

For tests to determine whether there is a spatial correlation between regional variables, the spatial autocorrelation index Moran’s I, proposed by Moran, is generally used. The value range of Moran’s I is (−1,1). When it is greater than 0, it indicates that an economic variable between regions is spatially positively correlated; that is, there is spatial agglomeration. When it is less than 0, it indicates that an economic variable between regions is spatially negatively correlated, that is, there is spatial exclusion. When it is equal to 0, it indicates that the distribution of certain economic variables and locations between regions is independent of each other. A larger absolute value of Moran’s I indicates a stronger spatial correlation of the economic variables being tested. This paper conducted Moran’s I test for the low-carbon development of China’s agriculture from 2011 to 2021, and the test results are shown in Table 5. According to the test results, among the Moran’s I values in each year from 2011 to 2021, except for the significance at the 5% level in 2018, the other years passed the significance test at the 1% level, and all Moran’s I values were positive. This indicates that there is indeed an obvious positive autocorrelation in the spatial development of agricultural green and low-carbon development in provincial areas in China; that is, there is spatial agglomeration, and its correlation shows a trend of instability and increase year by year. From this, we can judge that it is more appropriate to use spatial econometric models to study the relationship between China’s transportation infrastructure level and total factor productivity growth than traditional measurement methods.

5.3. Baseline Regression

Before the spatial effect test, this paper first conducted an OLS regression to test whether digital inclusive finance and agricultural green and low-carbon development are related. The test results are listed in column (1) of the following table, Table 6, which shows that there is a significant positive relationship between digital inclusive finance and agricultural green and low-carbon development. This coincides with scholars’ academic research on digital inclusive finance to promote the green and low-carbon development of agriculture in terms of financial support [28], technological innovation [30] and green industrial system construction. Since the maximum likelihood value of the temporal fixed effect is better than that of other fixed effects, this paper selects the panel SEM model of the temporal fixed effect to empirically analyze the relationship between digital inclusive finance and agricultural green and low-carbon development, and the specific test results are shown in the following table. Firstly, column (2) in the table shows the regression before adding the control variable, and it can be seen from the regression results that the coefficient value is 0.179, which is significantly positive at the level of 1%, indicating that digital inclusive finance has a significant positive impact on the green and low-carbon development of agriculture. Column (3) shows the regression results after adding the control variable, giving the coefficient value 0.195, which is still markedly positive at the level of 1%, indicating that digital inclusive finance has a significant positive impact on the green and low-carbon development of agriculture. Secondly, the spatial coefficient (lambda) of the model is greater than 0, and the significance test of 1% is passed, indicating that there is a positive spatial spillover effect; that is, the improvement of the green and low-carbon development level of agriculture in one region will have a driving effect on neighboring areas. In other words, the development of digital inclusive finance has led to the green and low-carbon development of agriculture in a region, which will have a diffusion effect and promote the green and low-carbon development of agriculture in surrounding areas. This is based on spatial findings. The reason may be that the development of digital inclusive finance has improved the financial literacy of farmers, alleviated the digital divide and promoted innovative development in the market, stimulating the vitality of the rural market. Overall, farmers’ ecological awareness has improved [39] and agricultural and rural markets have developed greenly, thereby increasing the level of green and low-carbon development in agriculture.

5.4. Robustness Test

This paper conducted a robustness test from two aspects. First, the test of municipalities directly under the central government is excluded, and the four municipalities of Beijing, Tianjin, Shanghai and Chongqing are excluded for the regression results in column (1) as shown in Table 7. The results indicate that its coefficient is significantly positive at the level of 1%, consistent with the previous results. Then, the space matrix was replaced by the space adjacency matrix to check. According to the setting method commonly used in current international and domestic literature, this paper uses the first-order adjacency function matrix of distance to represent; that is, assigning 1 to adjacent regions and 0 to non-adjacent regions [50]. The test results are shown in column (2) and have a coefficient of 0.121, still at the level of 1%. Digital inclusive finance has a remarkably positive impact on the green and low-carbon development of agriculture, indicating that the research conclusions of this paper are relatively robust.

6. Further Analysis

6.1. Mediation Mechanism Test

This section mainly verifies the mediating effect of labor education level. The following table (1) shows the test of benchmark regression, with the regression result significant at the 1% confidence level. Further testing the models (1) and (2) through the regression test gave the results shown in columns (2) and (3) of Table 8. The results show that the coefficient of the core explanatory variable is 3.176, which is significant at the significance level of 1%, and β3 is 0.021, which is significant at the level of 1%, so the next judgment can be made. Both are significant, and the indirect effect can be judged to be significant. It was further found that 3.176 × 0.021 is the same as 0.132, and it can be found that its mediating effect is true, and hypothesis 2 is verified. The mediation effect accounted for 34.2% of the total effect, indicating that the education level of the labor force played an intermediary role in the promotion of the green and low-carbon development of agriculture by digital inclusive finance. In order to strengthen the verification results, bootstrapping was used to test its mediating effect, and it was found that, under a 95% confidence interval, the direct and indirect effects were (0.009235, 0.0195151) and (0.0239914, 0.0386581), respectively, and neither of them contained 0. This indicated that the mediating effect was significant; that is, the education level of the labor force had an intermediating effect on the green and low-carbon development of agriculture promoted by digital inclusive finance. In the past, scholars seldom studied the educational level of the labor force. The reason is that the development of digital inclusive finance can practically promote the availability of financial services and financial products for residents, alleviate credit constraints and the digital divide, and thus promote household investment in education and alleviate the phenomenon of educational inequity [41,42]. The education level of the labor force has improved, and the development of modern agriculture has been promoted. The quality of agricultural production has improved, agricultural industrialization has developed, and so the level of green and low-carbon development in agriculture has improved.

6.2. Analysis of Regional Heterogeneity

Considering the different geographical locations, climatic conditions, soil environment and other characteristics of different regions in China, there are also great differences in the green and low-carbon development of agriculture. The different regions of China were divided into the eastern, central, western and northeastern regions, and the fixed-effect model was again used for econometric analysis. The results are shown in Table 9. From the analysis results, all three regions had significant impacts, with the eastern, central and western regions showing positive influences and the northeast region showing as negative and not significant. The impact of digital financial inclusion on the green and low-carbon development of agriculture in the central region is more significant and deeper. In terms of the absolute values of the regression coefficients, the central region > the eastern region > the western region > the northeastern region. This may be because the main grain-producing areas in the country are mainly distributed in the central region, and its agricultural modernization development is relatively mature and large-scale [51]. Moreover, there is a passive spatial spillover effect in the central region; that is, there is a siphon effect on the green and low-carbon development of agriculture in one region, so the impact of digital inclusive finance on the green development of agriculture in the region is deeper. Most of the entire eastern region belongs to coastal cities. Following the tide of the times, the economy is more developed, the impact of digital financial inclusion is more far-reaching, and the spread is more rapid, so its impact on the green and low-carbon development of agriculture is deeper.

7. Conclusions and Policy Implications

7.1. Conclusions

Based on the inter-provincial panel data of 31 provinces in China from 2011 to 2021, this paper measured the level of green and low-carbon development of agriculture, constructed a spatial econometric model, and explored the influence effect and transmission mechanism of digital financial inclusion on the level of green and low-carbon development of agriculture. The results are as follows:
First, the level of green and low-carbon agricultural development in various regions has increased with time. The level of green and low-carbon agricultural development in different provinces showed a gradient decline, followed by the eastern, central, northeastern and western regions. The spatial differences in the green and low-carbon development of agriculture are obvious, mainly manifested in the increasing direction from southwest to southeast, and the north is generally lower than that of the south.
Second, digital financial inclusion can effectually promote the green and low-carbon development of agriculture. Moreover, the impact of digital financial inclusion on the green and low-carbon development of agriculture has a positive spatial spillover effect.
Third, the education level of the labor force plays an intermediary role in the promotion of green and low-carbon development of agriculture by digital inclusive finance; that is, digital inclusive finance promotes the improvement of the level of green and low-carbon development of agriculture by improving the education level of the labor force.
Fourth, the impact of digital financial inclusion on the green and low-carbon development of agriculture in different regions is different, with the central region having the deepest impact, followed by the eastern region. The impact of digital financial inclusion on the green and low-carbon development level of agriculture in the northeast region is not significant.

7.2. Policy Implications

Based on the above conclusions, this paper draws the following policy implications:
First of all, we should strengthen the orientation of agricultural green production, standardize agricultural green ecological standards and improve policies for the promotion and application of agricultural green and low-carbon technologies, expand the institutional guarantee of the agricultural green and low-carbon industrial chain and its integrated development, and coordinate the development of regional agricultural green industries.
Secondly, we should grasp the direction of the development of the digital economy, make good use of the technical “dividend” period in the process of digital inclusive financial services sinking into rural areas, actively promote the construction of rural digital infrastructure, improve the digital level and social service capabilities of rural areas, and use digital technology to drive agricultural and rural development.
And then, we should pay attention to the education level of agricultural laborers in the process of promoting agricultural development, further accelerate the construction of rural basic education and the technical training of farmers and focus on popularizing high school education to improve the cultural quality of farmers and continuously develop modern agriculture.
Finally, in the process of digitization, each region should take notice of the problem of unbalanced development, make corresponding policies according to the economic conditions and agricultural development of different regions and adjust them timely.

Author Contributions

Conceptualization, Y.L. and Y.D.; methodology, B.P.; software, Y.D.; validation, Y.L., Y.D. and B.P.; formal analysis, Y.L.; resources, Y.L.; data curation, Y.D.; writing—original draft preparation, Y.D. and B.P.; writing—review and editing, Y.L.; visualization, Y.L. and Y.D.; supervision, Y.L.; project administration, Y.L. All authors have read and agreed to the published version of the manuscript.

Funding

This research was funded by Sichuan Province Regional and National Key Research Base-German Research Center of Sichuan Agricultural University Construction Project (Grant No. ZDF2201).

Institutional Review Board Statement

Not applicable.

Data Availability Statement

The datasets used or analyzed during the current research are available from the corresponding author upon reasonable request.

Acknowledgments

The authors would like to thank the editors and two anonymous reviewers for their constructive suggestions.

Conflicts of Interest

The authors declare no conflict of interest.

References

  1. Yu, Z.; Gong, Y.; Zheng, S. Agricultural and rural carbon neutrality in China: Theoretical Logic, Practical Path and Policy Orientation. Econ. Restruct. 2022, 6, 74–81. Available online: https://kns.cnki.net/kcms/detail/detail.aspx?dbname=DKFX2022&filename=JJTG202206010&dbcode=DKFX (accessed on 10 March 2023).
  2. Zhu, J.; Pang, W. The impact of digital economy development on ecological welfare performance. Stat. Decis. 2022, 38, 79–83. Available online: https://kns.cnki.net/kcms/detail/detail.aspx?dbname=DKFX2022&filename=TJJC202224015&dbcode=DKFX (accessed on 4 April 2023).
  3. Shkodra, J.; Shkodra, L. Impact of Agricultural Finance in Rural Areas—Case Study Kosovo. Bulg. J. Agric. Sci. 2018, 24, 737–741. Available online: https://www.researchgate.net/publication/328749101 (accessed on 13 April 2023).
  4. Li, Z.; Tuerxun, M.; Cao, J.; Fan, M.; Yang, C. Does Inclusive Finance Improve Income: A Study in Rural Areas. Aims Math. 2022, 7, 20909–20929. [Google Scholar] [CrossRef]
  5. Aziz, A.; Naima, U. Rethinking Digital Financial Inclusion: Evidence from Bangladesh. Technol. Soc. 2020, 64, 101509. [Google Scholar] [CrossRef]
  6. Ding, X.; Gao, L.; Wang, G.; Nie, Y. Can the Development of Digital Financial Inclusion Curb Carbon Emissions? Empirical Test From Spatial Perspective. Front. Environ. Sci. 2022, 10, 2093. [Google Scholar] [CrossRef]
  7. Wang, Y.; Yao, Y.; Li, J. Digital finance and carbon emissions: Research based on micro data and machine learning models. China’s Popul. Resour. Environ. 2022, 32, 1–11. Available online: https://kns.cnki.net/kcms/detail/detail.aspx?dbname=CJFD2022&filename=ZGRZ202206001&dbcode=CJFD (accessed on 7 April 2023).
  8. Fang, F.; Zhao, J.; Di, J.; Zhang, L. Spatial Correlations and Driving Mechanisms of Low-carbon Agricultural Development in China. Front. Environ. Sci. 2022, 10, 1014652. [Google Scholar] [CrossRef]
  9. Zhu, Y. Research on the Impact of Digital Inclusive Finance on High-Quality Economic Development. Front. Bus. Econ. Manag. 2022, 4, 38–43. [Google Scholar] [CrossRef]
  10. Tang, M.; Lee, C.-C.; Lee, C.-C. Reaping digital dividends: Digital inclusive finance and high-quality development of enterprises in China. Telecommun. Policy 2022, 47, 102484. [Google Scholar] [CrossRef]
  11. Liang, M. Research on the Impact of Chinese Digital Inclusive Finance on Industrial Structure Upgrade—Based on Spatial Dubin Model. Open J. Stat. 2020, 10, 863–871. [Google Scholar] [CrossRef]
  12. Li, F.; Wu, Y.; Liu, J.; Zhong, S. Does Digital Inclusive Finance Promote Industrial Transformation? New Evidence From 115 Resource-based Cities in China. PLoS ONE 2022, 17, e0273680. [Google Scholar] [CrossRef] [PubMed]
  13. Ge, H.; Li, B.; Tang, D.; Xu, H.; Boamah, V. Research on Digital Inclusive Finance Promoting the Integration of Rural Three-Industry. Int. J. Environ. Res. Public Health 2022, 19, 3363. [Google Scholar] [CrossRef] [PubMed]
  14. Li, Q.; Liu, Q. Impact of Digital Financial Inclusion on Residents’ Income and Income Structure. Sustainability 2023, 15, 2196. [Google Scholar] [CrossRef]
  15. Zou, F.; Li, T.; Zhou, F. Does the Level of Financial Cognition Affect the Income of Rural Households? Based on the Moderating Effect of the Digital Financial Inclusion Index. Agronomy 2021, 11, 1813. [Google Scholar] [CrossRef]
  16. Shen, J.; Zhu, Q.; Jiao, X.; Ying, H.; Wang, H.; Wen, X.; Xu, W.; Li, T.; Cong, W.; Liu, X.; et al. Agriculture Green Development:a model for China and the world. Front. Agr. Sci. Eng. 2020, 7, 5–13. [Google Scholar] [CrossRef]
  17. Zhang, F.; Wang, F.; Hao, R.; Wu, L. Agricultural Science and Technology Innovation, Spatial Spillover and Agricultural Green Development—Taking30 Provinces in China as the Research Object. Appl. Sci. 2022, 12, 845. [Google Scholar] [CrossRef]
  18. He, K.; Li, F.; Zhang, J.; Li, X. Analysis of agricultural green development level and regional difference in the Yangtze River Economic Belt. J. Huazhong Agric. Univ. 2021, 40, 43–51. Available online: https://kns.cnki.net/kcms/detail/detail.aspx?dbname=CJFD2021&filename=HZNY202103007&dbcode=CJFD (accessed on 7 April 2023).
  19. Jin, S. Evaluation of green agricultural development level and regional difference between provinces in China. Seek 2019, 2, 89–95. Available online: https://kns.cnki.net/kcms/detail/detail.aspx?dbname=CJFD2019&filename=QSZZ201902012&dbcode=CJFD (accessed on 7 April 2023).
  20. Liu, L.; Zhu, Y.; Guo, S. The Evolutionary Game Analysis of Multiple Stakeholders in the Low-Carbon Agricultural Innovation Diffusion. Hindawi 2020, 2020, 1–12. [Google Scholar] [CrossRef]
  21. van Veelen, B. Cash cows? Configuring low-carbon agriculture through green finance. Geoforum 2021, 118, 130–139. [Google Scholar] [CrossRef]
  22. Hou, D.; Wang, X. Inhibition Or Promotion?—The Effect of Agricultural Insurance on Agricultural Green Development. Front. Public Health 2022, 10, 910534. [Google Scholar] [CrossRef] [PubMed]
  23. Dai, X.; Chen, Y.; Zhang, C.; He, Y.; Li, J. Technological Revolution in the Field: Green Development of Chinese Agriculture Driven By Digital Information Technology(dit). Agriculture 2023, 13, 199. [Google Scholar] [CrossRef]
  24. Luo, J.; Huang, M.; Bai, Y. Promoting Green Development of Agriculture Based on Low-carbon Policies and Green Preferences: An Evolutionary Game Analysis. Environ. Dev. Sustain. 2023, 2023, 28. [Google Scholar] [CrossRef]
  25. Norse, D. Low Carbon Agriculture: Objectives and Policy Pathways. Environ. Dev. 2011, 1, 25–39. [Google Scholar] [CrossRef]
  26. Hou, J.; Hou, B. Agricultural Science and Technology Innovation, Spatial Spillover and Agricultural Green Development—Taking 30 Provinces in China as the Research Object. Sustainability 2019, 11, 1399. [Google Scholar] [CrossRef]
  27. Ji, H.; Hoti, A. Green Economy Based Perspective of Low-carbon Agriculture Growth for Total Factor Energy Efficiency Improvement. Int. J. Syst. Assur. Eng. Manag. 2021, 13, 353–363. [Google Scholar] [CrossRef]
  28. Liu, G.; Huang, Y.; Huang, Z. Determinants and Mechanisms of Digital Financial Inclusion Development: Based on Urban-Rural Differences. Agronomy 2021, 11, 1833. [Google Scholar] [CrossRef]
  29. Ma, J.; Li, Z. Does Digital Financial Inclusion Affect Agricultural Eco-Efficiency? A Case Study on China. Agronomy 2021, 11, 1949. [Google Scholar] [CrossRef]
  30. Zhu, J.; Li, Z. Can Digital Financial Inclusion Effectively Stimulate Technological Innovation of Agricultural Enterprises?—A Case Study on China. Natl. Account. Rev. 2021, 3, 398–421. [Google Scholar] [CrossRef]
  31. Zhou, Z.; Zhang, Y.; Yan, Z. Will Digital Financial Inclusion Increase Chinese Farmers’ Willingness to Adopt Agricultural Technology? Agriculture 2022, 12, 1514. [Google Scholar] [CrossRef]
  32. Guo, Q.; Wu, Z.; Ding, C.; Akbar, M.W.; Guo, T. An Empirical Analysis of the Nexus Between Digital Financial Inclusion, Industrial Structure Distortion, and China’s Energy Intensity. Environ. Sci. Pollut. Res. 2023, 30, 49397–49411. [Google Scholar] [CrossRef] [PubMed]
  33. Hong, M.; Tian, M.; Wang, J. Digital Inclusive Finance, Agricultural Industrial Structure Optimization and Agricultural Green Total Factor Productivity. Sustainability 2022, 14, 11450. [Google Scholar] [CrossRef]
  34. Brown, J.R.; Martinsson, G.; Petersen, B.C. Petersen Do Financing Constraints Matter for R&D? Eur. Econ. Rev. 2012, 56, 1512–1529. [Google Scholar] [CrossRef]
  35. Sasidharan, S.; Lukose, P.J.; Komera, S. Financing Constraints and Investments in R&D: Evidence from Indian Manufacturing Firms. Q. Rev. Econ. Financ. 2015, 55, 28–39. [Google Scholar] [CrossRef]
  36. Jing, H.; Cai, X.; Zhao, Y. Financial penetration, financial acquisition and agricultural industrialization: Evidence from 87 counties in Hunan Province. Financ. Theory Pract. 2021, 42, 12–19. Available online: https://kns.cnki.net/kcms/detail/detail.aspx?dbname=CJFD2021&filename=CLSJ202102002&dbcode=CJFD (accessed on 12 April 2023).
  37. Gong, Q.; Li, X. Construction and measurement of agricultural green development index: 2005–2018. Reformation 2020, 1, 311. [Google Scholar]
  38. Li, Y.; Wang, M.; Liao, G.; Wang, J. Spatial Spillover Effect and Threshold Effect of Digital Financial Inclusion on Farmers’ Income Growth—Based on Provincial Data of China. Sustainability 2022, 14, 1838. [Google Scholar] [CrossRef]
  39. Yang, X.N.; Zhang, M. Reflections on the Promotion of Farmers’ Ecological Consciousness at This Stage. Adv. Soc. Sci. Educ. Humanit. Res. 2021, 543, 138–142. Available online: http://creativecommons.org/licenses/by-nc/4.0/ (accessed on 7 April 2023).
  40. Zhou, Y.; Cui, Y. Analysis on the correlation between education and employment of rural labor force and family income. Chin. Rural. Econ. 2001, 4, 60–67. Available online: https://kns.cnki.net/kcms/detail/detail.aspx?dbname=cjfd2001&filename=ZNJJ200104011&dbcode=cjfd (accessed on 7 April 2023).
  41. Chen, W.; Cheng, Z.; Cai, Q. Educational Equity from the Perspective of Family Educational Expectations: The Mitigating effect of Digital financial Inclusion on non-self-induced family Factors. Educ. Res. 2021, 42, 122–137. Available online: https://kns.cnki.net/kcms/detail/detail.aspx?dbname=CJFD2021&filename=JYYJ202110013&dbcode=CJFD (accessed on 12 May 2023).
  42. Li, H.; Zhang, S.; Gong, M. Analysis of the impact of digital inclusive finance on family education investment. Credit. Investig. 2022, 40, 74–80. Available online: https://kns.cnki.net/kcms/detail/detail.aspx?dbname=CJFD2022&filename=HNJG202207011&dbcode=CJFD (accessed on 12 May 2023).
  43. Xiang, X. Research on the Correlation between Agricultural Labor Force Upgrading and Farmland Scale and Farmland Quality Optimization. Master’s Thesis, Northwest A&F University, Xianyang, China, 2019. Available online: https://kns.cnki.net/kcms/detail/detail.aspx?dbname=CMFD2019&filename=1019844968.nh&dbcode=CMFD (accessed on 12 May 2023).
  44. Li, M. The six departments jointly issued the 14th Five-Year National Plan for Green Agricultural Development. Chin. Aquat. Prod. 2021, 10, 12–14. Available online: https://kns.cnki.net/kcms/detail/detail.aspx?dbname=CJFD2021&filename=SICA202110005&dbcode=CJFD (accessed on 10 March 2023).
  45. Wang, F.; Mao, A.; Li, H.; Jia, M. Quality measurement and spatial difference analysis of urbanization in Shandong Province based on entropy method. Geogr. Sci. 2013, 33, 1323–1329. Available online: https://kns.cnki.net/kcms/detail/detail.aspx?dbname=CJFD2013&filename=DLKX201311006&dbcode=CJFD (accessed on 7 April 2023).
  46. Guo, F.; Wang, J.; Wang, F.; Kong, T.; Zhang, X.; Cheng, Z. Measuring the development of digital inclusive finance in China: Index compilation and spatial characteristics. Economics (Quarterly) 2020, 19, 1401–1418. Available online: https://kns.cnki.net/kcms/detail/detail.aspx?dbname=CJFD2020&filename=JJXU202004013&dbcode=CJFD (accessed on 7 April 2023).
  47. Cheng, Q.; Xu, A.; Chen, Q. The realization path of agricultural carbon emission reduction under the background of “dual carbon” target: Verification based on digital financial inclusion. J. Southwest Univ. Natl. Humanit. Soc. Sci. Ed. 2022, 43, 115–126. Available online: https://kns.cnki.net/kcms/detail/detail.aspx?dbname=CJFD2022&filename=XNZS202202014&dbcode=CJFD (accessed on 7 April 2023).
  48. Elhors, J.P. Spatial Econometrics from Cross-Sectional Data to Spatial Panels; Springer: Berlin/Heidelberg, Germany, 2014; Available online: http://www.springer.com/series/10096 (accessed on 7 April 2023).
  49. Wen, Z.; Ye, B. Mediation effect analysis: Methodology and model development. Adv. Psychol. Sci. 2014, 22, 731–745. Available online: https://kns.cnki.net/kcms/detail/detail.aspx?dbname=CJFD2014&filename=XLXD201405001&dbcode=CJFD (accessed on 7 April 2023). [CrossRef]
  50. James, P.L. The Theory and Practice of Spatial Econometrics; ResearchGat; University of Toledo: Toledo, OH, USA, 1999; Available online: https://www.researchgate.net/publication/266218273 (accessed on 7 April 2023).
  51. Li, W.; Zhang, P. Study on the coupling and coordination of digital economy and high-quality agricultural development in the main grain producing areas of the Yellow River Basin. Gansu J. Sci. 2023, 35, 121–126. [Google Scholar] [CrossRef]
Figure 1. Results of regional heterogeneous agricultural green and low-carbon development.
Agriculture 13 01748 g001
Figure 2. Comprehensive horizontal spatial differentiation diagram.
Agriculture 13 01748 g002
Table 1. Index system for measuring the level of green and low-carbon agricultural development in China.
First-Order IndexSecondary IndexIndicator MeaningUnitAttribute
Agricultural social and economic developmentGross agricultural product Hundred million CNYPositive
Per capita net income of farmers CNY/personPositive
Land yield rateTotal agricultural output value/cultivated land areaT10000/hm2Positive
Resource utilizationMultiple cropping index of cultivated landSown area/cultivated area of main crops%Negative
Water-saving irrigationWater-saving irrigation area/arable area%Positive
Grain output per unit areaGrain yield/area sown to grain cropskg/hm2Positive
Environmental ecologyForest coverage rateForest area/total land area%Positive
Intensity of pesticide useUsage/arable areakg/hm2Negative
Fertilizer application intensityConversion amount/arable areakg/hm2Negative
Agricultural film use intensityUsage/arable areakg/hm2Negative
Green and low-carbon productionNumber of green food label products per unit areaQuantity/area of arable land Positive
Carbon sequestration of crops per unit of cultivated land area(Sown area of crops × Average annual carbon sequestration coefficient of crops)/actual cultivated land area at the end of the yeart/hm2Positive
Table 2. Weight table of indicator system.
First-Order
Indicator
Secondary IndicatorWeightFirst-Order
Indicator
Secondary IndicatorWeight
Agricultural
social and
economic
development
Gross agricultural product0.12424Environmental ecologyForest coverage0.374385
Per capita net income of farmers0.078458Intensity of pesticide use0.035781
Land yield rate0.097602Fertilizer application intensity0.001825
Resource
utilization
Multiple cropping index of cultivated land0.140359Agricultural film use intensity0.001732
Water-saving irrigation0.034808Green and low-carbon productionNumber of green food label products per unit area0.016308
Grain output per unit area0.088905Carbon sequestration of crops per unit of cultivated land area0.005598
Table 3. Measurement results of green and low-carbon agricultural development in 31 provinces of China from 2011 to 2021.
Province20112012201320142015201620172018201920202021Mean
Beijing0.233 0.244 0.231 0.236 0.246 0.253 0.253 0.263 0.408 0.394 0.428 0.290
Tianjin0.122 0.129 0.118 0.128 0.136 0.142 0.151 0.158 0.182 0.191 0.205 0.151
Hebei 0.157 0.168 0.178 0.183 0.185 0.188 0.195 0.204 0.213 0.224 0.235 0.194
Shanxi0.084 0.087 0.092 0.102 0.102 0.104 0.105 0.113 0.119 0.130 0.142 0.107
Inner
Mongolia
0.111 0.112 0.116 0.124 0.128 0.130 0.133 0.142 0.144 0.149 0.158 0.132
Liaoning0.146 0.152 0.157 0.152 0.167 0.169 0.174 0.177 0.187 0.193 0.204 0.171
Ji Lin0.134 0.142 0.147 0.151 0.155 0.156 0.158 0.156 0.162 0.168 0.176 0.155
Heilongjiang 0.157 0.167 0.177 0.185 0.188 0.191 0.200 0.207 0.211 0.219 0.225 0.193
Shanghai0.155 0.165 0.181 0.198 0.207 0.216 0.222 0.288 0.425 0.524 0.591 0.288
Jiangsu 0.174 0.191 0.197 0.209 0.224 0.225 0.236 0.245 0.268 0.282 0.309 0.233
Zhejiang0.226 0.232 0.234 0.246 0.251 0.256 0.262 0.287 0.320 0.330 0.367 0.274
Anhui 0.136 0.145 0.139 0.151 0.157 0.160 0.169 0.176 0.188 0.197 0.207 0.166
Fujian 0.208 0.217 0.221 0.233 0.235 0.242 0.249 0.274 0.304 0.319 0.342 0.259
Jiangxi0.168 0.173 0.176 0.184 0.193 0.198 0.202 0.210 0.218 0.226 0.238 0.199
Shandong 0.178 0.186 0.201 0.214 0.221 0.218 0.224 0.235 0.256 0.267 0.288 0.226
Henan0.164 0.174 0.178 0.192 0.200 0.202 0.209 0.222 0.241 0.264 0.277 0.211
Hubei 0.175 0.185 0.175 0.183 0.189 0.192 0.200 0.205 0.219 0.225 0.241 0.199
Hunan0.176 0.184 0.182 0.192 0.195 0.202 0.209 0.216 0.238 0.255 0.270 0.211
Guangdong0.179 0.190 0.196 0.207 0.214 0.224 0.229 0.241 0.275 0.267 0.281 0.228
Guangxi0.163 0.169 0.175 0.189 0.195 0.203 0.210 0.223 0.242 0.252 0.271 0.208
Hainan0.150 0.160 0.141 0.153 0.157 0.166 0.170 0.197 0.200 0.207 0.218 0.174
Chongqing0.121 0.125 0.131 0.144 0.151 0.159 0.163 0.180 0.204 0.227 0.247 0.168
Sichuan0.176 0.188 0.174 0.186 0.196 0.208 0.218 0.225 0.246 0.257 0.272 0.213
Guizhou0.112 0.106 0.107 0.129 0.142 0.147 0.154 0.162 0.175 0.185 0.197 0.147
Yunnan0.130 0.139 0.146 0.161 0.164 0.170 0.175 0.186 0.206 0.211 0.229 0.174
Tibet0.066 0.070 0.071 0.074 0.071 0.072 0.080 0.072 0.088 0.093 0.103 0.078
Shaanxi0.142 0.150 0.145 0.154 0.158 0.163 0.168 0.416 0.194 0.208 0.221 0.193
Gansu 0.065 0.071 0.071 0.076 0.081 0.082 0.088 0.096 0.104 0.110 0.118 0.087
Qinghai0.058 0.063 0.062 0.068 0.073 0.075 0.079 0.090 0.092 0.097 0.110 0.079
Ningxia0.079 0.080 0.075 0.086 0.090 0.096 0.100 0.106 0.114 0.120 0.124 0.097
Xinjiang0.135 0.136 0.140 0.150 0.157 0.157 0.163 0.173 0.165 0.175 0.192 0.158
Table 4. Descriptive statistics.
VariableNMeanSdMinMax
GLCA3410.1830.0700.05830.591
DIF341230.5103.416.22459.0
JY3419.2311.0824.66612.70
NY3417.6401.1304.5439.499
GDPR3415.5672.8771.60218.75
CZ3410.5860.1310.2270.896
HJ3140.0290.0090.0120.068
Table 5. Moran’s I spatial autocorrelation test results of green and low-carbon agricultural development in all regions of China from 2011 to 2021.
YearIYearI
20110.222 (2.781) ***20170.265 (3.223) ***
20120.222 (2.761) ***20180.130 (1.832) **
20130.228 (2.816) ***20190.235 (2.977) ***
20140.252 (3.080) ***20200.248 (3.244) ***
20150.251 (3.080) ***20210.255 (3.382) ***
20160.254 (3.115) ***
*** p < 0.01, ** p < 0.05.
Table 6. Baseline regression results table.
Variables(1)(2)(3)
OLSSEMSEM
lnDIF0.036 ***0.179 ***0.195 ***
(12.030)(10.44)(10.68)
CZ0.022 0.052
(0.740) (1.44)
NY−0.040 *** 0.008 ***
(−2.884) (3.25)
HJ−0.377 * −0.157
(−1.658) (−0.54)
GDPR−0.001 −0.002
(−0.583) (−1.41)
Constant0.306 ***
(2.833)
Observations341341341
lambda 0.364 ***0.384 ***
(4.54)(4.74)
R-squared0.3310.2170.213
*** p < 0.01, * p < 0.1, standard error in parentheses.
Table 7. Robustness test results.
Variables(1)(2)
lnDIF0.067 ***0.200 ***
(3.79)(10.66)
CZ0.0250.048
(0.68)(1.36)
NY0.000 ***0.010 ***
(7.11)(3.73)
HJ−0.639 ***−0.055
(−4.39)(−0.19)
GDPR0.013 ***−0.002
(7.19)(−1.38)
Observations297341
lambda0.572 ***0.380 ***
(6.67)(5.84)
R-squared0.4970.213
*** p < 0.01, standard error in parentheses.
Table 8. Test results of mediating effect.
Variables(1)(2)(3)
GLCAJYGLCA
lnDIF0.195 ***3.176 ***0.132 ***
(10.68)(10.59)(6.93)
JY 0.021 ***
(6.79)
CZ0.0520.6300.027
(1.44)(1.16)(0.85)
NY0.008 ***−0.143 ***0.014 ***
(3.25)(−3.59)(5.86)
HJ−0.157−6.144−0.007
(−0.54)(−1.37)(−0.03)
GDPR−0.002−0.052 **−0.001
(−1.41)(−1.98)(−0.33)
Observations341314314
lambda0.384 ***0.567 ***0.407 ***
(4.74)(7.85)(5.16)
R-squared0.2130.1250.304
*** p < 0.01, ** p < 0.05, standard error in parentheses.
Table 9. Results of regional heterogeneity test.
Variables(1)(2)(3)(4)
EasternCentralWesternNortheastern
lnDIF0.156 ***0.233 ***0.074 **−0.025
(4.02)(3.24)(2.55)(−1.05)
CZ−0.496 ***−0.935 ***0.0860.425 ***
(−8.75)(−3.86)(1.39)(4.02)
NY0.000−0.000 **0.000 ***0.000
(0.76)(−2.38)(5.47)(0.50)
HJ−0.141−3.170 ***−1.433 ***0.211 *
(−0.43)(−4.83)(−2.83)(1.69)
GDPR0.025 ***0.017 **0.007−0.031 *
(11.78)(2.54)(1.48)(−1.78)
lambda−0.164−0.745 **0.311 *−0.600 ***
(−1.33)(−2.55)(1.84)(−3.83)
Observations1106613233
R-squared0.5490.2860.3390.047
*** p < 0.01, ** p < 0.05, * p < 0.1, standard error in parentheses.
Disclaimer/Publisher’s Note: The statements, opinions and data contained in all publications are solely those of the individual author(s) and contributor(s) and not of MDPI and/or the editor(s). MDPI and/or the editor(s) disclaim responsibility for any injury to people or property resulting from any ideas, methods, instructions or products referred to in the content.

