Article

The Impact of High-Standard Farmland Construction Policy on Grain Quality from the Perspectives of Technology Adoption and Cultivated Land Quality

1
College of Economics and Management, Southwest University, Chongqing 400715, China
2
Rural Economy and Management Research Center, Southwest University, Chongqing 400715, China
*
Author to whom correspondence should be addressed.
Agriculture 2023, 13(9), 1702; https://doi.org/10.3390/agriculture13091702
Submission received: 23 July 2023 / Revised: 23 August 2023 / Accepted: 26 August 2023 / Published: 29 August 2023

Abstract

:
The shift from increasing grain production to improving grain quality is a key measure to adapt to the changing structure of residents’ food consumption demand. High-standard farmland construction is an important means to achieve high grain production and excellent quality. To estimate the intervention effect of high-standard farmland construction policy, this paper analyzes it from the perspective of policy evaluation. The continuous DID model, moderating effect model, and the mediating effect model are used to systematically analyze the mechanism of high-standard farmland construction policy and its influence on grain quality. The findings are as follows: (1) The high-standard farmland construction policy has a significant promoting effect on grain quality, and the interaction coefficient of policy implementation is 0.074. is the results are still significant under the robustness test of lagging the explanatory variable by one period, replacing the core explanatory variable, changing the timing of policy implementation, and eliminating the interference of other relevant policies. (2) The adoption of environmentally friendly technology has played a positive moderating role in the process by which high-standard farmland construction policy promotes grain quality, with a moderating effect of 0.044. (3) The high-standard farmland construction policy can improve grain quality by improving cultivated land quality and adoption level of agricultural mechanization. (4) Heterogeneity analysis shows that high-standard farmland construction policy in major grain-producing areas and also non-major grain-producing areas can increase grain quality; the implementation of the policy has a more obvious effect on improving grain quality in areas with low distribution of grain quality. Accordingly, it is suggested to continue to promote high-standard farmland construction and implement special actions for farmland protection, focus on key technologies, encourage farmers to adopt environment-friendly technologies, accelerate the cultivation of diversified agricultural machinery service entities, and enhance the abilities of agricultural mechanization operations. This study provides a new perspective for improving grain quality and proves that a high-standard farmland construction policy is an important strategy for increasing grain quality.

1. Introduction

Marxist political economy states that consumption and production are dialectically related, and production must be oriented to meet consumption [1]. Specifically, grain consumption demand has shifted from “quantity” to “quality” and from “subsistence” to “nutrition” and “health” [2]. Observing reality, the raw grain quality rate in China is relatively high, with the proportion of rice, wheat, and maize quality higher than the medium level at over 90% and the soybean whole grain rate higher than the medium level at above 80%. The number of green food certifications has also increased significantly, among which the number of agricultural, forestry, and processed products certifications increased from 5558 in 2005 to 41,248 in 2021, with an average annual growth rate of 13.35%. However, there is still room to improve grain quality in China; a small amount of ecological, organic, high-protein, and high-nutritional-value grain and a shortage of specialized grain cannot meet people’s demand for high-quality grain [3]. So, the diversification and high quality of grain consumption pose new challenges to the sustainable and healthy development of the grain industry. How to improve grain quality is a realistic topic worth further exploration.
The “13th Five-Year Plan” proposes the strategy of “storing grain in the land and storing grain in technology”, pointing out that strengthening the quality of cultivated land and constructing large-scale basic farmland with high standards are new paths to ensure China’s grain security. According to the timeline, the main policies related to high-standard farmland construction can be divided into the planning stage (2005–2010) and the comprehensive improvement stage (2011–present). In 2005, the concept of “high-standard farmland construction” was first put forward in the no.1 document of the Central Committee. The central and provincial governments would substantially increase investment in comprehensive agricultural development, mainly for the transformation of low and medium-yield fields. In 2011, the Ministry of Land and Resources issued “Standard for High-Standard Farmland Construction (Trial)”, which standardized the basic work of high-standard farmland construction at the national level for the first time. Since 2011, the high-standard farmland construction has officially entered a new upgrading stage. Moreover, the report of the 20th National Congress of the Communist Party of China states that the foundation of grain security should be consolidated in all directions. The red line of 1.8 billion mu of cultivated land should be firmly held, and the construction of high-standard farmland should be accelerated. According to the policy requirements and combined with the natural conditions, it is necessary to scientifically plan and build high-standard farmland that can meet modern agricultural development requirements and maintain sustainable utilization. By the end of 2022, China had built a total of 1 billion mu of high-standard farmland, with remarkable achievements. Existing studies pay particular attention to the impact of high-standard farmland construction on grain production [4]. In addition, it is discussed from a multi-dimensional perspective. For instance, high-standard farmland construction promotes chemical fertilizer reduction [5], promotes agricultural carbon emission reduction [6], improves agricultural film recycling behavior [7], promotes rural poverty reduction [8], and improves agricultural sustainability [9]. It is worth noting that high-standard farmland construction has improved the farmland environment, optimized the farmland ecological pattern, and reduced farmland water and soil loss through measures such as field improvement, ditch matching, water-saving irrigation, forest network construction, and integrated promotion of green agriculture technology [10]. High-standard farmland construction can improve the output efficiency of cultivated land resources, promote the beneficent cycle development of the agricultural ecological environment, and realize the increase of grain quality. To some extent, high-standard farmland construction policy has played a positive promoting role in ensuring grain quality and safety. However, the existing literature lacks discussion of the relationship between high-standard farmland construction policy and grain quality and there are few empirical studies. The theoretical logic of high-standard farmland construction policy on grain quality still needs to be further studied.
This paper uses the provincial panel data for China from 2002–2017 and applies the continuous DID model to empirically analyze the impact of high-standard farmland construction policy on grain quality. The continuous DID model is a method to estimate the effect of policy intervention. In this paper, this method mainly quantifies the implementation effect of high-standard farmland construction policy. Furthermore, the moderating effect model and the mediating effect model are used to carry out empirical tests on the mechanism analysis. In addition, this paper explores the heterogeneous effect of high-standard farmland construction policy on grain quality from different functional areas of production and dimensions of grain quality distribution.
This paper mainly evaluates the effect of high-standard farmland construction policy to provide experiential reference for how to improve grain quality. The marginal contributions of this paper are as follows: Firstly, study of the policy effect of high-standard farmland construction from the perspective of grain quality. Different from the previous research on grain yield or grain planting area, this paper takes grain quality as the starting point. It objectively reveals the logical relationship between high-standard farmland construction policy and grain quality improvement. Secondly, it constructs a theoretical analysis framework to explain that high-standard farmland construction is not only an institutional arrangement, but also a technological innovation. The mechanism analysis provides an empirical basis for the subsequent improvement and accurate implementation of high-standard farmland construction policy. Thirdly, considering the impact of high-standard farmland construction policy in different regions on grain quality, replacing the previous single judgment will help to form accurate policies.

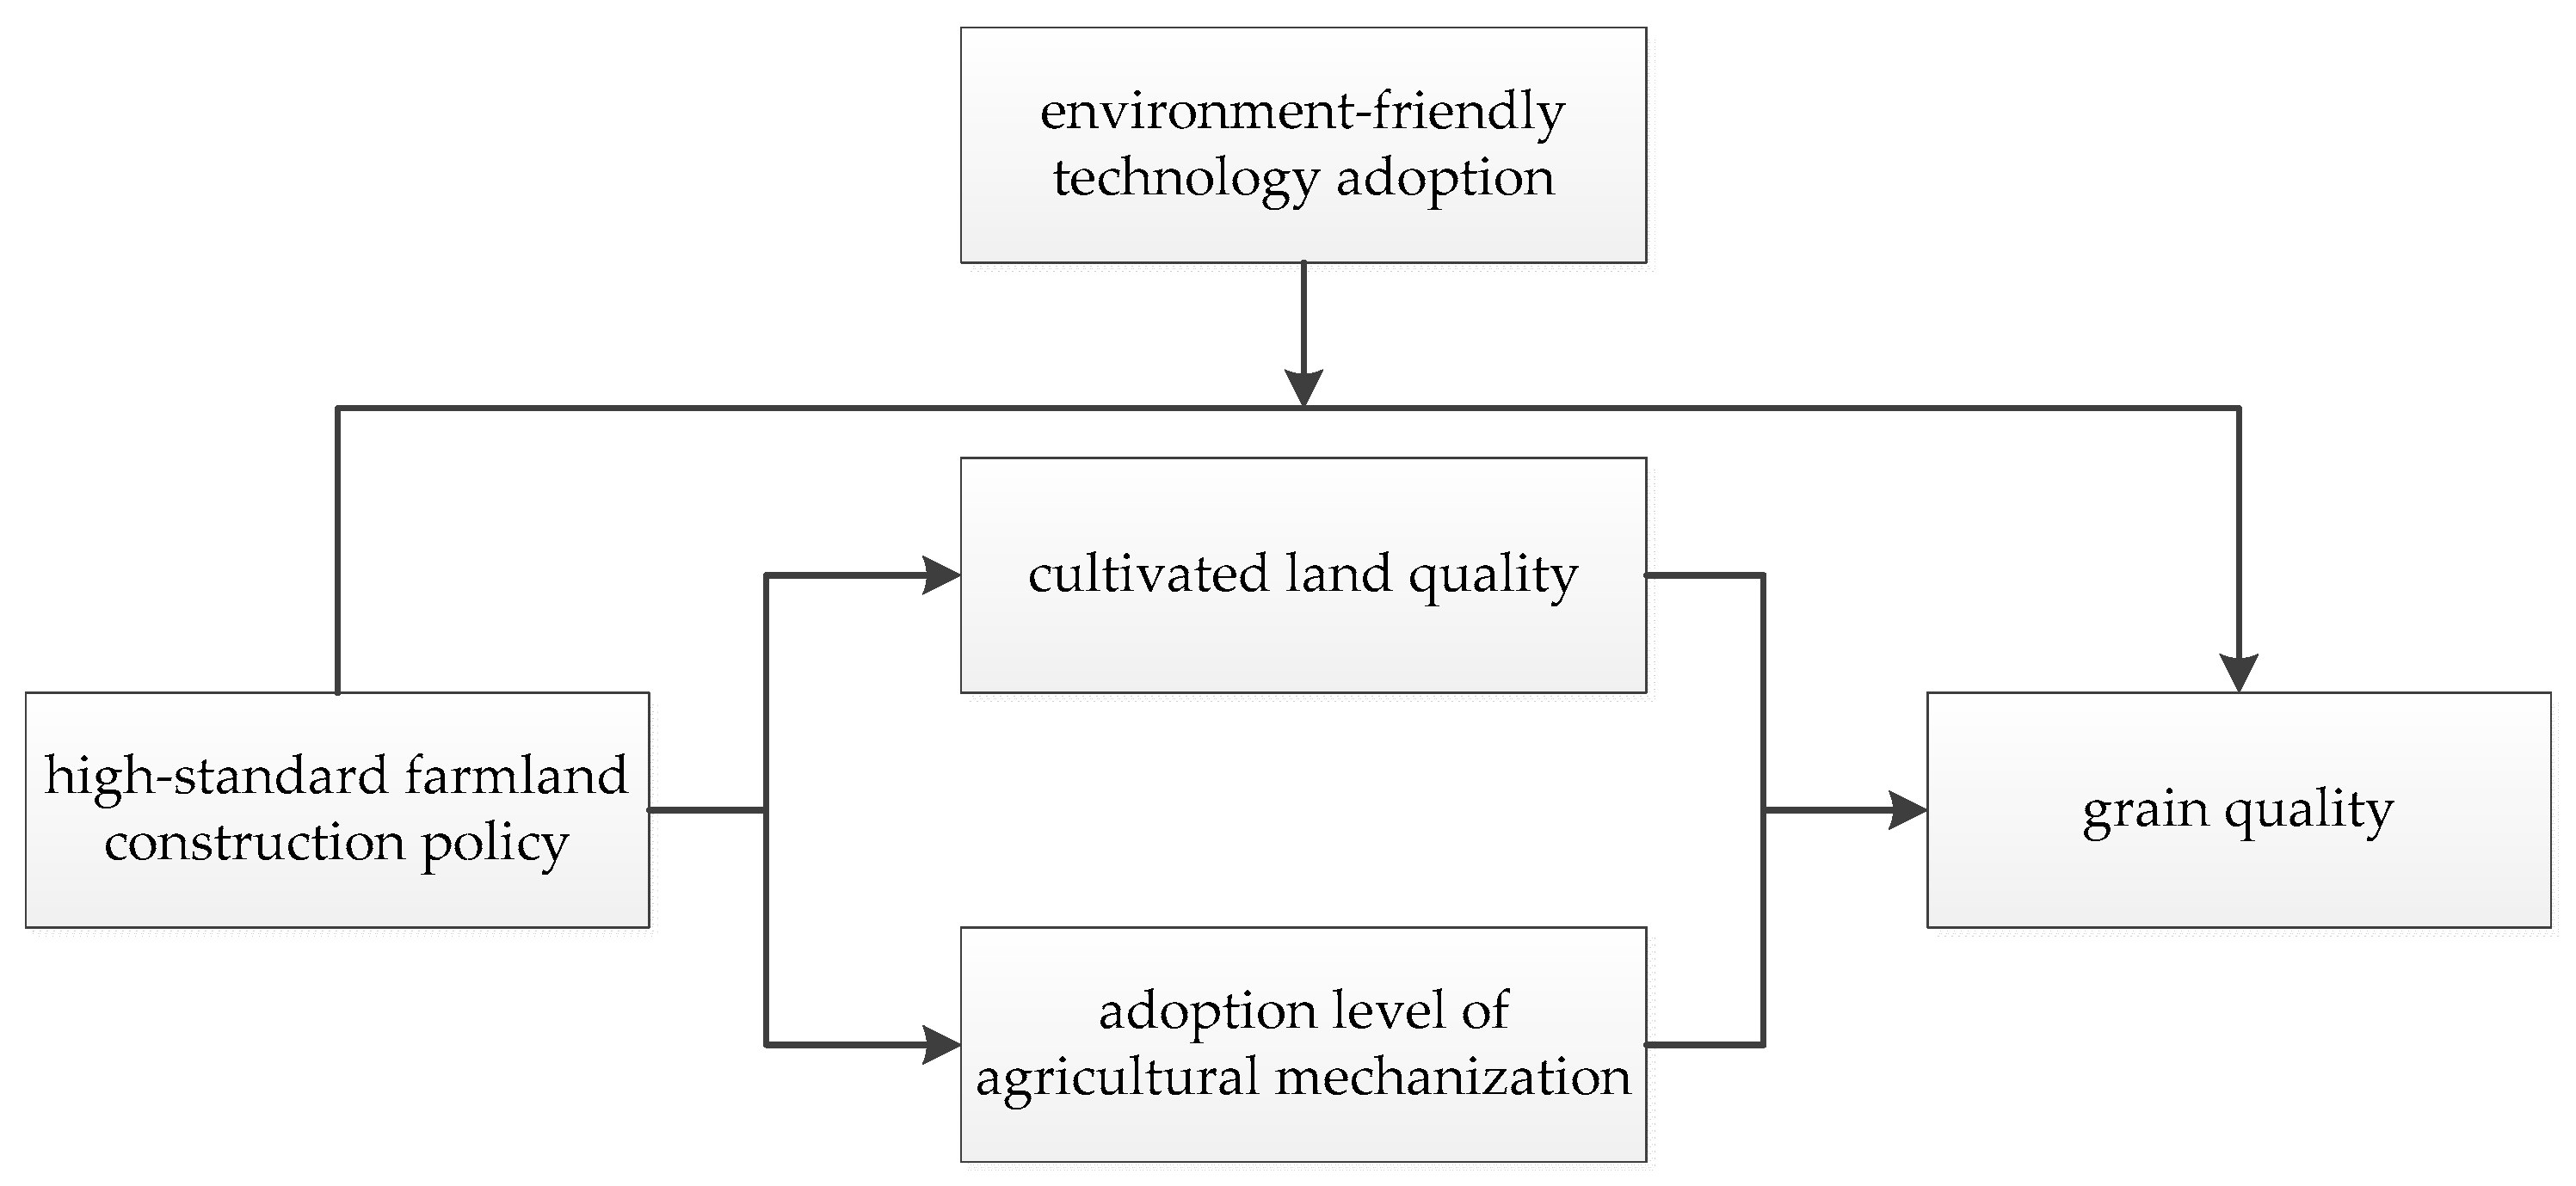
2. Theoretical Analysis and Research Hypothesis

2.1. High-Standard Farmland Construction Policy and Grain Quality

The high-standard farmland construction policy has an impact on grain quality through its ecological effect and induced effect. Firstly, high-standard farmland construction promotes the continuous management of land, creating conditions for the promotion and application of green agricultural technologies. This not only optimizes the fertilization structure and improves the utilization rate of fertilizers, but also promotes the reduction of agricultural inputs such as pesticides and plastic films. It is beneficial for the protection of soil and the ecological environment, thereby improving grain quality [11]. Secondly, high-standard farmland construction has solved the problems of cultivated land fragmentation, soil fertility decline, and management of decentralized small-scale farming, which will directly stimulate and cultivate more agricultural social service industries and new germplasm innovation industries [12]. Then, the induced effect of the high-standard farmland construction will promote the transformation of agricultural production and management modes and the high-quality development of the grain industry. This shows that the implementation of the high-standard farmland construction policy provides a strong material basis for grain quality and safety.
Based on the above analysis, the following research hypothesis is put forward:
H1. 
High-standard farmland construction policy has a positive effect on grain quality.

2.2. Moderating Effect of Environmentally Friendly Technology Adoption

Theoretically, the field regularization, soil improvement, and scale management brought by the high-standard farmland construction policy can certainly improve production efficiency and quality. However, excessive use of chemical fertilizers and pesticides destroys the ecological balance in the soil, leading to the dislocation and loss of organic matter if farmers do not adopt environmentally friendly techniques in grain production [13]. In other words, the impact of high-standard farmland construction policy on grain quality is somewhat limited by the adoption level of environmentally friendly technologies such as soil testing, formula fertilization, water and fertilizer integration, water-saving irrigation, and straw returning. Firstly, from an explicit perspective, the adoption of environmentally friendly technology can bring about the transformation of green modes of agricultural production. From a recessive perspective, it can also introduce advanced technologies and elements into agricultural production, acting as a technological spillover effect [14]. If farmers consider that adopting green technologies can promote the improvement of grain quality and increase grain returns, it will enhance farmers’ awareness of economic and ecological value, thereby stimulating farmers to adopt other technologies that can improve the quality of agricultural products [15]. Secondly, the adoption of environmentally friendly technology is an important motivation to promote grain quality [16]. Under the adoption of environmentally friendly technology, maintaining good soil structure and fertile farmland is achieved through the rational application of pesticides and fertilizers by farmers. At the same time, high-standard farmland construction not only improves agricultural production support facilities, but also optimizes land resource functions and alleviates soil compaction problems. Therefore, the superposition effect of environmentally friendly technology adoption and high-standard farmland construction policy is more conducive to grain quality improvement.
Based on the above analysis, the following research hypothesis is put forward:
H2. 
Environmentally friendly technology adoption has a positive moderating effect on the impact of high-standard farmland construction policy on grain quality.

2.3. Mediating Effect of Cultivated Land Quality and Adoption Level of Agricultural Mechanization

In practice, high-standard farmland construction has improved the cultivated land quality by measures of “combining small fields with large fields”, “breaking up parts into whole”, “soil improvement”, and “complete facilities” [17]. It can enhance the ability of farmland to retain soil and fertilizer, improving soil retention and buffering. As far as grain production is concerned, cultivated land is the core input factor, and high-quality cultivated land and complete farmland infrastructure play a decisive role in grain quality [18], mainly as follows. Firstly, suitable soil thickness and rich organic matter content can provide the nutrients and water required for crop growth, which breaks the impact of cultivated land resource constraints on grain production. Then, improving the utilization rate of water resources and increasing the storage capacity of soil fertilizer can promote grain quality improvement [19]. Secondly, the stability of cultivated land quality significantly attracts farmers with comparative advantages in agriculture to carry out large-scale grain production. Large-scale planting can improve the convenience of farmland production management and help to reduce the application of chemical fertilizers and pesticides, which protects the environmental safety of producing areas. As a result, it enhances the ecological and green characteristics of grain, and overall improves the grain quality [20]. Therefore, high-standard farmland construction has improved the cultivated land quality, ensured the sustainable development of land construction, and effectively solved the self-sufficiency of grain, ensuring grain quality and safety.
High-standard farmland construction is an effective means of promoting agricultural transformation and upgrading. It creates conditions for the full use of agricultural technology. Specifically, high-standard farmland construction provides working space for agricultural mechanization production by improving field conditions, building tractor-plowed roads, and reasonably increasing road width. In addition, it is beneficial to promote the orderly circulation of farmland by implementing the field improvement project of “small to large, sloping to flat”, and clarifying the corresponding land ownership [21]. The use of agricultural mechanization on transferred farmland can save marginal production costs. In other words, the expansion of agricultural land scale promotes farmers’ preference for using funds and technology to replace labor, resulting in a tendency to adopt agricultural mechanization technology for production due to scale effects. Utilized agricultural mechanization production can not only overcome the problem of labor employment, but also promote efficiency improvements brought about by economies of scale and specialized division of labor [22,23]. Specifically, agricultural mechanization has technological advantages and environment-protection advantages, which can reduce the depth of cultivation of farmland soil, energy consumption, the use of nitrogen fertilizers, and pesticides, thereby reducing soil pollution [24]. Adopting agricultural mechanization plant-protection technology not only expediently and effectively prevents diseases and pests, but also significantly improves the quality of plant protection and reduces environmental pollution during the operation process. This can reduce pesticide residues and ensure grain quality and safety.
Based on the above analysis, the following research hypothesis is put forward:
H3. 
Cultivated land quality and the adoption level of agricultural mechanization have a positive mediating effect on the impact of high-standard farmland construction policy on grain quality.
The theoretical framework used in the current study is shown in Figure 1.

3. Research Design

3.1. Research Method

3.1.1. Baseline Regression Model

To identify the impact of high-standard farmland construction policy on grain quality, this paper constructs a continuous DID model. In different periods of policy implementation, there are differences in the high-standard farmland construction area. On the one hand, there are differences between the high-standard farmland construction areas in different provinces (cities and districts) in the same period. On the other hand, before and after the implementation of the high-standard farmland construction policy, the land consolidation area in the same province (cities and districts) is different, and this heterogeneity provides a research basis for policy evaluation. With the implementation of high-standard farmland construction policies in various provinces, the construction area is continuously changing. Referring to the article by Liang et al. [5], the treatment group and the control group were distinguished by continuous variables. The basis for dividing the treatment group and the control group is based on the size and degree of change of continuous variables, without changing the basic properties of the DID model. In this article, the treatment group and the control group are divided by the proportion of land consolidation area. That is, the treatment group consists of samples with a larger proportion of land consolidation area, while the control group consists of samples with a smaller proportion of land consolidation area. The baseline regression model was established as follows:
G q u a l i t y i t = α + β L c o n s o l i d i × I t p o s t + δ X i t + μ i + γ i + ε i t
In Formula (1), G q u a l i t y i t is the explained variable that denotes the grain quality of i province in period t . L c o n s o l i d i × I t p o s t is the core explanatory variable, where L c o n s o l i d i represents the proportion of land consolidation area (the ratio of the sum of the transformed low-yield farmland area and the high-standard farmland construction area to the cultivated land area), and I t p o s t represents the dummy variable at the time of policy implementation. When t 2011 , I t p o s t = 1 , otherwise I t p o s t = 0 . X i t is a series of control variables. The variable μ i denotes province fixed effect and γ i denotes year fixed effect; ε i t is a random error term. The variable α is a constant term and β and δ are the coefficients to be estimated. Coefficient β represents the influence degree of high-standard farmland construction policy on grain quality.

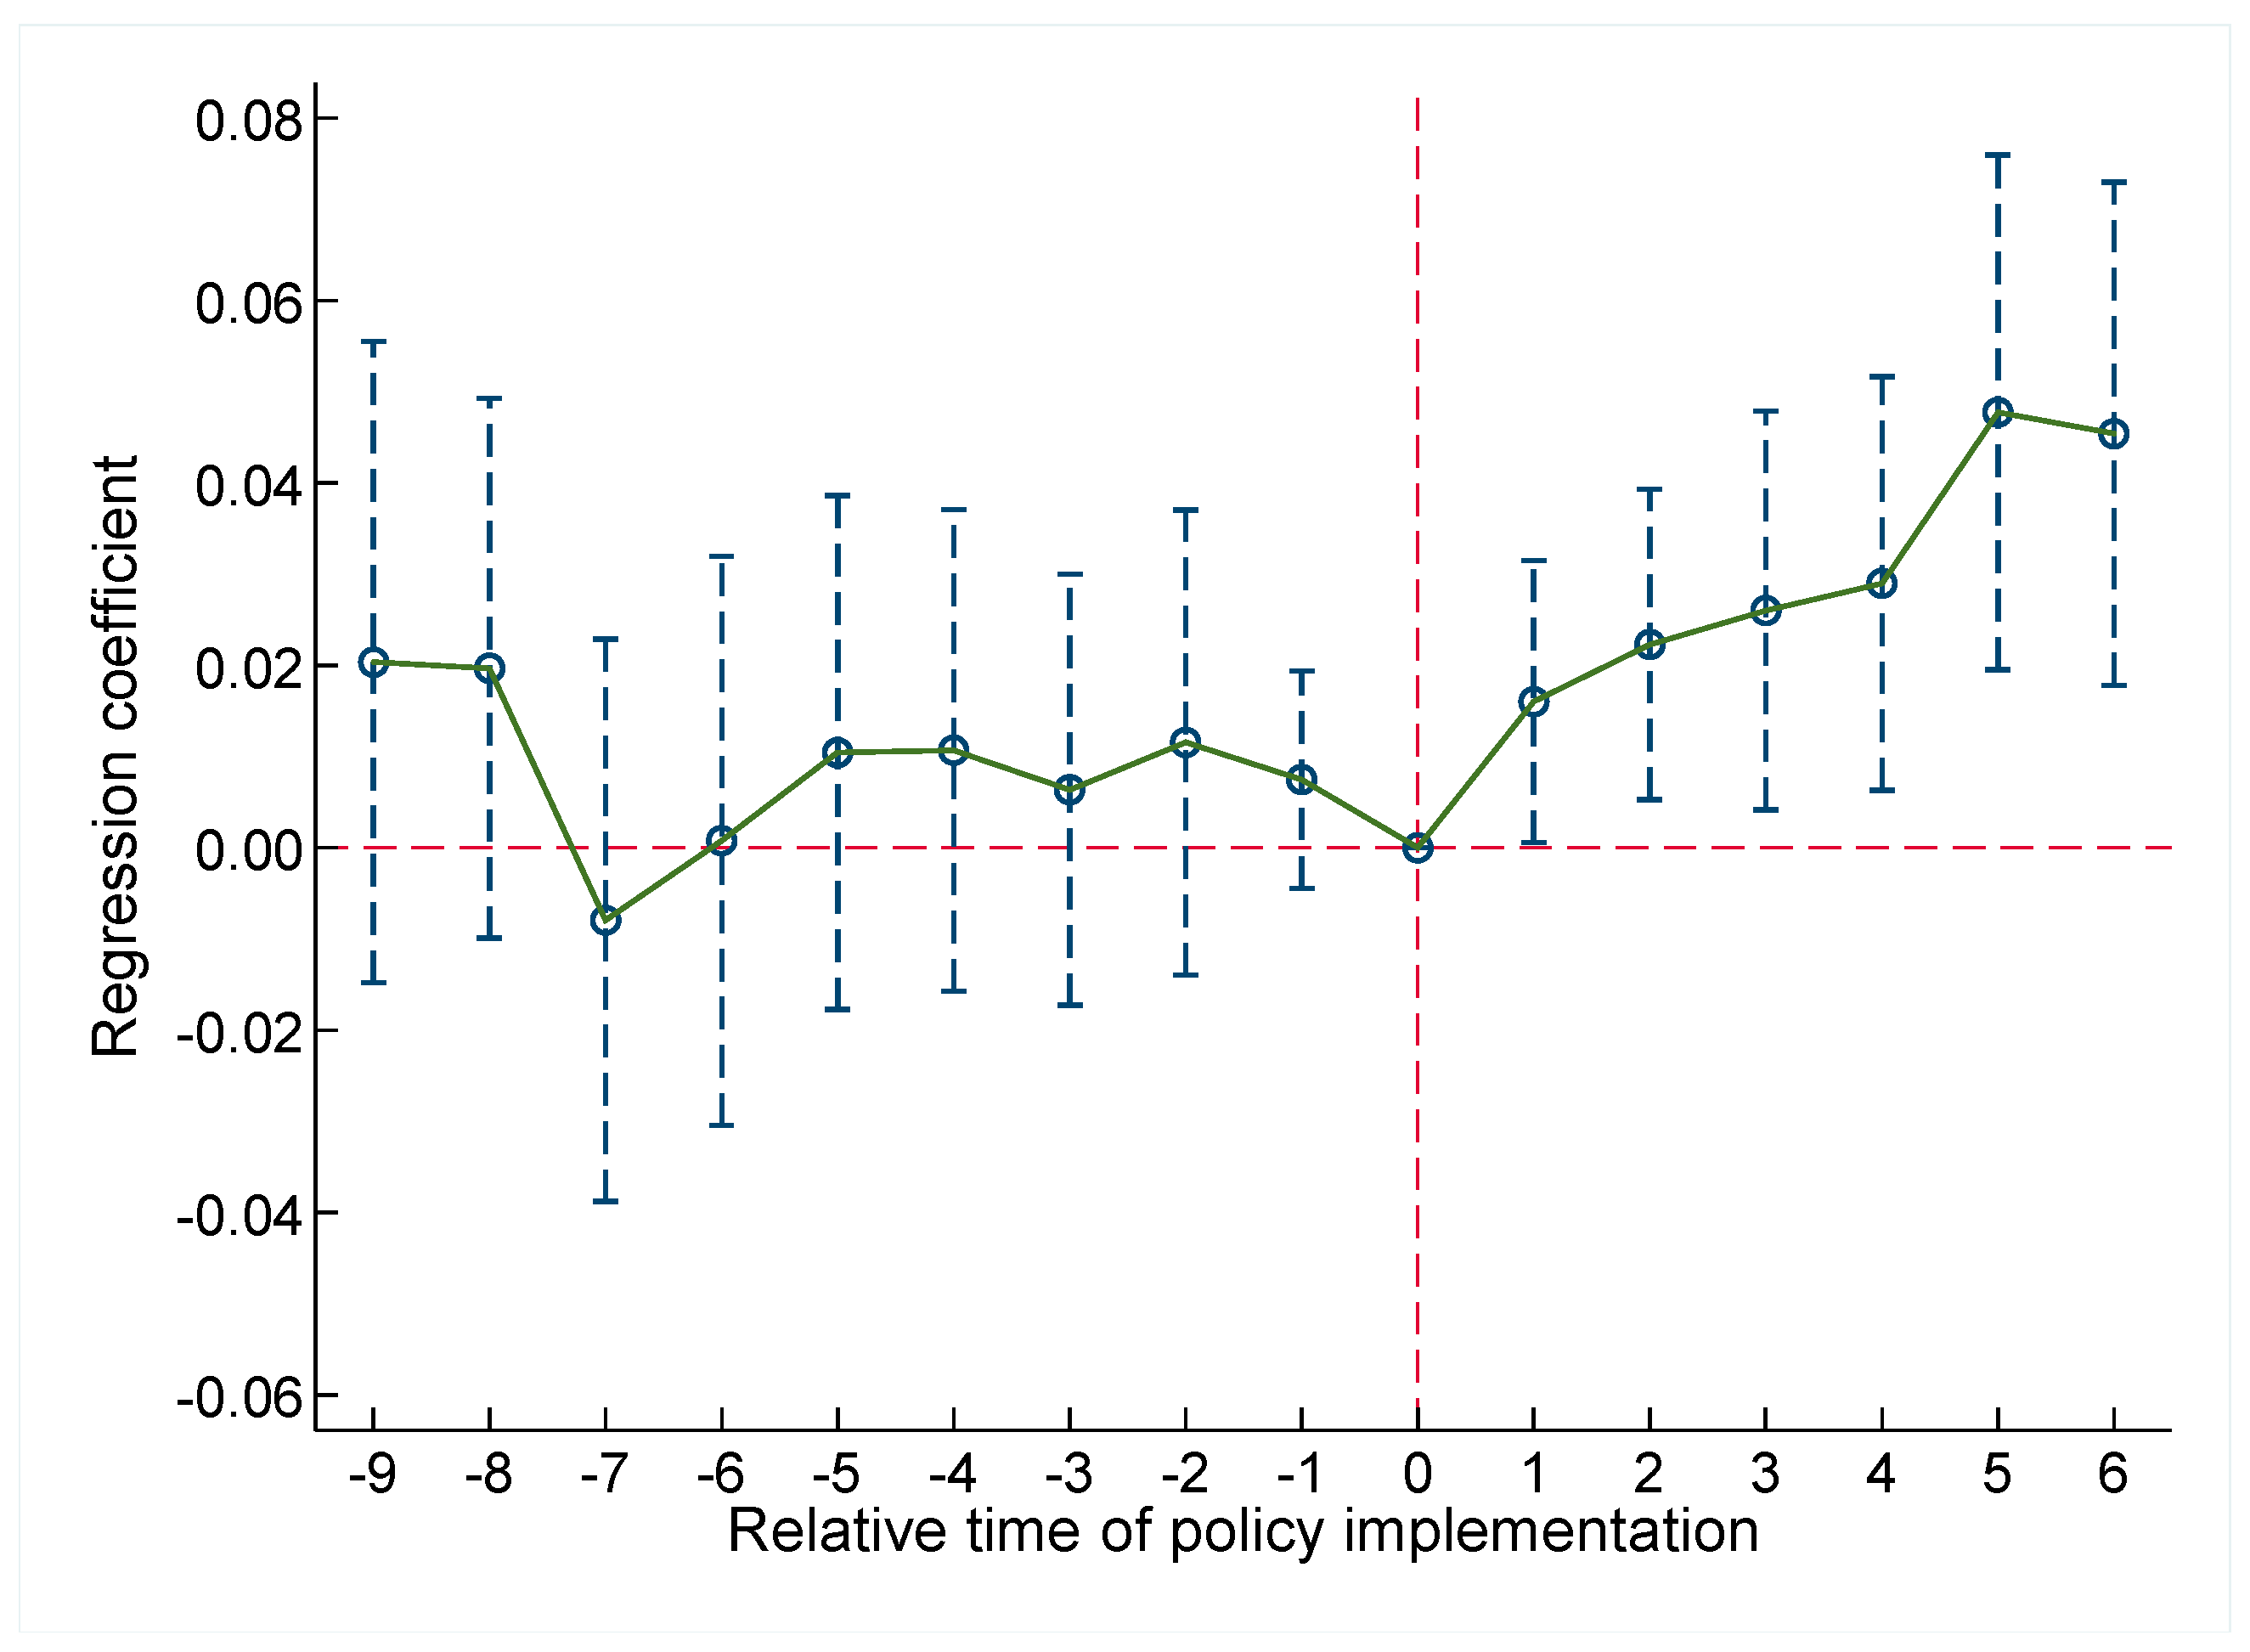
3.1.2. Parallel Trend Tests and Analysis of the Dynamic Effects of Policy

The key to the effectiveness of the DID model is to meet the assumption of a parallel trend. If there is no policy shock, the time trend of the treatment group and control group should be consistent. In this paper, a series of dummy variables are included in the standard regression to track whether the grain quality of all provinces (cities and districts) in China has the same changing trend when the high-standard farmland construction policy is not implemented. The following model was established:
G q u a l i t y i t = α + t = 2002 2017 β t ( L c o n s o l i d i × y e a r t ) + δ X i t + μ i + γ i + ε i t
In Formula (2), y e a r t represents the year dummy variable. The coefficient β t represents a series of estimated values from 2002 to 2017. Taking 2011 as the base year of policy implementation, the coefficient β t should be stable before the implementation of the high-standard farmland construction policy. After the implementation of the high-standard farmland construction policy, the coefficient β t should show an upward trend.

3.1.3. Moderating Effect Model

To test the interaction effect between high-standard farmland construction policy and adoption of environmentally friendly technology, this paper establishes a dynamic panel model by adding the interaction term of high-standard farmland construction policy and environmentally friendly technology adoption and introducing the variable of environmentally friendly technology adoption. Establish the following model:
G q u a l i t y i t = γ 0 + γ 1 D I D i t + γ 2 D I D i t × H i t + γ 3 H i t + ϑ X i t + μ i + γ i + ε i t
In Formula (3), D I D i t represents the policy intersection item, which is L c o n s o l i d i × I t p o s t . H i t is the moderating variable that represents environmentally friendly technology adoption. X i t is a series of control variables. The remaining variables are consistent with Formula (1). After adding the moderating variable to the regression model, the policy effect coefficient changes from β in Model (1) to γ 1 + γ 2 in Model (3).

3.1.4. Mediating Effect Model

According to theoretical analysis, the high-standard farmland construction policy increases grain quality by improving the quality of cultivated land and improving the adoption level of agricultural mechanization. To verify the transmission mechanism, the following mediating effect model was constructed:
M i t =   α 0 + α 1 L c o n s o l i d i × I t p o s t + α 2 X i t + μ i + γ i + ε i t
G q u a l i t y i t = β 0 + β 1 L c o n s o l i d i × I t p o s t + β 2 M i t + δ X i t + μ i + γ i + ε i t
In Formula (4), M i t is the mediating variable that represents cultivated land quality and the adoption level of agricultural mechanization, α 1 is the marginal estimation coefficient of high-standard farmland construction policy on the mediating variable, β 1 is the direct effect of high-standard farmland construction policy on grain quality, α 1 β 2 represents the mediating effect. The remaining variables are consistent with Formula (1).

3.2. Variable Selection and Description

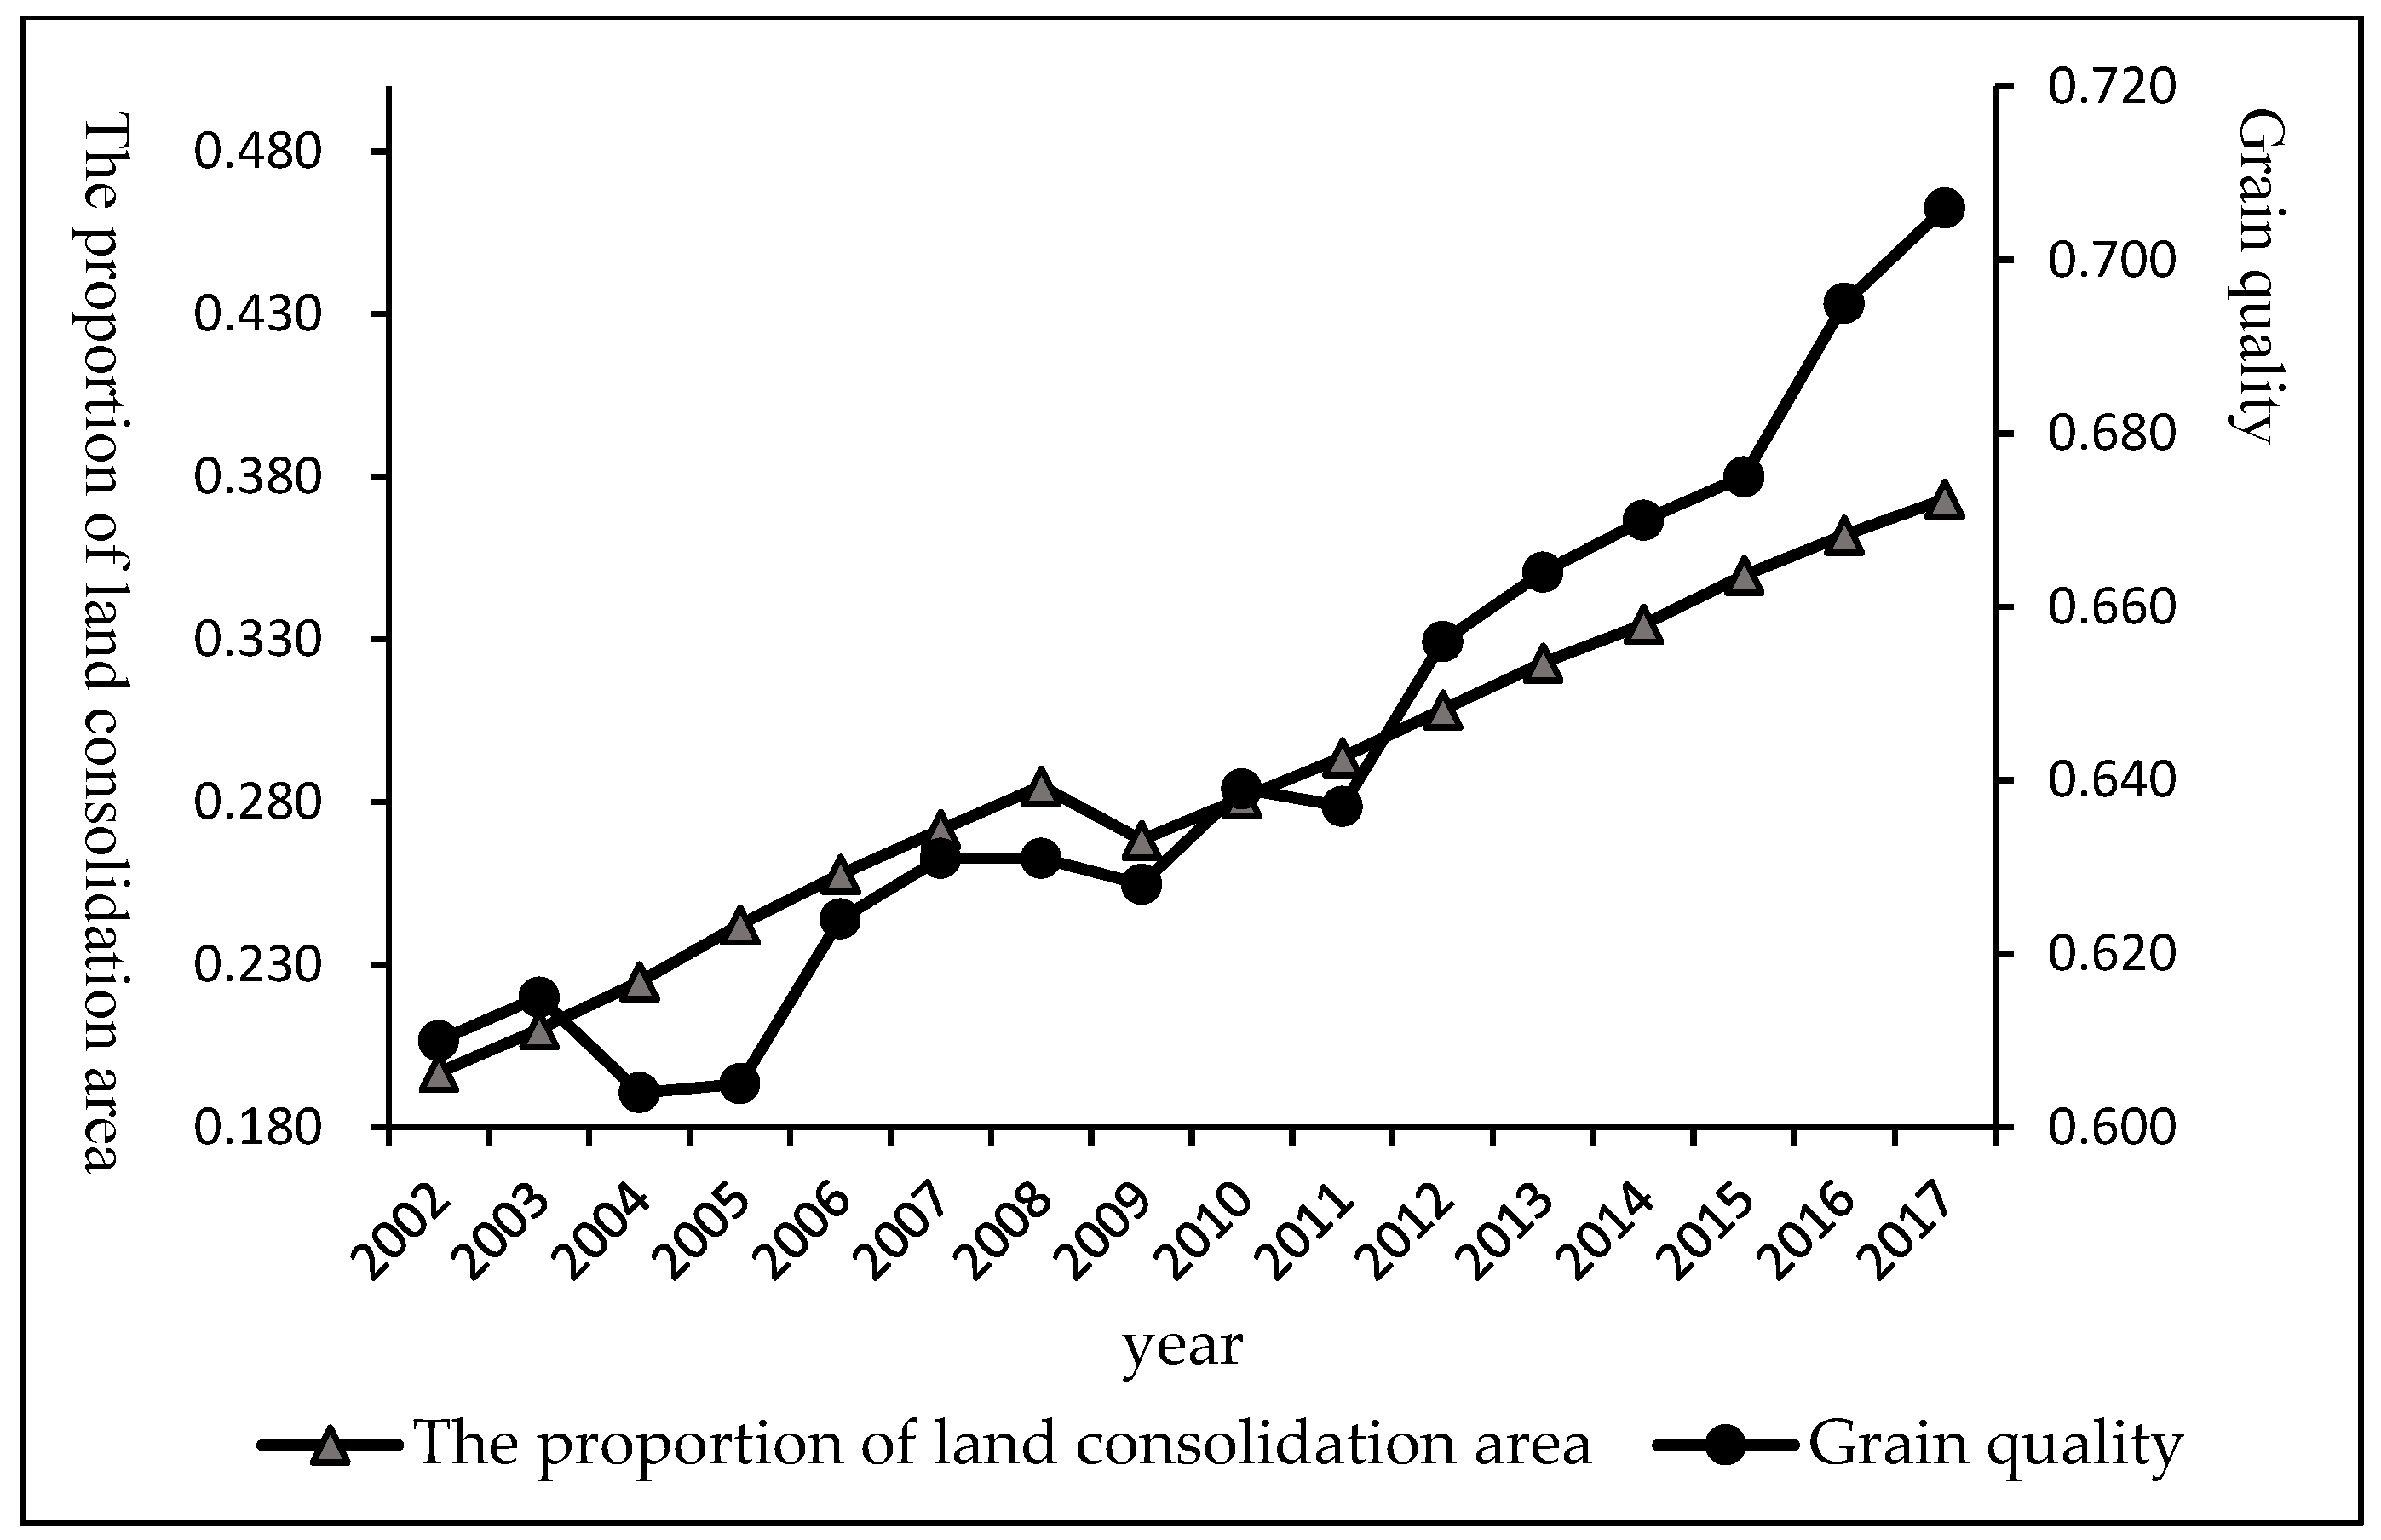
3.2.1. Explained Variable

The explained variable is grain quality, which refers to grain nutrition, health, and security. Referring to Gong et al. [25], the high-quality rate of unprocessed grain and the larger number of green grain certificates represent the grain nutrition and health [26,27], and the pesticide residues per unit of grain production meet the national safety standards to represent grain development security [28]. The evaluation index system is shown in Table 1.
To explain the source and processing of grain quality data, first, the data for the high-quality rate of unprocessed grain before 2014 were taken from the China Grain Yearbook, and the data for 2014 to 2017 from the Brick Agricultural Database. Some individual missing values were supplemented and replaced by the quality compliance rate of grain reserves. Second, the numbers of green grain certificates obtained come from the Green Food Statistics Yearbook. Third, the pesticide residues per unit of grain production were calculated according to the pesticide loss coefficient of the national pollution source survey.
Grain quality was measured by the vertical and horizontal pull-off grade method. The vertical and horizontal pull-off grade method is an objective weighting method that considers the time factor in the process of determining the index weight and can ensure the objectivity of index synthesis. Specifically, the explained variable is represented by the grain quality index, and the calculation steps were as follows:
Firstly, the original data were standardized by the extreme value method, which reduces the calculation errors caused by different units of the original data and makes the indexes comparable. X i j t k is the standardized data:
Positive index: X i j t k = x i j t k x i j m i n t k x i j m a x t k x i j m i n t k Negative index: X i j t k = x i j m a x t k x i j t k x i j m a x t k x i j m i n t k
Among them, x i j m a x t k and x i j m i n t k are the maximum and minimum values of the j indicator of the i province in the t k year.
Secondly, in order to confirm the index weight, the comprehensive evaluation function was set as follows:
y i t k = j = 1 m ω j X i j t k k = 1,2 , , t ; i = 1,2 , , n ; j = 1,2 , , m
where y i t k is the comprehensive evaluation value of the synthesized object at the time t k and ω j is the weight.
The criterion for determining the weight ω j is to reflect the differences between the evaluated objects to the maximum extent. The overall difference is expressed by the sum of the squares of the deviation σ 2 = k = 1 t i = 1 n y i t k y ¯ 2 , and y ¯ = y i t k n t .
After the original data were standardized, then y ¯ = 0 and σ 2 = k = 1 t i = 1 n y i t k 2 = k = 1 t w T H k w = w T k = 1 t H k w = w T H w .
Specific   definition :   w = w 1 , w 2 , , w m T A k = X 11 t k X 1 m t k X n 1 t k X n m t k H k = A k T A k H = k = 1 t H k
If w T w = 1 is defined, σ 2 takes the maximum value when w is taken as the eigenvector corresponding to the maximum eigenvalue λ m a x H of matrix H .
Thirdly, the grain quality index was calculated. After the weight coefficient ω j was obtained, the comprehensive evaluation value y i t k was calculated by weighting the three evaluation indexes.

3.2.2. Core Explanatory Variable

The interaction term of the dummy variable for the proportion of land consolidation area and the year when the high-standard farmland construction policy was implemented ( L c o n s o l i d i × I t p o s t ) is the core explanatory variable for assessing its impact on the grain quality. The ratio of the sum of the transformed low-yield farmland area and the high-standard farmland construction area to the cultivated land area indicates the proportion of the land consolidation area.

3.2.3. Control Variables

In addition to the impact of the high-standard farmland construction policy on grain quality, other factors also affect the grain quality and therefore need to be controlled for in the model. The control variables are as follows: ① Disaster rate. The percentage of the crop disaster area to grain-sown area indicates the disaster rate, which is used to control the impact of the disaster situation on grain quality. ② Agricultural planting structure. The proportion of grain-sown area to agricultural crop-sown area is used to express agricultural planting structure. ③ Per capita income of the grain industry. The grain industry is part of agriculture and needs to be separated from other forms of agriculture. Referring to Wang et al. [29], per capita income of the grain industry = per capita disposable income of farmers × grain output value/agricultural output value. ④ Financial support for agriculture level. The proportion of agricultural, forestry, and water expenditure to public financial budget expenditure indicates the financial support for the agriculture level. ⑤ Average education level of the rural labor force. This article assigns 0, 6, 9, 12, or 15 years of education to those who have not attended school, or who attended primary school, middle school, high school, or college, and calculates the average education level of the rural labor force by weighting. ⑥ Deviation degree of average temperature. This is expressed as the absolute deviation of the average temperature of each province from its mean, controlling for the impact of extreme climate change on grain quality. ⑦ Grain retail price index. This controls for the impact of grain price changes on grain quality. ⑧ Cultivated land area. This controls for the influence of differences in cultivated land scale between different provinces on grain quality. ⑨ Variety-improvement technology. Referring to Chen et al. [30], the fixed base index calculated using the average seed price was used to evaluate variety-improvement technology. The increase in average seed price is partly due to the rise in price levels and partly due to technological improvements in the seed industry. This article uses the fixed base index to eliminate the factor of rising price levels. ⑩ Effective irrigation area of the grain. This controls for the impact of farmland irrigation conditions on grain quality.

3.2.4. Moderating Variable

Referring to the articles by Kong et al. [31] and Zhang et al. [32], the difference between the optimal and actual amounts of fertilizer application was used to indicate whether or not environmentally friendly technology has been adopted. A value of 1 was assigned to areas where the actual fertilizer application amount is below the optimal application amount, which means that the area has adopted environmentally friendly technology; conversely, a value of 0 indicates environmentally friendly technology has not been adopted. The following is the specific calculation model:
Firstly, a C-D production function is established:
l n g r a i n i t =   θ 0 + θ 1 l n F i t + θ 2 l n L i t + θ 3 l n M i t + θ 4 l n O i t + ε i t
In Formula (6), the explained variable ( g r a i n i t ) represents the grain yield per unit area. The independent variable is the input of production factors, including fertilizer input ( F i t ), labor input ( L i t ), agricultural machinery input ( M i t ), and other inputs such as seed and pesticide input ( O i t ).
Secondly, based on the theory of utility maximization, utility is maximized when marginal revenue equals marginal cost. At this point, the marginal benefit of fertilizer to yield is equal to the ratio of fertilizer price to grain price, which is expressed as Formula (7):
g r a i n F = P F P g r a i n
Thirdly, the Formula (6) is deformed, and both sides are exponents at the same time, then Formula (8) is obtained as follows:
g r a i n i t = e θ 0 × F i t θ 1 L i t θ 2 M i t θ 3 O i t θ 4 e ε i t
Based on Formula (8), the marginal effect of fertilizer input on grain production is calculated as follows:
g r a i n F = θ 1 × e θ 0 F i t θ 1 1 L i t θ 2 M i t θ 3 O i t θ 4 e ε i t = θ 1 × g r a i n F
According to Formulas (7) and (9), the formula for calculating the optimal fertilizer application amount is obtained:
F o p t i m u m = θ 1 × g r a i n ( P F P g r a i n )
Finally, the difference between the optimal and actual fertilizer application amount is calculated using Formula (11) to indicate the adoption of environmentally friendly technology. If E n v i r i t 0 , environmentally friendly technology has been adopted, and the assignment is 1; otherwise, environmentally friendly technology has not been adopted, and the assignment is 0.
E n v i r i t = F o p t i m u m F r e a l i t y

3.2.5. Mediating Variables

Mediating variables include cultivated land quality and adoption level of agricultural mechanization. In this paper, the proportion of drought and flood-protection area is regarded as the proxy variable of cultivated land quality, and the proportion of drought and flood-protection area = drought and flood-protection area/agricultural crop-sown area.
To measure comprehensively the adoption level of agricultural mechanization, referring to the article of Xue et al. [33], adoption level of agricultural mechanization = ploughing mechanization × 0.22 + sowing mechanization × 0.20 + harvesting mechanization × 0.22 + plant protection mechanization × 0.18 + irrigation mechanization × 0.18.

3.3. Data Sources and Descriptive Statistics

This paper uses panel data from 31 provinces (cities and districts) in China from 2002 to 2017 to evaluate the impact of high-standard farmland construction policy on grain quality. The data for the proportion of land consolidation area come from the China Financial Yearbook. The data for disaster rate, agricultural planting structure, per capita income of the grain industry, cultivated land area, effective irrigation area of grain, and cultivated land quality come from the China Rural Statistical Yearbook. The data for financial support for agriculture level and grain retail price index come from the China Statistical Yearbook. The original data related to the average education level of rural labor force come from the China Population and Employment Statistics Yearbook. The original data for deviation degree of average temperature come from the Meteorological Data Network. The original data for variety-improvement technology and environmentally friendly technology adoption come from the Brick Agricultural Database. The original data about the adoption level of agricultural mechanization come from the China Agricultural Machinery Industry Yearbook.
Because of the lack of individual data, the moving average method was used to fill in. To eliminate the influence of price increases and inflation between years, the variables related to expenses were converted into constant prices for 2002 according to the inflation rate of the corresponding years. Descriptive statistics of the above variables are shown in Table 2.
In order to preliminarily understand the dynamic relationship between high-standard farmland construction policy and grain quality, we refer to Figure 2. Figure 2 shows that the proportion of land consolidation area and grain quality in China showed an upward trend from 2002 to 2017. Before 2011, the growth rate of grain quality was relatively flat, and after 2011, grain quality continued to increase rapidly. This shows that with the promotion of high-standard farmland construction policy there may be a positive statistical correlation between policy and grain quality. The above analysis is only descriptive in nature; we discuss the empirical results in the following section.

4. Empirical Results and Analysis

4.1. Baseline Regression Results

Table 3 shows the estimated results for the effect of the high-standard farmland construction policy on grain quality. Columns (1), (2), and (3) were estimated using ordinary standard errors, robust standard errors, and heteroscedasticity–sequence correlation–cross section correlation robust standard errors, respectively. The results show that the high-standard farmland construction policy can improve grain quality, and the interaction coefficient of policy implementation is 0.074. Accordingly, the research hypothesis H1 is verified. The existing literature (Hu et al., 2022 [4]) found that the high-standard farmland construction policy has a significant increase effect on grain production, and the interaction coefficient of policy implementation is 0.092. It can be shown that the implementation of high-standard farmland construction policy can increase grain quantity and improve grain quality.
As can be seen from the control variables, increases in disaster rate and cultivated land area inhibit improvement in grain quality. The average education level of the rural labor force has a promoting effect on grain quality, indicating that well-educated farmers are more receptive to new knowledge, adopt new technologies, and pay more attention to grain quality. In addition, the adoption of variety-improvement technology and the increase of effective irrigation area of grain are also helpful to improve grain quality.

4.2. Parallel Trend Tests and Dynamic Policy Effects

Figure 3 shows the trend of the regression coefficient β t . The vertical lines across the dots in the figure are the 95% confidence intervals of the corresponding estimated parameters. The value 0 represents the initial year of the implementation of the high-standard farmland construction policy (i.e., 2011). Before the implementation of the high-standard farmland construction policy, the regression coefficients were not significantly different between years and the confidence intervals all contained a value of 0. After the implementation of the high-standard farmland construction policy, the regression coefficients were significantly different, with confidence intervals above the value 0. The results verify that the high-standard farmland construction policy can improve grain quality. This effect is also sustainable. With the continuous promotion of the high-standard farmland construction policy, the promotion effect is more obvious.
Further, we can observe the dynamic impact of high-standard farmland construction policy. Table 4 shows the estimated results of the dynamic effects of high-standard farmland construction policy on grain quality. Before the policy was implemented, the coefficient β t of the effect of high-standard farmland construction policy on grain quality was not significant, while after 2011, the positive effect of the coefficient β t showed an increasing trend from 0.016 (2012) to 0.048 (2016), and a slow downward trend in 2017. Overall, the regression coefficients were all significantly positive after the implementation of the policy, proving that the high-standard farmland construction policy has an enhancing effect on grain quality.

4.3. Robustness Tests

4.3.1. Explanatory Variable Lagged by One Period

It takes time to build high-standard farmland, and the impact of high-standard farmland construction policy on grain quality may be time-delayed. To weaken this endogenous problem, this paper analyzes the influence of the explanatory variable on grain quality, lagged by one period. The explanatory variable was lagged by one period, resulting in missing 31 instances of sample data, and the sample size was 465. According to the results in column (1) of Table 5, the core explanatory variable is significant at the level of 1%. This shows that the high-standard farmland construction policy can improve grain quality and the baseline regression results are stable.

4.3.2. Replacing Core Explanatory Variable

The extent of high-standard farmland construction can be expressed by both the proportion of land consolidation area and the investment level of comprehensive agricultural development. The investment level of comprehensive agricultural development is the agricultural investment per unit of high-standard farmland construction area. In this paper, referring to Peng et al. [8], the interaction term I n v e s t i × I t p o s t is used to test the robustness instead of the core explanatory variable. I n v e s t i represents the investment level of comprehensive agricultural development and I t p o s t represents the dummy variable at the time of policy implementation. The results in column (2) of Table 5 show that the regression coefficient of the new interaction term is 0.096 and is significant at the 5% level. Therefore, it indicates that the high-standard farmland construction policy still has a significant effect on grain quality.

4.3.3. Changing the Timing of Policy Implementation

This paper used samples from before the implementation of the high-standard farmland construction policy (2002–2010), and randomly selected 2005 and 2006 as the policy time points for the placebo test. The results in columns (3) and (4) of Table 5 show that the coefficients of interaction items L c o n s o l i d i × I t p o s t 2005 and L c o n s o l i d i × I t p o s t 2006 are not significant and pass the placebo test. This shows that there was no policy effect of high-standard farmland construction before 2011, which confirms the robustness of the results in Table 3.

4.3.4. Considering Other Relevant Policies’ Interference

In 2015, the Ministry of Agriculture and Rural Affairs of the People’s Republic of China promulgated the Action Plan for Zero Growth in Fertilizer and Pesticide Usage by 2020. In 2016, the Reform Plan for Establishing a Green Ecology-oriented Agricultural Subsidy System was issued. Relevant policies will influence grain quality. To avoid confusing the regression results, the data from 2015 and beyond were excluded. This paper uses the data for 31 provinces (cities and districts) in China from 2002 to 2014. The results in column 5 of Table 5 show that the high-standard farmland construction policy still significantly improves grain quality, and the baseline regression results are reliable.
In addition, land transfer can change the scale of grain planting. Scale expansion is more likely to adopt green ecological technology for intensive cultivation, thus affecting the grain quality. The confirmation of land ownership increases the stability of farmland ownership and promotes the clarity of farmland rights and responsibilities. Farmers will pay more attention to farmland protection and improve grain farming behavior, which will influence the grain quality. Therefore, this paper further controls for the land transfer policy and the land confirmation policy, and once again estimates the impact of high-standard farmland construction policy on grain quality. The land transfer policy is characterized by the land transfer rate (%) = the total area of household contracted farmland transfer/the area of household contracted farmland, and the land confirmation policy is characterized by the land confirmation rate (%) = the number of land contractual management rights certificates issued/the number of household contracted farmers. The results listed in Table 5, Table 6 and Table 7 show that the high-standard farmland construction policy still has a significant positive effect on grain quality, which confirms the robustness of the baseline regression estimation results in Table 3.

4.4. Moderating Effect Test

Table 6 shows the estimated results of the C-D production function, where increasing fertilizer input has a significant positive effect on grain production. Fertilizer input increased by 10% and grain production increased by 1.35%. The optimal fertilizer application amount was calculated according to Formula (10) and environmentally friendly technology adoption was calculated according to Formula (11).
The results in Table 7 show that environmentally friendly technology adoption plays a moderating role in the improvement of grain quality by the high-standard farmland construction policy. Column (1) controls for the year-fixed effect, column (2) adds a series of control variables consistent with the baseline regression model, and column (3) further controls for the province-fixed effect. This paper analyzes the estimation results in column (3). The coefficient of interaction between L c o n s o l i d i × I t p o s t and adoption of environmentally friendly technology is significantly positive, which shows that the coordinated development of high-standard farmland construction policy and environmentally friendly technology adoption has an increasing effect on grain quality. Accordingly, the research hypothesis H2 is verified.

5. Further Discussion: Mechanism Analysis and Heterogeneity

5.1. Mechanism Analysis

Columns (1), (2), and (4) of Table 8 examine the mediating effect of cultivated land quality. Column (1) of Table 8 shows that the total effect of high-standard farmland construction policy on grain quality is positively significant at the 1% level. Column (2) indicates that the influence coefficient of high-standard farmland construction policy on cultivated land quality is 0.063, which is significant at the 1% level. The direct effect of high-standard farmland construction policy on grain quality is remarkable, with an estimated coefficient of 0.067, which is significant at the 1% level. At the same time, cultivated land quality has a significant positive impact on grain quality. That is, the β 1 of formula (5) in the model setting is significant and consistent with the sign of α 1 β 2 , indicating that the cultivated land quality has a partial mediating effect. Therefore, the high-standard farmland construction policy promotes the increase of grain quality by promoting cultivated land quality. The internal mechanism is that the high-standard farmland construction policy involves field improvement and soil optimization, which solves the problems of farmland fragmentation and low-quality cultivated land. It enhances farmland soil and fertilizer conservation ability, and can thereby improve grain quality.
Columns (1), (3), and (5) of Table 8 examine the mediating effect of the adoption level of agricultural mechanization. Column (1) of Table 8 shows that the total effect of high-standard farmland construction policy on grain quality is 0.074, which is positively significant at the 1% level. Columns (3) and (5) of Table 8 show that the high-standard farmland construction policy has a significant positive effect on the adoption level of agricultural mechanization, and the adoption level of agricultural mechanization positively contributes to grain quality improvement at the 1% statistical level. That is, the indirect effect α 1 β 2 is significant. Column (5) of Table 8 shows a significant contribution effect of high-standard farmland construction policy on grain quality with an estimated coefficient of 0.044. The direct effect β 1 is significant. From this, the adoption level of agricultural mechanization has a 40.82% share in the impact of high-standard farmland construction policy on grain quality, with a partially mediating effect. Therefore, the high-standard farmland construction policy not only reduces soil compaction and evaporation of soil moisture by improving the adoption level of agricultural mechanization, but also regulates and solves the contradiction between crop fertilizer needs and soil fertilizer supply, which can effectively improve grain quality. Accordingly, the research hypothesis H3 is verified.

5.2. Heterogeneity Analysis

5.2.1. Grouped by Different Grain-Producing Areas

Columns (1) to (6) in Table 9 show the estimation results for the major grain-producing areas and non-major grain-producing areas, respectively. The results in columns (1) and (4) indicate that the high-standard farmland construction policy has a significant positive effect on grain quality in both major and non-major grain-producing areas. The results in columns (2) and (5) show that the high-standard farmland construction policy has a significant positive on cultivated land quality in both major and non-major grain-producing areas. From the results in columns (3) and (6), after controlling for the cultivated land quality, the impact of high-standard farmland construction policy on grain quality is significantly positive. However, there are differences among different groups, among which the high-standard farmland construction policy has a greater impact on grain quality in the major grain-producing areas than in the non-major grain-producing areas (0.100 > 0.043). A possible reason is that after the construction of high-standard farmland, the thickness of the cultivation layer increases. The soil quality is higher, and the soil and water conservation ability are enhanced. Compared with non-major grain-producing areas, high-standard farmland construction policy has greater marginal utility in improving grain quality in major grain-producing areas.
Columns (1) to (6) in Table 10 show the estimated results of high-standard farmland construction policy and the adoption level of agricultural mechanization on grain quality in major grain-producing areas and non-major grain-producing areas. Firstly, columns (1) and (4) and columns (2) and (5) show that the high-standard farmland construction policy has made a significant contribution to grain quality and the adoption level of agricultural mechanization in major and non-major grain-producing areas, with a more pronounced contribution in the major grain-producing areas. Secondly, columns (3) and (6) show that after controlling for the adoption level of agricultural mechanization, the influence of high-standard farmland construction policy on grain quality is different in different grain-producing areas. It can be found that the impact of high-standard farmland construction policy on grain quality in the major grain-producing areas is greater than that in the non-major grain-producing areas (0.101 > 0.031), but the adoption level of agricultural mechanization in the non-major grain-producing areas has a greater impact on grain quality than in the major grain-producing areas (0.253 > 0.181).

5.2.2. Divided by Different Distribution Dimensions of Grain Quality

Considering that the policy effect of high-standard farmland construction may be diversified into different distribution dimensions of grain quality, this paper uses quantile regression to test it. Table 11 shows the results of the 0.1, 0.5, and 0.9 quantile regressions, which reveal that high-standard farmland construction policy has a positive effect on grain quality. As the quantile increases, the marginal effect decreases and the level of significance diminishes. This indicates that the high-standard farmland construction policy has a stronger positive effect on areas with low grain-quality distribution.

6. Conclusions and Recommendations

The continuous DID model avoids the potential deviation caused by artificially setting the treatment group and the control group and shows more abundant sample properties, making the empirical results more accurate. Using the continuous DID model, this paper empirically analyzes the impact of high-standard farmland construction policy on grain quality and discusses the heterogeneity. It also analyzes the moderating effect of environmentally friendly technology adoption, along with the mediating effects of cultivated land quality and the adoption level of agricultural mechanization. The main conclusions are as follows. Firstly, the high-standard farmland construction policy significantly improves grain quality. The results of the parallel trend tests and dynamic policy effects support the baseline regression findings. The analysis also passes a series of robustness tests including lagging the explanatory variable by one period, replacing the core explanatory variable, changing the timing of policy implementation, and excluding other relevant policies’ interference. It can be judged that high-standard farmland construction is an important measure to improve grain quality. Secondly, the adoption of environmentally friendly technology has played a positive moderating role on for grain quality improvement within the high-standard farmland construction policy. Therefore, environmentally friendly technologies such as soil testing, formula fertilization, water and fertilizer integration, and water-saving irrigation should be actively adopted to jointly promote the improvement of grain quality. Thirdly, the high-standard farmland construction policy can improve grain quality by improving the quality of cultivated land and enhancing the adoption level of agricultural mechanization. Fourthly, in major grain-producing areas and also in non-major grain-producing areas, the high-standard farmland construction policy can have a significant impact on grain quality by improving the cultivated land quality and enhancing the adoption level of agricultural mechanization. In addition, it was found through quantile regression that the higher the grain quality quantile, the weaker the effect of the high-standard farmland construction policy on improving grain quality. This indicates that there is more room for high-standard farmland construction policy implementation to improve grain quality in areas with low distribution of grain quality.
Based on the above research conclusions, the following recommendations are put forward. First, it is necessary to continuously promote high-standard farmland construction and implement special action for cultivated land protection. There is a need to increase the funds for land consolidation. It is essential to design a standard system of input–output benefits of market funds and encourage village collective economic organizations or other new agricultural business entities to participate in high-standard farmland construction. By continuously improving the conditions of agricultural infrastructure and strengthening the protection and construction of cultivated land, the cultivated land quality will be optimized and improved. Second, it is necessary to focus on key technologies and encourage farmers to adopt environmentally friendly technologies. By strengthening financial and policy support, farmers’ enthusiasm for adopting innovative green technologies for grain production can be continuously improved. At the same time, to effectively improve grain quality and comprehensive benefits it is necessary to provide support in technical training and financial subsidies to grain operators who have reached a certain planting scale and demonstrated outstanding business performance. Third, we should accelerate the cultivation of diversified agricultural machinery service providers and enhance the ability of agricultural mechanization operations. Relying on the advantages of agricultural resources in various regions, we should build multiple service centers that undertake agricultural machinery services and technical guidance, and focus on cultivating new regional agricultural machinery services. In the meantime, focusing on the key production links of grain crops, we should use agricultural mechanization instead of labor to realize the application of technologies such as deep loosening and plowing. It is also necessary to strengthen the level of agricultural mechanization in the whole process to increase the efficiency of each production link and improve grain quality.

Author Contributions

Conceptualization, Y.G. and Y.C.; methodology, Y.G. and Y.Z.; software, Y.G. and Y.C.; validation, Y.G. and Y.Z.; formal analysis, Y.G., Y.Z. and Y.C.; resources, Y.G.; writing—original draft preparation, Y.G. and Y.Z.; writing—review and editing, Y.G. and Y.C.; visualization, Y.G., Y.Z. and Y.C.; supervision, Y.Z.; funding acquisition, Y.G. All authors have read and agreed to the published version of the manuscript.

Funding

This research was funded by the National Social Science Foundation of China (Grant No. 21AZD032) and National Social Science Foundation of China (Grant No. 20AGL023).

Institutional Review Board Statement

Not applicable.

Informed Consent Statement

Not applicable.

Data Availability Statement

The data presented in this study are available on request from the author.

Acknowledgments

We gratefully acknowledge financial support from the National Social Science Foundation of China (Grant No. 21AZD032) and National Social Science Foundation of China (Grant No. 20AGL023).

Conflicts of Interest

The authors declare no conflict of interest.

References

  1. Qiu, H. Research on Ownership in Basic Socialist Economic System. Res. Marxist Theory 2022, 8, 53–65. [Google Scholar]
  2. Chen, Z.; Guo, Q.; Jiang, H. Residents’ Food Consumption Upgrading and the China’s Agricultural Transformation. Res. Mod. Econ. 2018, 444, 120–126. [Google Scholar]
  3. Chang, X. Guaranteeing National Food Security Under the Background of Rural Revitalization—Contradiction Analysis and Solving Strategy. Jiang-huai Trib. 2019, 297, 43–48. [Google Scholar]
  4. Hu, X.; Dai, M. Effects of High-standard Farmland Construction Policies on Food Production. J. Huanan Agric. Univ. (Soc. Sci. Ed.) 2022, 21, 71–85. [Google Scholar]
  5. Liang, Z.; Zhang, L.; Zhang, J. Land Consolidation and Fertilizer Reduction—Quasi-natural Experimental Evidence from China’s Well-facilitated Capital Farmland Construction. China’s Rural Econ. 2021, 436, 123–144. [Google Scholar]
  6. Chen, Y.; Wang, S. Evaluation of Agricultural Carbon Emission Reduction Effect of Agricultural Comprehensive Development Investment. Agric. Technol. Econ. 2023, 338, 67–80. [Google Scholar]
  7. Xu, R.; Zhan, Y.; Zhang, J.; He, Q.; Zhang, K.; Xu, D.; Qi, Y.; Deng, X. Does Construction of High-standard Farmland Improve Recycle Behavior of Agricultural Film?—Evidence from Sichuan, China. Agriculture 2022, 12, 1632. [Google Scholar] [CrossRef]
  8. Peng, J.; Zhao, Z.; Chen, L. The Impact of High-standard Farmland Construction Policy on Rural Poverty in China. Land 2022, 11, 1578. [Google Scholar] [CrossRef]
  9. Peng, Y.; Lang, W.; Amar, R.; Ting, T.; Qing, Z.; Azhar, A. Policy Impacts of High-Standard Farmland Construction on Agricultural Sustainability: Total Factor Productivity-Based Analysis. Land 2023, 12, 283. [Google Scholar]
  10. Zhang, Z.; Zhou, Y.; Ding, X. Impact of Well-Facilitated Capital Farmland Construction Programs on Green Agricultural Development. J. Agro-For. Econ. Manag. 2023, 103, 113–122. [Google Scholar]
  11. Zhang, L.; Liang, Z.; Pu, Y. Effect and Improvement of Soil Testing and Formulated Fertilization Technology in the Yangtze River Economic Belt—An Empirical Analysis of Rice Planting in Yunnan, Hubei and Jiangsu provinces. J. Huazhong Agric. Univ. (Soc. Sci. Ed.) 2021, 40, 30–42. [Google Scholar]
  12. Zhao, Y.; Sun, X. Does the Construction of High-standard Farmland Help Promote the Cultivation of New Professional Farmers—Evidence from Villages. Rural. Econ. 2022, 474, 135–144. [Google Scholar]
  13. Wu, S.; Zhu, H.; Lu, X.; Zhang, C.; Zhao, J.; Meng, S. Different Modes of Land Consolidation, Farmland Fragmentation and Farmers’ Ecological Production Behavior—Take Application of Pesticides and Fertilizers as Examples. J. China Agric. Res. Regio. Plan. 2023, 1–11. Available online: https://kns.cnki.net/kcms/detail/11.3513.S.20230330.0855.002.html (accessed on 20 August 2023).
  14. Chu, D. Innovation Mechanism of Agricultural Green Technology Based on Public Goods Attributes. J. Huanan Agric. Univ. (Soc. Sci. Ed.) 2022, 21, 23–32. [Google Scholar]
  15. Wang, J.; Long, F. The Impact of Value Cognition and Institutional Environment on the Quality and Safety Control Behavior of Major Producers of Grain and Its Intergenerational Differences. J. Hunan Agric. Univ. (Soc. Sci. Ed.) 2023, 24, 15–24. [Google Scholar]
  16. Fan, C.; Li, Y.; Wang, Z. Thinking and Countermeasure on Supply-Side Structural Reform of the Grain Industry in the Background of High-quality Development—Taking ShanDong Province for Example. Agric. Econ. Issues 2022, 515, 42–56. [Google Scholar]
  17. Han, Y.; Chen, Y.; Chen, Z. Progress of High-standard Farmland Construction in China and Suggestions for Policy Improvement—Comparing China’s Agricultural Modernization Goals with the Experiences and Lessons of the United States, Germany and Japan. Rural. Econ. 2022, 475, 20–29. [Google Scholar]
  18. Xie, X.; Zhu, J. The Analysis on Regional Differences of the Factors Affecting Cultivated Land Quality and the Improvement Paths—A Case Study of Xinzheng County, Henan Province. China Land Sci. 2017, 31, 70–78. [Google Scholar]
  19. Li, X.; Wu, K.; Chu, X.; Yang, Q.; Zhang, X.; Hao, S. Research Progress and Prospects for Cultivated Land Productivity Evaluation. China Land Sci. 2019, 33, 91–100. [Google Scholar]
  20. Xie, W.; Chen, T.; Liu, G. Analysis on Technology Adoption Difference of Farmers’ Farmland Quality Protection under the Background of Rural Revitalization. Reform 2018, 297, 117–129. [Google Scholar]
  21. Qian, L.; Liu, C.; Zheng, L.; Qian, W. How Does High-standard Farmland Construction Affect Farmland Transfer. China Land Sci. 2023, 37, 62–70. [Google Scholar]
  22. Wang, X.; Yamauchi, F.; Huang, J. Rising Wages, Mechanization, and the Substitution Between Capital and Labor—Evidence from Small Scale Farm System in China. Agric. Econ. 2016, 47, 309–317. [Google Scholar] [CrossRef]
  23. Cai, J.; Liu, W. Agricultural Social Service and Opportunistic Behavior—Take Agricultural Machinery Operation Services as Example. Reform 2019, 301, 18–29. [Google Scholar]
  24. Tian, X.; Li, W.; Li, R. The Environmental Effects of Agricultural Mechanization—Evidence from Agricultural Machinery Purchase Subsidy Policy. China’s Rural Econ. 2021, 441, 95–109. [Google Scholar]
  25. Gong, Y.; Zhang, Y. Influence of Well-facilitated Capital Farmland Construction Policy on Grain Productivity. J. Huazhong Agric. Univ. (Soc. Sci. Ed.) 2023, 4, 175–190. [Google Scholar]
  26. Qi, D.; Qi, H.; Fan, Q. Construction of Evaluation Index System for High-quality Development of Grain Industry. Stat. Decis.-Mak. 2022, 38, 106–110. [Google Scholar]
  27. Yu, X.; Su, Q.; Gong, Y.; Li, D. Research on the Spatial Effect of Agricultural Product Quality Certification on Agricultural Economic Growth. Res. Sci. Technol. Manag. 2021, 41, 93–99. [Google Scholar]
  28. Yang, J.; Lei, Y. The Construction, Measurement and Policy Suggestions of China’s Grain Security Evaluation Index System. Rural. Econ. 2014, 379, 23–27. [Google Scholar]
  29. Wang, R.; Li, S.; Wang, H.; Li, J. Evaluation and Realization Path of High Quality Development of China’s Grain Industry. Stat. Decis.-Mak. 2020, 36, 93–97. [Google Scholar]
  30. Chen, L.; Michael, R. The Effect of Seeds Quality Improvement on Maize Yield. J. Huanan Agric. Univ. (Soc. Sci. Ed.) 2016, 15, 19–27. [Google Scholar]
  31. Kong, F.; Guo, Q.; Pan, D. Evaluation on Overfertilization and Its Spatial-Temporal Difference about Major Grain Crops in China. Econ. Geogr. 2018, 38, 201–210. [Google Scholar]
  32. Zhang, L.; Luo, B. Agricultural Chemical Reduction—The Logic and Evidence-Based on Farmland Operation Scale of Households. China’s Rural Econ. 2020, 422, 81–99. [Google Scholar]
  33. Xue, C.; Shi, X.; Zhou, H. Influence Path of Agricultural Mechanization on Total Factor Productivity Growth in Planting Industry. Agric. Technol. Econ. 2020, 306, 87–102. [Google Scholar]
Figure 1. Grain quality improvement mechanism of high-standard farmland construction policy.
Agriculture 13 01702 g001
Figure 2. The proportion of land consolidation area and grain quality.
Agriculture 13 01702 g002
Figure 3. Dynamic influence of the high-standard farmland construction policy on grain quality.
Agriculture 13 01702 g003
Table 1. Grain quality evaluation index system.
Evaluation DimensionEvaluating IndicatorDefinitionIndicator Direction
NutritionHigh-quality rate of unprocessed grainThe proportion of rice quality, wheat quality, maize quality, and soybean whole grain rate higher than the middle level is added and then averaged (%)Positive index
Number of green grain certificates obtainedNumber of green agricultural product certificates obtained in that year × proportion of green grain in green agricultural products (PCS)Positive index
SecurityPesticide residues per unit of grain productionPesticide loss coefficient × pesticide application amount/total grain production (G/kg)Negative index
Table 2. Descriptive statistics of variables.
VariableUnitMeanS.D.
Grain quality-0.6440.165
The proportion of land consolidation area-0.3370.201
Disaster rate%34.87121.430
Agricultural planting structure%65.15012.350
Per capita income of the grain industryCNY ten thousand per person0.1390.093
Financial support for agriculture level-0.0980.034
Average education level of the rural labor forceyear7.2670.889
Deviation degree of average temperature°C0.4700.405
Grain retail price index-105.5967.058
Cultivated land areaHundred million mu0.6330.457
Variety-improvement technology-1.4390.443
Effective irrigation area of grainTen thousand hectares130.146109.630
Environmentally friendly technology adoption-0.6570.475
Cultivated land quality-0.2930.155
Adoption level of agricultural mechanization-0.4840.155
Table 3. Baseline estimation results.
Variable(1)(2)(3)
L c o n s o l i d i × I t p o s t 0.074 *** (0.016)0.074 *** (0.026)0.074 ** (0.028)
Disaster rate−0.001 ** (0.001)−0.001 ** (0.001)−0.001 *** (0.001)
Agricultural planting structure0.001 * (0.006)0.001 (0.001)0.001 ** (0.001)
Per capita income of the grain industry0.018 (0.045)0.018 (0.062)0.018 (0.025)
Financial support for agriculture level−0.111 (0.106)−0.111 (0.137)−0.111 * (0.055)
Average education level of the rural labor force0.016 * (0.008)0.016 * (0.009)0.016 ** (0.007)
Deviation degree of average temperature0.002 (0.005)0.002 (0.005)0.002 (0.006)
Grain retail price index0.001 (0.001)0.001 (0.001)0.001 (0.001)
Cultivated land area−0.133 *** (0.035)−0.133 ** (0.062)−0.133 *** (0.034)
Variety-improvement technology0.044 *** (0.007)0.044 * (0.026)0.044 *** (0.006)
Effective irrigation area of grain0.001 *** (0.001)0.001 ** (0.001)0.001 ** (0.001)
Constant0.447 *** (0.078)0.447 *** (0.094)0.447 *** (0.085)
Year effectYesYesYes
Provincial effectYesYesYes
Observations496496496
R 2 0.5260.5260.526
Note: The standard error is in brackets, and ***, ** and * represent the significance levels of 1%, 5% and 10% respectively.
Table 4. Regression results of dynamic policy effects.
VariableRegression Coefficient
L c o n s o l i d × 2002 0.020 (0.017)
L c o n s o l i d × 2003 0.020 (0.015)
L c o n s o l i d × 2004 −0.008 (0.015)
L c o n s o l i d × 2005 0.001 (0.015)
L c o n s o l i d × 2006 0.010 (0.014)
L c o n s o l i d × 2007 0.011 (0.013)
L c o n s o l i d × 2008 0.006 (0.012)
L c o n s o l i d × 2009 0.012 (0.013)
L c o n s o l i d × 2010 0.008 (0.006)
L c o n s o l i d × 2012 0.016 ** (0.008)
L c o n s o l i d × 2013 0.022 ** (0.008)
L c o n s o l i d × 2014 0.026 ** (0.011)
L c o n s o l i d × 2015 0.029 ** (0.011)
L c o n s o l i d × 2016 0.048 *** (0.014)
L c o n s o l i d × 2017 0.045 *** (0.014)
Constant0.364 *** (0.123)
Control variablesYes
Year effectYes
Provincial effectYes
Observations496
R 2 0.502
Note: The standard error is in brackets, and ***, ** represent the significance levels of 1% and 5% respectively.
Table 5. Robustness Test estimation results.
VariableExplanatory Variable Lags for One PeriodReplacing Core Explanatory VariablesChanging the Timing of Policy ImplementationConsidering Other Relevant Policies’ Interference
Select 2005Select 2006Green Ecological PolicyLand Transfer PolicyLand Confirmation Policy
(1)(2)(3)(4)(5)(6)(7)
L c o n s o l i d i × I t p o s t 0.069 ***
(0.025)
0.054 **
(0.021)
0.048 **
(0.023)
0.050 **
(0.024)
I n v e s t i × I t p o s t 0.096 **
(0.047)
L c o n s o l i d i × I t p o s t   2005 0.085
(0.088)
L c o n s o l i d i × I t p o s t   2006 0.094
(0.089)
Land transfer policy 0.001
(0.001)
Land confirmation policy 0.001
(0.001)
Constant0.439 ***
(0.108)
0.417 ***
(0.082)
0.616 ***
(0.140)
0.611 ***
(0.134)
0.543 ***
(0.096)
0.373 ***
(0.111)
0.340 ***
(0.118)
Control variablesYesYesYesYesYesYesYes
Year effectYesYesYesYesYesYesYes
Provincial effectYesYesYesYesYesYesYes
Observations465496279279403390390
R 2 0.5160.5070.2530.2650.4140.5150.514
Note: The standard error is in brackets, and ***, ** represent the significance levels of 1% and 5% respectively. The data for the total area of household contracted farmland transfer, the area of household contracted farmland, the number of land contractual management rights certificates issued, and the number of household contracted farmers come from the Statistical Annual Report of Rural Management in China (2005–2017), but Tibet is not included. The observations in columns (6) and (7) are 390 in total.
Table 6. C-D production function estimation results.
VariableGrain Production (Logarithm)
CoefficientStandard Error
Fertilizer input (logarithm)0.135 ***0.034
Labor input (logarithm)0.106 **0.049
Agricultural machinery input (logarithm)0.034 **0.017
Seed and pesticide input (logarithm)0.129 ***0.014
Constant5.282 ***0.107
Observations496
R 2 0.5367
Note: The ***, ** represent the significance levels of 1% and 5% respectively.
Table 7. The moderating effect of environmentally friendly technology adoption.
Variable(1)(2)(3)
L c o n s o l i d i × I t p o s t 0.068 ***
(0.015)
0.076 ***
(0.016)
0.073 ***
(0.016)
L c o n s o l i d i × I t p o s t × environmentallyfriendly technology adoption0.059 ***
(0.016)
0.043 ***
(0.016)
0.044 ***
(0.016)
Environmentally friendly technology adoption0.014 *
(0.008)
0.016 **
(0.008)
0.015 *
(0.008)
Constant0.599 ***
(0.028)
0.381 ***
(0.079)
0.471 ***
(0.077)
Control variablesNoYesYes
Year effectYesYesYes
Provincial effectNoNoYes
Observations496496496
R 2 0.4690.5370.544
Note: The standard error is in brackets, and ***, ** and * represent the significance levels of 1%, 5% and 10% respectively.
Table 8. The mediating effect of cultivated land quality and adoption level of agricultural mechanization.
VariableGrain QualityCultivated Land QualityAdoption Level of Agricultural MechanizationGrain Quality
(1)(2)(3)(4)(5)
L c o n s o l i d i × I t p o s t 0.074 ***
(0.016)
0.063 ***
(0.019)
0.114 ***
(0.019)
0.067 ***
(0.016)
0.044 ***
(0.016)
Cultivated land quality 0.120 ***
(0.038)
Adoption level of agricultural mechanization 0.265 ***
(0.037)
Constant0.395 ***
(0.084)
0.529 ***
(0.103)
0.500 ***
(0.102)
0.332 ***
(0.086)
0.263 ***
(0.082)
Control variablesYesYesYesYesYes
Year effectYesYesYesYesYes
Provincial effectYesYesYesYesYes
Observations496496496496496
R 2 0.9550.9240.9250.9560.960
Note: The standard error is in brackets, and *** represents the significance levels of 1%.
Table 9. High-standard farmland construction policy, cultivated land quality, and grain quality in the different grain-producing areas.
VariableThe Major Grain-Producing AreasNon-Major Grain-Producing Areas
Grain QualityCultivated Land QualityGrain QualityGrain QualityCultivated Land QualityGrain Quality
(1)(2)(3)(4)(5)(6)
L c o n s o l i d i × I t p o s t 0.127 **
(0.054)
0.108 ***
(0.040)
0.100 *
(0.054)
0.061 ***
(0.017)
0.099 ***
(0.016)
0.043 **
(0.018)
Cultivated land quality 0.249 **
(0.102)
0.189 ***
(0.066)
Constant0.584 ***
(0.171)
0.224 *
(0.128)
0.529 ***
(0.170)
0.439 ***
(0.100)
0.803 ***
(0.095)
0.288 **
(0.112)
Control variablesYesYesYesYesYesYes
Year effectYesYesYesYesYesYes
Provincial effectYesYesYesYesYesYes
Observations208208208288288288
R 2 0.9250.9160.9270.9500.9780.952
Note: The standard error is in brackets, and ***, ** and * represent the significance levels of 1%, 5% and 10% respectively.
Table 10. High-standard farmland construction policy, the adoption level of agricultural mechanization, and grain quality in different grain-producing areas.
VariableThe Major Grain-Producing AreasNon-Major Grain-Producing Areas
Grain QualityAdoption Level of Agricultural MechanizationGrain QualityGrain QualityAdoption Level of Agricultural MechanizationGrain Quality
(1)(2)(3)(4)(5)(6)
L c o n s o l i d i × I t p o s t 0.127 **
(0.054)
0.146 *
(0.083)
0.101 *
(0.052)
0.061 ***
(0.017)
0.121 ***
(0.023)
0.031 *
(0.017)
The adoption level of agricultural mechanization 0.181 ***
(0.048)
0.253 ***
(0.045)
Constant0.584 ***
(0.171)
−0.081
(0.264)
0.599 ***
(0.165)
0.439 ***
(0.100)
0.516 ***
(0.135)
0.309 ***
(0.097)
Control variablesYesYesYesYesYesYes
Year effectYesYesYesYesYesYes
Provincial effectYesYesYesYesYesYes
Observations208208208288288288
R 2 0.9250.7710.9300.9500.7890.956
Note: The standard error is in brackets, and ***, ** and * represent the significance levels of 1%, 5% and 10% respectively.
Table 11. Quantile regression results of grain quality.
Variable0.1 Quantile0.5 Quantile0.9 Quantile
L c o n s o l i d i × I t p o s t 0.059 ***
(0.023)
0.053 **
(0.024)
0.048 *
(0.027)
Constant0.373 ***
(0.123)
0.384 ***
(0.122)
0.716 ***
(0.137)
Control variablesYesYesYes
Year effectYesYesYes
Provincial effectYesYesYes
Observations496496496
P s e u d o   R 2 0.8670.7910.810
Note: The standard error is in brackets, and ***, ** and * represent the significance levels of 1%, 5% and 10% respectively.
Disclaimer/Publisher’s Note: The statements, opinions and data contained in all publications are solely those of the individual author(s) and contributor(s) and not of MDPI and/or the editor(s). MDPI and/or the editor(s) disclaim responsibility for any injury to people or property resulting from any ideas, methods, instructions or products referred to in the content.

