Abstract
Trade market power serves as a significant indicator of pricing power within the trade market. This paper aims to examine the market structure of global forage trade from 1997 to 2020 and assess the market power of forage exporters in major importing countries, namely Japan, China, and South Korea, by utilizing an extended G-K model based on the theory of residual elasticity of demand. The findings of this analysis provide several key insights. Firstly, it is revealed that the United States and Australia hold a monopoly on forage trade, while China has emerged as the most pivotal market for worldwide forage trade. Notably, China’s growing demand for forage imports is profoundly influencing the global forage trade landscape. Secondly, the extent and effectiveness of exporting countries’ market power in forage-importing nations, such as China, varies considerably. Lastly, the market power of forage-exporting countries is determined by various factors, including the demand for forage in importing nations, export monopoly, import structure, demand elasticity, and the level of marketization.
1. Introduction
The continuous progression of human dietary patterns towards enhanced nutrition, health, and safety has resulted in a growing global demand for animal-derived food products, including meat, eggs, and milk [1,2]. This paradigm shift has notably fostered the advancement of animal husbandry, particularly in the domain of grass-fed livestock, across various nations. Moreover, as the food system undergoes transformation, ensuring the quality and safety of animal-based products has emerged as a significant international concern [3,4]. In fact, since the 1990s, several incidents and scandals pertaining to food safety have occurred within the global supply chain of animal-based products. Illustrative examples encompass the outbreak of “Mad Cow Disease” in Europe in 1989, instances of “Salmonella” contamination in the USA in 1993 and 2008, and the “Tainted Milk Powder” incident in China in 2008. These events have heightened awareness about the pivotal role of high-quality forage in safeguarding the quality and safety of animal-based food [5]. High-quality forage grasses, such as alfalfa, serve as a vital protein source for grass-fed animals, boasting a crude protein content of up to 20%. This equates to 3–5 times the nutritional value of wheat cultivated on the same land area and approximately 4–8 times more protein [6]. The utilization of high-quality forage not only enhances the nutritional intake and well-being of grass-fed animals, thereby reducing the necessity for veterinary intervention, but also augments the yield and quality of animal products. Ultimately, this contributes to the overall safety of these products. Consequently, high-quality forage grasses have assumed an indispensable foundation in the modern grass-fed animal industry [7].
Due to constraints in natural resources, capital, cultivation practices, technology, and equipment, forage production in numerous countries falls significantly short of meeting the rapidly growing demand. In the context of ongoing globalization and its impact on agricultural trade, the importance of forage trade is steadily increasing. This trade significantly impacts the agricultural economic development of countries and the safety of animal-origin food products [8]. According to data from the UN Comtrade Database, global forage exports saw a remarkable growth of 117% from 3.4 million tons in 1997 to 7.38 million tons in 2020. Developing countries in the Asia-Pacific region, with China at the forefront, are the main drivers behind the growing global forage imports. Globally, most countries actively or passively participate in the international forage trade system. Their participation aims to achieve economic benefits through foreign trade, meet domestic demand, or establish international access to high-quality forage surplus and deficit transfers. In this trade-centric systemic environment, the quality and safety standards of animal-origin food products in each country are directly impacted. Despite notable fluctuations in the demand market for forage, the USA and Australia have consistently maintained their dominance as major global exporters of forage products. Market pricing power is a critical factor that directly influences a country’s capacity to reap the benefits of international forage trade. The presence of international market pricing power in forage trade significantly determines a country’s success in this domain, serving as a crucial indicator of market influence [9].
Market power, defined as the ability to maintain prices above marginal costs, has attracted attention in both industrial organization theory and international trade theory. Research suggests that the existence of international market power in a country improves its welfare [10,11,12,13]. However, there is no unified definition of international market power. In this paper, international market power is defined as the ability of an importing or exporting country to negotiate for traded goods in order to promote its market interests within an open market economy. Generally, three primary methods are used to measure market power. The first method involves structural market indicators, which can be challenged because high market shares do not always indicate market power and low market shares do not necessarily imply the absence of market power [14]. The second method is based on an index of market performance, with the Lerner index being the most notable example [15]. However, obtaining direct information on marginal costs can be challenging, which limits the practical applicability of this method. The third method utilizes models based on the new empirical industrial organization theory, including the price-marginal cost model (PCM) [16,17,18,19], the price-to-market model (PTM) [20,21,22,23], and the residual elasticity of demand model (RDE) [24,25,26]. These models are based on different research assumptions and vary significantly in terms of the subjects and data they consider [27,28]. The models based on the new empirical industrial organization theory offer more logical reasoning and provide more precise findings. Goldberg and Knetter (1999) expanded the RDE model, leading to the G-K model [29]. This model extends the scope of application from individual firms to industries and proposes a methodology for measuring market power in international trade on an industry level. Consequently, this method is widely used in studies exploring export market power [30].
The import and export market of agricultural products is a typical example of an imperfectly competitive market. Existing research on international trade of agricultural products primarily focuses on staple food crops like wheat [31], corn [32], and soybeans [33,34]. However, studies investigating the international trade of forage and its associated market power are relatively scarce. Given the increasing competitiveness within the global forage market and the significant shifts in the patterns of forage import trade, it is crucial to examine the changes in the competitive structure and market pricing power of the international forage trade market. This raises several questions: How do these changes manifest? Does every major forage-exporting country possess a seller’s trade market power? Are there variations in the seller’s market power of the same forage-exporting country across different forage-importing countries? What factors contribute to the establishment of pricing power in international forage trade? The answers to these inquiries have significant implications for understanding the competitive structure of the global forage import market, assessing the trajectory of world forage trade, and formulating relevant forage trade policies for importing countries. Therefore, this paper aims to do the following: (1) scrutinize the structure of the global forage import market; (2) investigate the state of the world forage export market; (3) employ an expanded G-K model to measure and comparatively analyze the market power of major forage-exporting nations, such as the United States, in key importing countries, such as China; (4) explore the influencing factors that affect the market power of forage-exporting nations through relevant empirical surveys.
The research objectives and contributions of this paper are as follows: (1) providing an overview of the structure of the world pasture trade; (2) analyzing the competitive structure of the world pasture trade; (3) proposing and utilizing the extended G-K pasture trade model to calculate the market power of major pasture-exporting countries, and analyzing and comparing the reasons for the formation of market power; (4) discussing the impacts of this competitive structure on the governments of importing countries and on agribusiness enterprises; (5) discussing the impacts of the market power of exporting countries on the markets of exporting countries, and exploring ways in which pasture-importing countries can address market power in pasture-exporting countries.
2. Materials and Methods
2.1. Theoretical Framework
Market power refers to the ability of a vendor to set prices for a product that exceed its marginal cost. In a perfectly competitive market, individual vendors price their products at the marginal cost and therefore have no market power. However, in imperfectly competitive markets, the extent to which a vendor’s product is priced above its marginal cost can be measured using the Lerner index. Estimating the level of market power directly in empirical studies can be challenging due to the lack of reliable data on the marginal cost of a thousand units. In antitrust cases, market power is often determined based on a vendor’s market share, as it is assumed that market share is indicative of market power. However, it is important to note that even if a manufacturer has a large market share, they may not have market power if the elasticity of demand for their product is infinite and the price is equal to the marginal cost. On the other hand, even a manufacturer with a small market share can use differentiation strategies to charge prices higher than the marginal cost of the product.
Goldbetg and Kenetter (1999) proposed the G-K model, a single-equation methodology for measuring market power. This model has the advantage of not relying on vendor-level trade data, which is often challenging to obtain and necessary for alternative estimations of vendor market power in domestic and international trade.
Assuming that several export enterprises in a country export the same goods at the price of to a certain market ( is expressed in the currency of export destination), the total export quantity is , is the price of competitive goods of enterprises in other countries, and represents the demand of the importer. Then, the demand functions of the products of this group of export enterprises and competitors in other countries are expressed as follows:
In Equation (2), the j = 1, …, n and j ≠ k. The profit maximization of exporting manufacturer i can be expressed in the following equation:
In Equation (3), e represents the exchange rate of the currency of the importing country against the currency of the exporting country, qiex represents the quantity of product exported by exporter i, and Ciex represents the cost of producing the product of exporting manufacturer i. When the marginal income equals the marginal cost, that is to say, , the profit reaches the maximum.
In Equation (4), represents the marginal cost of export products, represents the first partial derivative of product demand function (Equation (1)), , represents the competitive behaviors among different export enterprises in the exporting country, and + represents the competitive behaviors between enterprises in the exporting country and competitors in other countries. The calculation of Equation (4) requires data on exporters. However, for the forage industry, data on individual exporters are not available. According to Goldberg and Kenetter (1999) [29], the corresponding parameter in the G-K model represents the industry’s market mean—a weighted average of the relevant data for each exporter within the exporting country under study. Therefore, aggregated data at the industry or country level can serve as a proxy by treating the aggregated data as a weighted average. This is accomplished using the market share of exporter i, si, as the weight. Assuming that the market share of exporter i is si, multiplying the market share by Equation (4) and summing the results across all vendors yields the following equation:
If workers, si = 1, qiex = si Qiex, then the profit maximization condition can be expressed in the form estimated using market-level data.
In Equation (6), , denotes the average marginal cost of the product, and , denotes the behavior of the exporting firm as a whole. Similarly, the profit-maximizing condition for foreign competing manufacturers can be expressed as follows:
In Equation (7), is the behavioral parameter of the kth competing firm. In the above model, the demand curve is arbitrary, i.e., it is possible for a product to be a perfect substitute or not. Similar to the demand curve, the supply curve is also arbitrary. The relevant parameters θ and Ø indicate the strategies of the vendors competing with each other, and they vary between 0 and 1, where 0 represents a perfectly competitive market structure and l represents the case of a perfect monopoly [29].
Using Equations (1)–(7), the surplus demand curve at the national level can be derived as follows:
In Equation (8), is the first abbreviated expression of the demand equation of the first competitor, represents the ensemble of production cost transfers for all manufacturers, Z is the export destination’s own demand variable, and represents the ensemble of competitors’ behavioral parameters. The estimation of the product residual demand elasticity in empirical studies is mostly in the form of the following double logarithmic equation:
In Equation (9), the subscript m represents the product import market, the subscript t represents the time, and is the random error term. The other variables are defined as in Equation (8). Due to the double logarithmic form, the coefficient of interest in this paper can then be directly interpreted as the residual elasticity of demand, i.e., market power, of the exporter’s product in market m. In the case of a non-perfectly competitive market, the expected sign of the coefficient is negative. A value of zero or infinitely close to zero indicates that the exporting country does not have any market power and that its export price is not determined by its export volume but entirely by other variables, when the market is perfectly competitive [29]. The larger the absolute value of , the greater the market power possessed by the exporting country, i.e., the greater the ability to profitably raise the price of the product above marginal cost.
2.2. Model Construction and Data Sources
Building upon the problem analysis and theoretical framework laid out in the preceding sections, this paper aims to develop an extended version of the G-K model. The focal point of this model is the forage import volume of major importing nations, which serves as its central variable. Additionally, it considers various factors including forage production costs, forage demand in importing countries, and competitor behavior. The primary objective is to evaluate the market power of exporters in the prominent forage import markets across the globe, from the exporters’ perspective. Furthermore, the paper intends to analyze the influencing factors on their forage export power. The formulated empirical model for market power in international forage trade can be outlined as follows:
where i represents the forage-importing country and j represents the forage-exporting country. Pitj means the price of forage imported by country i from country j. RDitj denotes the quantity of forage imported from country j by country i. Zit denotes the demand variable for importing country i, Wkt is the production cost variable for country j’s main competitor country k (j ≠ k), Xijt are other control variables, T is the time trend variable, and εijt is the error term.
The forages discussed in this paper are defined based on the Harmonized Commodity Description and Coding System (HS) catalog. Each forage type is assigned a precise and specific definition, which adheres to the necessary criteria of product homogeneity as required by the G-K model. The key explanatory variable, imports, represents the excess demand of the importing country for the exporting country’s forage. Given the imperfectly competitive nature of the forage market, it is expected that the coefficient (denoted as α) associated with imports will be negative [29]. If α is significant and non-zero, it indicates that the exporting country possesses seller’s market power in the international arena. Moreover, the absolute value of the coefficient signifies the magnitude of market power held by the exporting country. A larger absolute value implies a greater ability to raise the price of the product above its marginal cost, thereby maximizing profitability.
The two crucial control variables in this study are the demand variable in the importing country and the cost-shifting variable in the exporting country [24]. Firstly, forage plays a vital role as a necessity for herbivores, with limited usage options and few substitutes. Consequently, the price elasticity of demand for forage is relatively low. Due to constraints in land, capital, equipment, breeding, and technology within the importing country, coupled with insufficient forage production, a substantial portion of the demand can only be fulfilled through imports. Therefore, the demand for forage in the importing country stands as the primary factor influencing market power in the exporting country. Secondly, despite the presence of monopolies, certain countries, such as Spain, are experiencing rapid growth in their forage exports. Hence, the cost-shifting variable in exporting countries also significantly influences the dynamics of market power.
In this study, the variables chosen for forage demand are gross domestic product (GDP) and dairy stock. GDP is selected due to its strong correlation with product demand and consumption capacity and its common usage as a demand variable in agricultural market power calculations. In developed countries with grass-fed livestock industries, pasture is the primary roughage for dairy cattle. Therefore, this study utilizes dairy stock as a proxy to estimate pasture demand. Instead of focusing solely on large-scale dairy farms, dairy stock is used in China because small and medium-sized dairy farms often rely on crop straw to reduce costs. Imported forage, on the other hand, is predominantly used to feed high-yielding cows in large-scale dairy farms. The cost-shifting variables for the exporting countries are selected from the consumer price index (CPI) and exchange rate levels of the main competitor countries for forage exports. The CPI reflects the level of inflation and the purchasing power of money in each country, and changes in it cause economic activity in each country’s market to adjust. The exchange rate is also considered as a cost-shifting variable as each exporting country can adjust the price of its goods in different markets through the exchange rate. Additionally, the US dollar’s real effective exchange rate is chosen as a control variable due to the significant impact of the US dollar-based currency on traded commodities. The main variables used and their data sources are presented in Table 1. To account for statistical errors, the quantity of forage exported from the US to China from 2000 to 2005 is multiplied by 1000.

Table 1.
Symbols and sources of key variables.
3. The Structure of the World Forage Market Trade and Its Evolution
While structural indicators may not be entirely accurate in measuring market power, they serve as direct indicators of market power, such as market share and market concentration, and play a crucial role in determining a manufacturer’s future potential. Similarly, even though the share of a trading country in the international forage market may not directly reflect its cost-plus capacity, it still serves as an important reference point to assess the country’s market power and pricing ability. Therefore, conducting an analysis of the structure and evolution of the global forage trade becomes crucial for understanding market power within the forage industry.
3.1. Structure of International Forage Imports
The global forage import market demonstrates significant disparities and undergoes dynamic fluctuations. Figure 1 illustrates the trends in worldwide forage imports, with a specific focus on the three major importing countries: China, Japan, and Korea, from 1997 to 2020. In 1997, Japan accounted for 82.8% of global forage imports, but this share decreased to 33.6% in 2020. From 2008 to 2020, China, Japan, and Korea collectively represented 64.6% of global forage imports. From 1997 to 2007, Japan and South Korea dominated the global forage import market, while China had minimal imports during this period. However, after 2008, China experienced a significant surge in forage imports, surpassing 1 million tons by 2014, making it the world’s second-largest forage importer. While Japan and South Korea’s import markets remain relatively stable, China’s market is undergoing rapid development and exhibiting distinct stage characteristics. Therefore, this research focuses on analyzing the Chinese forage import market.
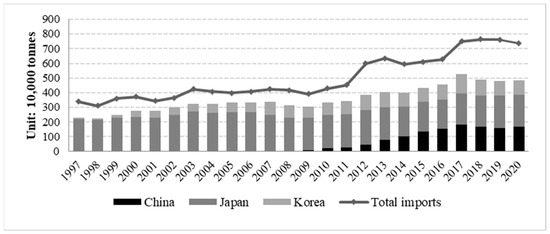
Figure 1.
Forage imports from China, Japan, and Korea and global imports from 1997 to 2020. Data source: UN Comtrade Database.
From 1997 to 2007, Japan’s total forage imports exceeded 25 million tons, accounting for 73.9% of global forage trade imports during the corresponding period. Korea’s total forage imports were below 5 million tons, securing the second position. Between 2008 and 2020, China experienced a significant increase in total forage imports, reaching approximately 12.5 million tons. During the same period, Korea’s total imports were marginally higher than China’s, while Japan’s total imports remained relatively stable. The combined imports of countries other than China, Japan, and Korea surged from less than 10 million tons to 24 million tons, indicating a notable decline in the market concentration of forage-importing nations (Figure 2).
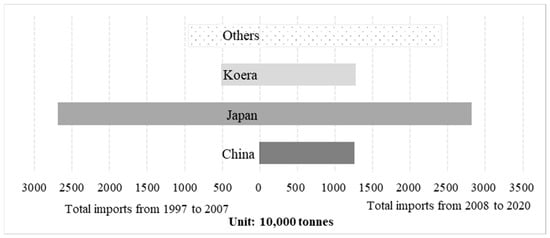
Figure 2.
Comparison of total forage imports by China, Japan, Korea, and other countries around 2008. Data source: UN Comtrade Database.
3.2. Forage Import Prices
As shown in Figure 3, there are notable variations in the prices of imported forage among major importing countries, although these differences have been gradually decreasing. Over the years, Japan has consistently experienced relatively higher average c.i.f. prices for imported forage, with fluctuations around USD 350 per ton, as compared to China and Korea. On the other hand, Korea maintains the lowest average c.i.f. price, approximately USD 300 per ton. The prices of Chinese forage exhibit significant fluctuations, positioning them between the average c.i.f. prices of the other two countries. Generally, the average c.i.f. price for all three countries falls within the range of USD 300 to 400 per ton, indicating a narrowing price difference as the forage trade market steadily progresses.
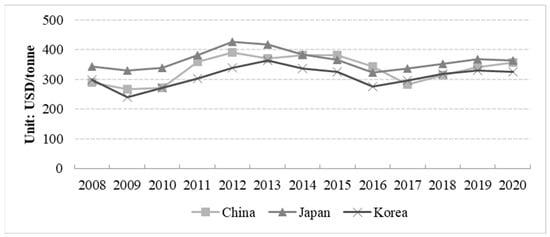
Figure 3.
Average CIF prices in China, Japan, and Korea, 2008 to 2020. Data source: UN Comtrade Database.
The high price of imported forage in Japan primarily stems from the superior quality of the imports. The majority of Japanese forage imports originate from the Pacific Northwest states (PNW) of the USA, which are known for their higher quality and correspondingly higher prices. On the other hand, Korean forages are predominantly sourced from the US Pacific Southwest states (PSW), where the forage quality is comparatively lower and prices are cheaper. In China, the fluctuation in forage prices can be attributed to three main factors. Firstly, China’s forage market is characterized by imperfections, and the import of forage is highly arbitrary. Secondly, the sources of forage imports are excessively concentrated. Initially, over 95% of China’s alfalfa products were imported from the USA, and although this figure declined later on, it still remained above 63%. Oat grass, China’s second-largest import, is completely monopolized by Australia [35]. Therefore, any changes in forage production or export policies in these regions can lead to price fluctuations. Lastly, the region into which the forage is imported also influences the prices. The density of forage is low, and transportation costs account for a significant proportion of the total costs. Regions that have a trade deficit with China, such as the Port of Los Angeles, experience a surplus of empty ships heading toward China. Consequently, forage is shipped to China at lower prices, while forage is shipped out of China at much higher prices. Even when the Free on Board (FOB) price is equal for forage from different regions, the Cost, Insurance, and Freight (CIF) price can vary considerably due to divergent freight costs.
3.3. Structure of the International Forage Export Market
From 1997 to 2020, the United States and Australia were the dominant players in the global forage export market, accounting for a substantial 73% of all global forage exports. The United States is the world’s leading exporter of alfalfa, while Australia exclusively focuses on oat grass and has exclusive access to China’s oat grass import market [36].
The data presented in Figure 4 indicate an overall upward trend in global forage export volume from 2008 to 2017, followed by stabilization. The United States consistently maintains an absolute advantage in the export share of forage grass, while Australia’s export scale has declined. China, Japan, and South Korea serve as the primary export markets for US forage products. Between 2008 and 2020, the United States exported a total of 21.310 million tons, 10.940 million tons, and 9.622 million tons of forage to Japan, South Korea, and China, respectively, with its market share surpassing 75% in each country. South Korea accounted for the largest import share, reaching 85.1%.
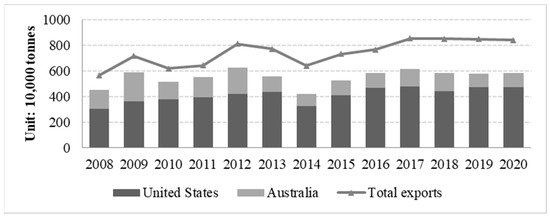
Figure 4.
US and Australian forage exports and total global exports, 2008 to 2020. Data source: UN Comtrade Database.
In recent years, Australian forage has been primarily exported to Japan, Korea, and China, with market shares of 33.1%, 23.3%, and 17.0%, respectively. While the market share of Australian forage grass in Japan has declined significantly, it has considerably increased in China. The market shares of all three major importing countries have remained relatively stable, at around 20%, in recent years.
4. Empirical Tests and Analysis of Results
This paper focuses on analyzing the market power of exporters in the forage import markets of China, Japan, and Korea. The research is based on the forage trade data between these three major importing countries and the top ten exporting countries. The objective is to evaluate and compare the factors contributing to the formation of market power in these countries.
As the sample data consist of long panel data spanning 10 countries and 23 years, there is a possibility of pseudo-regression. Therefore, it is necessary to perform a data stationarity test. The panel data for each country are found to be a smooth series, suggesting no presence of pseudo-regression. To account for the potential endogeneity between trade volumes and import and export prices, this paper employs instrumental variables. Following a common treatment, a lagged term of trade volumes is introduced as the first instrumental variable [37]. Additionally, drawing from the concept of using the third power of the difference between the endogenous variable and its mean as the instrumental variable in prior studies [38], the third power of the difference between forage imports and its mean is selected as the second instrumental variable. Correlation tests are conducted on both instrumental variables, and the results indicate that they pass the under- and over-identification tests in all models. However, some equations fail the weak instrumental variable test. Hence, this paper utilizes the limited information maximum likelihood estimation (LIML) method to address this issue [39].
The study examines data from the period 1997 to 2020. Firstly, the data from 1997 to 2020 were regressed, and subsequently, the sample was divided into two distinct periods. The two time periods considered are 1997 to 2007 and 2008 to 2020. The choice of these segments for analysis was based on two key factors. Firstly, the significant impact of the “melamine” milk powder incident in China in 2008 on the growth in demand for forage grass was considered, leading to a rapid increase in the scale of forage grass imports and causing significant changes in the international forage grass trade pattern (Figure 1). Secondly, the financial crisis that emerged in 2008 had a profound impact on the market power of the forage grass industry, as highlighted in prior research [40].
4.1. Market Power of Forage-Exporting Countries in the Chinese Forage Market
Table 2 presents the market power analysis of major forage-exporting countries in the Chinese forage market between 1997 and 2007. The initial row of Table 2 (results 2 and 5) reveals that the exporting countries possessed significantly higher market power in Chinese forage imports. For example, result (5) indicates a coefficient of −0.2986 on the volume of Chinese forage imports. This coefficient implies that a 1% decrease in foreign forage exports would result in approximately a 0.30% increase in the price of Chinese forage imports. Based on data extracted from the UN Comtrade Database, China’s forage imports only accounted for a mere 0.05% of the overall global forage imports in 2008, whereas Japan, as the largest importer, accounted for merely 0.7%. Given China’s limited share of imports and the fragmented nature of the forage import market, larger exporting countries can easily exercise control over China’s import market. This study suggests that China lacked an efficient forage market before 2008. US forage producers successfully established connections with breeding enterprises through various means, including inviting forage enterprises to visit the US, providing training to personnel of dairy breeding enterprises, and establishing scholarships at universities. These strategies allowed them to impose monopolistic pricing on their products and dominate Chinese forage imports.
Table 2.
Calculated market power of exporting countries in China.
From 2008 to 2020, exporting countries wielded significant market power in China’s forage import trade (refer to row 1 in Table 2, results 3 and 6). In result 3, the coefficient of the variable is positive but statistically insignificant. However, by addressing endogeneity concerns through the introduction of instrumental variables, the coefficient transforms to 0.15 and achieves statistical significance at the 1% level (result 6). This signifies that a 1% increase in forage export volume leads to a 0.15% increase in import prices. Consequently, as the volume of forage exports expands, the price elasticity of forage supply in the exporting country intensifies. Surprisingly, this finding contradicts our expectations as it suggests that China is progressively “buying more and more” in the forage import trade, showcasing a homogeneous relationship between the volume of forage exports and import prices.
This paper asserts that China’s rapid and significant imports of forage have brought about a fundamental change in the supply and demand relationship in the international forage market. There are four specific factors contributing to this change. Firstly, China’s demand for forage imports has become inflexible since the melamine milk powder incident in 2008. To ensure dairy product quality, the Chinese government has intensified its supervision, causing dairy farming enterprises to become increasingly strict in controlling the amount of forage added to feed. They are unwilling to reduce forage usage even if prices increase. For instance, during the 2018 US–China trade war, China imposed a 25% tariff hike on alfalfa hay imports from the US, but large-scale breeding enterprises did not substantially decrease their alfalfa usage. Consequently, alfalfa prices in China rose by 23%. The second reason is the dominant position of forage-exporting countries. China mainly imports alfalfa hay, and the US has a significantly dominant position due to its high quality, complete specifications, and punctual delivery. The third reason lies in Australia’s monopoly of oat grass, a major import species. The US and Australia’s monopoly of the Chinese import market for alfalfa and oat grass has increased their market power. Lastly, there has been a rapid and substantial increase in the import of forage grasses in China. Since 2008, China’s imports of forage grasses, particularly alfalfa with a long growth cycle, have surged. However, short-term production increases have failed to keep up with the rapidly growing market demand in China, resulting in increased forage production costs. For example, although US alfalfa exports to China since 2014 only account for about 4% of the total value of US alfalfa hay production, it still has a significant impact. This is because the major export regions for alfalfa hay are the seven Pacific West Coast states, including California, Washington, Idaho, Utah, Oregon, Nevada, and Arizona. Exports constitute more than 19% of the total production in these states, and considering the higher quality requirements for exported alfalfa, exports may account for more than 30% of the corresponding higher-grade alfalfa. Consequently, the surging demand for alfalfa exports leads to increased production costs. The rise in alfalfa cultivation costs can be attributed to three main factors. Firstly, the declining comparative advantage of alfalfa cultivation is evident in farmers’ preference for economically advantageous crops like maize and soybeans due to their rising prices. Growers will only choose to grow alfalfa at higher prices. Secondly, challenges arise from reduced water supply and higher electricity prices. High-quality alfalfa production requires significant amounts of irrigation water, resulting in rapidly escalating production costs with the increase in water and electricity prices. Lastly, political factors contribute to the rise in cultivation costs. The expansion of China’s imports has resulted in the expansion of alfalfa cultivation areas, a surge in the use of irrigation water, and subsequent reduction in other water uses. This has prompted public protests, leading the government to introduce measures such as water quotas and higher irrigation water prices in response to public demands. Consequently, production costs have increased. Furthermore, the elevated price of alfalfa has raised the cost of raising dairy cows, which has caused discontent among US dairy farmers. This, in turn, has led them to continuously pressure the government, restraining the growth of alfalfa exports.
The positive correlation between China’s GDP from 1997 to 2007 and the price of imported forage (Table 2, row 2, results (2) and (5)) suggests that the growth of China’s economy led to rising costs of imported forage within this timeframe. This can be attributed to the ongoing expansion of China’s economy and the rapid increase in income levels among its population, leading to shifts in food consumption patterns. The traditional “staple food + vegetables” pattern has been replaced by a more diverse and healthier “staple food + vegetables + grass and livestock products” pattern. This has resulted in an increase in the consumption of grass and livestock products, leading to higher demand for imported pastures and impacting the global pattern of pasture trade. On the other hand, there is an insignificant connection between China’s domestic economic changes and forage import prices in the period from 2008 to 2020 (Table 2, second row, results (3) and (6)). This is largely due to the growing number of countries that supply forage. Starting from 2014, China has gradually opened its doors to the forage market, resulting in an upward trajectory in the market share of Spanish alfalfa hay. Additionally, Mongolia offers a distinct price advantage in natural forage, Canada has regained its position as a prominent trading partner for alfalfa hay, and forage from Argentina, South Africa, and Sudan has successfully entered the Chinese market. Consequently, the number of countries supplying forage has grown, intensifying competition among exporters.
There was no correlation between the stock of dairy cows on large-scale dairy farms in China from 1997 to 2007 (Table 2, row 3, results (2) and (5)). This lack of correlation can be attributed to the predominant feed structure for dairy cows in China during this period, which prioritized cost-saving measures. The primary feed consisted of a combination of concentrate and crop straw. Furthermore, only a small number of large-scale dairy farming enterprises explored feeding cows with forage. Due to the minimal demand for forage and the underdeveloped forage market, imports were insignificant, keeping the relationship between dairy cattle stock and forage imports inconspicuous.
Table 2 shows a significant positive correlation between China’s large-scale dairy farming stock (CLit) from 2008 to 2020 and the price of imported forage. Specifically, results (3) and (6) in row 3 of the table indicate this relationship. The melamine milk powder incident in 2008 resulted in a sudden surge in the use of high-quality alfalfa imported from the US for dairy farming in China. Key players in the domestic dairy industry, along with major dairy groups, initially changed the composition of roughage, making high-quality alfalfa an essential feed for high-yielding cows in large-scale farms. This adjustment led to improved milk production and healthier cows. However, due to a significant shortage in domestic supply, China became heavily reliant on imported alfalfa. Consequently, the connection between China’s large-scale dairy farming stock and the price of forage imports grew stronger. Our survey reveals that between 2008 and 2011, over 95% of the alfalfa demand for large-scale farms in China was sourced from the US. Although the dependency has decreased since 2012, it still remains above 62%. In 2020, the US exported 2.69 million tons of alfalfa grass, marking a 1.1% increase, with an average export price of USD 334.9 per ton, indicating a 3.6% rise. Notably, exports to China showcased a significant growth rate of 39.8%, representing 43.9% of the total exports. On the other hand, exports to other countries experienced various degrees of decline. In summary, the development of China’s dairy farming industry is exerting a considerable influence on the global forage production landscape.
The Consumer Price Index (CPI) for export competitor countries from 1997 to 2007 does not exhibit any correlation with forage import prices (see row 4 of Table 2, results (2) and (5)). This lack of relationship can be attributed to the underdeveloped forage market in China during this period. During this period, countries exporting forage primarily sought new market opportunities in China. Conversely, between 2008 and 2020, the CPI of competitor countries (kt) exhibited a significant negative correlation with forage import prices (refer to Table 2, row 4, results (3) and (6)). These findings suggest that the demand for forage in competitor countries positively influences the price of imported forage in China, supporting our initial expectations.
The correlation between the real effective exchange rate (HLkt) of competitor countries’ exports and the prices of imported forage during the period from 1997 to 2007 is significantly negative (see Table 2, row 5, result (2)). This implies a level of substitution between products from exporting countries of forage during this time period. However, from 2008 to 2020, there is no correlation between the real effective exchange rate (HLkt) and forage import prices (see Table 2, row 5, result (3), (6)). This can be attributed to China’s increasing requirements for imported forage in terms of quality and specifications, limited product substitution, and a focus on compliance with US product standards, as anticipated. The relationship between the real effective exchange rate of the US dollar (HLkt) and the price of imported forage reveals different patterns at different stages (see row 7 of Table 2). This inconsistency with expectations may be associated with varying foreign exchange control policies implemented in China at different times. Additionally, the time trend variable (T) shows diverse relationships with forage import prices across different periods (see row 6 of Table 2). This suggests that other factors have varying effects on the price of imported forage in China at different times, which aligns with our expectations.
4.2. Market Power of Forage Exporters in the Japanese Forage Market
Table 3 shows the calculated market power of the top global exporters in the Japanese forage market. Before 2008, the core variable RDitj had a negative but not statistically significant coefficient (Table 3, row 1, results (2), (5)). This suggests that prior to 2008, exporters did not have market power in the Japanese forage import market. This can be attributed to the declining domestic demand for forage in the USA during this period. Dairy cattle stocks decreased, while forage yields increased due to advancements in production technology, resulting in a relative surplus of forage supply. As the largest importer of forage, Japan had buyer power, which is evidenced by a significantly negative coefficient after 2008 (Table 3, row 1, results (3), (6)), with a greater absolute adjusted coefficient of −0.23. Despite the relatively stable volume of forage imports during this period, import prices continued to increase. This is mainly attributed to the significant increase in Chinese forage imports, which increased the market power of exporting nations and reduced the import power of Japan in the global forage trade market.
Table 3.
Calculated market power of forage exporters in the Japanese market.
In contrast to China, the coefficient of the core variable RDitj in Japan is negative, indicating that the Japanese forage market is well-established and aligned with expectations. Several factors contribute to this phenomenon. Firstly, Japan boasts extensive experience in forage trade, with forage trading enterprises actively procuring forage annually from various countries worldwide, including China. These enterprises establish long-term cooperative relationships with forage exporters, fostering a highly competitive Japanese forage import market. Secondly, Japanese dairy farming enterprises possess ample reserves of dairy feeding technology, enabling them to flexibly adjust the roughage structure for dairy cows in response to forage prices. Lastly, both Japanese dairy farming enterprises and forage trading entities benefit from sufficient forage storage facilities, enhancing the price elasticity of forage demand and effectively managing short-term fluctuations in forage supply.
From 1997 to 2007, there was a significant and positive correlation between Japan’s Gross Domestic Product (GDP) and the price of imported forage. This correlation indicates that the growth of Japan’s domestic economy during this period resulted in increased consumption of grass and livestock products among the population. As a result, there was a surge in the demand for imported forage, leading to an increase in its prices. Contrary to expectations, the increase in income did not lead residents to increase their consumption of grass and livestock products.
The correlation between the Japanese dairy cattle stock (CLit) and imported pasture prices for the period 1997–2020 was found to be non-existent. This can be attributed to the inflexible demand for dairy cattle pasture in Japan, as anticipated. Moreover, the Consumer Price Index (CPI) for export-competing countries (kt) shows no correlation with the price of imported forage, suggesting that the demand for forage in competing countries does not affect the price of imported forage in Japan. This can be explained by Japan’s strict quality requirements for imported forage, with US products monopolizing the Japanese forage import market. This aligns with expectations. Similarly, the real effective exchange rate (HLkt) of competing exporting countries does not correlate with forage import prices in Japan. This reflects Japan’s high standards for imported forage and the fact that only US products meet these requirements, which aligns with expectations. Conversely, a significant negative correlation is observed between the real effective exchange rate of the US dollar (HLt) and the price of imported forage in Japan. This indicates the high degree of marketization in Japan’s forage trade, consistent with expectations. Notably, the time trend variable (T) is statistically significant for the period 2008 to 2020, suggesting that other cost or demand factors have a substantial impact on the price of imported forage in Japan during this time frame. This implies that the Japanese forage import market has become more responsive to external changes.
4.3. Market Power of Forage Exporters in the Korean Forage Market
The market power of the world’s major forage exporters in the Korean forage market was calculated as shown in Table 4. The significance of the correlation between the Korean GDP and the price of imported forage from 1997 to 2020 was found to be insignificant, suggesting that changes in the Korean domestic economy during this period were not driven by the demand for forage. Instead, the demand was influenced by the consumption habits of the Korean population and the structure of grass and livestock products. At no point in time did the price of imported forage correlate with the Korean dairy stock. This is because Korea has been able to mitigate the impact of price fluctuations by adjusting the formulation of roughage for dairy cattle. The Consumer Price Index (CPI) of forage export competitor countries between 1997 and 2008 did not correlate with the price of Korean forage imports, indicating that the demand for forage in these countries had no impact on the price of imported forage in Korea. This lack of correlation can be attributed to the low proportion of Korean forage imports relative to the exports of the competitors and the imperfections in the forage market. However, from 2008 to 2020, there was a negative correlation between the CPI of exporting competitor countries and Korean forage import prices, which was expected. The real effective exchange rate of exporting competitor countries, as measured by HLkt, did not show any correlation with forage import prices in Korea from 1997 to 2020, suggesting that there is no competition among forage-exporting countries in the Korean market. This can be attributed to the Korean forage import market access system and its operating mechanisms, which align with our expectations. On the other hand, there was a significant negative correlation between the real effective exchange rate of the US dollar (HLt) and the price of imported forage in Korea, as anticipated, indicating the high level of marketization in Korean forage trade.
Table 4.
Calculated market power of exporting countries in Korea.
The time trend variable T had a statistically significant impact, suggesting significant impacts of other cost or demand variables on the price of imported forage in Korea.
4.4. Potential Limitations in This Study
This study examined the market power of forage exporters in the major forage-importing countries, namely Japan, China, and South Korea. The study employed a precise and objective analysis method, although certain limitations exist.
First, the data in this paper have a limited time horizon due to constraints on data availability, and it does not take into account dynamic changes in the market. Additionally, any economic model, including the extended G-K model, relies on certain assumptions, which can lead to inaccuracies in its predictions and conclusions.
Second, market behavior is highly complex and influenced by various factors. This study may not consider all external factors that could impact market power, such as geopolitical events, technological advancements, or changes in consumer preferences. These factors could have a significant impact on the dynamics of the forage trade market. Furthermore, due to data limitations, these factors have not been explored thoroughly.
Lastly, this study focuses specifically on the forage trade market in Japan, China, and South Korea, and the findings may not easily apply to other industries or countries with different market conditions. Ongoing future optimization of the G-K model and the selected variables will be necessary.
5. Conclusions and Implications
5.1. Conclusions
This paper aims to measure and analyze the market power of exporting countries in the forage markets of major importers, including Japan, China, and South Korea. It accomplishes this by investigating the trade structure of the global forage market and developing an extended G-K model using the theory of residual elasticity of demand. The main research findings can be summarized as follows.
Firstly, the United States and Australia dominate the forage trade market as a duopoly, while Japan, China, and South Korea are prominent importers and exporters of forage, with a significant level of concentration. This concentration creates the potential for the development of market power.
Secondly, Japan and South Korea exhibit a more stable demand for forage, making China the most crucial market for global forage trade. The increasing demand for forage imports in China has a growing impact on the global trade pattern in this sector. Prior to 2008, China was a net exporter of forage, and exporters did not hold market power in the major forage-importing countries. However, the rapid and substantial increase in Chinese forage imports after 2008 has given exporters market power in these key import markets.
Thirdly, due to variations in the level of marketization, market development, demand structure, and storage facilities among Japan, China, and South Korea, exporting countries possess varying levels of market power and performance in these nations. By leveraging their market power, exporters can collaborate with buyers to diversify their customer base, enhance product quality, and offer differentiated products that mitigate price risks, thereby maximizing their export profits.
Finally, the demand for forage in importing countries, the presence of an export duopoly, import structure, degree of marketization, and demand elasticity are the main factors influencing the market power of forage-exporting countries.
5.2. Implications
Forage exporters, like the United States, have the ability to collaborate with importers in diversifying their forage sources, enhancing product quality, and offering differentiated products to mitigate price risk, exercise their oligopoly power, and maximize export profits.
This study has implications for importers of forage. Importers can enhance their forage self-sufficiency by expanding the planting area and investing in the capital and technology of the forage industry to reduce the market power of exporting countries. They can also increase the yield per unit of herbivores to lower breeding requirements and import prices. Diversifying the feed formula for herbivores can reduce inflexible feed demand, and expanding forage storage facilities can enhance demand elasticity.
China primarily imports forage from the global market, necessitating the establishment of new relationships with forage-exporting countries. Given the dynamic nature of China’s forage market, comprehensive scholarly research is necessary to comprehend Chinese forage imports and demand trends. Additionally, stakeholders and scholars must gain a deeper understanding of the evolving demand for forage and its varieties due to the maturation of China’s large-scale dairy farms. Domestic forage production and reserve capacity should also be a focus for scholars, stakeholders, and policymakers.
Author Contributions
Conceptualization, W.W., H.G. and B.Z.; methodology, W.W. and Y.L.; software, Y.L. and Z.R.; validation, W.W. and H.G.; formal analysis, W.W.; investigation, W.W.; resources, W.W., Z.R., H.G. and B.Z.; data curation, Y.L., Z.R., H.G. and B.Z.; writing—original draft preparation, W.W. and Z.R.; writing—review and editing, Y.L.; visualization, B.Z.; supervision, W.W.; project administration, W.W.; funding acquisition, W.W. All authors have read and agreed to the published version of the manuscript.
Funding
This research was funded by National Science Foundation of China, grant number 71873130 and Special Project of National Innovation Method Work, grant number 2020IM020905-1.
Institutional Review Board Statement
Not applicable.
Data Availability Statement
The data can be found according to the corresponding data source. Scholars requesting more specific data may email the corresponding author or the first author.
Acknowledgments
The authors thank Zheng Zhihao and Liu Mingyu, China Agricultural University, for their research opinions and text modification.
Conflicts of Interest
The authors declare no conflict of interest.
References
- National Academies of Sciences, Engineering, and Medicine. Science Breakthroughs to Advance Food and Agricultural Research by 2030; National Academies Press: Washington, DC, USA, 2019. [Google Scholar]
- OECD. Agricultural Outlook 2022–2031; OECD: Paris, France, 2022. [Google Scholar]
- Henchion, M.; Hayes, M.; Mullen, A.M.; Fenelon, M.; Tiwari, B. Future Protein Supply and Demand: Strategies and Factors Influencing a Sustainable Equilibrium. Foods 2017, 6, 53. [Google Scholar] [CrossRef]
- Hawkesworth, S.; Dangour, A.D.; Johnston, D.; Lock, K.; Poole, N.; Rushton, J.; Uauy, R.; Waage, J. Feeding the world healthily: The challenge of measuring the effects of agriculture on health. Philos. Trans. R. Soc. B Biol. Sci. 2010, 365, 3083–3097. [Google Scholar] [CrossRef]
- Driehuis, F.; Elferink, S.O. The impact of the quality of silage on animal health and food safety: A review. J. Vet. Q. 2022, 4, 212–216. [Google Scholar] [CrossRef]
- Wang, M. New ideas to effectively solve the problem of food security: Focus on developing the forage industry. China Rural Econ. 2015, 12, 63–74. (In Chinese) [Google Scholar]
- Capper, J.L. Is the Grass Always Greener? Comparing the Environmental Impact of Conventional, Natural and Grass-Fed Beef Production Systems. Animals 2012, 2, 127–143. [Google Scholar] [CrossRef]
- Guo, Z.; Qin, F. An Empirical Analysis of the Role of Forage Product Trade on Grassland Quality and Livestock Production in China. Land 2022, 11, 1938. [Google Scholar] [CrossRef]
- Atkeson, A.; Burstein, A. Pricing-to-Market, Trade Costs, and International Relative Prices. Am. Econ. Rev. 2008, 98, 1998–2031. [Google Scholar] [CrossRef]
- Gonzalez-Garcia, J.; Yang, Y.C. The effect of trade on market power—Evidence from developing economies. J. Int. Trade Econ. Dev. 2022, 31, 811–834. [Google Scholar] [CrossRef]
- Jakubik, A.; Keck, A.; Piermartini, R. Trade Policy Implications of a Changing World: Tariffs and Market Power. Appl. Econ. Lett. 2022, 1–5. [Google Scholar] [CrossRef]
- Beshkar, M.; Lee, R. How does import market power matter for trade agreements? J. Int. Econ. 2022, 137, 103580. [Google Scholar] [CrossRef]
- Dai, J.W.; Li, X.; Cai, H.L. Market power, scale economy and productivity: The case of China’s food and tobacco industry. China Agric. Econ. Rev. 2018, 10, 313–322. [Google Scholar] [CrossRef]
- Iveta, R. Market Power in the Czech Banking Sector. J. Compet. 2012, 4, 143–155. [Google Scholar] [CrossRef]
- Lerner, A.P. The Concept of Monopoly and the Measurement of Monopoly Power. In Readings in Welfare Economics; Farrell, M.J., Ed.; Macmillan Education UK: London, UK, 1973; pp. 1–19. [Google Scholar] [CrossRef]
- Hall, R.E. The relation between price and marginal cost in the US industry. J. Polit. Econ. 1988, 96, 921–947. [Google Scholar] [CrossRef]
- Beccarello, M. Time series analysis of market power: Evidence from G-7 manufacturing. Int. J. Ind. Organ. 1997, 15, 123–136. [Google Scholar] [CrossRef]
- Knetter, M.M. International Comparisons of Price-to-Market Behavior. Am. Econ. Rev. 1992, 83, 473–486. [Google Scholar]
- Hall, R.E. Using Empirical Marginal Cost to Measure Market Power in the US Economy; No. w25251; National Bureau of Economic Research: Cambridge, MA, USA, 2018. [Google Scholar] [CrossRef]
- Fitzgerald, D.; Haller, S. Pricing-to-Market: Evidence From Plant-Level Prices. Rev. Econ. Stud. 2014, 81, 761–786. [Google Scholar] [CrossRef]
- Athukorala, P.; Menon, J. Pricing to market behaviour and exchange rate pass-through in Japanese exports. Econ. J. 1994, 104, 271–281. [Google Scholar] [CrossRef]
- Adolfson, M. Export price responses to exogenous exchange rate movements. Econ. Lett. 2001, 71, 91–96. [Google Scholar] [CrossRef]
- Li, X.; Liu, Z.; Yang, D.; Wei, Y.; Gong, N. Can power market reform reduce air pollution?—Evidence from prefecture-level cities in China. PLoS ONE 2023, 18, e0282124. [Google Scholar] [CrossRef]
- Song, B.; Marchant, M.A.; Reed, M.R.; Xu, S. Competitive analysis and market power of China’s soybean import market. Int. Food Agribus. Manag. Rev. 2009, 12, 21–42. [Google Scholar] [CrossRef]
- Perekhozhuk, O.; Glauben, T.; Grings, M.; Teuber, R. Approaches and methods for the econometric analysis of market power: A survey and empirical comparison. J. Econ. Surv. 2017, 31, 303–325. [Google Scholar] [CrossRef]
- Kinnucan, H.W.; Minh, N.D.; Zhang, D.J. Trade diversion and antidumping effectiveness: Insights from a residual demand model. Aust. J. Agric. Resour. Econ. 2017, 61, 324–340. [Google Scholar] [CrossRef]
- Pakes, A. Empirical tools and competition analysis: Past progress and current problems. Int. J. Ind. Organ. 2017, 53, 241–266. [Google Scholar] [CrossRef]
- Kim, S.-H.; Moon, S. A Risk Map of Markups: Why We Observe Mixed Behaviors of Markups; KIEP Research Paper No. Staff Papers; Chonbuk National University: Jeonju-si, Republic of Korea, 2014. [Google Scholar] [CrossRef]
- Goldberg, P.K.; Knetter, M.M. Measuring the intensity of competition in export markets. J. Int. Econ. 1999, 47, 27–60. [Google Scholar] [CrossRef]
- Kim, D.E.; Lim, S.S. Market Power Analysis on Shrimp Import from Tropical Asia: The Korean Case. In Proceedings of the Sustainability, Economics, Innovation, Globalisation and Organisational Psychology Conference, Singapore, 1–3 March 2023; Springer: Berlin/Heidelberg, Germany, 2023; pp. 203–214. [Google Scholar] [CrossRef]
- Pall, Z.; Perekhozhuk, O.; Glauben, T.; Prehn, S.; Teuber, R. Residual demand measures of market power of Russian wheat exporters. Agric. Econ. 2014, 45, 381–391. [Google Scholar] [CrossRef]
- Jung, J.H.; Sesmero, J.; Siebert, R. A Structural Estimation of Spatial Differentiation and Market Power in Input Procurement. Am. J. Agric. Econ. 2022, 104, 613–644. [Google Scholar] [CrossRef]
- Lv, W.H.; Ye, L.X.; Wang, L. Changes of China’s soybean import market power and influencing factors. Appl. Econ. Lett. 2022, 1–7. [Google Scholar] [CrossRef]
- Yan, J.L.; Xue, Y.J.; Quan, C.N.; Wang, B.; Zhang, Y.A. Oligopoly in grain production and consumption: An empirical study on soybean international trade in China. Ekon. Istraz. 2022, 36, 2142818. [Google Scholar] [CrossRef]
- Wang, Y.; de Boer, I.J.; Hou, Y.; van Middelaar, C.E. Manure as waste and food as feed: Environmental challenges on Chinese dairy farms. Resour. Conserv. Recycl. 2022, 181, 106233. [Google Scholar] [CrossRef]
- Seré, C.; Steinfeld, H.; Groenewold, J. World Livestock Production Systems; Food and Agriculture Organization of the United Nations: Rome, Italy, 1996. [Google Scholar]
- Wooldridge, J.M. Econometric Analysis of Cross Section and Panel Data; MIT Press: Cambridge, MA, USA, 2010. [Google Scholar]
- Lewbel, A. Constructing instruments for regressions with measurement error when no additional data are available, with an application to patents. Econometrica 1997, 65, 1201–1213. [Google Scholar] [CrossRef]
- Wu, J.M.; Bentler, P.M. Limited information estimation in binary factor analysis: A review and extension. Comput. Stat. Data Anal. 2013, 57, 392–403. [Google Scholar] [CrossRef] [PubMed]
- Chen, Y.; Yang, Z. Foreign entry and market power fluctuations in manufacturing: Competition or monopoly. China Ind. Econ. 2012, 10, 52–64. (In Chinese) [Google Scholar] [CrossRef]
- Angrist, J.D.; Pischke, J.-S. Mostly Harmless Econometrics; Princeton University Press: Princeton, NJ, USA, 2009. [Google Scholar]
Disclaimer/Publisher’s Note: The statements, opinions and data contained in all publications are solely those of the individual author(s) and contributor(s) and not of MDPI and/or the editor(s). MDPI and/or the editor(s) disclaim responsibility for any injury to people or property resulting from any ideas, methods, instructions or products referred to in the content. |
© 2023 by the authors. Licensee MDPI, Basel, Switzerland. This article is an open access article distributed under the terms and conditions of the Creative Commons Attribution (CC BY) license (https://creativecommons.org/licenses/by/4.0/).