Article

Genome-Wide Identification, Characterization, and Expression Analysis of the Geranylgeranyl Pyrophosphate Synthase (GGPPS) Gene Family Reveals Its Importance in Chloroplasts of Brassica oleracea L.

1
Department of Horticulture, Hunan Agricultural University, Changsha 410128, China
2
State Key Laboratory of Vegetable Biobreeding, Institute of Vegetables and Flowers, Chinese Academy of Agricultural Sciences, Beijing 100081, China
*
Author to whom correspondence should be addressed.
Agriculture 2023, 13(8), 1615; https://doi.org/10.3390/agriculture13081615
Submission received: 27 July 2023 / Revised: 9 August 2023 / Accepted: 14 August 2023 / Published: 16 August 2023
(This article belongs to the Section Genotype Evaluation and Breeding)

Abstract

:
GGPPS (geranylgeranyl pyrophosphate synthase) is a crucial enzyme in the terpene biosynthesis pathway. Terpenoids play essential roles in chlorophyll biosynthesis and the development of cabbage (Brassica oleracea L. var. capitata L.), a major cruciferous vegetable worldwide. However, limited information is available regarding B. oleracea GGPPS genes. In this study, we examined 10 BoGGPPS genes from the B. oleracea genome. The subcellular localization prediction suggests that BoGGPPS proteins are mainly expressed in chloroplasts and plastids. Similar BoGGPPS genes exhibited a similar structure and motif. Distribution, collinearity, and Ka/Ks analysis revealed multiple duplication events within the BoGGPPS gene family. Cabbage BoGGPPS may participate in light and hormone responses via analysis of cis-acting elements. Three-dimensional structure analysis demonstrated the abundance of α-helices and random coils among BoGGPPS members, suggesting their important functions. Based on qRT-PCR, we observed notable differences in the transcript levels of BoGGPPS genes between leaves and siliques. Bol028967 exhibited significantly higher transcript levels in WT (Wild-type) siliques compared to in Boas1 (Brassica oleracea albino silique 1), and subcellular localization analysis confirmed its expression in chloroplasts, implying its essential role in chloroplast synthesis. These findings lay the groundwork for further exploration and in-depth functional analysis of BoGGPPS genes and their relationship with terpenoids in the context of chlorophyll synthesis in B. oleracea.

1. Introduction

Terpenoids encompass a vast array of compounds that are fundamentally composed of isoprene units [1], which play a part in secondary metabolites in plants [2]. Chlorophyll, an essential pigment in plant photosynthesis, plays a crucial role in energy acquisition and nutrient accumulation. Chlorophyll biosynthesis is closely linked to the synthesis of terpenoid compounds [3,4].
The synthesis process of terpenoids in plants is regulated by multiple enzymes. Geranylgeranyl pyrophosphate synthase (GGPPS) is a key enzyme in the terpenoids’ synthesis, which catalyzes the condensation of dimethylpropenyl diphosphate (DMAPP) and isopentenyl diphosphate (IPP) to produce geranylgeranyl pyrophosphate (GGPP) [5]. GGPP serves as a fundamental precursor of various primary and secondary metabolites, including terpenoids, gibberellins, carotenoids, and chlorophyll, in plants. Additionally, GGPP plays a significant role in human health, disease treatment, and potential cancer therapies [6,7]. GGPPS genes have been the subject of extensive research in plants. Studies have reported that mutations in GGPPS genes can result in seed albinism in plants [8]. Zhou et al. (2021) conducted a study in rice and found that the recruitment protein of GGPPS controls the metabolism of chlorophyll biosynthesis [9]. Feng et al. (2023) observed that silencing a GGPPS gene led to significant reduction in cotton leaf chlorophyll content and the appearance of the albino phenotype [10]. The NnGGPPS1 gene in Nelumbo nucifera is essential for the synthesis of carotenoids and chlorophyll [11]. GGPPS genes are also explored in numerous other plant species, such as apple [12], Arabidopsis thaliana [13], Liriodendron tulipifera [14], Tripterygium wilfordii [15], and tobacco [16].
Cabbage (Brassica oleracea L. var. capitata L.) is one of the most widely cultivated vegetables worldwide. It is rich in dietary fiber that can promote human gastrointestinal motility and enhance the body’s metabolism. The cabbage yield is closely linked to seed quality, and high-quality seeds will ensure a high germination rate. During field production, we found a kind of deleterious albino silique mutant, thus named Boas1 (Brassica oleracea albino silique 1). Silique albinism adversely affects seed production and ultimately leads to reduced cabbage yields. The mutants develop silique albinism, while the other tissues grow properly, that is, the mutation is stably inherited and forms a mutant line. Recognizing the crucial role of GGPPS in chlorophyll and terpenoid synthesis, we explored the GGPPS gene family in cabbage. Ten BoGGPPS genes were identified based on the whole genome sequences of B. oleracea using bioinformatics techniques. These genes were further analyzed for their phylogenetic relationship, chromosomal position, collinear relationship, gene structure, cis-acting elements, three-dimensional structure, qRT-PCR, and subcellular localization, with the aim of revealing BoGGPPS gene roles in plant growth and development.

2. Materials and Methods

2.1. Plant Materials

Cabbage WT (Wild-type) and Boas1 (Brassica oleracea albino silique 1) used in the experiment were collected from the greenhouse of the Institute of Vegetables and Flowers, Chinese Academy of Agricultural Sciences, Beijing, China (Figure 1).

2.2. Identification of BoGGPPS Gene Family Members in B. oleracea

The genome databases of cabbage (CDS, protein sequences, and gene annotation files) were downloaded from the Brassicaceae Database (http://brassicadb.cn/#/, (accessed on 10 April 2023)), and the Arabidopsis thaliana GGPPS gene sequences were downloaded from The Arabidopsis Information Resource (TAIR, www.arabidopsis.org, (accessed on 16 April 2023)). Candidate BoGGPPS genes were obtained by using a hidden Markov model (HMM) profile of the Cytokin-bind domain from the Pfam database (Pfam: PF09265) with HMMER 3.0 (e-value < 0.01) [17]. Additionally, the GGPPS protein sequences of Arabidopsis and B. rapa were downloaded from the NCBI and used as queries in a BLASTP program with a significance threshold set at p = 0.001 to identify additional candidate genes. The screening criteria were an e-value < 1 × 10⁻⁹ and a match length > 100. Subsequently, the GGPPS genes were analyzed for subcellular localization prediction using WoLF PSORT [18] and Cell-PLoc 2.0 [19].

2.3. Phylogenetic Analyses of GGPPS

Phylogenetic analysis was conducted for the GGPPS proteins derived from three plant species: B. oleracea, A. thaliana, and B. rapa. Molecular Evolutionary Genetics Analysis (MEGA) 6.0 was utilized to construct an unrooted neighbor-joining phylogenetic tree with 1000 bootstrap test replicates [20].

2.4. Collinearity, Distribution, and Ka/Ks Ratios of BoGGPPS Genes

The Brassicaceae Database (http://brassicadb.cn/#/, (accessed on 22 April 2023)) was employed to map the identified BoGGPPS genes onto B. oleracea chromosomes. Microsyntenic relationships between A. thaliana and B. oleracea GGPPS genes were detected via conducting BLAST searches against whole genomes. Based on the Brassicaceae Database, the physical location of GGPPS was analyzed and the visualization of the relationships between the two crop cultivars was achieved using TBtools [21]. Additionally, DNASPv5 was used to carry out Ka/Ks analysis of the BoGGPPS genes [22].

2.5. Gene Structure, Conserved Motif Distribution, and Cis-Elements Analysis

The Gene Structure Display Server (GSDS) was used to examine the exon/intron structure of ten BoGGPPS genes [23]. Protein sequences were predicted using the NCBI-CDD [24], while conserved motifs were identified using the MEME program [25]. PlantCARE was utilized to identify cis-acting elements in the promoter region (2.0 kb upstream of the initiation codons (ATG) of the BoGGPPS gene) [26].

2.6. Three-Dimensional Prediction of the BoGGPPS Protein Structure

To explore the protein structure of the BoGGPPS gene family, we generated 3D structure predictions via homologous protein modeling using the SWISS-MODEL website (https://swissmodel.expasy.org/, (accessed on 7 July 2023)) [27].

2.7. Expression Analysis of B. oleracea BoGGPPS Genes Using RNA-Seq Data

The expression profiles (leaves, stems, roots, flowers, buds, siliques, and callus) of B. oleracea BoGGPPS genes were investigated using RNA-seq data from the NCBI database (GSM1052958–964). FPKM values are used to represent gene transcript levels, and a default empirical abundance threshold of 1 FPKM is utilized to identify positively expressed genes. The FPKM algorithm was employed to normalize the gene expression values. The TBtools v1.120 software was used to construct heat maps of hierarchical clustering.

2.8. RNA Extraction, cDNA Synthesis, and qRT-PCR

Cabbage WT and Boas1 were both grown under normal greenhouse conditions. The leaf (WTL: Wild-Type Leaf, Boas1L: Brassica oleracea albino silique 1 Leaf) and silique (WTS: Wild-Type Silique, Boas1S: Brassica oleracea albino silique 1 Silique) materials were sampled four weeks after pollination, and the seeds in the siliques were removed during sampling. Subsequently, WTL, Boas1L, WTS, and Boas1S samples were separately frozen in liquid nitrogen. Total RNA was extracted using FastPure® Universal Plant Total RNA Isolation Kit (Vazyme, Nanjing, Jiangsu, China) and cDNA was synthesized via HiScript® III RT SuperMix for qPCR (+gDNA wiper) (Vazyme, Nanjing, Jiangsu, China). The primer pairs were designed using primer premier 5 [28]. Details of the primer pairs are presented in Table S1. Taq Pro Universal SYBR qPCR Master Mix (Vazyme, Nanjing, Jiangsu, China) was utilized for the qRT-PCR performed on a Bio-Rad CFX96 Real Time PCR System. Each reaction was performed with three replicates. The actin gene was used as the internal reference gene.

2.9. Subcellular Localization and Confocal Laser Scanning Microscopy

The CDS (coding region sequence) of Bol028967 was subcloned into pBWA(V)HS-ccdb-GLosgfp using the one-step restriction enzyme ligation method. Bol028967-GFPs constructs were then transferred into Agrobacterium tumefaciens EHA105 using electroporation. Positive transformants of Nicotiana benthamiana leaves were prepared and analyzed using laser confocal microscopy.

3. Results

3.1. Identification and Phylogenetic Relationship of the BoGGPPS Gene Family in B. oleracea

Ten BoGGPPS genes were identified from the B. oleracea genome. The predicted BoGGPPS proteins varied in length, and the amino acids ranged from 225 in Bol037851 to 849 in Bol027478. Subcellular localization predictions indicated that five BoGGPPS proteins were localized within the chloroplast: two were targeted to the mitochondria, two were found in both the chloroplast and plastid, and one was detected in both the chloroplast and nucleus (Table 1).
To investigate the evolutionary relationships of GGPPS genes, the GGPPS proteins of B. oleracea was compared with that from A. thaliana and B. rapa. An unrooted phylogenetic tree was constructed (Figure 2). The ten GGPPS genes were classified into four sub-groups: Group I includes two genes (Bol007930 and Bol014868); Group II contains two genes (Bol038277 and Bol027478); Group III comprises three genes (Bol027375, Bol037851, and Bol036967); and Group IV consists of three genes (Bol045796, Bol028967, and Bol025714).

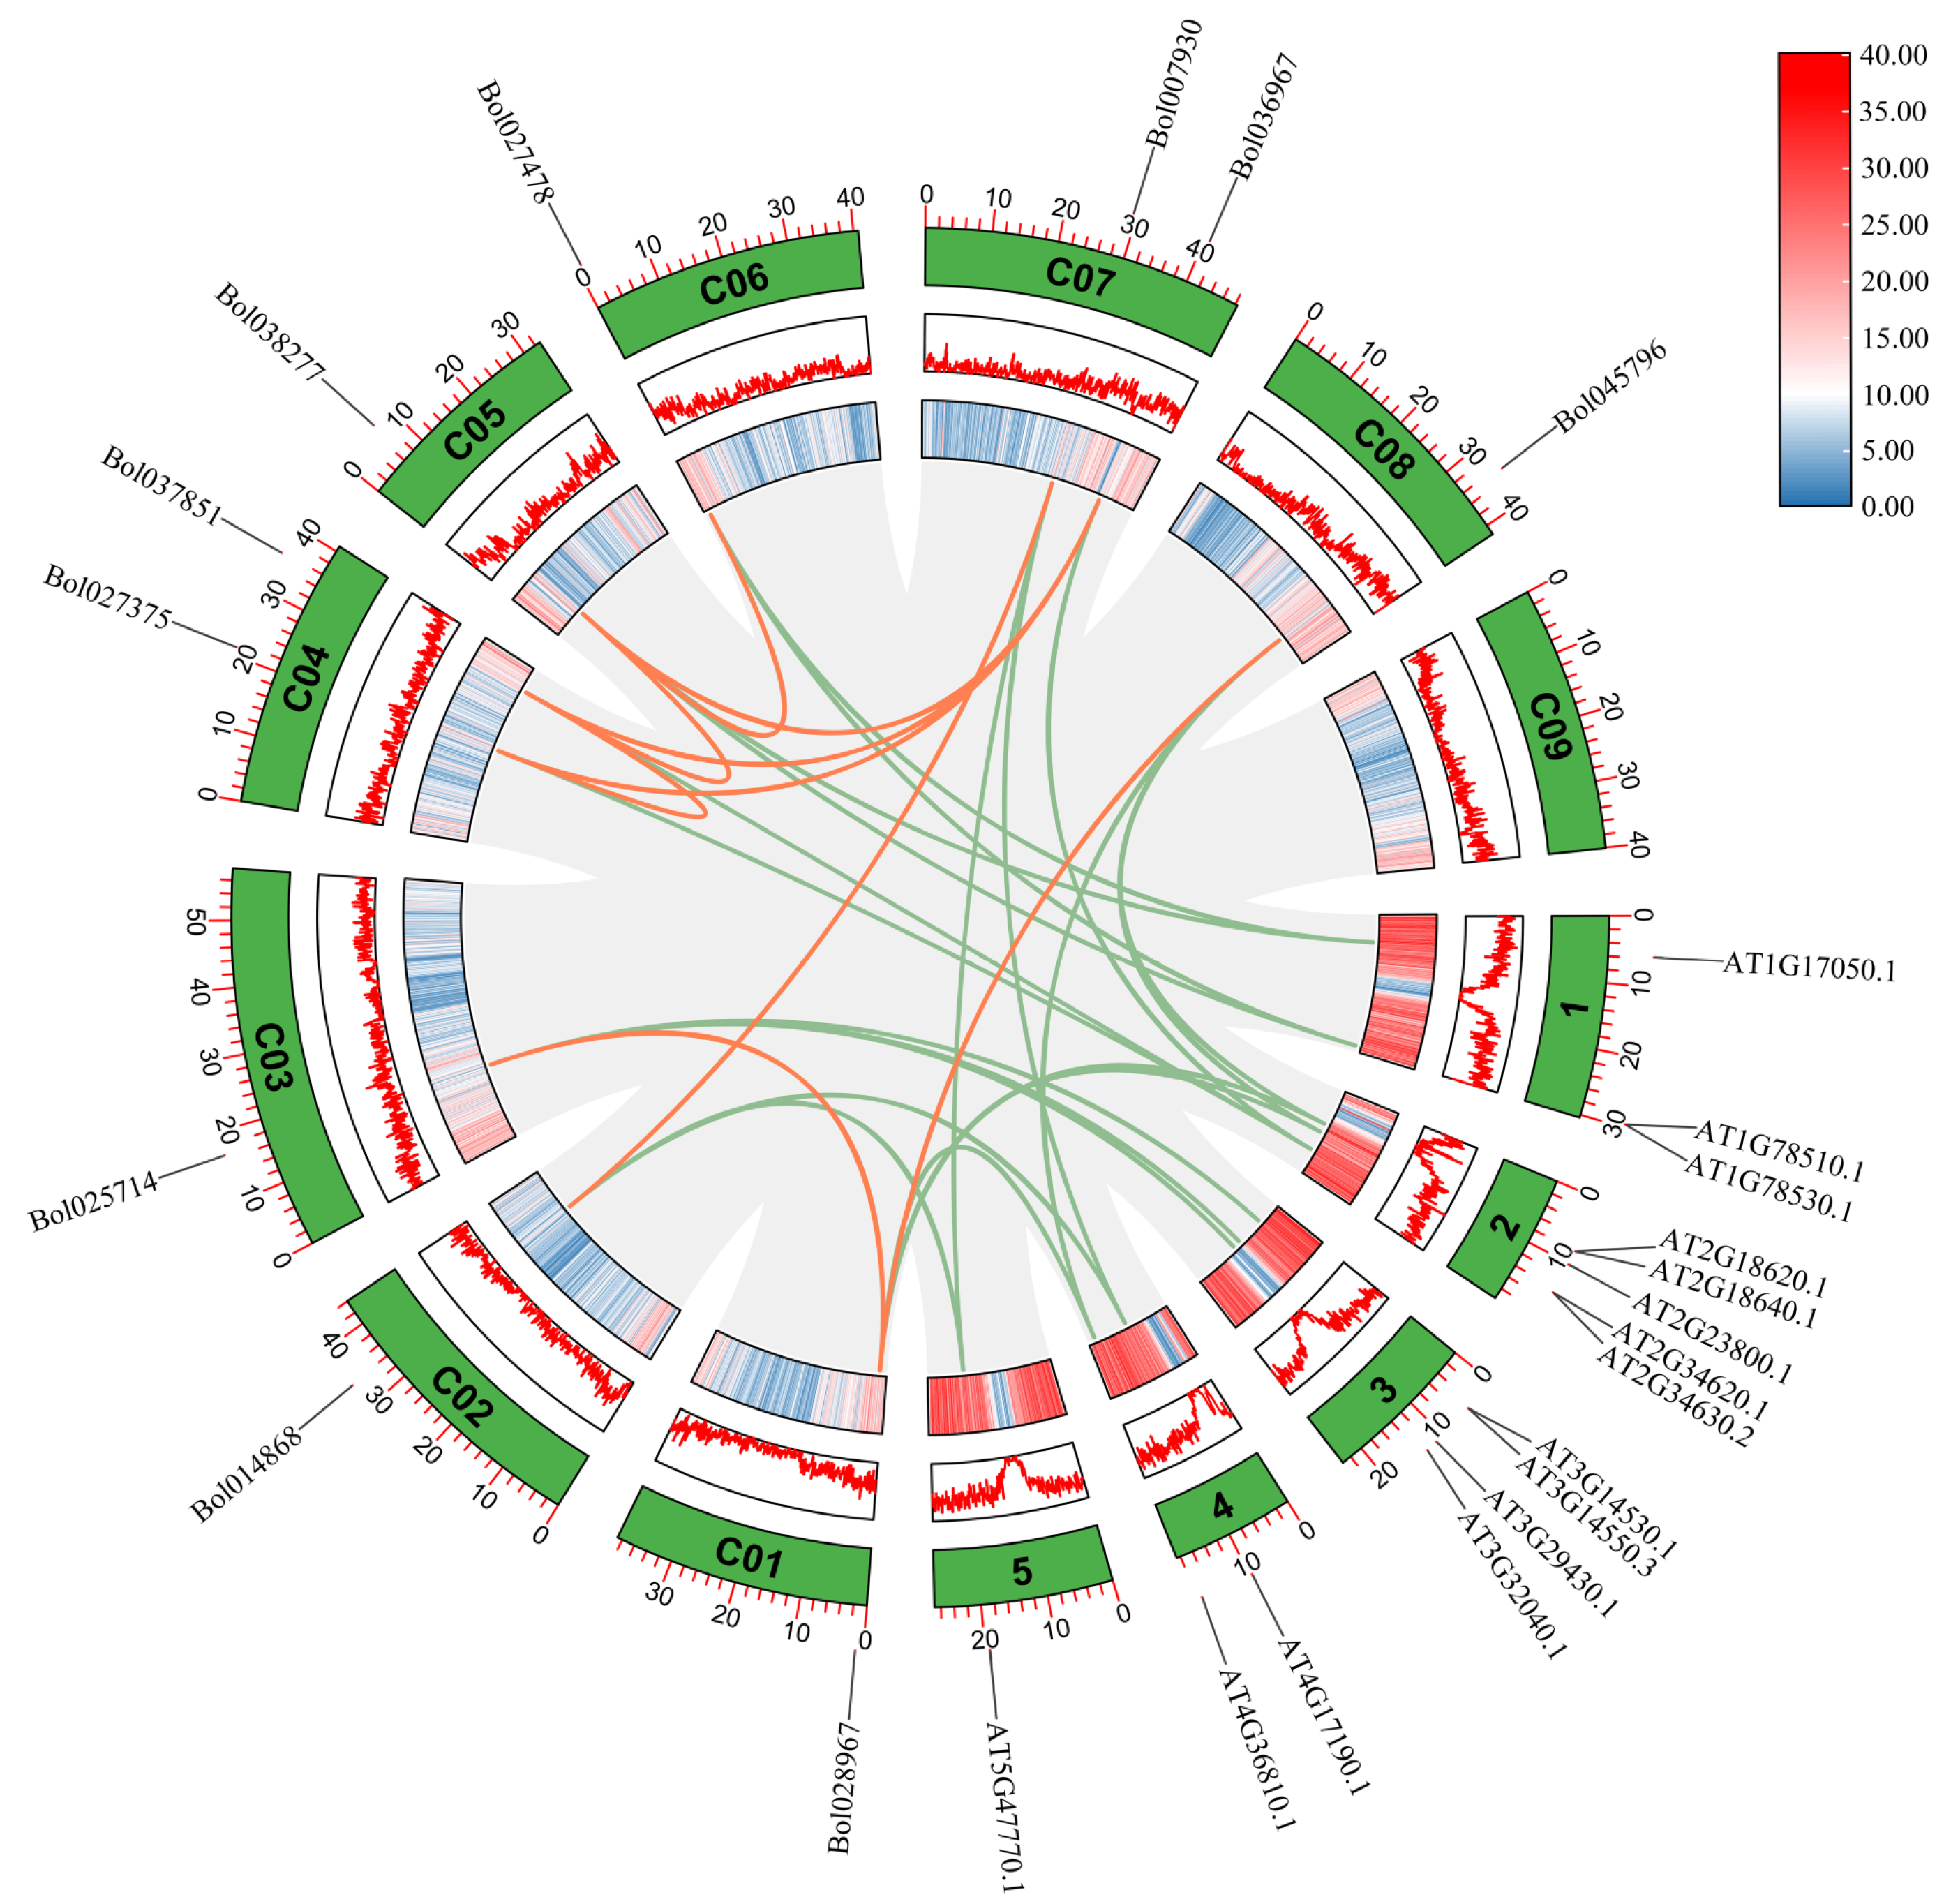
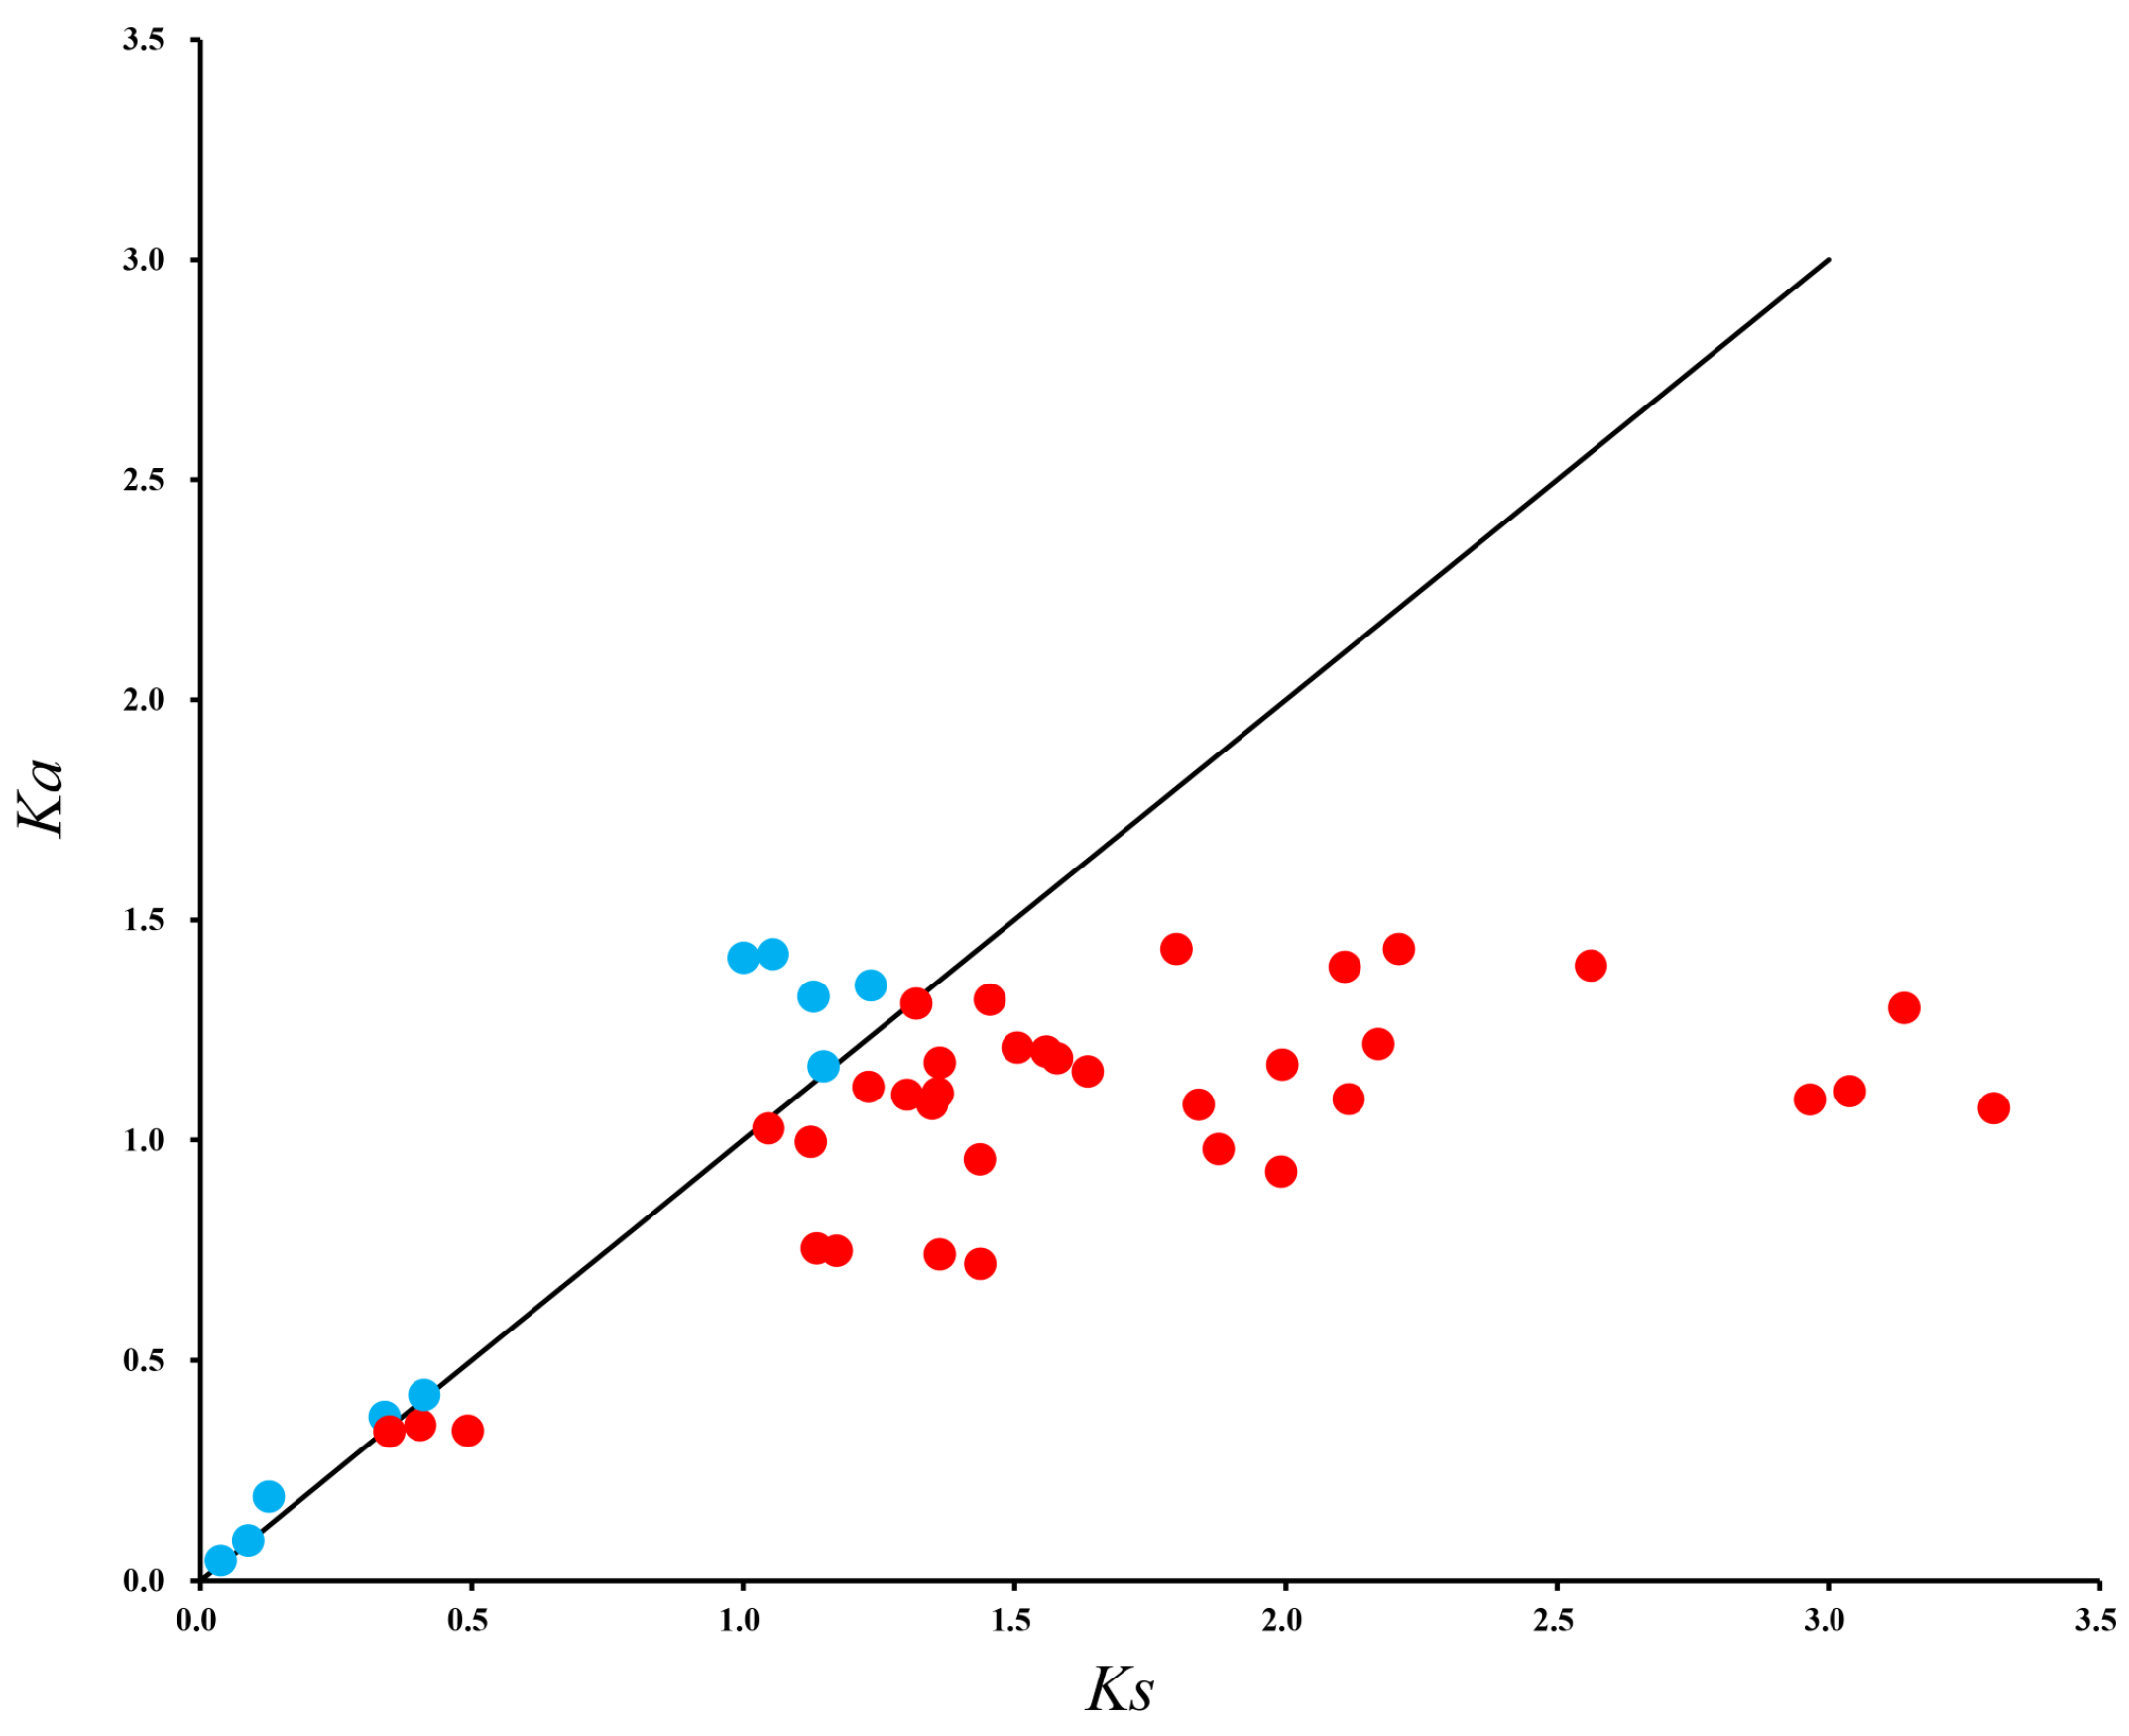
3.2. Collinearity, Distribution, and Ka/Ks Analysis

In B. oleracea, ten BoGGPPS genes were unevenly distributed across eight of the nine chromosomes (Figure 3), as Chromosome C04 and C07 contained two BoGGPPS genes each; C01-C03, C05, C06, and C08 had one BoGGPPS gene each; and no BoGGPPS gene was located within C09. Additionally, a total of 45 paralogous pairs were observed among the ten identified BoGGPPS genes in B. oleracea. Of these, eight paralogous pairs had a Ka/Ks ratio of greater than 1 (Figure 4; Table S3), indicating that they might have undergone or experienced positive selection.
The analysis of putative GGPPS gene duplications in the genomes of B. oleracea and A. thaliana was conducted to gain deeper insights into the evolutionary history of GGPPS genes. (Figure 2; Table S2). The 15 A. thaliana GGPPS genes each had 1–3 corresponding homologous gene(s) in B. oleracea. For the ten BoGGPPS genes in B. oleracea, eight exhibited four homologous genes in both B. oleracea and A. thaliana, and the other two (Bol014868 and Bol007930) had three homologous genes.

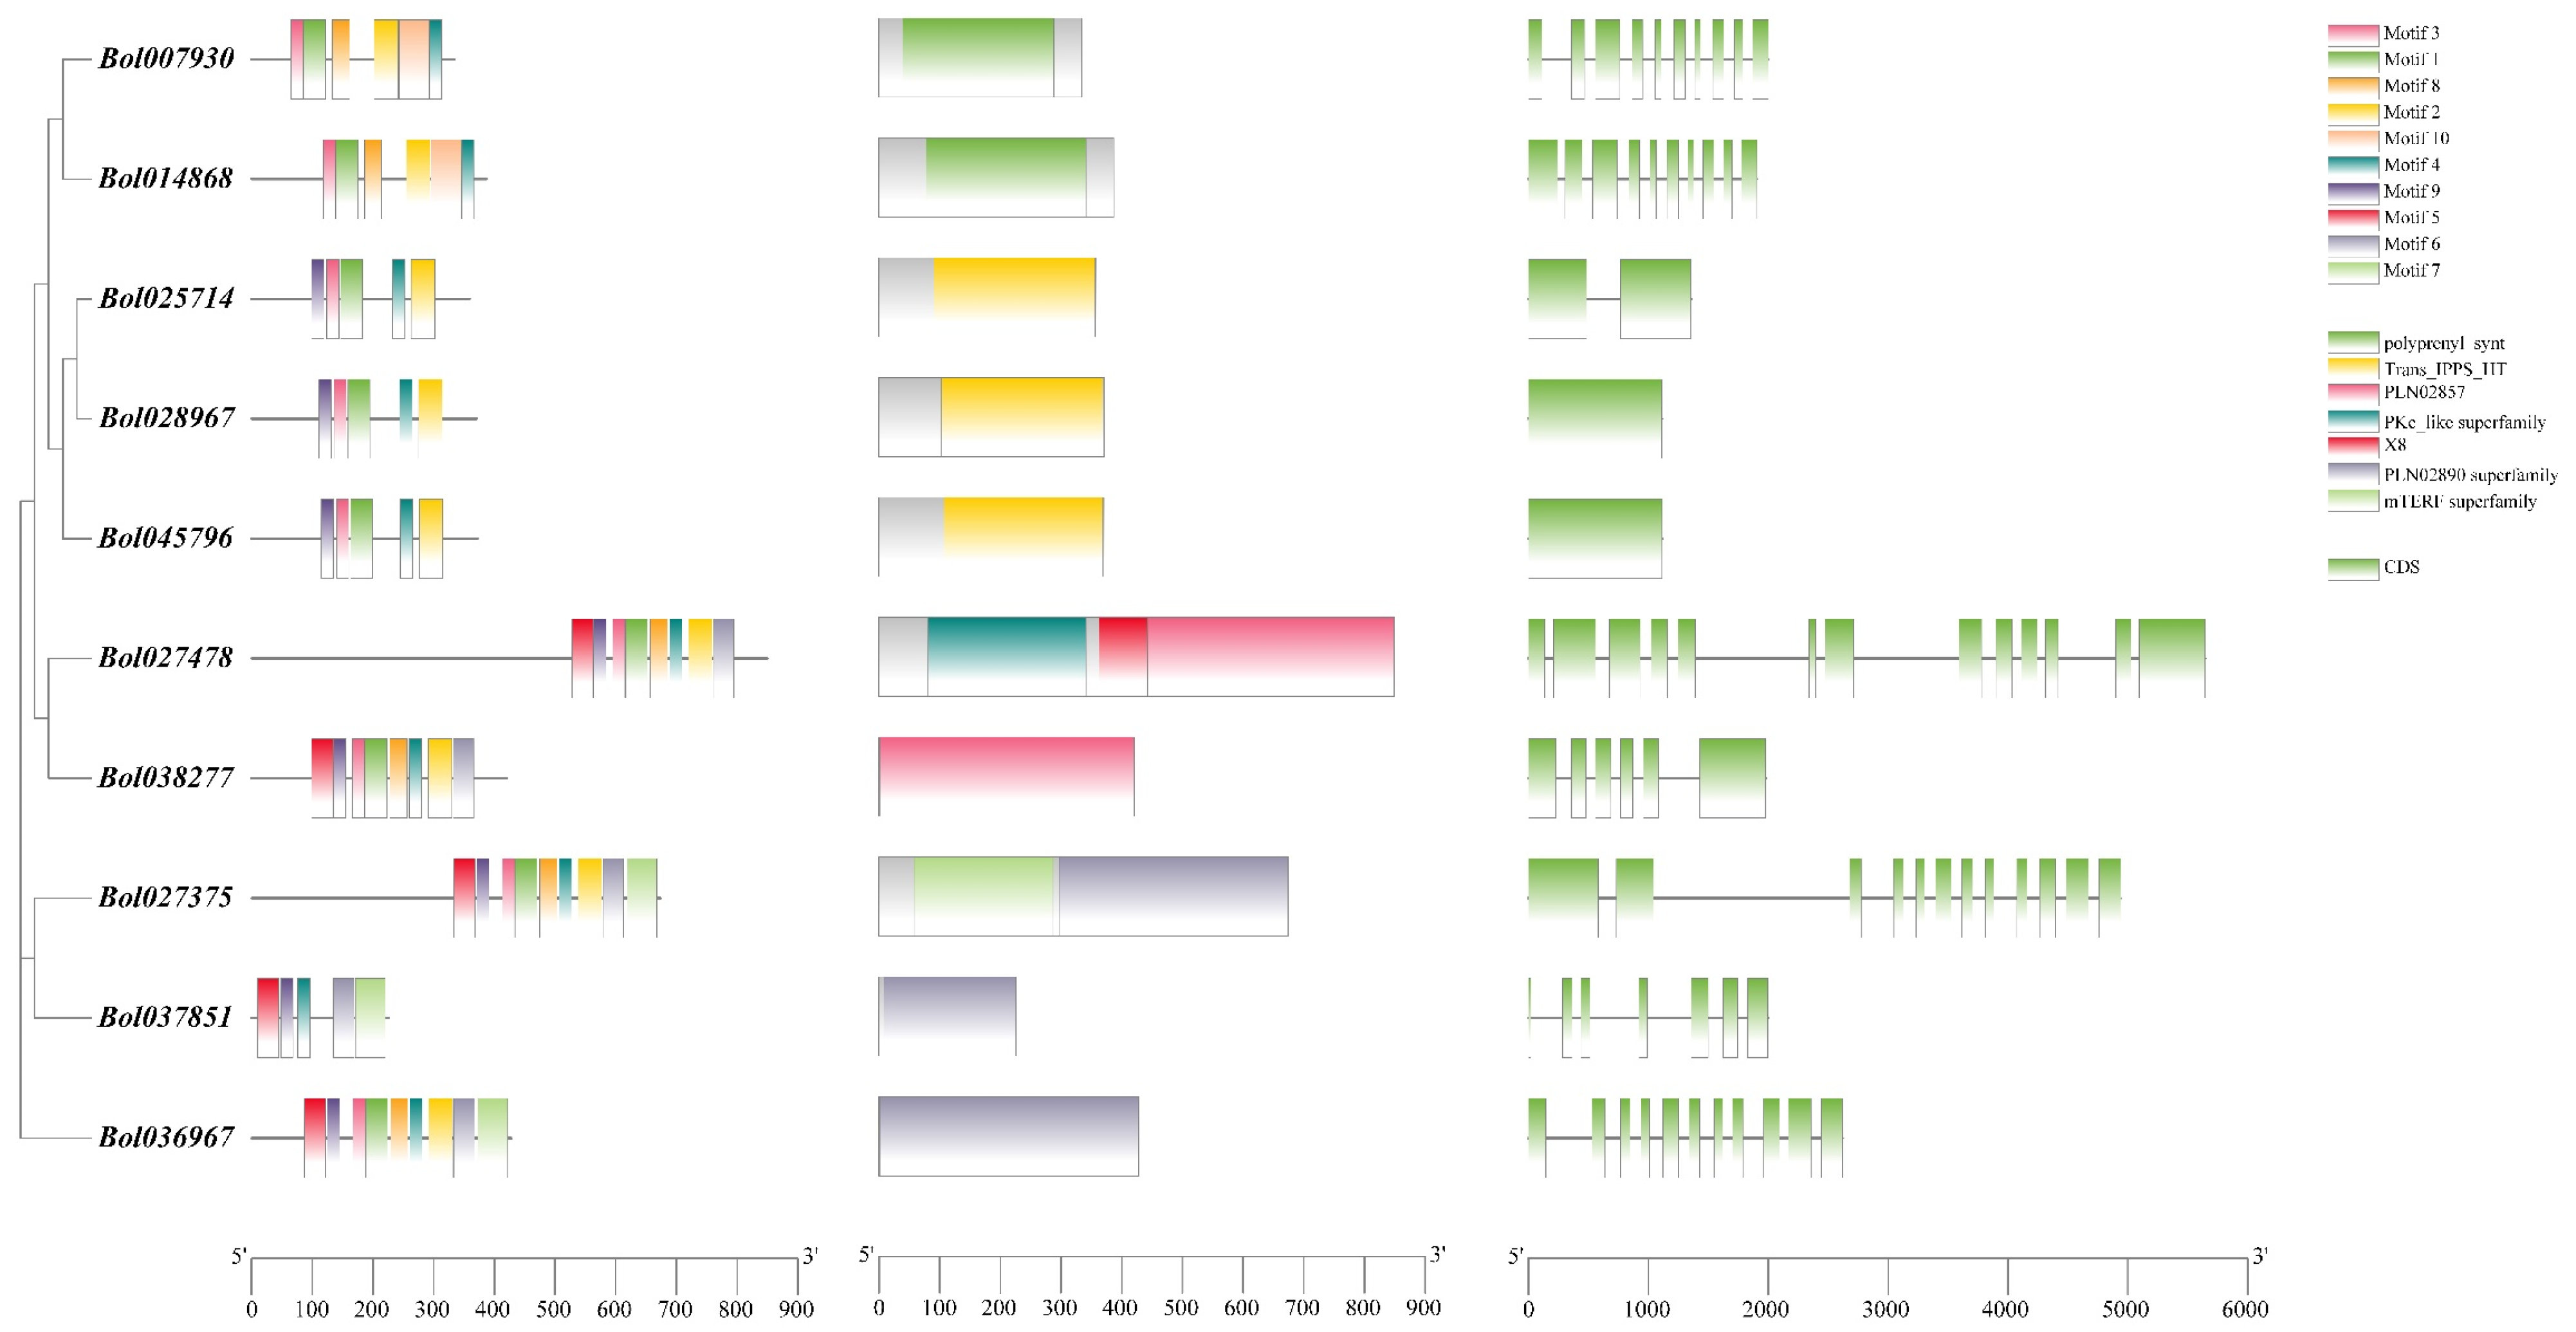
3.3. Gene Structure, Domain and Conserved Motif Analysis

To gain deeper insights into the GGPPS genes in B. oleracea, we analyzed the exon/intron structures and phases of these genes (Figure 5). The genes that demonstrated closer phylogenetic relationships displayed a similarity in terms of motif arrangements and genetic structures. For example, Bol007930 and Bol014868, which shared similar motif length and structure, were grouped together in the phylogenetic tree. The gene CDS length varies significantly, ranging from the shortest 678 bp (Bol037851) to the longest 2550 bp (Bol027478), and eight of the ten B. oleracea GGPPS genes have a gene length shorter than 2000 bp. The number of exons varies across phylogenetic relationships, with five of the ten B. oleracea GGPPS genes (Bol007930, Bol014868, Bol027478, Bol027375, and Bol036967) containing at least ten exons; two genes (Bol028967 and Bol045796) each having 1 exon; and Bol025714, Bol038277, and Bol037851 having 2, 6, and 7 exons, respectively. In addition to the number of exons, there is significant variability in exon length. Bol007930 comprises ten shorter exons, whereas Bol045796 has the single longest exon. Bol027478 exhibits the most exons. The exon length and number of BoGGPPS genes are consistent with the motif structure of these genes.
Genes in the same sub-group have similar domain structures. Both genes, Bol007930 and Bol014868, in Group I exclusively possess the polyprenyl_synt domain. Bol027478 and Bol038277 of Group II share the PLN02857 domain; however, Bol027478 additionally contains two other domains (X8 and the PKc-like superfamily). In Group III, Bol037851 and Bol036967 exclusively contained the PLN02890 superfamily domain, while Bol027375 contained both the mTERF superfamily domain and the PLN02890 superfamily domain. Group IV (Bol025714, Bol028967, and Bol045796) exclusively featured the Trans IPPS HT domain.
To acquire a more profound understanding of the functional diversity of BoGGPPS genes in the process of evolution, we identified and characterized ten conserved motifs present in the sequences of these ten BoGGPPS genes. Except for Bol037851, the other nine BoGGPPS genes all contain motif1 and motif3. Bol036967 exhibits nine of the ten identified motifs, except for motif10. Bol027478 and Bol038277 contain eight motifs, ranking them next in terms of motif presence.

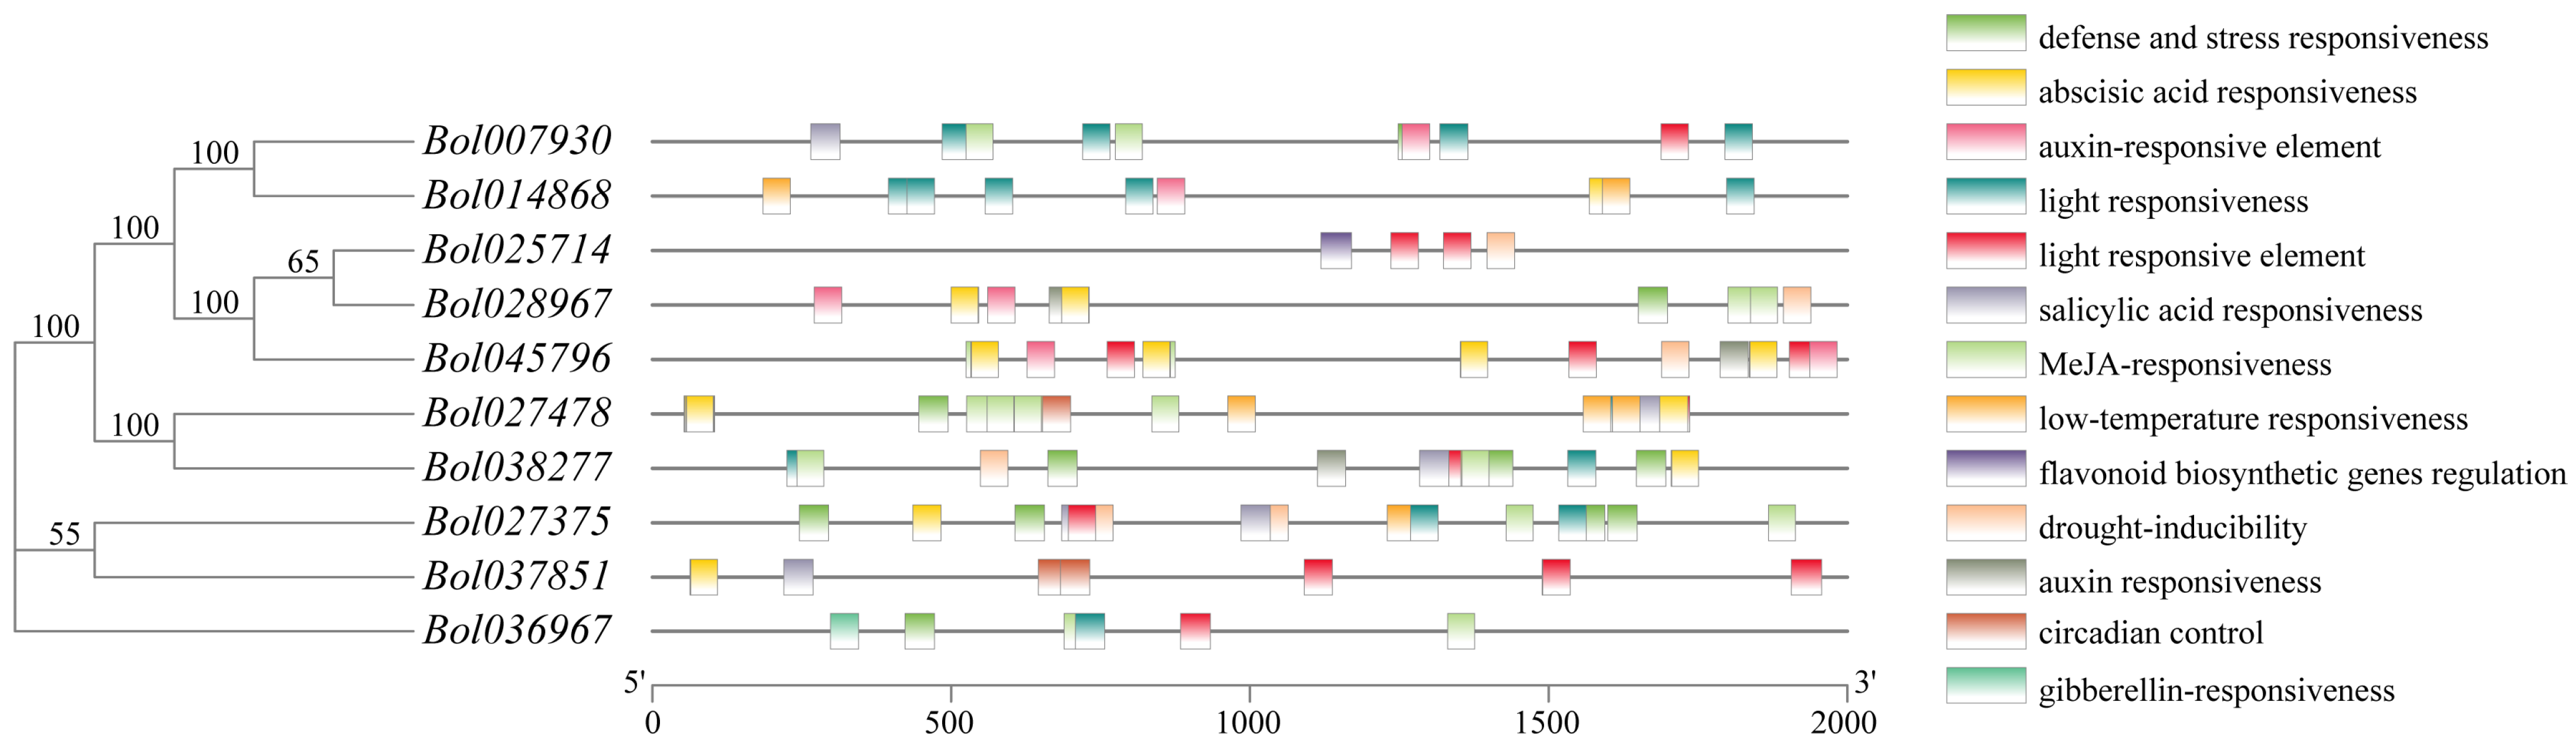
3.4. Analysis of Cis-Acting Elements in BoGGPPS Genes

The regulatory mechanisms of BoGGPPS genes were further investigated. The PlantCARE database was employed to predict cis-acting elements located 2000 bp upstream of the transcription start site within the promoter region (Figure 6). Thirteen response elements were identified, encompassing stress responses such as abiotic stress (low temperature and drought), phytohormones (SA, ABA, GAs, auxin, and MeJA), and photosynthesis. Among the ten BoGGPPS genes, Bol027478 exhibited the highest number of cis-acting elements, with a total of sixteen. This gene also displayed the most cis-acting elements associated with MeJA (4) and ABA (4) responsiveness. Bol025714 contained the fewest cis-acting elements, with a minimum of four, including two light-responsive elements, one flavonoid biosynthetic gene regulation element, and one drought-inducibility element. Notably, Bol025714 was the sole gene to feature the flavonoid biosynthetic gene regulation element. Additionally, only Bol036967 displayed gibberellin-responsiveness. Except for Bol028967, the other nine BoGGPPS genes encompassed light-responsive elements, ranging from two to five in number. This observation may be linked to the respective gene’s function.

3.5. Three-Dimensional Structure Prediction of GGPS Proteins

Protein conformation is the basis of their specific functions. In order to delve into the functional diversity of B. oleracea GGPPS proteins, we predicted their 3D structures using the SWISS-MODEL website (Figure 7). The results revealed that four BoGGPPS proteins (Bol045796, Bol027375, Bol025714, and Bol036967) were primarily composed of α-helices and random coils, with no β-folding being observed. Bol014868, Bol028967, and Bol027478 contain α-helices and β-folding. The remaining three proteins, Bol038277, Bol037851, and Bol007930, are composed of two subunits. Specifically, Bol038277 and Bol037851 consist solely of α-helices, while Bol007930 exhibits a combination of β-folding and α-helices structures. The α-helix is a prevalent structural element that is widely distributed throughout the entire peptide sequence of BoGGPPS. Moreover, most members of the BoGGPPS family share similar 3D structures, and such structural similarities often correspond to similar functions. This observation suggests that BoGGPPS exhibits a considerable level of conservation during evolution, emphasizing its vital role in the biological processes.

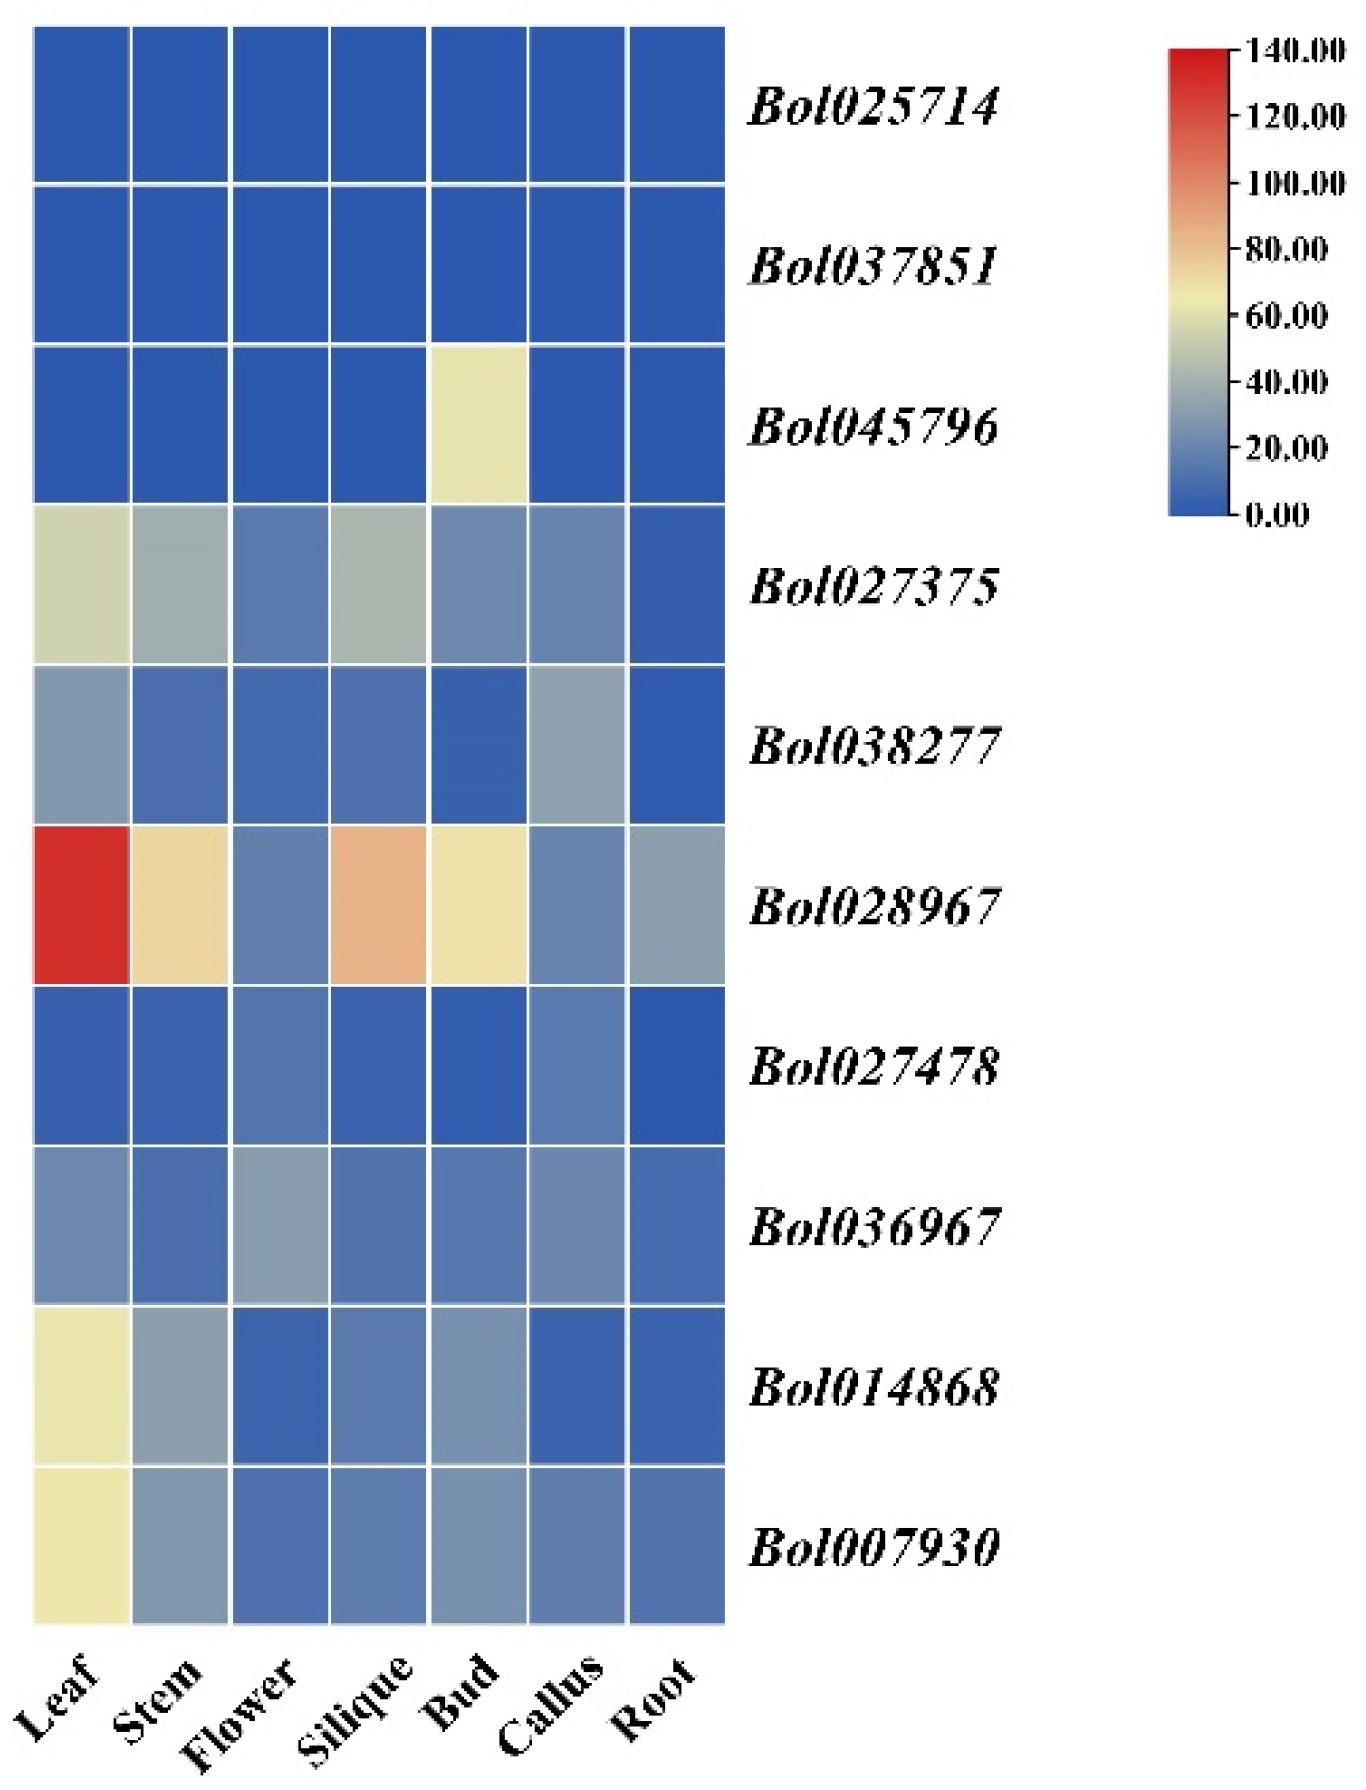
3.6. Expression Analysis of BoGGPPS Genes in Different Tissues

We analyzed the RNA-seq dataset (GSE42891) to assess the transcript levels of GGPPS genes in different tissues (root, stem, leaf, flower, bud, silique, and callus) of B. oleracea. Eight BoGGPPS genes exhibited low transcript levels (Figure 8; Table S4), but the other two genes (Bol025714 and Bol037851) did not express in any tissue. For the eight expressed BoGGPPS genes, the transcript level was relatively high in leaves and buds, while it was comparatively low in roots and flowers. Among these highly expressed genes, Bol028967 displayed the highest transcript level in leaves and relatively higher transcript levels in all the other tissues. Bol045796 specifically expressed in bud tissue but showed considerably lower expression levels in the other tissues, and Bol014868 and Bol007930 are only expressed specifically in leaves. The transcript levels of the remaining four genes (Bol027478, Bol038277, Bol027375, and Bol036967) are not extremely high in any tissue.
Further, qRT-PCR analysis in the leaves and siliques of WT and Boas1 was conducted to verify whether the transcript levels of BoGGPPS genes in Boas1 agree with the analysis results of the RNA-seq dataset (Figure 9; Table S5). The qRT-PCR results unequivocally demonstrated the expression levels of all ten BoGGPPS genes in both leaves and siliques. Moreover, the transcript levels in leaves and siliques were found to be significantly different from the RNA-seq dataset analysis. In contrast to the RNA-seq dataset analysis, the expression of two genes, Bol025714 and Bol037851, was observed in both leaves and siliques. Based on the RNA-seq dataset, Bol028967 exhibits higher expression in leaves than in other tissues; however, the qRT-PCR results demonstrate a significant increase in the relative expression of this gene in WT siliques, suggesting that siliques may be the primary expression site of this gene. Interestingly, in the siliques of Boas1, the expression of Bol028967 is significantly reduced. The expression patterns of Bol038277 and Bol027478 were found to be in line with the RNA-seq dataset. However, the expression pattern of the Bol027478 gene in Boas1 was incongruent with the RNA-seq dataset, indicating the higher expression levels of Bol027478 in leaves compared to siliques. The relative expression levels of Bol014868, Bol027375, Bol007930, and Bol036967 genes were significantly higher in siliques than in leaves for both WT and Boas1, which contradicts the results obtained from the RNA-seq dataset. However, the relative expression levels of Bol045796 were aligned with the RNA-seq dataset, indicating the higher transcript levels of Bol045796 in siliques compared to in leaves.

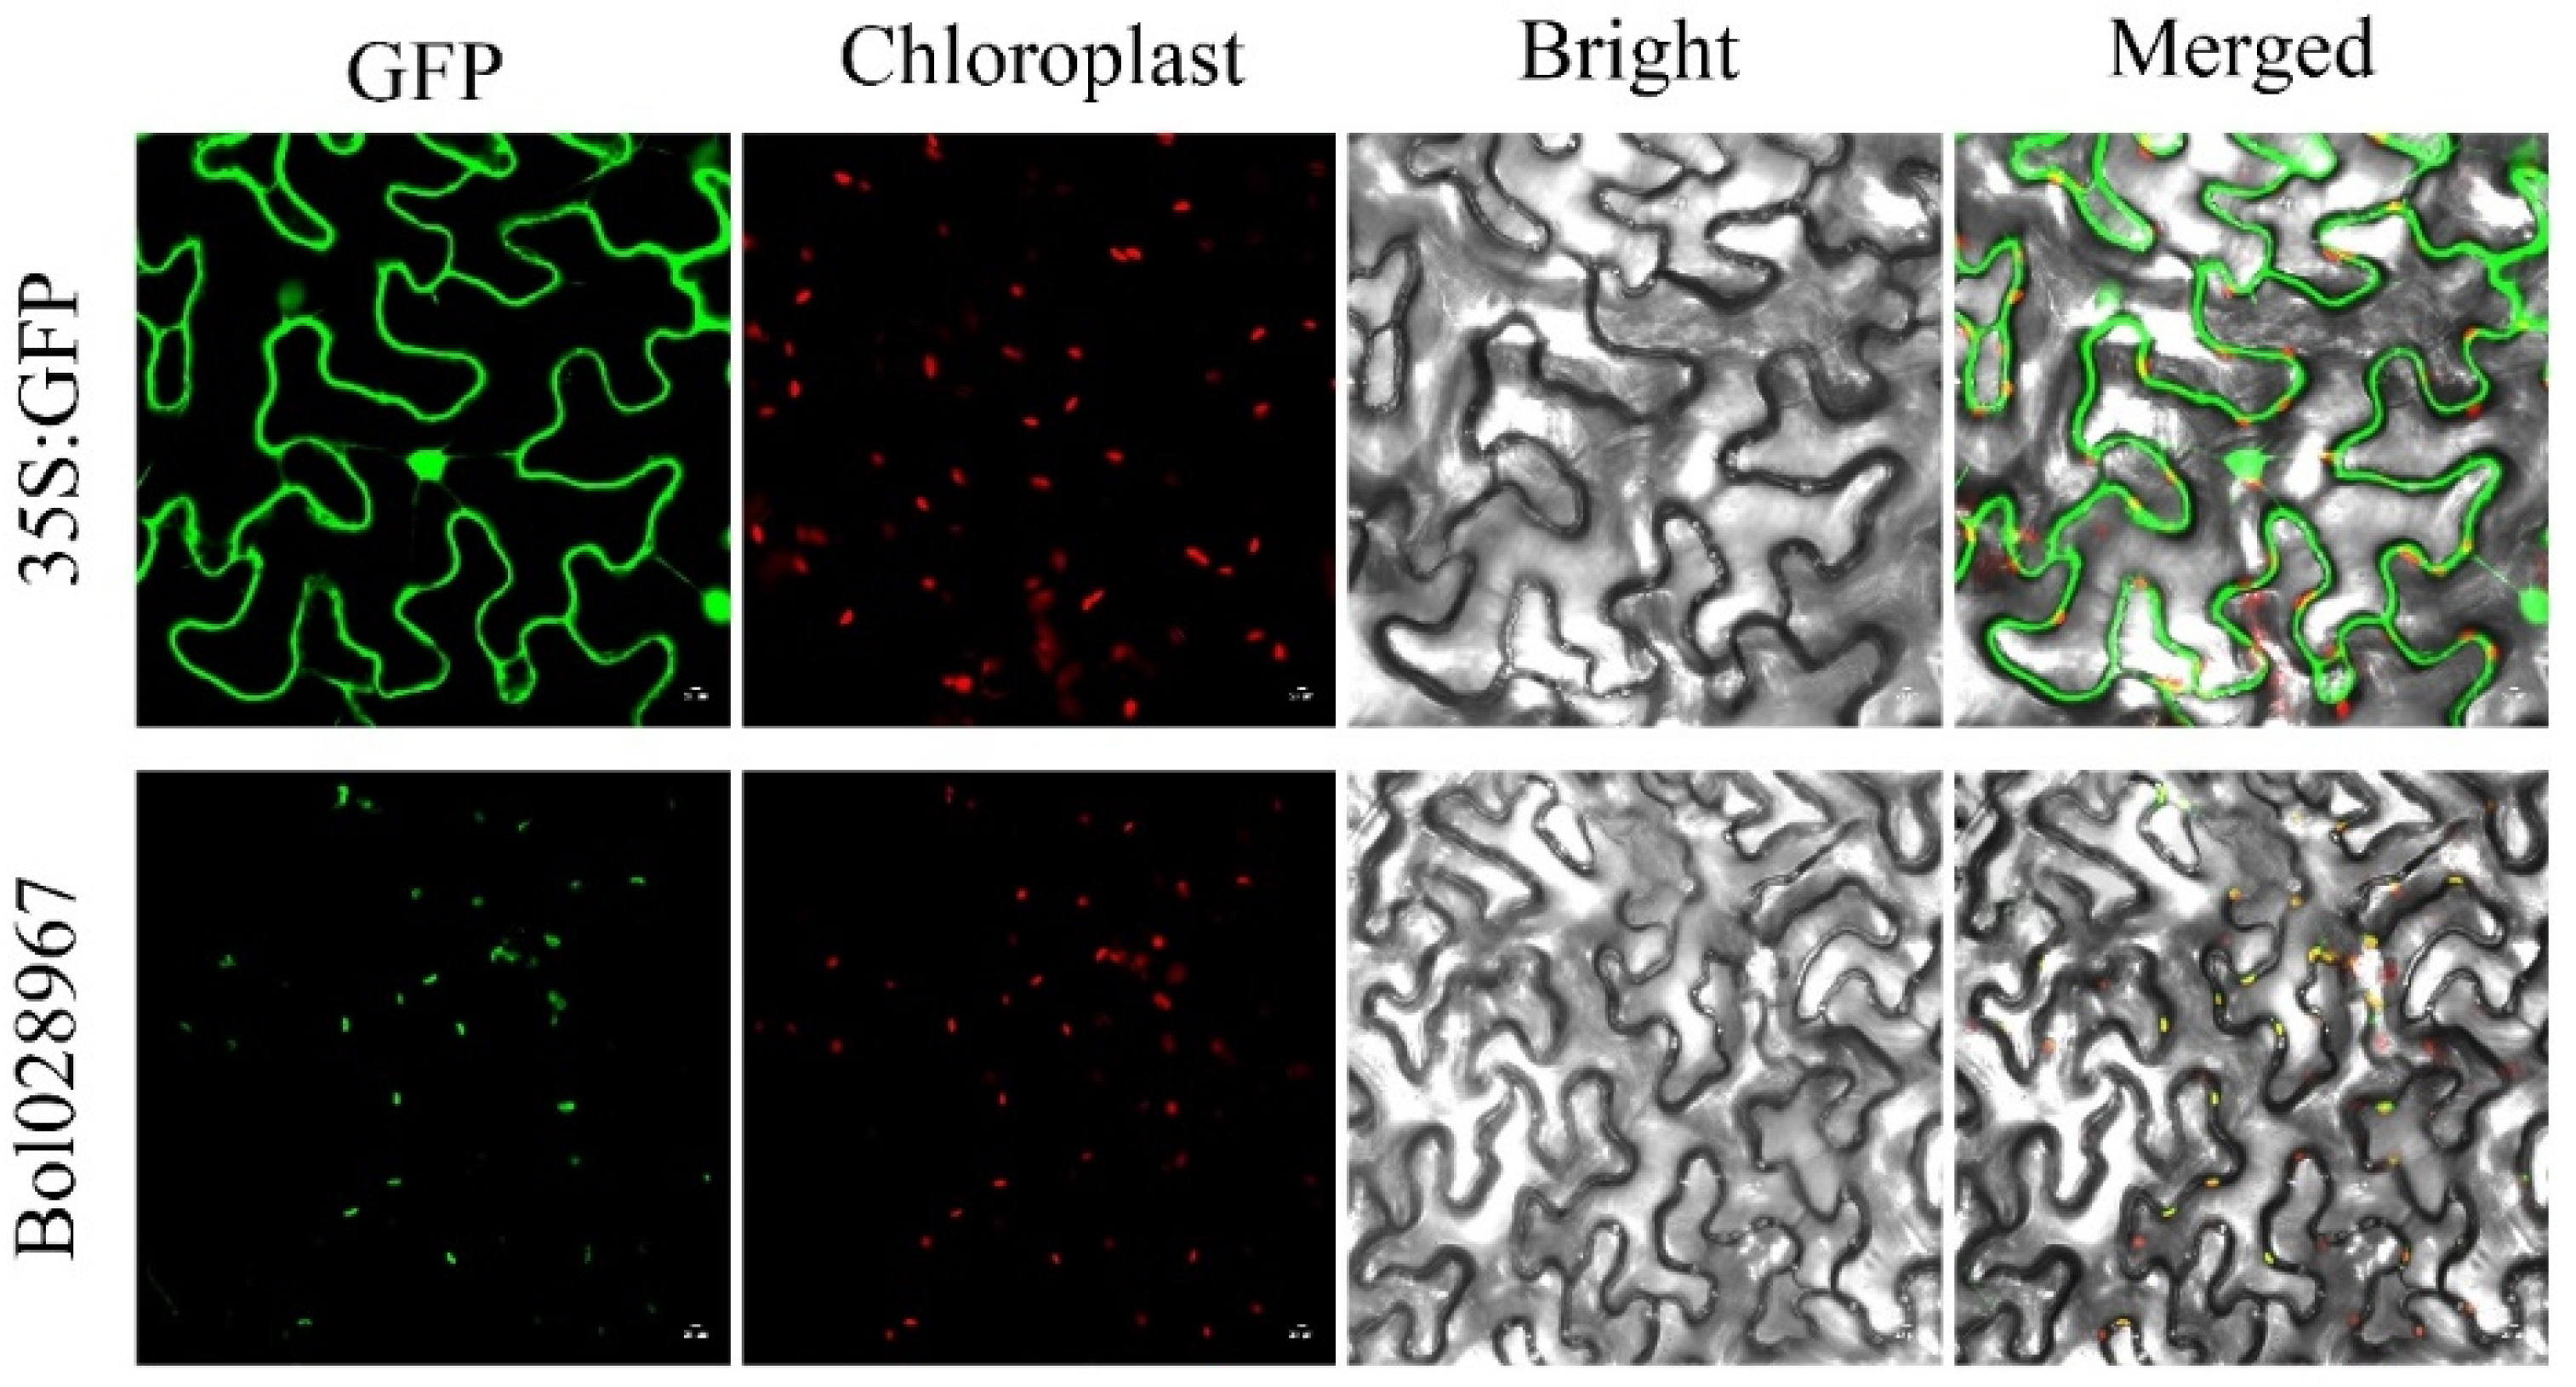
3.7. Subcellular Localization of the Bol028967 Protein

To predict the subcellular localization of BoGGPPS proteins, two online analysis tools, WoLF PSORT and Cell-PLoc, were employed. The results from both tools indicated that the majority of BoGGPPS proteins were expressed in chloroplasts. Among the BoGGPPS genes, Bol028967 showed significantly different expression levels in siliques of WT and Boas1. To determine whether the expression location of this gene was consistent with the predicted results, this gene was selected for subcellular localization analysis. The GFP gene was fused with Bol028967 to serve as a reporter. Confocal laser microscopy revealed that the Bol028967-GFP signals were detected in chloroplasts near the cell boundary of N. benthamiana leaves (Figure 10). Indeed, this result is consistent with the predicted subcellular localization mentioned in Table 1, indicating that Bol028967 is expressed in the chloroplast.

4. Discussion

The GGPPS gene family functions in the biosynthesis of terpenoids, which serves as the primary and (or) secondary metabolites involved in the production of gibberellins, carotenoids, and chlorophyll in plants. The functions of GGPPS family members have been extensively studied in model species like A. thaliana and rice. A study on rice has demonstrated the presence of a single functionally active GGPPS in chloroplasts, which plays a critical role in thylakoid function [9]. The GGPPS genes of tobacco are implicated in the synthesis of carotenoids, chlorophyll, and gibberellin [29]. The GGPPS genes of Rose damascena have been found to potentially play a crucial role in the synthesis of rose monoterpenes [30]. Sun et al. (2018) reported three GGPPS-related genes in cabbage based on mRNA sequences of the GGPPS gene but not the entire cabbage genome [31]. To date, no systematic research was conducted to explore the GGPPS gene family in B. oleracea.
In this study, a total of ten BoGGPPS genes were identified in B. oleracea. The ten genes were unevenly distributed across eight of the nine chromosomes in B. oleracea, with the C09 chromosome being excluded. Previous research has demonstrated that the number of BoGGPPS genes varies widely in species. Ali et al. (2020) discovered that the 25 identified GhGGPPS genes exhibited diverse expression patterns, especially during ovule and fiber development [32]. Zhou et al. (2021) found one functionally active GGPPS in rice [9]. The process of biological evolution involves gene duplication, which is a potential factor influencing the course of evolution [33]. Eukaryotic genomes consist of multiple gene families that originate via the duplication and mutation of ancestral genes [34]. In eukaryotic genomes, interchromosomal duplication serves as a significant source of genetic expansion [35]. Over the past 350 million years, Arabidopsis has undergone three whole-genome duplications, facilitating the expansion of specific gene classes [36]. According to our findings, every GGPPS gene has at least 1–3 corresponding copies in the B. oleracea genome. This suggests that the GGPPS genes in B. oleracea have undergone duplication during the evolutionary process, increasing functional diversity. Furthermore, we calculated the Ka/Ks ratio for paralogous pairs among the identified BoGGPPS genes. After excluding potential paralogs, we finalized a total of 45 orthologous pairs, with a mean Ks of 1.45, a mean Ka of 0.99, and a mean Ka/Ks ratio of 0.80. We finally identified eight paralogous pairs with a Ka/Ks ratio > 1, indicating that these pairs may have experienced or are currently undergoing positive selection during natural selection.
Genes can be classified into different subgroups based on their intron/exon structure, and genes within the same subgroup generally exhibit similar functions [37]. In the eukaryotic genome, conservative genes are more prone to functional and persistent duplications to better adapt to the environment and ensure survival. In the present study, B. oleracea, B. rape, and A. thaliana GGPPS genes were clustered into four subgroups, and genes within the same subgroup exhibit similar conserved domains. Moreover, genes encoding multi-domain proteins with multiple cis-element regions tend to be preferentially retained [38]. In this study, a total of thirteen cis-acting elements were predicted in the promoter region of BoGGPPS genes. These cis-acting elements were associated with various stress responses such as phytohormones (ABA, auxin, SA, GAs, and MeJA), abiotic stress (drought and low temperature), and photosynthesis, which is consistent with a previous study [32].
Previous studies have indicated spatial and temporal expression patterns of GGPPS genes in Arabidopsis [13]. The expression of PnGGPPS in 3-year-old leaves was significantly higher than in leaves of other ages for Panax notoginseng, which is related to the quality of Panax notoginseng [39]. Similarly, the RgGGPPS2 of Rehmannia glutinosa showed higher transcript levels in the root tissue compared to other parts, and the content of terpenoids in roots was also significantly higher than that in other tissues [40]. Moreover, MinGGPPS1 expression in ripe mango is five-fold higher than that in unripe fruit, resulting in a significant increase in aromatic compounds [41]. In both WT and Boas1, most BoGGPPS genes had higher transcript levels in mature tissues (siliques) than that in leaves, which may be related to the growing period of siliques’ growth and seed maturation. GGPP serves as a crucial precursor for phytol synthesis within chlorophyll. Simultaneously, it acts as a precursor for three pivotal plant hormones (gibberellin, abscisic acid, and strigolactone). These synthesis processes occur in the stroma and thylakoids of chloroplasts, and the synthesis of phytol and the three hormones engages in a competitive relationship, prompting plants to finely tune the synthesis ratios for each component [42]. A decrease in chlorophyll synthesis within albino siliques could potentially stimulate the synthesis of other hormones and then enhance GGPPS expression level. Consequently, a reduction in the expression of some BoGGPPS might upregulate the remaining BoGGPPS gene’s expression. The transcript level of Bol028967 in WT siliques was significantly higher than that in Boas1, and subcellular localization analysis revealed the expression of the Bol028967 gene in chloroplasts. The loss of chlorophyll in Boas1 siliques may be attributed to mutations occurring during the conversion of phytol into chlorophyll, and the reduced expression of Bol028967 may be a contributing factor to the silique albinism observed in Boas1.

5. Conclusions

In this study, ten BoGGPPS genes were identified from B. oleracea. Similar BoGGPPS genes showed similar structure, motif, and domain structure. Multiple duplication events within the BoGGPPS gene family were revealed by the distribution, collinearity, and Ka/Ks analysis. Cis-acting element analysis suggested cabbage BoGGPPS genes were involved in light and hormone responses. Additionally, 3D structure analysis indicated an abundance of α-helices and random coils among BoGGPPS members, suggesting their functional significance. By analyzing the spatiotemporal distribution and abundance of BoGGPPS gene transcripts, we observed their involvement in chloroplast and plastid development and the hormones and abiotic stress’ responses. The qRT-PCR expression analysis demonstrated noticeable variations in the transcript levels of most BoGGPPS genes between leaves and siliques in both WT and Boas1. Notably, the transcript level of Bol028967 in WT siliques was significantly higher than that in Boas1. Subcellular localization analysis further revealed the localization of Bol028967 within chloroplasts, suggesting its crucial involvement in chloroplast synthesis. These findings would provide valuable insights for further investigations on the structural, functional, and phylogenetic aspects of the BoGGPPS gene family.

Supplementary Materials

The following supporting information can be downloaded at: https://www.mdpi.com/article/10.3390/agriculture13081615/s1, Table S1: The primer sequences used for qRT-PCR analysis of ten BoGGPPS genes. Table S2: GGPPS gene homologs in the genomes of A. thaliana and B. oleracea. Table S3: Ka and Ks analysis of BoGGPPS genes in B. oleracea. Table S4: Expression profiles of BoGGPPS genes involved in seven tissues. Table S5: BoGGPPS gene expressions in different samples.

Author Contributions

Conceptualization, Y.W.; methodology, L.Y. (Longxiang Yan), Y.W., H.L., M.Z. and L.Y. (Limei Yang); data analysis, L.Y. (Longxiang Yan), Y.W. and J.J.; validation, L.Y. (Longxiang Yan) and N.Z.; data curation, L.Y. (Longxiang Yan) and Y.W.; writing—original draft preparation, L.Y. (Longxiang Yan); writing—review and editing, Y.W.; visualization, L.Y. (Longxiang Yan) and Y.W.; supervision, Z.F.; project administration, Y.W. and Y.Z.; funding acquisition, Y.W. and Y.Z. All authors have read and agreed to the published version of the manuscript.

Funding

This research received no external funding.

Institutional Review Board Statement

The study did not require ethical approval.

Data Availability Statement

The data from the website can be accessed through the webpage link provided in the “Materials and Methods” section. Processed data are available both in this article and in the Supplementary Materials.

Acknowledgments

We extend our appreciation to the anonymous reviewers for their valuable suggestions to help improve this article.

Conflicts of Interest

The authors declare that they have no conflict of interest. The funders had no role in the study design, data collection and analysis, decision to publish, or preparation of the manuscript.

References

  1. Dudareva, N.; Negre, F. Practical applications of research into the regulation of plant volatile emission. Curr. Opin. Plant Biol. 2005, 8, 113–118. [Google Scholar] [CrossRef] [PubMed]
  2. Perveen, S.; Al-Taweel, A. Terpenes and Terpenoids; BoD–Books on Demand: London, UK, 2018. [Google Scholar]
  3. Banthorpe, D.; Wirz-Justice, A. Terpene biosynthesis. Part I. Preliminary tracer studies on terpenoids and chlorophyll of Tanacetum vulgare L. J. Chem. Soc. C Org. 1969, 4, 541–549. [Google Scholar] [CrossRef]
  4. Pichersky, E.; Raguso, R.A. Why do plants produce so many terpenoid compounds? New Phytol. 2018, 220, 692–702. [Google Scholar] [CrossRef] [PubMed]
  5. Zebec, Z.; Wilkes, J.; Jervis, A.J.; Scrutton, N.S.; Takano, E.; Breitling, R. Towards synthesis of monoterpenes and derivatives using synthetic biology. Curr. Opin. Chem. Biol. 2016, 34, 37–43. [Google Scholar] [CrossRef]
  6. Haney, S.L.; Wills, V.S.; Wiemer, D.F.; Holstein, S.A. Recent advances in the development of mammalian geranylgeranyl diphosphate synthase inhibitors. Molecules 2017, 22, 886. [Google Scholar] [CrossRef]
  7. Muehlebach, M.E.; Holstein, S.A. Geranylgeranyl diphosphate synthase: Role in human health, disease and potential therapeutic target. Clin. Transl. Med. 2023, 13, e1167. [Google Scholar] [CrossRef]
  8. Ruiz-Sola, M.; Barja, M.V.; Manzano, D.; Llorente, B.; Schipper, B.; Beekwilder, J.; Rodriguez-Concepcion, M. A Single Arabidopsis Gene Encodes Two Differentially Targeted Geranylgeranyl Diphosphate Synthase Isoforms. Plant Physiol. 2016, 172, 1393–1402. [Google Scholar] [CrossRef]
  9. Zhou, F.; Wang, C.Y.; Gutensohn, M.; Jiang, L.; Zhang, P.; Zhang, D.; Dudareva, N.; Lu, S. A recruiting protein of geranylgeranyl diphosphate synthase controls metabolic flux toward chlorophyll biosynthesis in rice. Proc. Natl. Acad. Sci. USA 2017, 114, 6866–6871. [Google Scholar] [CrossRef]
  10. Feng, W.; Mehari, T.G.; Fang, H.; Ji, M.; Qu, Z.; Jia, M.; Wang, D.; Ditta, A.; Khan, M.K.R.; Cao, Y.; et al. Genome-wide identification of the geranylgeranyl pyrophosphate synthase (GGPS) gene family involved in chlorophyll synthesis in cotton. BMC Genom. 2023, 24, 176. [Google Scholar] [CrossRef]
  11. Dong, C.; Wang, Z.; Qin, L.; Zhang, C.; Cao, L.; Li, H.; Ma, X. Overexpression of geranyl diphosphate synthase 1 (NnGGPPS1) from Nelumbo nucifera enhances carotenoid and chlorophyll content and biomass. Gene 2023, 881, 147645. [Google Scholar] [CrossRef]
  12. Sun, T.; Zhang, J.; Zhang, Q.; Li, X.; Li, M.; Yang, Y.; Zhou, J.; Wei, Q.; Zhou, B. Methylome and transcriptome analyses of three different degrees of albinism in apple seedlings. BMC Genom. 2022, 23, 310. [Google Scholar] [CrossRef]
  13. Beck, G.; Coman, D.; Herren, E.; Ruiz-Sola, M.A.; Rodríguez-Concepción, M.; Gruissem, W.; Vranová, E. Characterization of the GGPP synthase gene family in Arabidopsis thaliana. Plant Mol. Biol. 2013, 82, 393–416. [Google Scholar] [CrossRef] [PubMed]
  14. Zhang, C.; Liu, H.; Zong, Y.; Tu, Z.; Li, H. Isolation, expression, and functional analysis of the geranylgeranyl pyrophosphate synthase (GGPPS) gene from Liriodendron tulipifera. Plant Physiol. Biochem. PPB 2021, 166, 700–711. [Google Scholar] [CrossRef] [PubMed]
  15. Zhang, M.; Su, P.; Zhou, Y.J.; Wang, X.J.; Zhao, Y.J.; Liu, Y.J.; Tong, Y.R.; Hu, T.Y.; Huang, L.Q.; Gao, W. Identification of geranylgeranyl diphosphate synthase genes from Tripterygium wilfordii. Plant Cell Rep. 2015, 34, 2179–2188. [Google Scholar] [CrossRef]
  16. Tata, S.K.; Jung, J.; Kim, Y.H.; Choi, J.Y.; Jung, J.Y.; Lee, I.J.; Shin, J.S.; Ryu, S.B. Heterologous expression of chloroplast-localized geranylgeranyl pyrophosphate synthase confers fast plant growth, early flowering and increased seed yield. Plant Biotechnol. J. 2016, 14, 29–39. [Google Scholar] [CrossRef] [PubMed]
  17. Finn, R.D.; Clements, J.; Eddy, S.R. HMMER web server: Interactive sequence similarity searching. Nucleic Acids Res 2011, 39, W29–W37. [Google Scholar] [CrossRef] [PubMed]
  18. Horton, P.; Park, K.-J.; Obayashi, T.; Fujita, N.; Harada, H.; Adams-Collier, C.; Nakai, K. WoLF PSORT: Protein localization predictor. Nucleic Acids Res. 2007, 35, W585–W587. [Google Scholar] [CrossRef] [PubMed]
  19. Chou, K.-C.; Shen, H.-B. Cell-PLoc 2.0: An improved package of web-servers for predicting subcellular localization of proteins in various organisms. Nat. Sci. 2010, 2, 1090. [Google Scholar] [CrossRef]
  20. Tamura, K.; Stecher, G.; Peterson, D.; Filipski, A.; Kumar, S. MEGA6: Molecular Evolutionary Genetics Analysis version 6.0. Mol. Biol. Evol. 2013, 30, 2725–2729. [Google Scholar] [CrossRef]
  21. Chen, C.; Chen, H.; Zhang, Y.; Thomas, H.R.; Frank, M.H.; He, Y.; Xia, R. TBtools: An integrative toolkit developed for interactive analyses of big biological data. Mol. Plant 2020, 13, 1194–1202. [Google Scholar] [CrossRef]
  22. Librado, P.; Rozas, J. DnaSP v5: A software for comprehensive analysis of DNA polymorphism data. Bioinformatics 2009, 25, 1451–1452. [Google Scholar] [CrossRef] [PubMed]
  23. Guo, A.Y.; Zhu, Q.H.; Chen, X.; Luo, J.C. GSDS: A gene structure display server. Yi Chuan Hereditas 2007, 29, 1023–1026. [Google Scholar] [CrossRef]
  24. Marchler-Bauer, A.; Bo, Y.; Han, L.; He, J.; Lanczycki, C.J.; Lu, S.; Chitsaz, F.; Derbyshire, M.K.; Geer, R.C.; Gonzales, N.R.; et al. CDD/SPARCLE: Functional classification of proteins via subfamily domain architectures. Nucleic Acids Res. 2017, 45, D200–D203. [Google Scholar] [CrossRef] [PubMed]
  25. Machanick, P.; Bailey, T.L. MEME-ChIP: Motif analysis of large DNA datasets. Bioinformatics 2011, 27, 1696–1697. [Google Scholar] [CrossRef] [PubMed]
  26. Lescot, M.; Déhais, P.; Thijs, G.; Marchal, K.; Moreau, Y.; Van de Peer, Y.; Rouzé, P.; Rombauts, S. PlantCARE, a database of plant cis-acting regulatory elements and a portal to tools for in silico analysis of promoter sequences. Nucleic Acids Res. 2002, 30, 325–327. [Google Scholar] [CrossRef]
  27. Waterhouse, A.; Bertoni, M.; Bienert, S.; Studer, G.; Tauriello, G.; Gumienny, R.; Heer, F.T.; de Beer, T.A.P.; Rempfer, C.; Bordoli, L.; et al. SWISS-MODEL: Homology modelling of protein structures and complexes. Nucleic Acids Res. 2018, 46, W296–W303. [Google Scholar] [CrossRef]
  28. Lalitha, S. Primer premier 5. Biotech Softw. Internet Rep. Comput. Softw. J. Sci. 2000, 1, 270–272. [Google Scholar] [CrossRef]
  29. Orlova, I.; Nagegowda, D.A.; Kish, C.M.; Gutensohn, M.; Maeda, H.; Varbanova, M.; Fridman, E.; Yamaguchi, S.; Hanada, A.; Kamiya, Y.; et al. The small subunit of snapdragon geranyl diphosphate synthase modifies the chain length specificity of tobacco geranylgeranyl diphosphate synthase in planta. Plant Cell 2009, 21, 4002–4017. [Google Scholar] [CrossRef]
  30. Rasouli, O.; Ahmadi, N.; Monfared, S.R.; Sefidkon, F. Physiological, phytochemicals and molecular analysis of color and scent of different landraces of Rosa damascena during flower development stages. Sci. Hortic. 2018, 231, 144–150. [Google Scholar] [CrossRef]
  31. Sun, B.; Jiang, M.; Yuan, Q.; Zhang, F.; Tang, H. Sequence Analysis of the Geranylgeranyl Pyrophosphate Synthase Gene in Cabbage. IOP Conference Series: Materials Science and Engineering 2018, 452, 022074. [Google Scholar] [CrossRef]
  32. Ali, F.; Qanmber, G.; Wei, Z.; Yu, D.; Li, Y.h.; Gan, L.; Li, F.; Wang, Z. Genome-wide characterization and expression analysis of geranylgeranyl diphosphate synthase genes in cotton (Gossypium spp.) in plant development and abiotic stresses. BMC Genom. 2020, 21, 561. [Google Scholar] [CrossRef] [PubMed]
  33. Panchy, N.; Lehti-Shiu, M.; Shiu, S.H. Evolution of Gene Duplication in Plants. Plant Physiol 2016, 171, 2294–2316. [Google Scholar] [CrossRef] [PubMed]
  34. Wagner, A. The fate of duplicated genes: Loss or new function? BioEssays News Rev. Mol. Cell. Dev. Biol. 1998, 20, 785–788. [Google Scholar] [CrossRef]
  35. Friedman, R.; Hughes, A.L. Gene duplication and the structure of eukaryotic genomes. Genome Res. 2001, 11, 373–381. [Google Scholar] [CrossRef]
  36. De Bodt, S.; Maere, S.; Van de Peer, Y. Genome duplication and the origin of angiosperms. Trends Ecol. Evol. 2005, 20, 591–597. [Google Scholar] [CrossRef] [PubMed]
  37. Zhou, F.; Guo, Y.; Qiu, L.J. Genome-wide identification and evolutionary analysis of leucine-rich repeat receptor-like protein kinase genes in soybean. BMC Plant Biol. 2016, 16, 58. [Google Scholar] [CrossRef]
  38. Davis, J.C.; Petrov, D.A. Preferential duplication of conserved proteins in eukaryotic genomes. PLoS Biol. 2004, 2, E55. [Google Scholar] [CrossRef]
  39. Min, D.D.; Tang, M.Q.; Li, G.; Qu, X.S.; Miao, J.H. Cloning and expression analysis of GGPPS gene from Panax notoginseng. Zhongguo Zhong Yao Za Zhi Zhongguo Zhongyao Zazhi China J. Chin. Mater. Med. 2015, 40, 2090–2095. [Google Scholar]
  40. Zhao, L. Cloning, bioinformatic analysis and expression analysis of RgGGPPS2 gene from Rehmannia glutinosa. Chin. Tradit. Herb. Drugs 2017, 48, 2269–2278. [Google Scholar]
  41. Lv, Y.; Chen, Y.; Wang, P. Cloning and Expression Analysis of GGPPS Gene from Mango (Mangifera indica). Mol. Plant Breed. 2017, 15, 65–70. [Google Scholar] [CrossRef]
  42. Vranová, E.; Coman, D.; Gruissem, W. Network analysis of the MVA and MEP pathways for isoprenoid synthesis. Annu. Rev. Plant Biol. 2013, 64, 665–700. [Google Scholar] [CrossRef] [PubMed]
Figure 1. Phenotypic characterization of siliques of B. oleracea lines WT (left) and Boas1 (right).
Agriculture 13 01615 g001
Figure 2. Phylogenetic tree of GGPPS genes from A. thaliana, B. oleracea, and B. rapa. Background colors: blue represents A. thaliana’ genes, red represents B. rapa’ genes, and green represents B. oleracea’ genes. The Roman numerals I, II, III, and IV represent four sub-groups, Groups I, II, III, and IV, respectively. The neighbor-joining (NJ) method was used to construct the phylogenetic tree with 1000 bootstrap replications.
Agriculture 13 01615 g002
Figure 3. Distribution and syntenic relationships of GGPPS genes in A. thaliana and B. oleracea chromosomes. The numbers 1 to 5 represent the five chromosomes of A. thaliana, while C01 to C09 represent the nine chromosomes of B. oleracea. Green lines represent homologous genes between A. thaliana and B. oleracea chromosomes, and orange lines represent homologous genes in B. oleracea chromosomes. The color scale of the bar graph represents the level of gene density, with the blue color indicating low-level gene density and the red color indicating high-level gene density.
Agriculture 13 01615 g003
Figure 4. Distribution of the Ka/Ks ratio. The solid black line indicates a Ka/Ks ratio = 1, the above black solid line and blue dots represent orthologous gene pairs with a Ka/Ks ratio ≥ 1, while the below black solid line and red dots indicate orthologous gene pairs with a Ka/Ks ratio < 1.
Agriculture 13 01615 g004
Figure 5. Distribution of conserved motifs (left), domain structure (middle), and gene structures (right) of ten GGPPS genes identified in B. oleracea. Different colored boxes visually represent the ten putative motifs and domains. The lengths of these motifs and domains in each gene are depicted proportionally. Introns are represented by gray lines elements while exons are represented by green boxes.
Agriculture 13 01615 g005
Figure 6. Prediction of cis-acting elements in the promoter regions of BoGGPPS genes. The distribution of the BoGGPPS promoter’s cis-acting elements and their respective names, represented by different colors, were provided for easy recognition.
Agriculture 13 01615 g006
Figure 7. Prediction of the 3D structures of ten BoGGPPS proteins.
Agriculture 13 01615 g007
Figure 8. Analysis of BoGGPPS genes’ transcript profiles via RNA-Seq and heatmap visualization in different organs. The heatmap’s color scale represents the level of gene expression, where the red color indicates high-level gene expression, and the blue color represents low-level gene expression.
Agriculture 13 01615 g008
Figure 9. Transcript levels of the ten BoGGPPS genes in WTL (Wild-Type Leaf), WTS (Wild-Type Silique), Boas1L (Brassica oleracea albino silique 1 Leaf), and Boas1S (Brassica oleracea albino silique 1 Silique). Actin has been used as an internal reference to normalize all experiments. The data are presented as means ± standard deviation (n = 3). Significant differences are indicated by letters and determined via one-way ANOVA (Tukey’s test; p < 0.05).
Agriculture 13 01615 g009
Figure 10. Subcellular localization of the Bol028967-GFP fusion proteins in N. benthamiana leaves. Red indicates chloroplast autofluorescence, and green indicates the green fluorescent protein. Bars represent 20 μm.
Agriculture 13 01615 g010
Table 1. Summary of BoGGPPS gene family members in B. oleracea.
Gene IDChr.Genomic LocationCDS Length (bp)Protein Length (aa)Predicted Localization
Bol028967C011,144,276–1,145,3881113370Chloroplast/Plastid.
Bol014868C0233,838,601–33,840,5071161386Mitochondrion
Bol025714C0316,628,201–16,629,5581077358Chloroplast/Plastid
Bol027375C0421,181,019–21,185,9592022673Chloroplast
Bol037851C0435,798,177–35,800,174678225Chloroplast
Bol038277C056,816,936–6,818,9151263420Chloroplast
Bol027478C06694,779–700,4222550849Chloroplast/Nucleus
Bol007930C0729,493,460–29,495,4601002333Mitochondrion
Bol036967C0740,793,183–40,795,8041284427Chloroplast
Bol045796C0834,611,666–34,612,7811116371Chloroplast
Disclaimer/Publisher’s Note: The statements, opinions and data contained in all publications are solely those of the individual author(s) and contributor(s) and not of MDPI and/or the editor(s). MDPI and/or the editor(s) disclaim responsibility for any injury to people or property resulting from any ideas, methods, instructions or products referred to in the content.

