Abstract
In recent years, the domain of diagnosing plant afflictions has predominantly relied upon the utilization of deep learning techniques for classifying images of diseased specimens; however, these classification algorithms remain insufficient for instances where a single plant exhibits multiple ailments. Consequently, we view the region afflicted by the malady of rice leaves as a minuscule issue of target detection, and then avail ourselves of a computational approach to vision to identify the affected area. In this paper, we advance a proposal for a Dense Higher-Level Composition Feature Pyramid Network (DHLC-FPN) that is integrated into the Detection Transformer (DETR) algorithm, thereby proffering a novel Dense Higher-Level Composition Detection Transformer (DHLC-DETR) methodology which can effectively detect three diseases: sheath blight, rice blast, and flax spot. Initially, the proposed DHLC-FPN is utilized to supersede the backbone network of DETR through amalgamation with Res2Net, thus forming a feature extraction network. Res2Net then extracts five feature scales, which are coalesced through the deployment of high-density rank hybrid sampling by the DHLC-FPN architecture. The fused features, in concert with the location encoding, are then fed into the transformer to produce predictions of classes and prediction boxes. Lastly, the prediction classes and the prediction boxes are subjected to binary matching through the application of the Hungarian algorithm. On the IDADP datasets, the DHLC-DETR model, through the utilization of data enhancement, elevated mean Average Precision (mAP) by 17.3% in comparison to the DETR model. Additionally, mAP for small target detection was improved by 9.5%, and the magnitude of hyperparameters was reduced by 324.9 M. The empirical outcomes demonstrate that the optimized structure for feature extraction can significantly enhance the average detection accuracy and small target detection accuracy of the model, achieving an average accuracy of 97.44% on the IDADP rice disease dataset.
1. Introduction
Rice is a staple food crop of paramount importance to humankind, occupying 35.6% of the total area cultivated for food crops in China. Unfortunately, it is also one of the crops most susceptible to pests and diseases. China has unveiled a plan to advance agricultural and rural modernization [1] demand: bolster the development of monitoring and early warning networks, augment the system for controlling crop pests and diseases, and augment the capability to prevent and manage agricultural disasters. Presently, the identification of rice diseases primarily relies on manual biological identification in the field [2], which not only expends significant human and material resources but also results in a low identification rate and lacks real-time efficacy, thus frequently missing the optimal window for disease control. Therefore, the use of computer vision methods for the automatic and efficient detection of rice diseases, and timely and accurate detection of rice leaf diseases, is important for increasing rice yields, reducing costs, etc.
Currently, disease detection methods can be broadly divided into two categories: object detection and classification. Several existing deep-learning methods concentrate on the classification of plant disease images [3,4]. However, if multiple diseases are present in a single image, the classification algorithm may not detect the diseases comprehensively. Consequently, the application of target detection methodologies presents a viable solution to the aforementioned predicaments. The object detection algorithms are generally divided into anchor base and transformer base; the anchor base algorithm is represented by the YOLO [5,6] algorithm and the transformer base is represented by the Detection Transformer (DETR) [7]. The existing mainstream object detection methods are based on horizontal candidate anchor boxes and solve the object detection problem by generating a large number of anchor boxes and then judging whether the object is hit or not, but this method makes the number of candidate anchor boxes proliferate and leads to the excessive computational overhead of the algorithm. The DETR algorithm, represented by the transformer base, does not need to generate anchors, and with the help of the transformer structure, the center position, scale, and aspect ratio of the target of interest are predicted using semantic features, and they are combined to obtain a horizontal high-quality anchor frame as a candidate frame, which has more global view capability and better performance [8].
Since Convolutional Neural Networks (CNNs) were proposed, target detection methods based on deep learning have replaced the traditional methods and become mainstream. The CNN architecture prioritizes local feature information over global feature information. In contrast, transformer architecture places greater emphasis on global feature information and can concurrently forecast object class information [9]. The transformer was originally used in the Nature Language Process (NLP) field; CARION N et al. proposed the use of DETR to apply the transformer to object detection for the first time and without generating prior knowledge, such as an anchor. It works as fast as RCNN [10] and is more capable of detection. Since the application of DETR transformers to object detection began, papers that improve on the DETR algorithm have greatly increased in number. Xi et al. proposed Deformable DETR [11] because transformers focus on global information, leading to processing image signature maps having slow convergence and limited spatial resolution. The attention mechanism in Deformable DETR only focuses on a small amount of information near the sample point, so better performance can be achieved. Zhi et al. proposed an Unsupervised Pre-train DETR (UP-DETR) [12] for object detection. By randomly clipping the original image into the decoder as a query, UP-DETR significantly improves the average accuracy of DETR in target detection and panoramic segmentation. Many articles have used different methods to improve input-dependent query formulation to improve convergence speed and detection accuracy to improve the slow convergence caused by initialization [13,14,15,16]. All of the above DETR algorithms are based on improving the transformer structure to improve performance. In this paper, we enhance the DETR algorithm for small target detection by adding the proposed FPN structure.
For crop disease detection, Amreen Abbas et al. first used the generation of synthetic pictures of tomato plant leaves against the network C-GAN [17], then used the tomato disease detection method based on deep learning to migrate learning on DenseNet121. The accuracy of five, seven, and ten classes on the PlantVillage dataset was 99.51%, 98.65%, and 97.11%, respectively. Shao et al. used the upstream network composed of unsupervised training combined with migratory learning [18], and the downstream network was composed of EFN and DETR. The E-HLBUP-DETR diagnostic model was established, and the recognition rate of Citrus Yellow Dragon disease was 96.2%. M. Hammad Masood et al. used Mask-RCNN to detect early disease in rice [19]. The accuracy of the local dataset was higher than 87.6%, and that of data without local information was 58.4%. The area of rice disease is a small target, and improving the detection ability of algorithms for small targets is an urgent problem to be solved. Li et al. improved the Mask R-CNN algorithm and enhanced the performance of the algorithm by improving the proportion of anchors in the RPN network [20] and changing the feature topology extraction structure to identify tomato-infected areas. There are also improved target detection algorithms based on YOLOv4 [21,22,23], Deep Convolutional Networks, and faster R-CNN, but these methods do not possess enough strong feature extraction capabilities due to weak detection capabilities for small objects.
The area of rice diseases is typically small, oval, or elongated, and contiguous. Additionally, multiple diseases can appear simultaneously on a single plant, rendering the classification algorithm incapable of comprehensively categorizing the disease types. Therefore, this article considers the disease area as a small target and then uses object detection technology to detect the small disease area. We propose a rice leaf disease detection algorithm, DHLC-DETR, based on DETR, which introduces a Neck structure and proposes a Dense Higher Level Composition–Feature Pyramid Network (DHLC-FPN) based on the Feature Pyramid Network (FPN) [24]. We replace the original ResNet [25] Backbone part of DETR with DHLC-FPN and Res2Net [26] to improve the detection accuracy of small disease targets. The details of the proposed algorithm can be found in Section 2.3.
The remainder of this paper is organized as follows. Section 2 concentrates on the fundamental methods employed and the proposed DHLC-FPN structure, as well as the DHLC-DETR algorithm. Section 3 delineates the data set and data enhancement methods, and presents the experimental results, comparative experimental results, and the results of ablation experiments. Section 4 illuminates its limitations and points towards avenues for future optimization. Finally, Section 5 concludes this paper. In this paper, the DHLC-FPN structure is proposed and incorporated into the DETR framework to improve the feature extraction capability of the model and thus improve the original DETR model for small target detection.
2. Methodologies
2.1. Experimental Design
As shown in Figure 1, the specific process of the method for detecting rice leaf disease is as follows. Step 1: Obtain images of the diseased rice leaves. Step 2: Annotate the different disease categories to obtain annotated image files. Step 3: Enhance and fuse the original dataset with itself by utilizing image enhancement and in-frame enhancement techniques. Step 4: Develop the DHLC-DETR model and employ the amalgamated dataset to carry out both the training and validation phases. The original ResNet Backbone is replaced with Res2Net, and the DHLC-FPN structure is added to enhance the feature extraction capability; see Section 2.3 for details of the structure. Step 5: After the model’s successful training, employ it for detecting images of diseased rice leaves through the utilization of the trained model.
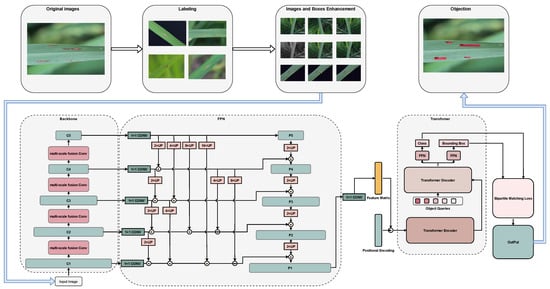
Figure 1.
Rice disease detection workflow, including image acquisition, image pre-processing, image enhancement, and model prediction of final output results.
2.2. Image Augmentation
For better experimental results, the image augmentation of rice leaf disease pictures mainly includes boundary box augmentation [27] and image augmentation. As shown in Figure 2, both methods are used to flip, cut, blur, noise, change gray level, and so on. The former pertains to the complete image, while the latter is specific to the image contained within the bounding box. By applying image enhancement, the size of the image can be expanded, thereby augmenting the generalizability and resilience of the detection model. As a result of image enhancement, the data volume can be increased to a total of 17,640 images. Refinements to the boundary box can refine the generalizability of models by generating simulated data that is based on real data, and refining the bounding box can produce data that is theoretically realistic.
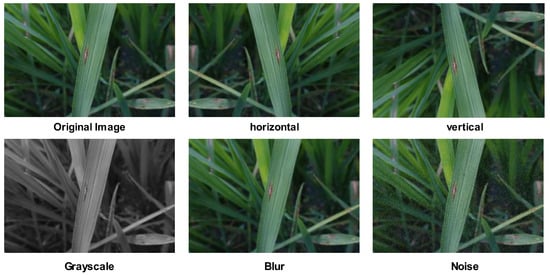
Figure 2.
Image augmentation with original image, horizontal and vertical flipping, grayscale, blur, and noise.
Owing to the high pixel dimensions of the original image, completely cropping the original image into 2 × 2 pictures can heighten the detection capability of the model for small targets, while also amplifying the quantity of data. Flipping horizontally and vertically is another approach, as shown in Figure 2, which is mainly a flip operation for image data. Real pictures are theoretically possible in this case because of reasons such as shooting angles, and therefore such data enhancement is necessary. The purpose of image grayscale transformation is to reduce the complexity of the matrix and expedite operations, while the application of slight Gaussian blurring to the image through fuzzy processing can enhance the recognition rate of certain undetectable areas. For example, in the second image below Figure 2, the focus of the image is concentrated in the middle disease area, and the location of the disease in the lower right corner is relatively blurred. Fuzzy processing of the image can improve the model’s ability to detect blurred areas. Noise processing is shown in the lower right of Figure 2. Adding some noise to the original image can improve the robustness and generalization of the model.
Boundary box augmentation mainly generates new training data by changing the content of the source image bounding box and improves the generality of the training model by changing the form of the image within the bounding box, and by blurring, rotating, flipping, gray level change, noise addition, etc. The border-box enhancements are shown in Figure 3.

Figure 3.
Box boundary augmentation with original image, box blur, and box rotation.
2.3. Improvement of Detection Transformer Model
2.3.1. Res2Net Backbone
The ResNet50 model is the default backbone of the original DETR model, primarily comprised of Bottleneck structural blocks within. In this paper, all Bottleneck structure components present in ResNet were substituted with Res2Net modules. These modules inherit several advantages of ResNet networks, and the multi-scale concept utilized by Res2Net can significantly enhance the extraction and feature expression capabilities of the backbone for multi-scale features. As illustrated in Figure 4, Res2Net consolidates all convolutional kernels while retaining the size and quantity of convolutional kernels in the original structure. Then, it connects the layers like layered residual networks and uniformly partitions the feature mapping into s subsets of feature mapping where after point-by-point convolution. Each feature mapping subset in the set possesses an equivalent size and channel quantity. Following the convolution operation, the feature mapping subset is utilized as the input data for the next set of residual structures, and the Res2Net input data are expressed as follows:
where denotes each different subset of feature mappings, denotes the convolution operation, and denotes the output data.
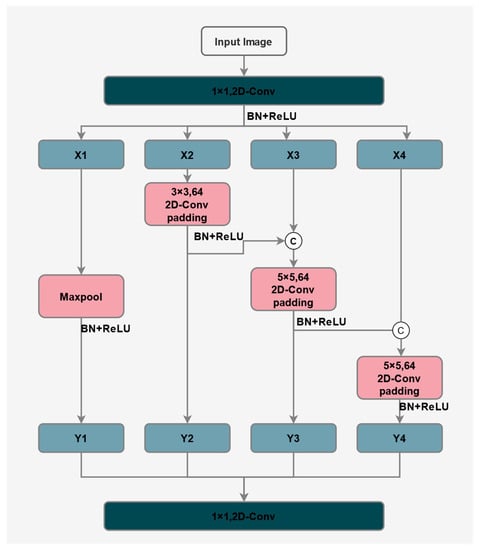
Figure 4.
Res2Net Struct. Res2Net employs internal multi-scale convolution, which distinguishes it from ResNet.
2.3.2. Improvement of the Feature Extraction Structure
The disease detection task is usually a small target, and the disease area may be only dozens of pixels in size. As the convolutional network increases in depth, semantic information is progressively reinforced while the image features are gradually diminished. Despite the deep network’s ability to generate robust semantic features, it lacks the necessary image features for effectively detecting small targets in disease detection. In contrast, shallow networks incorporate more geometric information while comprising fewer semantic features, thereby hindering their efficacy in the classification of image prediction boxes. This paper’s introduction of an FPN network, which combines shallow and deep networks, enhances the backbone’s feature extraction so that the output features have more dimension information. FPN architecture is primarily divided into several stages: a bottom-up network for extracting characteristic features, semantic information extraction, top-down feature supplementation, feature sampling, and ultimately the output of a multi-scale feature map.
To further improve the ability of DETR to detect small objects, we proposed a DHLC-FPN structure based on the FPN structure, which can better integrate the scale information of each layer. FPN uses top-down fusion, upper features, and backbone lateral branch 1 × 1 convolution fusion; simple branch fusion cannot fully fuse other lateral branch information, so there is an optimal space for lateral branch fusion to fuse the features of each layer. The extraction of features is carried out on the primary input disease image, whereby the distinct stage feature maps are extracted and labeled as , , , , and . Assuming that the primary image is of dimensions L × L, subsequent to multi-stage convolutional pooling, the size of is , the size of is , the size of is , the size of is , and the size of is . DHLC-FPN primarily upsamples all feature maps that are smaller than the current scale, followed by performing class residual fusion, as illustrated in Figure 5. This enables it to obtain superior global feature information and achieve an effective fusion of top-level semantic information and bottom-level spatial information.
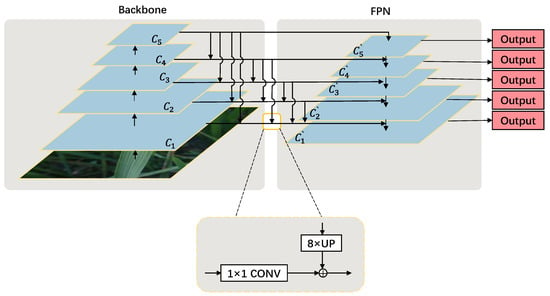
Figure 5.
DHLC-FPN structure. DHLC-FPN employs Dense Higher-Level Composition multi-scale convolution, which distinguishes it from FPN.
2.3.3. Transformer
The transformer network is primarily employed to fulfill the detection task. The network is comprised of two fundamental components, namely the feature encoder and prediction box decoder, and the overall structure is exhibited in Figure 6. The original image is input to the transformer with the 1D feature matrix extracted by Res2Net and FPN features combined with position encoding.
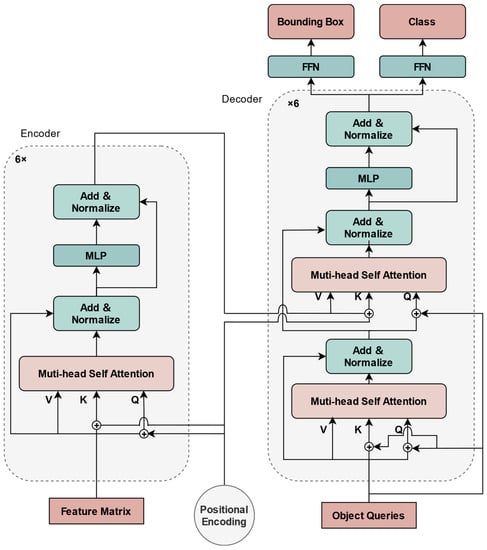
Figure 6.
Transformer structure. The input features combined with the location encoding go through the Encoder and Decoder and finally output bounding box and class.
Sine and Cosine position encoding is calculated as follows:
where is the location of the data map and represents the dimension of the input vector after it has been mapped. and respectively represent even and odd dimensions, and then use sine and cosine functions to encode the location.
Then, the input is transferred into the transformer, imported into N Decoders after N Encoders, and then the output of the Decoder is embedded into a Feed-Forward network (FFN) [28] to generate prediction boxes and prediction categories.
2.3.4. Hungarian Loss
The Ground Truth (GT) box and the Prediction box are binary-matched using the Hungarian algorithm [29]. This is mainly used to measure the similarity between two sets; the Hungarian algorithm is as follows:
where represents the label of the data, represents the label of the data, is the vector of the coordinates and dimensions of the GT box, and is the set of predicted results. denotes the probability that the predicted class of object is , and denotes its predicted bounding box. The loss function is calculated as follows:
where is the probability that an object is predicted to be a certain class and is also used in the cross-entropy calculation to classify loss, includes the center point of the prediction box, GT, position loss of width, height L1 loss, and size loss GIoU loss; is GIoU loss; and is Hyper-parameter.
2.3.5. DHLC-DETR Model
DETR is an end-to-end model that incorporates both CNN and transformer architectures. This model is a refinement of DETR and introduces a Neck structure based on DHLC-FPN and improves the Backbone, as shown in Figure 7. After pre-processing, the input image is fed into Res2Net. DHLC-FPN structure combines the sampled information using Res2Net up-sampling and FPN down-sampling to obtain a feature map with high information density. The Position Encoding set is then input to the transformer for encoding and decoding, output prediction box and prediction classes, and then uses the Hungarian algorithm to fit prediction boxes and classes. By enhancing image features, DHLC-DETR improves the small target detection capability while simultaneously reducing the number of hyperparameters needed for model detection.
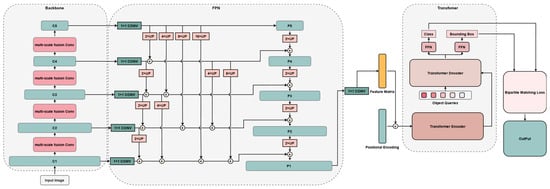
Figure 7.
DHLC-DETR structure. The figure gives the whole process of DHLC-DETR model processing, where the input image goes through the Backbone for feature extraction, is then input to FPN for feature expansion, and is finally input to the transformer for prediction.
2.4. Experimental Setup
2.4.1. Experiment Platform
This paper conducted experiments on the IDADP dataset under the following conditions: Ubuntu server with Intel 12 generation Core i7-12700 CPU, 16GB memory. The GPU is NVIDIA GeForce RTX3070, with 8G video memory. The programming language is Python version 3.8, PyTorch version 1.13.0, and CUDA version 11, developed with MMdetection toolbox [30].
2.4.2. Evaluation Metrics
The evaluation indexes used in this paper were mean Average Precision (mAP), Recall, and IOU. AP is the lower area of the Precision–Recall curve, and the formula is as follows:
where is Precision accuracy, and R is Recall, and Precision and Recall can also be calculated as follows:
True Positive (TP) indicates that the disease sample is predicted correctly, False Positive (FP) indicates a disease sample that failed to predict, and True Negative (TN) indicates normal samples with correct predictions. Precision indicates the correct proportion predicted by the prediction box, and Recall indicates the correct proportion of real box prediction.
AP represents the precision of a certain category, mAP is the mean of all kinds of APs, and mAP is the mean value of all categories of AP, and the formula is as follows:
The IoU formula is as follows:
The area of overlap refers to the intersection area of the prediction box and the real box, and the area of union refers to the union area of the prediction box and the real box.
3. Results
3.1. Datasets
According to the analysis of the 2010–2020 China Plant Protection Professional Statistics, the three major diseases rice sheath blight, rice blast, and brown spot disease caused yield losses of about 1.025 million tons, 174,900 tons and 121,700 tons, respectively, in the main rice-producing areas of China [31], and the safety of rice production is a strategic issue related to social stability and national security in China. Therefore, we selected three datasets of sheath blight, rice blast, and brown spot. Disease images are difficult to collect, so we chose three common disease images that are relatively easier to collect.
The dataset used for training and validation in this experiment was the Image Database for Agricultural Diseases and Pests Research (IDADP) [32]. Under the leadership of the Hefei Institute of Intelligent Machinery, Chinese Academy of Sciences, a large amount of agricultural pest and disease data has been integrated. The data were sourced from the competition data set of the field crop disease image recognition technology challenge organized by the China Pattern Recognition and Computer Vision Conference in 2019 (PRCV2019). The disease types under consideration were rice blast, brown spot, and sheath blight. Figure 8 displays images of the three types of diseases, each of which had 600 samples. The initial size of each image in the dataset was 3000 × 2000, and the original data were unmarked. Additionally, disease areas with a diameter greater than 3 mm were manually labeled for the three types of diseases. The disease areas with a diameter of less than 3 mm were considered neither false negative nor false positive. The specific picture information is shown in Table 1.

Figure 8.
Images of three kinds of diseases: blast, brown spot, and sheath blight.

Table 1.
Picture params.
3.2. Comparison of Different Detection Techniques
The DHLC-DETR algorithm proposed in this paper is an improvement based on the DETR model, and it was verified that the proposed algorithm is superior to the DETR algorithm in small target detection ability, detection rate, and detection accuracy. This experiment was based on the IDADP dataset and compared with the DETR, SSD, YOLOv3, Faster RCNN, and Mask RCNN algorithms. The model parameters are shown in Table 2.

Table 2.
Training parameters.
As shown in Figure 9, the variation of mAP with the number of epochs is demonstrated. The incorporation and refinement of the FPN structure in the DETR model, as expounded in this study, enables more efficient extraction of network features than the DETR model, thus facilitating precise prediction of small-scale targets. In addition to exhibiting higher AP values, it is evident that the DHLC-DETR algorithm converges more rapidly. The graph illustrates that the model attains stability at 15 epochs. Furthermore, the DHLC-DETR algorithm demonstrates a superior ability to detect small targets as compared to mainstream target detection algorithms.
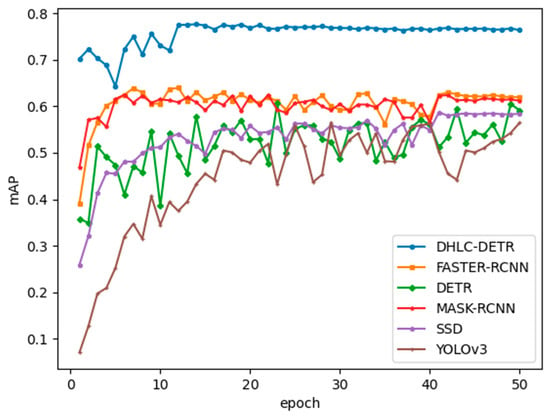
Figure 9.
Comparison of mainstream algorithms AP with epoch changes.
To verify the effectiveness of the proposed DHLC-DETR algorithm, and ensure an equitable comparison, all parameters, including data preprocessing, image enhancement, and the number of iterations, were set to be identical, except for the method employed, and , AP, , , , and parameters and were compared. , , and denote the detection accuracy at small, medium, and large sizes, and Params denotes the number of super parameters, as shown in Table 3.

Table 3.
Comparison of operation results of different models.
All algorithms utilize the image-enhanced datasets as a default setting. Image enhancement techniques can augment the volume of images when the data are scarce, accentuate the distinctions between various target features, and enhance the amount of data. In comparative experiments, the introduction of DHLC-DETR into the DHLC-FPN structure could extract features well and improve the detection ability of small targets. Compared with the DETR model, the BoxAP was improved by 17.3% and Small, Middle, and Large target detection AP was improved by 9.5%, 13.4%, and 8.8%, respectively. Because the introduction of FPN structure made the model structure more complex, the detection speed was reduced. FPS increased by 31.2 FLOPs compared to the DETR algorithm. In this experiment, only 50 epochs were trained, and more epochs may make the detection accuracy of the model better. Moreover, the DHLC-DETR model exhibited superior small target detection capability in comparison to conventional detection algorithms.
3.3. Comparison of Different Convolutional Neural Networks
This approach primarily employs ResNet and Res2Net as the underlying frameworks, integrating the FPN structure to extract features. To demonstrate the benefits of Res2Net and FPN, we contrasted the outcomes of diverse backbones combined with various FPN networks, while maintaining uniformity in all training processes concerning the parameters. Additionally, we kept the epoch, batch size, iteration, and learning rate consistent in all training processes, and the same input images and image augmentation were used.
Table 4 presents a comparative analysis of the outcomes achieved by ResNet50 ResNet50-FPN, ResNet50-DHLC-FPN, Res2Net50, Res2Net50-FPN, and Res2Net50-DHLC-FPN. All frameworks utilized were DETR. It can be inferred that the utilization of Res2Net in conjunction with DHLC-FPN resulted in the highest overall performance with an AP of 76.4%. Furthermore, this combination yielded superior results for detecting small targets compared to other combinations. Res2Net-DHLC-FPN exhibited an 8.1% increase in AP_s for small targets relative to Res2Net. This indicates that the utilization of the feature extraction structure can enhance the detection ability of the DETR algorithm toward small targets. Additionally, DHLC-FPN combines the semantic and location information of distinct special layers, which enables the acquisition of higher AP values. The enhancement of Res2Net over ResNet, with a minor increase of 1.2% in AP values, proves that the adoption of an improved backbone can yield a marginal improvement in detection capability. Furthermore, Res2Net outperformed ResNet owing to the greater granularity of Res2Net feature extraction.

Table 4.
Comparison of operation results of different backbone.
3.4. Ablation Analysis
Table 5 outlines our exploration of the impact of incorporating the FPN structure in the DETR model to bolster feature extraction ability and the consequent improvement in target detection ability. The Precision, Recall, and AP values were mainly compared; from the results, we can find that adding a DHLC-FPN structure to the DETR model was the most beneficial to model recognition ability. As is evident from the Frames Per Second (FPS) metric, incorporation of the FPN architecture may lead to some compromise in computational speed; however, it does yield some improvement in terms of accuracy.

Table 5.
FPN ablation experiment.
In Figure 10, we compare the box AP values of DETR, DETR-FPN, and DHLC-DETR with epoch. The result shows that adding the FPN structure can improve the detection ability of the model to some extent, while the DHLC-FPN structure can improve the detection ability of the FPN structure, but the training speed is slightly slower than the other two models due to the increased complexity of the model.
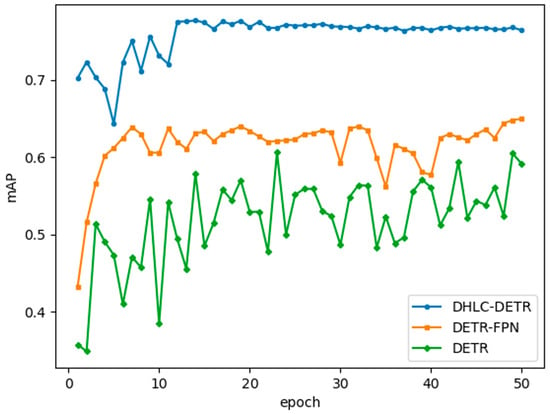
Figure 10.
Ablation experiment.
4. Limits and Future Work
The experimental dataset utilized in this study possesses several advantages over the experimental results, such as high image resolution, the proximity of targets, and sufficient illumination. However, in real-world scenarios, there may be several factors that affect detection efficiency, as depicted in Figure 11a, in which a rice stem borer is judged as a diseased area because of its similar color to a diseased area. Similarly, Figure 11b illustrates that recognition rates may be lower in more complex scenes; the possibility of misjudgment is caused by the dead grass under the water and the yellow leaves in the surroundings. Additionally, factors such as suboptimal lens performance, distant camera positioning, insufficient lighting, and poor image quality can all negatively impact detection ability. These factors may reduce the feature extraction ability of the DHLC-FPN structure, which leads to a decrease in detection accuracy.
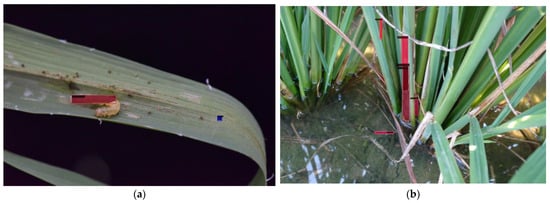
Figure 11.
(a) Foreign object interference: misjudging the rice borer as a diseased area. (b) Complex scene: water surface reflection, weeds, and other factors cause interference.
Moreover, we plan to acquire diverse forms of disease data; the data collected in the future will be collected manually by our team at regular intervals in the experimental field, and the image acquisition process will not use any artificial lighting measures to meet the outdoor environment requirements as accurately as possible, including rice false smut and bacterial leaf streak, to enhance the generality and robustness of our models. This will allow us to develop more accurate and reliable detection systems. Lastly, we will enhance our image processing techniques to improve detection capabilities in complex scenes; for instance, through the use of advanced methods such as EnlightenGAN [33] and ConSinGAN [34] image generation techniques to increase the size of our dataset. The Generative Adversarial Network (GAN) model evolved from the zero-sum game in free game theory. It mainly includes a generator and discriminator; the generator inputs random noise to learn a specific data distribution to generate images and then generates the results and the real data through the discriminator to determine whether it belongs to the real data through the cycle of discrimination, and finally generates the Nash equilibrium point to generate the closest point to the real data. A schematic diagram of the GAN network model is shown in Figure 12. Additionally, we will enhance the transformer’s attention mechanism [35,36] to improve performance and detection ability. To enhance the overall trajectory of the disease, we aim to utilize the time series methodology [37,38,39] to predict and regulate the time frame of row disease incidence throughout the complete growth cycle of rice.
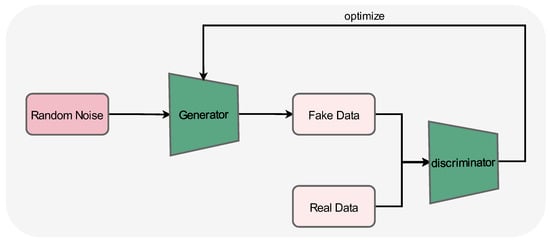
Figure 12.
Schematic diagram of the GAN model.
We will use formal proofs in the future to prove the feasibility of the algorithmic model [40,41]. To realize the machine-based verification of the proposed detection algorithm, a formal depiction of the entire process, ranging from image acquisition to the detection of the target image output, will be executed using the theorem-proving tool Coq. Subsequently, a formal proof of the DHLC-FPN structure will be undertaken, commencing from the proof system.
5. Conclusions
This paper presents the DHLC-DETR algorithm for detecting rice leaf diseases, which addresses the challenges posed by the limited samples, high variability, and small sizes of the affected regions. The DHLC-FPN network is proposed and used to replace the backbone of DETR. The proposed model is designed to improve the feature extraction capabilities of the feature pyramid while addressing issues related to the loss of high-level image information and low-level semantic information in convolutional networks. Experimental results indicate that the DHLC-DETR algorithm can significantly enhance the detection of small targets, surpassing the performance of the DETR algorithm in terms of mAP, and recall. To address the challenge posed by the limited number of samples, we employed image enhancement and transfer learning techniques to improve the generalization and detection performance of the algorithm.
Compared with image classification methods, the target detection method proposed in this paper can detect multiple disease targets on the same disease plant, and the recognition is more applicable. Compared with traditional biometric methods, the method proposed in this paper does not require much human intervention, and only a small amount of equipment, such as cameras, need to be deployed for accurate identification, with low cost and high real-time performance. In reality, it is possible to obtain and upload rice images to the server through the camera in real-time or at regular intervals, and then infer whether the rice is diseased through the server calling the model, and if it is, it can send an early warning to the user through the Web and other means.
Unfortunately, in the real world, insects close to the color of the disease can cause recognition errors, or the poor quality of the acquired images due to weather, lighting, etc. can also cause some targets to be unrecognized, and we will use other means to solve these problems later.
The main contributions of this article are:
- (1)
- We improved the feature pyramid network structure and proposed the DHLC-FPN structure to improve the performance of network multi-scale feature extraction by fusing low-level and high-level image features through high-density hierarchical fusion.
- (2)
- Based on the DETR algorithm model, the DHLC-DETR algorithm model is proposed, which introduces the Neck part in the DETR algorithm structure, and the Neck uses the DHLC-FPN structure combined with the Res2Net. The DETR algorithm’s small target identification capability was significantly improved by the model’s incorporation of multi-layer feature information, and the DHLC-DETR model’s average accuracy increased by 11.4% in comparison to the DETR model.
- (3)
- In this paper, we use appropriate data enhancement methods and use a pre-trained network model on ImageNet for migration learning to achieve good performance even with a small sample size of disease images. The IDADP test set was detected using the DHLC-DETR algorithm, and the average accuracy was 76.4%. On additional disease datasets, good accuracy was also attained.
Author Contributions
Conceptualization, H.Y. and X.D.; methodology, X.D.; software, H.Y. and S.Z.; validation, X.D., H.S. and N.L.; formal analysis, X.D.; investigation, Q.L.; resources, H.Y.; data curation, X.D. and H.S.; writing—original draft preparation, H.Y.; writing—review and editing, X.D.; visualization, S.Z.; supervision, H.Y.; project administration, H.Y.; funding acquisition, H.Y. All authors have read and agreed to the published version of the manuscript.
Funding
This research was funded by the School enterprise cooperation project (No.whpu-2021-kj-762 and 1145, No.whpu-2022-kj-1586 and 2153), Hubei Provincial Teaching and Research Project (No.2018368) and Ministry of Education Industry-University Cooperation Collaborative Education Project(No. 220900786024216).
Institutional Review Board Statement
Not applicable.
Data Availability Statement
The data are available online at: http://www.icgroupcas.cn/website_bchtk/index.html (accessed on 1 July 2023).
Conflicts of Interest
The authors declare no conflict of interest.
References
- Shi, J.; Yang, X. Sustainable development levels and influence factors in rural china based on rural revitalization strategy. Sustainability 2022, 14, 8908. [Google Scholar] [CrossRef]
- Sethy, P.K.; Barpanda, N.K.; Rath, A.K.; Behera, S.K. Deep feature based rice leaf disease identification using support vector machine. Comput. Electron. Agric. 2020, 175, 105527. [Google Scholar] [CrossRef]
- Lv, M.; Zhou, G.; He, M.; Chen, A.; Zhang, W.; Hu, Y. Maize leaf disease identification based on feature enhancement and dms-robust alexnet. IEEE Access 2020, 8, 57952–57966. [Google Scholar] [CrossRef]
- Khamparia, A.; Singh, A.; Luhach, A.K.; Pandey, B.; Pandey, D.K. Classification and identification of primitive kharif crops using supervised deep convolutional networks. Sustain. Comput. Inform. Syst. 2020, 28, 100340. [Google Scholar] [CrossRef]
- Ge, Z.; Liu, S.; Wang, F.; Li, Z.; Sun, J. Yolox: Exceeding yolo series in 2021. arXiv 2021, arXiv:2107.08430. [Google Scholar]
- Tie, J.; Song, W.; Yin, F.; Zheng, L.; Yang, X. Object detection algorithm based on occlusional labels. J. South-Cent. Minzu Univ. 2020, 39, 302–308. [Google Scholar]
- Carion, N.; Massa, F.; Synnaeve, G.; Usunier, N.; Kirillov, A.; Zagoruyko, S. End-to-end object detection with transformers. In European Conference on Computer Vision; Springer: Berlin/Heidelberg, Germany, 2020; pp. 213–229. [Google Scholar]
- Chen, S.; Lei, Z. Oriented object detection in remote sensing image based on GA-RoI Transformer. J. South-Cent. Minzu Univ. 2022, 41, 312–318. [Google Scholar]
- Han, K.; Wang, Y.; Chen, H.; Chen, X.; Guo, J.; Liu, Z.; Tang, Y.; Xiao, A.; Xu, C.; Xu, Y. A survey on visual transformer. arXiv 2020, arXiv:2012.12556. [Google Scholar]
- Ren, S.; He, K.; Girshick, R.; Sun, J. Faster r-cnn: Towards real-time object detection with region proposal networks. Adv. Neural Inf. Process. Syst. 2015, 28, 1137–1149. [Google Scholar] [CrossRef]
- Zhu, X.; Su, W.; Lu, L.; Li, B.; Wang, X.; Dai, J. Deformable detr: Deformable transformers for end-to-end object detection. arXiv 2020, arXiv:2010.04159. [Google Scholar]
- Dai, Z.; Cai, B.; Lin, Y.; Chen, J. In Up-detr: Unsupervised pre-training for object detection with transformers. In Proceedings of the IEEE/CVF Conference on Computer Vision and Pattern Recognition, Nashville, TN, USA, 20–25 June 2021; pp. 1601–1610. [Google Scholar]
- Liu, S.; Li, F.; Zhang, H.; Yang, X.; Qi, X.; Su, H.; Zhu, J.; Zhang, L. Dab-detr: Dynamic anchor boxes are better queries for detr. arXiv 2022, arXiv:2201.12329. [Google Scholar]
- Lin, J.; Mao, X.; Chen, Y.; Xu, L.; He, Y.; Xue, H. D^2etr: Decoder-only detr with computationally efficient cross-scale attention. arXiv 2022, arXiv:2203.00860. [Google Scholar]
- Gao, Z.; Wang, L.; Han, B.; Guo, S. In Adamixer: A fast-converging query-based object detector. In Proceedings of the IEEE/CVF Conference on Computer Vision and Pattern Recognition, New Orleans, LA, USA, 18–24 June 2022; pp. 5364–5373. [Google Scholar]
- Wang, Y.; Zhang, X.; Yang, T.; Sun, J. In Anchor detr: Query design for transformer-based detector. In Proceedings of the AAAI Conference on Artificial Intelligence, Vancouver, BC, Canada, 20–27 February 2022; pp. 2567–2575. [Google Scholar]
- Abbas, A.; Jain, S.; Gour, M.; Vankudothu, S. Tomato plant disease detection using transfer learning with c-gan synthetic images. Comput. Electron. Agric. 2021, 187, 106279. [Google Scholar] [CrossRef]
- Lin, S.D.; Li, X.B.; Yang, B.Y.; Chen, C.; He, W.C.; Weng, H.; Ye, D. Detecting citrus Huanglongbing from few-shot microscopic images using an improved DETR. Trans. Chin. Soc. Agric. Eng. 2022, 38, 216–223. [Google Scholar]
- Masood, M.H.; Saim, H.; Taj, M.; Awais, M.M. Early disease diagnosis for rice crop. arXiv 2020, arXiv:2004.04775. [Google Scholar]
- Kaur, P.; Harnal, S.; Gautam, V.; Singh, M.P.; Singh, S.P. An approach for characterization of infected area in tomato leaf disease based on deep learning and object detection technique. Eng. Appl. Artif. Intell. 2022, 115, 105210. [Google Scholar] [CrossRef]
- Li, F.; Jiang, Z.; Zhou, S.; Deng, Y.; Bi, Y. Spilled load detection based on lightweight yolov4 trained with easily accessible synthetic dataset. Comput. Electr. Eng. 2022, 100, 107944. [Google Scholar] [CrossRef]
- Zhou, H.; Deng, J.; Cai, D.; Lv, X.; Wu, B.M. Effects of image dataset configuration on the accuracy of rice disease recognition based on convolution neural network. Front. Plant Sci. 2022, 13, 910878. [Google Scholar] [CrossRef]
- Sethy, P.K.; Barpanda, N.K.; Rath, A.K.; Behera, S.K. Rice false smut detection based on faster r-cnn. Indones. J. Electr. Eng. Comput. Sci. 2020, 19, 1590–1595. [Google Scholar] [CrossRef]
- Lin, T.-Y.; Dollár, P.; Girshick, R.; He, K.; Hariharan, B.; Belongie, S. Feature pyramid networks for object detection. In Proceedings of the IEEE Conference on Computer Vision and Pattern Recognition, Honolulu, HI, USA, 21–26 July 2017; pp. 2117–2125. [Google Scholar]
- He, K.; Zhang, X.; Ren, S.; Sun, J. Deep residual learning for image recognition. In Proceedings of the IEEE Conference on Computer Vision and Pattern Recognition, Las Vegas, NV, USA, 27–30 June 2016; pp. 770–778. [Google Scholar]
- Gao, S.H.; Cheng, M.M.; Zhao, K.; Zhang, X.Y.; Yang, M.H.; Torr, P. Res2net: A new multi-scale backbone architecture. IEEE Trans. Pattern Anal. Mach. Intell. 2019, 43, 652–662. [Google Scholar] [CrossRef]
- Zoph, B.; Cubuk, E.D.; Ghiasi, G.; Lin, T.-Y.; Shlens, J.; Le, Q.V. Learning data augmentation strategies for object detection. In European Conference on Computer Vision; Springer: Berlin/Heidelberg, Germany, 2020; pp. 566–583. [Google Scholar]
- Wang, Z.; Li, C.; Lin, P.; Rao, M.; Nie, Y.; Song, W.; Qiu, Q.; Li, Y.; Yan, P.; Strachan, J.P. In situ training of feed-forward and recurrent convolutional memristor networks. Nat. Mach. Intell. 2019, 1, 434–442. [Google Scholar] [CrossRef]
- Hamuda, E.; Mc Ginley, B.; Glavin, M.; Jones, E. Improved image processing-based crop detection using kalman filtering and the hungarian algorithm. Comput. Electron. Agric. 2018, 148, 37–44. [Google Scholar] [CrossRef]
- Kai, C.; Jiaqi, W.; Jiangmiao, P.; Yuhang, C.; Yu, X.; Xiaoxiao, L.; Shuyang, S.; Wansen, F.; Ziwei, L.; Jiarui, X.; et al. MMDetection: OpenMMLab detection toolbox and benchmark. arXiv 2019, arXiv:1906.07155. [Google Scholar]
- Qi, L.; Zhang, T.; Zeng, J. Analysis of the occurrence and control of diseases in five major rice-producing areas in China in recent years. China Plant Prot. 2021, 41, 37–42. [Google Scholar]
- Chen, L.; Yuan, Y. An image dataset for field crop disease identification. China Sci. Data 2019, 4, 85–91. [Google Scholar]
- Jiang, Y.; Gong, X.; Liu, D.; Cheng, Y.; Fang, C.; Shen, X.; Yang, J.; Zhou, P.; Wang, Z. Enlightengan: Deep light enhancement without paired supervision. IEEE Trans. Image Process. 2021, 30, 2340–2349. [Google Scholar] [CrossRef]
- Hu, W.; Wu, X.; Li, B.; Xu, T.; Yao, W. Single sample image generation of industrial defect samples based on self-attention ConSinGAN. J. South-Cent. Minzu Univ. 2022, 41, 356–364. [Google Scholar]
- Kong, J.; Wang, H.; Yang, C.; Jin, X.; Zuo, M.; Zhang, X. A spatial feature-enhanced attention neural network with high-order pooling representation for application in pest and disease recognition. Agriculture 2022, 12, 500. [Google Scholar] [CrossRef]
- Duarte, L.J.; Pinheiro, A.P.; Ferreira, D.O. A real-time method to estimate the operational condition of distribution transformers. Energies 2022, 15, 8716. [Google Scholar] [CrossRef]
- Jiang, F.; Zhu, Q.; Tian, T. An ensemble interval prediction model with change point detection and interval perturbation-based adjustment strategy: A case study of air quality. Expert Syst. Appl. 2023, 222, 119823. [Google Scholar] [CrossRef]
- Zhu, Q.; Jiang, F.; Li, C. Time-varying interval prediction and decision-making for short-term wind power using convolutional gated recurrent unit and multi-objective elephant clan optimization. Energy 2023, 271, 127006. [Google Scholar] [CrossRef]
- Jiang, F.; Zhu, Q.; Yang, J.; Chen, G.; Tian, T. Clustering-based interval prediction of electric load using multi-objective pathfinder algorithm and elman neural network. Appl. Soft Comput. 2022, 129, 109602. [Google Scholar] [CrossRef]
- Krichen, M.; Mihoub, A.; Alzahrani, M.Y.; Adoni, W.Y.H.; Nahhal, T. Are formal methods applicable to machine learning and artificial intelligence? In Proceedings of the 2022 2nd International Conference of Smart Systems and Emerging Technologies (SMARTTECH), Riyadh, Saudi Arabia, 9–11 May 2022; pp. 48–53. [Google Scholar]
- Raman, R.; Gupta, N.; Jeppu, Y. Framework for formal verification of machine learning based complex system-of-systems. Insight 2023, 26, 91–102. [Google Scholar] [CrossRef]
Disclaimer/Publisher’s Note: The statements, opinions and data contained in all publications are solely those of the individual author(s) and contributor(s) and not of MDPI and/or the editor(s). MDPI and/or the editor(s) disclaim responsibility for any injury to people or property resulting from any ideas, methods, instructions or products referred to in the content. |
© 2023 by the authors. Licensee MDPI, Basel, Switzerland. This article is an open access article distributed under the terms and conditions of the Creative Commons Attribution (CC BY) license (https://creativecommons.org/licenses/by/4.0/).