Article

Knowledge Discovery and Diagnosis Using Temporal-Association-Rule-Mining-Based Approach for Threshing Cylinder Blockage

College of Engineering, China Agricultural University, Beijing 100083, China
*
Author to whom correspondence should be addressed.
Agriculture 2023, 13(7), 1299; https://doi.org/10.3390/agriculture13071299
Submission received: 1 June 2023 / Revised: 16 June 2023 / Accepted: 19 June 2023 / Published: 25 June 2023
(This article belongs to the Special Issue Application of Robots and Automation Technology in Agriculture)

Abstract

:
Accurately diagnosing blockages in a threshing cylinder is crucial for ensuring efficiency and quality in combine harvester operations. However, in terms of blockage diagnostic methods, the current state of affairs is characterized by model-based approaches that can be highly time-consuming and difficult to implement, while data-driven approaches lack interpretability. To address this situation, we propose a temporal association rule mining (TARM)-based fault diagnosis method for identifying threshing cylinder blockages and discovering knowledge. This study performs field trials by varying the actual feed rate and obtains datasets for three blockage classes (slight, moderate, and severe). Firstly, a symbolic aggregate approximation (SAX) method is employed to reduce the data dimensionality and to construct the transaction set with a sliding window. Next, a cSpade method is used to mine and extract strong association rules by applying improved support, confidence, and lift indicators. With the established strong association rules, this study can comprehensively elucidate the variation pattern of each characteristic under several blockage failure conditions and can effectively identify blockage faults. The results demonstrate that the proposed method effectively distinguishes between three levels of blockage faults, achieving an overall diagnostic accuracy of 0.94. And the method yields precisions of 0.90, 0.92, and 0.99 and corresponding recalls of 0.90, 0.93, and 0.98 for slight, medium, and severe levels of blockage faults, respectively. Specifically, the knowledge acquired from the extracted strong association rules can effectively explain the operational characteristics of a combine harvester when its threshing cylinders are blocked. Furthermore, the proposed approach in this study can provide a reasonable and reliable reference for future research on threshing cylinder blockages.

1. Introduction

As the most important harvesting equipment implemented in the harvesting process, the combine harvester integrates multiple processes such as reaping, threshing, and screening, greatly improving the efficiency of farmers and increasing the economic benefits of agricultural work. In practice, the working efficiency of a combine harvester is often affected by various natural factors (such as crop moisture content, planting density, and field terrain), which primarily affect the feed rate of the combine harvester. When the actual feed rate exceeds the range of feed rates rated for a combine harvester, a blockage occurs in important rotating areas such as the stalk auger, conveyor, or threshing cylinder [1]. The threshing cylinder, as the most important component [2], is often installed in the center of a combine harvester. In cases of blockage in the threshing cylinder, halting the harvesting process may be necessary to resolve the issue [3], which is not only laborious but also dangerous when disassembling the relevant parts of the threshing cylinder and removing any straw entangled in the spike teeth [4]. During a harvest period, farmers must finish harvesting their crops within a week or even a few days. Diagnosing a blocked threshing cylinder for even a few hours can lead to high costs for farmers. With the increasing popularity of combine harvesters, rapid access to their operating status and diagnosis of threshing cylinder blockages are receiving more and more attention from farmers and manufacturers. As a result, considerable efforts have been made to propose strategies and to implement them in combine harvesters.
In the early stages of the development of blockage fault diagnosis technology for combine harvesters, model-driven diagnosis methods were widely used. This type of method relies on the relevant mechanical structure of a combine harvester to construct a dynamic or kinematics model and facilitates the identification of an abnormal state by observing the state of the model [5,6,7]. In addition to constructing models based on mechanical structures, some studies rely on other types of models to diagnose blockage faults. For example, Chen et al. [8] established a mathematical model of the hydraulic system based on the physical properties of the hydraulic system. Based on an analysis of the relationship between travel speed and the clogging pressure valve, a logic threshold control strategy was proposed to prevent blockage caused by excessive travel speed. Li et al. [9] collected the speeds of the threshing cylinder, conveyor, and grain auger and proposed a diagnosis method for blockage based on instantaneous speed change trends, speed ratio differences, and their rate of change. And Qiu et al. [10] proposed a fault diagnosis algorithm based on the velocity fusion index, component slip rate, and adaptive threshold recognition. Although all these methods have achieved promising results, constructing a model remains a time-consuming and difficult process due to the complex structure of the combine harvester and the coupling of working states among various components.
With the development of measurement and control technology and AI, the data-driven approach has been used in fault diagnosis [11,12]. Relying on a large amount of data collected by sensors, machine learning or deep learning can be utilized in the fault diagnosis process [13]. One typical application of such a method is to import the data in a machine learning or deep learning model to uncover the hidden system and to drive machine thinking. Compared with model-driven methods, data-driven methods can effectively reduce the time required for model construction and derive a solution and can be utilized for diagnosing system faults without an accurate mathematical model of the system [14,15]. Currently, the application of data-driven methods of agricultural machinery fault diagnosis has been proven to be effective [16,17,18,19]. The data-driven approach has also been applied to combine harvester operating condition detection and fault diagnosis. For instance, Yong et al. [20] used an RBF network to successfully determine whether a combine harvester has a fault state and the severity of the fault based on the collected rotational speed information. Zhang et al. [21] optimized and enhanced SVM using IPSO, which allows for the diagnosis of broken auger drive chains, threshing cylinder blockages, clogged steppers, raked conveyor chains, and broken blower pulley belts during the operation of a combine harvester, and the accuracy rate reached 95.58%. Yang et al. [22] applied RCMvMSE to the fault extraction of rolling bearings of threshing cylinder spindles and proposed a rolling bearing fault diagnosis method based on SDAE-RCmvMSE, and the enhanced method has robust anti-interference performance. Sun et al. [23] selected the height of the header, moisture content, and torque of the power shaft of the header as the input and feed rate as the output and established a computational model using a PSO-BP neural network to achieve real-time monitoring of the feed rate. In addition, the utilization of data-driven methods in the remote fault diagnosis of combine harvesters enables managers to make informed decisions and provides technical support for the development and implementation of unmanned farms and smart farms [24,25]. Bai et al. [26] constructed a remote operation and maintenance platform, which mainly includes modules for data monitoring, fault prediction and diagnosis, integrated operation, and maintenance. Within the fault diagnosis module, a neural network is utilized to discern and identify blockages occurring in the threshing cylinder. Chen et al. [27] achieved dynamic monitoring of combine harvester operating performance based on the Markov model and employed it in the constructed online operating performance evaluation system.
From the analysis of these works, some overarching considerations can be derived:
(1) The model-driven approaches study the working mechanism of key components in the harvester and mainly rely on dynamics, kinematics, or mathematics to construct equations for representing their motions. Nevertheless, given the complex structure of the combine harvester and the many interferences from the working environment, such a method has issues related to difficult solutions and is time-consuming.
(2) Data-driven methodologies rely on an assortment of amassed data and enable swift identification of blockage faults through approaches such as machine learning or deep learning. However, these methods cannot express how and why blockages are diagnosed; in other words, they lack interpretation.
In order to overcome the aforementioned problems, this paper proposes a threshing cylinder blockage diagnosis method based on AC (association rule classification). AC is a descriptive data mining method derived from ARM (association rule mining) [28]. This approach was originally implemented to analyze the shopping patterns of customers in malls to uncover the combinations of products that customers often buy together, thus helping malls optimize the arrangement of goods to increase revenue [29]. Currently, AC is widely used in various fields, such as biomedicine [30,31], traffic safety [32,33], and phishing website detection [34,35]. Typically, the classification by AC involves three main phases [36]: (1) adopting the methods in ARM to discover all association rules between attributes and classes; (2) filtering rules using relevant evaluation indicators to obtain strong association rules; and (3) using the obtained strong association rules as classifiers.
The blockage of the threshing cylinder usually occurs due to the excessive feed rate of crop materials beyond the rated capacity of the machine. However, the combine harvester is a time-delay system. It can be observed that as the feed rate increases, the response time of each component exhibits differentiation attributable to their respective mounted positions. Therefore, when the state changes of various components are regarded as different events, the occurrence of these events is non-simultaneous but follows a time sequence. In the traditional ARM approach, the mining of the correlation between events does not consider the temporal properties, and it only uses whether two events occur simultaneously as the criterion for evaluating whether they are correlated while disregarding the order in which the events occur. Consequently, preserving the time dependence of two related events is of great significance for revealing the behavior characteristics of involved components when threshing cylinder blocks. In this paper, we employ a method called temporal association rules mining (TARM), which is an extension of ARM, to investigate the sequential changes in the status of the remaining components. Specifically, we examine how these changes occur when there is an increase in the feed rate and the threshing cylinder experiences blockage. Association rules, as mined using TARM, are in the form of multiple sequences, and temporal features are mapped to the positions of the sequences. There are multiple items in the sequence. Moreover, the items in the front and back locations imply a causal relationship. By analyzing the distribution of items at different positions in the sequence, the study can investigate the order of changes in the status (such as changes in speed or torque) of the relevant components when the feed rate increases, thus, revealing the mechanism of threshing cylinder blockage caused by excessive feed rate. Developing a TARM-based blockage fault diagnostic method contributes to a primary novelty for combining the advantages of both model-driven and data-driven approaches as it achieves both automatic learning and interpretability.
The rest of the paper is structured as follows. Section 2 elaborates on detailed elements of constructing an associative classifier on the basis of AC, mainly including data pre-processing methods, the process of converting data into transaction sets, as well as the specific implementation process of obtaining strong association rules based on TARM. Additionally, the approach employed to obtain the dataset concerning blockage occurrences in the threshing cylinder specifically focuses on non-manual intervention scenarios. Section 3 outlines the implied mechanism information in the mined strong association rules and verifies the validity and accuracy of the classifier constructed based on the strong association rules. Final remarks are presented in the Conclusions section.

2. Materials and Methods

2.1. Related Knowledge of ARM

Association rule mining is an unsupervised data mining method for discovering association relationships between attributes in discrete data, and these association relationships are referred to as association rules [37]. Suppose an item set is d = d 1 , d 2 , d m , where an element d i denotes an item. A transaction set is D = D 1 , D 2 , D 3 , D n , where each transaction D i ( i = 1 , 2 , 3 , , n ) corresponds to a subset in d and is identified by a unique transaction ID (TID). If two or more items frequently appear in one transaction set, these items are considered to be correlated to each other. During the process of mining association rules, the support is used to measure the occurrence frequency of an item set. The support of item set d i d in transaction set D is the percentage of transactions containing d i in D, as shown in Equation (1). When an item set meets a user-set threshold of minimum support, the set is called a frequent item set.
s u p p o r t ( d i ) = D i   |   d i D i , D i D |   D   |
Suppose X and Y are two item sets and X Y is an association rule to express the meaning that these two item sets have a certain association relationship between them. In this rule, X is called antecedent, and Y is called consequent. Using exhaustive enumeration to obtain the desired rule is always a difficult task when a transaction set contains multiple transactions and covers multiple item sets. Therefore, association rules are often mined based on user-specified minimum support and minimum confidence. The definition of support for rules is shown in Equation (2), which measures the frequency of the rule in the transaction set.
s u p p o r t ( X Y ) = D ( X Y ) D N
where D ( X Y ) denotes the number of transactions containing D ( X Y ) , and D N denotes the number of all transactions contained in the transaction set. The confidence is similar to the conditional probability, which is used to evaluate the frequency of Y occurring simultaneously with X among all transactions in which X occurs. Hence, the confidence is to measure the accuracy of the association rule, and its definition is shown in Equation (3):
c o n f i d e n c e ( X Y ) = s u p p o r t ( X Y ) s u p p o r t ( X )
Further, some scholars have proposed the concept of lift, as shown in Equation (4). Lift refers to the frequency at which X and Y appear together while taking into account the frequency at which these two items appear separately. It reflects the positive or negative correlation between the antecedent and the consequent over a rule. When lift > 1, the lift value indicates that the occurrence of X increases the probability of appearing Y; when lift = 1, the appearance of X does not affect the probability of Y, and when lift < 1, the occurrence of X decreases the probability of appearing Y.
l i f t ( X Y ) = c o n f i d e n c e ( X Y ) s u p p o r t ( Y )
In this study, in order to obtain more effective strong association rules, we require that the rules satisfy the threshold requirements of the three indicators of support, confidence, and lift. The rules that satisfy the criteria of the three indicators are recognized as strong association rules and are consequently utilized for the purpose of constructing classifiers.
In order to improve mining efficiency, the support used in the mining process was modified. From the original definition of support in Equation (2), when the transaction set contains a lot of transactions, DN is very large, while the value of support is very small. When the minimum support (min-sup) is set too low, a large number of association rules with a low frequency of occurrence may be generated, but not all of them are relevant to blockage faults. To overcome this issue, we propose a modification to the traditional support definition, as described in Equation (5).
r e s u p p o r t ( X Y ) = D ( X Y ) D ( X ) + D ( Y )
Specifically, the denominator of the support calculation now only considers the number of transactions containing both X and Y rather than the total number of transactions. This refined support strengthens the association between transaction X and the subsequent occurrence of transaction Y but also reduces the impact of other irrelevant transactions. As a result, the produced association rules are more indicative of true causal relationships between transactions and can better help identify blockage faults. Substituting re-support into Equations (3) and (4), the newly defined re-confidence and re-lift can be obtained, as shown in Equations (6) and (7), respectively.
r e c o n f i d e n c e ( X Y ) = D ( X ) D ( X ) + D ( Y )
r e l i f t ( X Y ) = D ( X ) D ( N ) [ D ( X ) + D ( Y ) ] D ( Y )

2.2. Data Pre-Processing

Data pre-processing mainly includes 2 stages, data cleaning and data conversion. Data cleaning aims to enhance data quality, while data conversion transforms time series data into the format necessary for TARM analysis.

2.2.1. Data Cleaning Stages

The functioning of a combine harvester is frequently impeded by environmental factors, including vibrations and dust, which unavoidably introduce interference to the sensor signals. As a consequence, the interference leads to missing values and outliers in the collected data. Data cleaning aims to fill in missing values and detect outliers of raw data. In this study, abnormal values or outliers are defined as data that are outside the established pattern of variation. Hempel filter is used to identify outliers. This filter is basically a sliding window with a configurable width that slides through the time series and replaces the values within the window with more representative values. Furthermore, it is a nonlinear filter capable of handling time series efficiently [38]. For each slide, the filter calculates the median and estimates the window’s standard deviation σ = 1.4826 * MAD using the median absolute deviation (MAD). For any point in the window that is more than 3 σ away from the median, the Hampel filter identifies it to be an outlier and replaces it with the median.
For missing values of the data, the Lagrangian interpolation method was used to fill the data gaps [39]. The specific process is as follows: given the n + 1 nodes x 0 , x 1 , x 2 , , x n of the function y = f ( x ) and their corresponding function value y 0 , y 1 , y 2 , , y n , the value of the function for any point in the interpolation interval can be calculated using the Lagrangian polynomial shown in Equation (8).
L n ( x ) = i = 0 n l i ( x ) y i = i = 0 n ( j = 1 , j i n x x j x i x j ) y i
where l i ( x ) is the interpolation basis function, and n is the order. The missing data point is x, x 0 , x 1 , x 2 , , x n are the known sampling time points, and y 0 , y 1 , y 2 , , y n are the corresponding value to the known time points.
In our study, the 10th-order sliding Lagrangian interpolation method was selected, and 5 data before and after the missing point were taken as the interpolation interval, which is brought into Equation (8) to finally achieve the interpolation of x.

2.2.2. Data Transformation Stages

The data acquired by the sensor is stored in a time series. To enhance the mining efficiency of the algorithm, we need to downscale and transform the data for better matching in the ARM mining process. Symbolic aggregate approximation (SAX) is an effective time series dimensionality reduction method [40]. After SAX processing, a time series of length n is reduced to a sequence of length m (m << n), and the new series is converted into a symbolic string. As shown in Figure 1, the SAX conversion involves three phases.
(1) Conducting a Z-score transformation on all the data is carried out to ensure adherence to the Gaussian distribution.
(2) Reduce the time series to obtain a short numerical sequence.
To achieve data dimensionality reduction, the piecewise aggregate approximation (PAA) method is utilized. The method converts the time series T = t 1 , t 2 , t n , which consists of n data points, into a numerical sequence t = t 1 , t 2 , t m of length m. The value of each element t i in series t is calculated using Equation (9).
t i = m n j = n m ( i + 1 ) + 1 n m i T j
where m / n is called the compression ratio.
(3) Convert the numerical sequence into a symbolic string.
Symbolization is achieved by obtaining a breakpoint sequence Bp that divides a Gaussian distribution into any number of equiprobable intervals. The breakpoint sequence Bp, along with the PAA approximate sequence values, were used to complete the symbolization process. Specifically, a breakpoint list B p = 0.67 , 0 , 0.67 was selected, and all values in the PAA sequence less than the minimum breakpoint were mapped to the symbol “A”. Similarly, all values greater than or equal to the minimum breakpoint but less than the second smallest breakpoint were mapped to the symbol “B”. This mapping ensures that each symbol in the four-symbol alphabet (A, B, C, and D) corresponds to a specific range of numerical values in the PAA sequence.
Figure 1 demonstrates that the symbolic string sequence obtained by SAX effectively captures the underlying patterns and trends while preserving the salient features of the original time series. Consequently, the utilization of the SAX method ensures the dependability of the conversion process from continuous time series data to discrete symbolic sequences.

2.3. TARM Process and Diagnosis of Blockage

2.3.1. The Specific Implementation Process of TARM

The TARM technique is an extension of the ARM technique, which introduces time information into the mining of association rules which can be expressed as X t Y . The TARM technique contains many methods, which can be mainly divided into two categories. The first category considers only the order of occurrence between items without restricting the time interval between them. Methods in this category include GSP, PrefixSpan, SPAM, and others. The second category introduces various constraints in the mining process, such as time constraints and interest constraints, to limit the time interval between two items over the mined rule and the time span of the entire rule [41].
Considering that threshing cylinder blockage often occurs within a few seconds, there is no need to mine for correlations between items that occur over a long-time frame, so the cSpade method was chosen. The cSpade method can not only meet the minimum support requirement in mining process but also mine the relationship between items with a specified time window length. Table 1 shows the pseudo-code of the cSpade method. During the execution of cSpade, only the minimum support(min-sup) degree is set. Therefore, after the initial mining by cSpade, the minimum confidence(min-conf) level as well as the minimum lift(min-lift) were set, and any rules that failed to meet these criteria were subsequently filtered out. Finally, the remaining rules are the strong association rules.

2.3.2. Classifier Construction and Blockage Diagnosis

The main principle of AC is to construct classifiers based on strong association rules to achieve diagnosis of faults. In Section 2.4, the acquisition process of the dataset used in this study is described in detail, and the dataset is collected under 3 levels of blockage status (slight, medium, and severe) of threshing cylinder. The strong association rules mined from these three datasets are then used to construct the classifiers. The workflow of constructing classifier is shown in Figure 2. In general, 70% of the acquired data is utilized as the training dataset, while the remaining 30% is allocated as the test dataset. The training dataset is utilized to mine rules and construct a classifier, while the test dataset is employed to evaluate the classifier’s accuracy. The diagnostic protocol for analyzing data in a test dataset is as follows. First, the test dataset is subjected to pre-processing and transformation into a transaction set format. Subsequently, the test transaction set is compared to the association rules contained within the classifier. If a matching rule is found in the test transaction set that is the same as the one in the classifier, the corresponding blockage level is determined.

2.4. Data Acquisition of Threshing Cylinder Blockage Fault

2.4.1. Data Acquisition System

A data acquisition system has been designed to obtain the changes in characteristic parameters before and during a threshing cylinder blockage fault, as shown in Figure 3. This system comprises hardware equipment and monitoring software.
The 4LZ-6B wheat combine harvester was used as the research object, and 6 locations were selected as monitoring points with reference to the studies in [10,21], including the stalk auger, conveyor, threshing cylinder, reel, blower, tailing auger, and grain auger. The torque of the stalk auger, the conveyor, and the threshing cylinder was monitored by 3 customized torque sensors, and a reflective photoelectric sensor was also built inside the customized sensor, which can monitor the speed at the same time. The customized torque sensor utilizes strain gauge-based measurement to detect torque variations. To ensure the accuracy of the torque sensor, we conducted testing and calibration of the three sensors using dedicated equipment. The relative errors of the torque sensors in the stalk auger, conveyor, and threshing cylinder were determined to be 0.098, 0.54, and 0.35, respectively. These values indicate that the torque sensors meet the required specifications. Hall sensors were used to monitor several speeds, including the reel, blower, tailing auger, and grain auger. The specific model of the Hall sensor employed is NJK-5002C, with a working temperature range of −20 to 70 °C. It operates at a rated voltage of DC 5–30 V, and the output level is high. Therefore, a total of 10 characteristic parameters (comprising 3 torque signals and 7 rotational speed signals) were employed to characterize the blockage fault. In addition, differential GPS (accuracy of 0.05 m) was used to obtain the travel speed of combine harvester.
During the operation of the combine harvester, the data collected by sensors and GPS data were transmitted to the data acquisition device. In the acquisition device, a 7316 data acquisition card (sampling frequency is 50 Hz) produced by ZhongTai company (located in Haidian District, Beijing, China) was used to aggregate and package the signals returned by sensors and GPS, and finally forward them to the host computer. The data acquisition software was developed using LabVIEW, a programming platform known for its capacity to exhibit real-time visualization of monitored torque, speed, dynamic trend of travel speed, and simultaneous real-time data storage.

2.4.2. Blockage Fault Generation Process

In the actual wheat harvesting process, the blockage is hard to predict or capture. In the time-constrained wheat harvest period, manual intervention is often used to gather as much data as possible on the state of threshing cylinder blockage. For example, the drive belt can be loosened so that the threshing cylinder receives less power, which triggers blocking [4,21].
In our experiments, we control the external variables to induce the fault without intervening in the working components. Specifically, this study naturally generates blockages in the threshing cylinder by increasing the actual feed rate entering the combine harvester. Normally, the feed rate is calculated using Equation (10).
Q = v × h × m
where v represents the driving speed, h represents the header width, and m represents the crop quality per unit area.
In the actual harvesting process, the header is not replaced frequently and is therefore regarded as constant. The header width of harvester used in test is h = 2.5 m. Therefore, by varying the values of v and m, fluctuations in the feed rate Q can be achieved. A high Q can result in the blockage of the threshing cylinder.
Before the experiment, the unit crop mass per unit area was obtained using the “five-point method”. The midpoint of the diagonal of the plot was taken as the center sampling point, and 4 points were taken on the diagonal at equal distances from the center point, totaling 5 sampling areas over 1 m2. The wheat at each of the 5 sampling points was manually harvested, maintaining a stubble height of 20 cm (consistent with the stubble height left by the harvester). The wheat samples from each sampling point were weighed 3 times, and the average was taken as the crop mass for that sampling point. The average of the crop masses from the 5 points was taken as the value of the unit crop mass per unit area in the experimental field. After calculation, the unit crop mass per unit area of the selected experimental field was found to be m = 1.45 kg/m2.
(1) Test scheme 1: By changing the travel speed
Substitute h and m into Equation (10), then the feed rate Q = 2.5 × 1.45 × v = 3.625 v . Thus, the theoretical correspondence relationship between feed rate and travel speed was obtained, as shown in Table 2.
In fact, the uneven terrain in wheat fields causes the travel speed to be unstable for a long time. Therefore, a pre-test was conducted, before the official test, to determine the extreme feed rate when threshing cylinder was blocked and to determine the operational speed. The designated feed rate capacity of the selected combine harvester is 6 kg/s. During the pre-test phase, it was observed that when the travel speed reached 11 km/h, corresponding to a feed rate of 11 kg/s, the threshing cylinder experienced a total blockage. According to the observed state of the combine harvester under different feed rates in the pre-test, we have categorized the blockage level into three levels, and each one corresponds to a specific range of feed rate, as indicated in Table 3. At slight blockage level, the threshing cylinder still works properly. At medium level, the threshing cylinder performance decreases but can be restored to normal by slowing down the travel speed. When the combine harvester is at severe level, the threshing cylinder is completely blocked and cannot go back to work.
Figure 4 shows the test procedure of changing travel speed to obtain blockage state. Initially, the combine harvester drives into the preparation area. We check whether the harvester and the data acquisition system can work normally in the preparation area. In the data acquisition area, a combination consisting of constant speed area and acceleration area is designed for occurring as much blockage degree as possible. The combine harvester travels in the data acquisition area, first at a constant speed of 6 km/h in constant speed area ①, and then enters the acceleration area ① to complete the acceleration from 6 km/h to 8 km/h. Drive at 8 km/h in the constant speed area ② and then enter the acceleration area ② to complete the acceleration from 8 km/h to 10 km/h. Then, drive at 10 km/h in the constant speed area ③ and complete the acceleration from 10 km/h to 11 km/h in the acceleration area ③. At this stage, the harvesting work is stopped if a severe blockage occurs. If there is no severe blockage, in order to reduce the load of combine harvester, slow down and drive out of the data acquisition area.
(2) Test scheme 2: By varying the crop quality m per unit area
In practice, the crop density in a field is not completely uniform, and the planting density of wheat varies across different regions. The uneven distribution of crops can result in variations in m leading to fluctuations in feed rate and various occurrences of threshing cylinder blockage. To simulate this situation, a test method was designed in Figure 5. In the data acquisition area, three wheat density intervals were set up, and the length of each interval was 50 m. The combine harvester has a cutting width of 2.5 m, manually harvests 1.25 m × 50 m of wheat, and lays it in the second interval area to form a 1.5-fold density interval. In the same way, 2.5 m × 50 m wheat is manually harvested and laid in the third interval area to form a double-density interval. During the actual wheat laying process, due to the weak support of wheat plants, a portion of the wheat fell onto the ground. Within the designated 1.5-folded and 2.0-folded areas, sampling points were established at intervals of 10 m along the same straight line, with each sampling point covering an area of 1 m2. At each sampling point, the wheat grown under original conditions (with a stubble height of 20 cm) was manually harvested and collected together with the wheat laid on the ground, followed by weighing. The average value of three weighing measurements was taken as the mass for that particular sampling point. Finally, the average mass of the five sampling points was calculated to represent the mass of the variable-density area. After actual measurement, the crop quantity per unit area is m 1.5 2.05 kg for the 1.5-folded density interval and m 2.0 2.47 kg for the 2.0-folded interval.
During the testing process, the combine harvester was operated at a constant speed of 6 km/h within the data acquisition area. Two 30 m long transition areas were established. In the first transition area, the crop density was gradually increased from 1.0 to 1.5 times, resulting in a corresponding increase in feed rate from 6 kg/s to 8.56 kg/s. The data collected in this area were deemed to represent a medium level of blockage. In the second transition area, the feed rate was further increased from 8.56 kg/s to 10.3 kg/s, and the data obtained in this area were considered to be those under severe level of blockage.

3. Results

3.1. The Result of the Blockage Dataset

Tests were conducted at the National Precision Agriculture Demonstration Base in Xiaotangshan, Beijing, in mid-June 2022. The process of testing in the field is shown in Figure 6, which illustrates the severe blockage of the threshing cylinder that occurred during testing when the combine harvester entered an area with a 2-fold crop density. Under such circumstances, the combine harvester is unable to function effectively and must be temporarily suspended for manual removal of the straw and debris that were impeding the operation of the threshing cylinder. And the test can be restarted only after the necessary maintenance measures have been taken.
Using test scheme 1, ten trials were conducted, while four trials were conducted using test scheme 2. In total, 20,083 raw data entries were obtained. Table 4 displays the number of data classified as slight, medium, and severe.

3.2. Data Pre-Processing and Transaction Set Construction

After removing outliers by Hampel and interpolating missing values by Lagrangian interpolation, the final data results are shown in Table 5. Among them, 70% of the data were used as the training set to complete the mining of strong association rules and the construction of the classifier, and 30% of the data were used as the test set to verify the accuracy of the classifier.
Further, for the convenience of representation and efficiency in improving the mining process, the names of each monitoring location were numbered, and the corresponding numbers for each location are shown in Table 6.
The specific construction process of the transaction set is shown in Figure 7, which is divided into two main stages. In the first stage, the original time series was transformed into a discrete string sequence by SAX. In the conversion process, the compression rate was chosen to be 0.04, i.e., the data in the 25 original time series were converted to one character, thus containing two states of the variable in 1 s. In the second stage, multiple sequences were first combined to form a multidimensional string sequence matrix. Then, the transactions in the transaction set were constructed using a sliding window, and each window contains two discrete values of a variable, thus reflecting the state change of the variable.
As an example, Figure 7 shows the process of converting three variables from the original time series to the transaction set form. The three variables are conveyor speed, threshing cylinder speed, and threshing cylinder torque, and their variable numbers in Table 5 are 3, 5, and 6, respectively. After SAX conversion, the “conveyor speed” contains 3 states, which will be recorded as 3B, 3C, and 3D; “threshing cylinder speed” contains 2 states, denoted as 5A and 5B; and “threshing cylinder torque” contains 3 states of 6A, 6B, and 6C, as shown in Figure 7b. Figure 7c shows a three-dimensional discrete sequence matrix composed of multiple discrete character sequences. Then, the three discrete sequences of strings were combined into a three-dimensional matrix. Figure 7d shows the construction process of the transaction set database by implementing a sliding time window of fixed length to split the sequence. In this study, a window with a length of 2 was used; that is, a window contains two characters so that the state of variable changes can be reflected in a window. For instance, as presented in “window 2”, variable 3 rises from B to C, variable 5 remains unchanged, and variable 6 drops from C to B. The content in each sliding window was regarded as a transaction set transaction and finally formed a transaction set.
The training and test transaction sets were obtained after conversion, and their respective number of transactions is presented in Table 7. The training transaction set was used to mine association rules and construct a classifier, and then a test transaction set was used to verify the accuracy of the classifier.

3.3. The Results of TARM

Normally, throughout the process of mining association rules in the training transaction set using the cSpade method, four parameters need to be set as thresholds, i.e., minimum support, maximum time lag (between antecedent and consequent item sets), minimum confidence, and minimum lift. In Section 2, the support, confidence, and promotion have been refined, thus giving re-support, re-confidence, and re-lift. Therefore, the four parameters are min-re-support, maximum time lag, min-re-confidence, and min-re-lift.
In order to ensure capturing an entire cycle of blockage occurrence, the maximum time lag chosen is large enough to include the period of congestion occurrence but should also not be too large. A proper maximum time lag can prevent the mined antecedent itemset and consequent itemset from having loose relationships. And the maximum time lag was set to 20 s in our study.
To determine the best thresholds for the remaining three indicators, we did not assign any thresholds for the three indicators. Instead, we carried out the pre-mining in training transaction sets to determine the distribution of all association rules contained in each blockage level. The pre-mining results are shown in Figure 8, and the position of the center of each bubble represents the re-support value and re-confidence value. The intensity of the bubble’s color positively correlates with the number of rules occupying the same position. Furthermore, the size of the bubble indicates the magnitude of re-lift, where larger bubbles correspond to higher levels of re-lift. Under three blockage levels, 1091, 1068, and 1689 rules were obtained, respectively.
It can be seen from Figure 8 that the distribution of association rules under the three blockage levels is not uniform, and 85% of association rules are in the small interval of re-support. In general, for confidence, the larger the value, the better, and for lift, a strong association between two items is considered when lift > 3 [36]. Ultimately, the values of the minimum threshold for selecting the three indicators are shown in Table 8. After filtering the rules that did not satisfy the threshold, the number of strong association rules (SAR) mined in each of the three blocking states was, respectively, 17, 20, and 19.
Due to the time attribute introduced in the TARM process, the association rules mined using the cSpade are presented in the form of sequences, which are not the same as the item sets mined by traditional ARM, and the length of the sequences of strong association rules mined is not exactly the same. Some of the content of the strong association rules mined by cSpade is shown in Table 9. It can be seen that each strong association rule contains the state changes of multiple monitoring parameters.

3.4. Analysis of Strong Association Rules

In this section, the mechanism information contained in the mined strong association rules is analyzed, and the variation law of each characteristic parameter under different blockage levels is deeply explored.
The form of the strong association rules mined, as indicated in Table 9, is sequences. In sequences, the item in the first position serves only as an antecedent, and the item in the last position serves as a consequent. However, each item in the middle position of the sequence functions as both an antecedent and a consequent. An item occupying an advanced position in the sequence means that the item occurs earlier. Correspondingly, the more forward a characteristic parameter appears in the rule sequence, the more sensitive it is to blockage faults and the less sensitive a characteristic parameter is to blockage faults of the threshing cylinder when it is further back in the rule sequence.
The visual representation of a strong association rule mined under a medium blockage level is shown in Figure 9. The meaning of this rule is that when the feed rate rises, first, the torque and speed of the stalk auger rise and fall, respectively, then the speed of the conveyor falls, and finally, the speed of the threshing cylinder falls, and its torque rises. The physical meaning contained in this rule is as follows: since the rated power P of the combine harvester is constant, the torque is inversely proportional to the speed according to P = ( T * n ) / 9550 . Therefore, the values of the torque characteristics show a rising state, and the values of the speed characteristics show a falling state in the rule. Furthermore, during the harvesting process, wheat undergoes a sequential passage through three components of the combine harvester: the stalk auger, the conveyor, and the threshing cylinder. As a result, the torque of the stalk auger increases earlier than the torque of the threshing cylinder, and the falling state of the speed of these three parts also occurs in the sequence. This observation highlights how the excavated rules can effectively reflect the response sensitivity of each component to an increase in the feed rate. Overall, in this rule, the sensitivity of each characteristic parameter at medium blockage can be considered to have the following order: stalk auger torque > stalk auger speed > conveyor speed > threshing cylinder speed > threshing cylinder torque.
In order to facilitate the comparison of the sensitivity intensity of each characteristic parameter under the three congestion states, the sequence composed of the maximum proportion of each position in the rule is recorded as R i = 1 , 2 , 3 = a 1 , p 1 ) ,   ( a 2 , p 2 ) , , ( a m , p m ) , and the a m refers to the feature parameter with the largest proportion of p m at position m within the sequence. R 1 , R 2 , R 3 represent the sequence under slight, medium, and severe levels of blockage, respectively. The longest rule mined in both the slight blockage level and the medium blockage level contained 8 items, while the longest rule in the severe blockage level contained 6 items. After statistical analysis, the results for R 1 , R 2 , R 3 are shown in Figure 10, with the torque characteristics highlighted in red and the speed characteristics highlighted in green, and in the “Location in sequence” row, a gradually fading yellow color is used to indicate decreasing sensitivity.
According to Figure 10a, it can be observed that the characteristic parameters for the first four positions are all related to torque, while those for the last four positions are related to speed. This indicates that under a slight blockage level, torque-related characteristic parameters exhibit higher sensitivity than speed-related ones. Under medium blockage level, as depicted in Figure 10b, the characteristic parameters for the first three positions correspond to stalk auger torque, conveyor torque, and threshing cylinder torque, respectively, while those for positions 4 to 8 are all related to speed. Additionally, in the case of severe blockage level, as shown in Figure 10c, the characteristic parameter for position 1 remains stalk auger torque, while stalk auge speed and threshing cylinder torque correspond to positions 2 and 3, respectively. The characteristic parameters for positions 4 to 6 are all speed-related.
Overall, torque-related characteristic parameters occupy relatively earlier positions in the sequence under all three blockage levels, and the sensitivity of stalk auger torque and conveyor torque is higher than that of threshing cylinder torque. This is due to the fact that the crop enters the combine and passes through the stalk auger and conveyor in turn to reach the threshing cylinder, which also explains the time lag in the response of the threshing cylinder’s state as the feed rate increases. In addition, the speed-related characteristic is less sensitive than the torque characteristic in the case of slight blockage but becomes more sensitive as the blockage grade increases. In the case of severe blockage, the sensitivity of the speed of the stalk auger is even higher than the threshing cylinder torque, reflecting the fact that the relationship between feed rate and speed and torque of the important rotating parts is not purely linear [42]. It can be observed that analyzing the association rules is an effective way to reveal the complex operational mechanisms of combine harvesters.

3.5. Blockage Fault Detection and Diagnosis

The process of diagnosis in the samples in the test transaction set is shown in detail in Figure 11. The 17, 20, and 19 strong association rules mined in the three levels of slight blockage level, moderate blockage level, and severe blockage level, respectively, were constructed as three classifiers named “slight classifier”, “medium classifier”, and “severe classifier”. Samples from the test transaction set obtained after pre-processing were imported into the classifier and compared with the rules in the three classifiers in turn to determine their blockage levels.
During the diagnostic process, the test samples were initially compared to the severe classifier since severe blockages of the threshing cylinder pose the greatest risk of causing damage to the combine harvester. After the excluded samples were not at a severe blockage level, they were then compared with the medium classifier and the slight classifier successively. If a sample did not have the same rules as any of the classifiers, it was considered to be in normal working condition.
The confusion matrix presented in Table 10 depicts the diagnostic outcomes for the three blockage levels when the test transaction set is fed into the developed classifier model.
The performance of the classifier was evaluated using precision, recall, and accuracy metrics. Precision represents the proportion of true positive samples among those identified as positive by the model. The recall refers to the classifier’s ability to correctly identify positive samples, that is, how many positive samples the model recognizes among the actual positive samples. Accuracy is the most commonly used metric to assess model performance, calculated as the number of correctly identified samples divided by the total number of samples. The results for each metric are presented in Table 11.
Based on the presented data, it is evident that the constructed classifier exhibits precision and recall of over 90% across all three levels of threshing cylinder blockage faults. Notably, the precision rate for the severe blocked level reaches 99%, effectively mitigating the detrimental impact of severe blockage on the performance of the combine harvester. The accuracy of the classifiers is reported to be 94%. These results indicate that the proposed classifier, which was based on the association rule mining approach, is an effective tool for discriminating between different types of threshing cylinder blockage faults and can facilitate the diagnosis of such faults with a high degree of accuracy.

4. Discussion

In this study, the TARM technique was employed to extract strong association rules from the threshing cylinder at various stages. These rules were analyzed to effectively demonstrate the variations in the status of key components during the process from normal operation to complete blockage of the threshing cylinder. Moreover, a classifier was developed based on the extracted strong association rules to differentiate between different levels of blockage in the threshing cylinder. When verifying the performance of a classifier using a test dataset, it was discovered that 2 out of the 84 samples in the test set with severe blockage levels were misidentified as having medium blockage levels. Upon closer examination of the raw data for these two samples, it was determined that they contained more consecutive missing data, and the data trend became relatively flat after pre-processing, which resulted in the loss of important spike feature information. As a result, these samples failed to match the rules established in the severe blockage classifier. This also reflects that the stability of the acquisition system during the combine harvester operation in the field can have a significant impact on the final data quality.
Due to limitations in the experimental conditions, the proposed method was validated only on one combine harvester with a designated feed rate of 6 kg/s. In future work, on the one hand, this method needs to be applied to larger combine harvesters with higher designated feed rates to test its reliability and accuracy. On the other hand, it is necessary to apply this method to cloud platforms or remote monitoring systems to provide possibilities for enhancing the ability of intelligent farms in remote fault diagnosis. Furthermore, the unevenness of the ground can lead to variations in stubble height, which in turn may contribute to fluctuations in the feed rate and potentially affect the blockage of the threshing cylinder. To explore this aspect, we plan to conduct more comprehensive experiments in the future, aiming to investigate the relationship in greater detail.

5. Conclusions

In this paper, a TRAM-based fault diagnosis method for threshing cylinder blockage of a combine harvester was proposed, which combines the advantages of autonomous learning and interpretability. cSpade was used to mine the association rules and filtered by setting the minimum thresholds of the three indicators of support, confidence, and lift to obtain strong association rules. Based on the obtained strong association rules, the relationship between each characteristic parameter and blockage fault was analyzed. The main conclusions can be listed as follows.
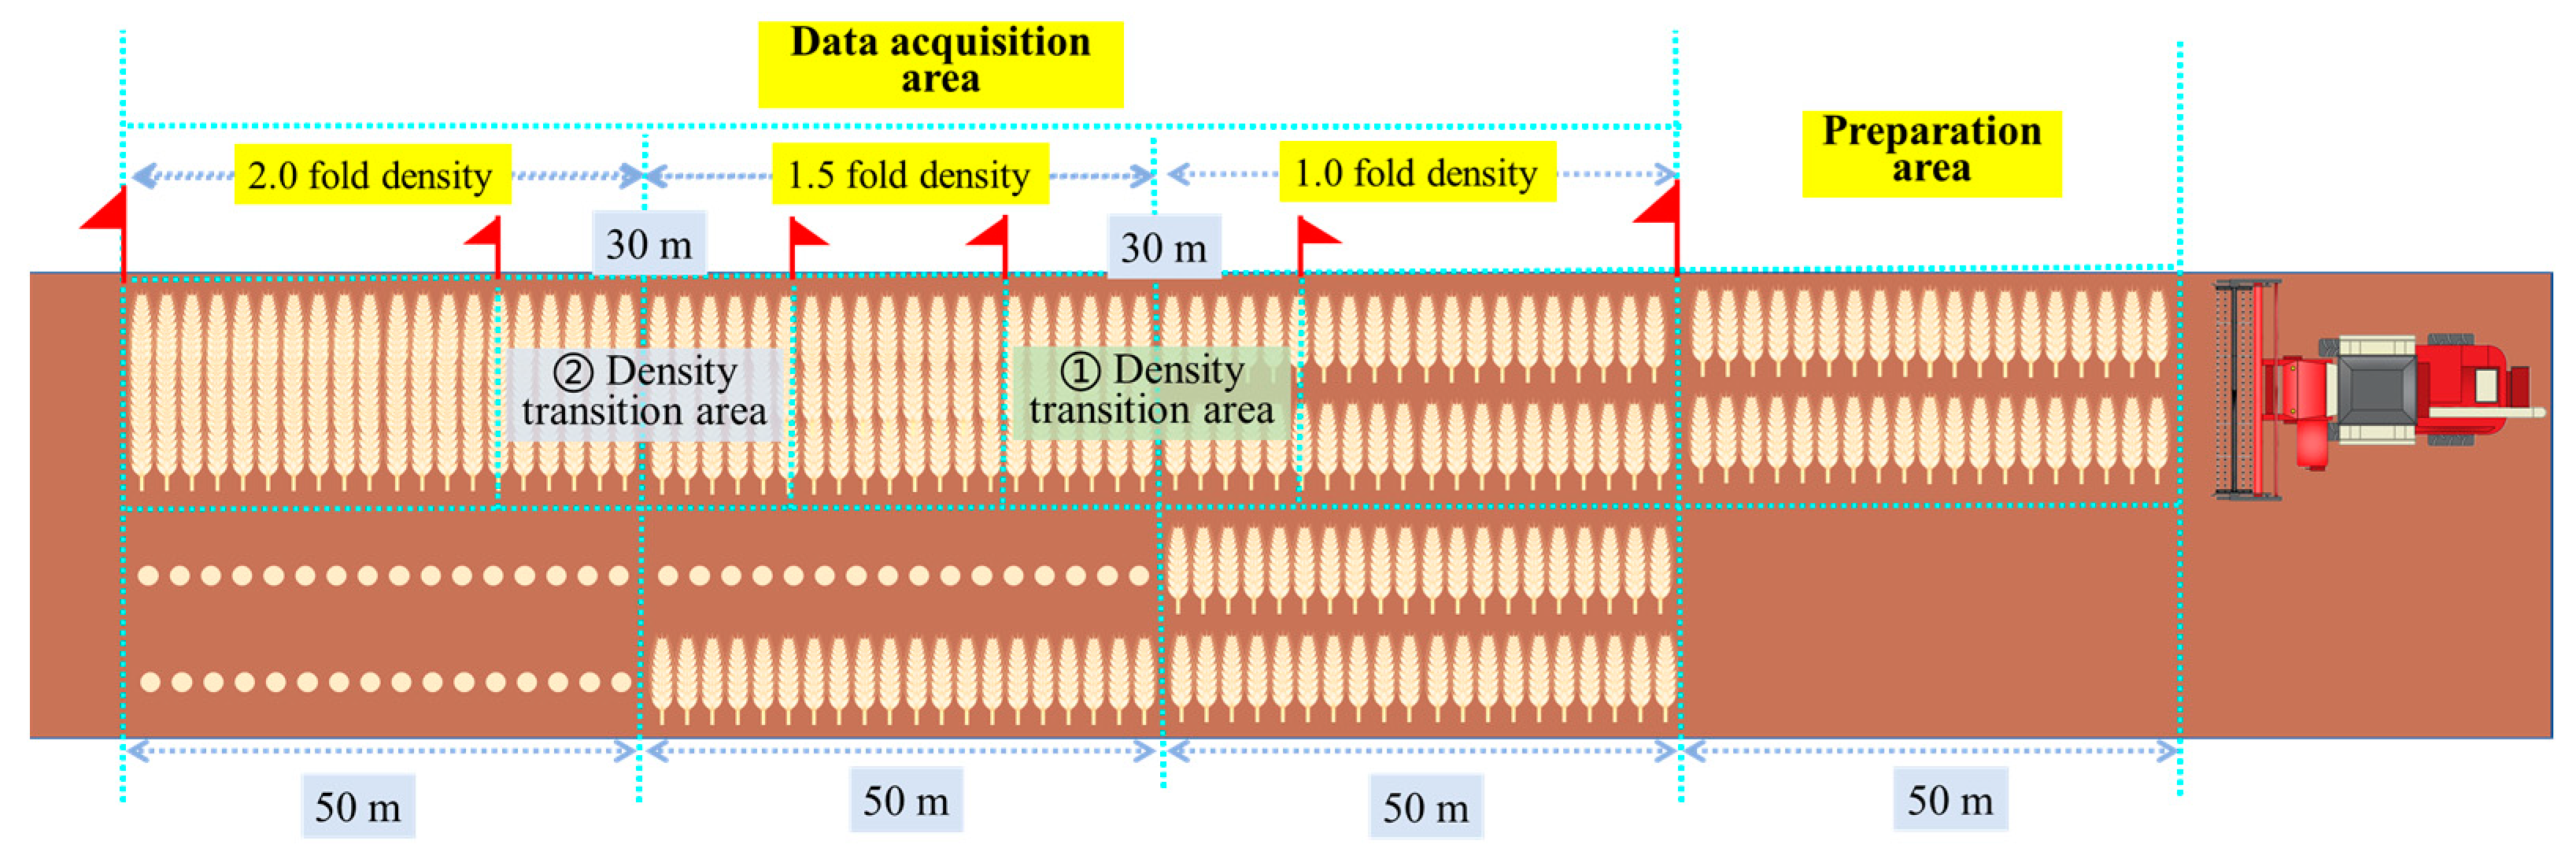
(1) A total of 10 parameters (such as stalk auger torque, conveyor torque, threshing cylinder torque, stalk auger speed, conveyor speed, threshing cylinder speed, reel speed, blower speed, grain auger speed, and tailing auger speed) were selected as characteristic parameters for threshing cylinder blockage faults. Then, the study obtained datasets of three levels (slight, medium, and severe) of threshing cylinder blockage. To effectively induce the blockage, we adjusted the travel speed of the harvester and manually increased crop density in the experiments. In order to efficiently mine association rules from data, the SAX method was used to transform the original time series data into a character string sequence, which was then constructed into transaction sets using a sliding window approach. After processing, the transaction set obtained contained a total of 1045 transactions. The results demonstrated that the application of the SAX method and sliding window approach effectively achieved dimensionality reduction, thereby improving the efficiency of mining association rules.
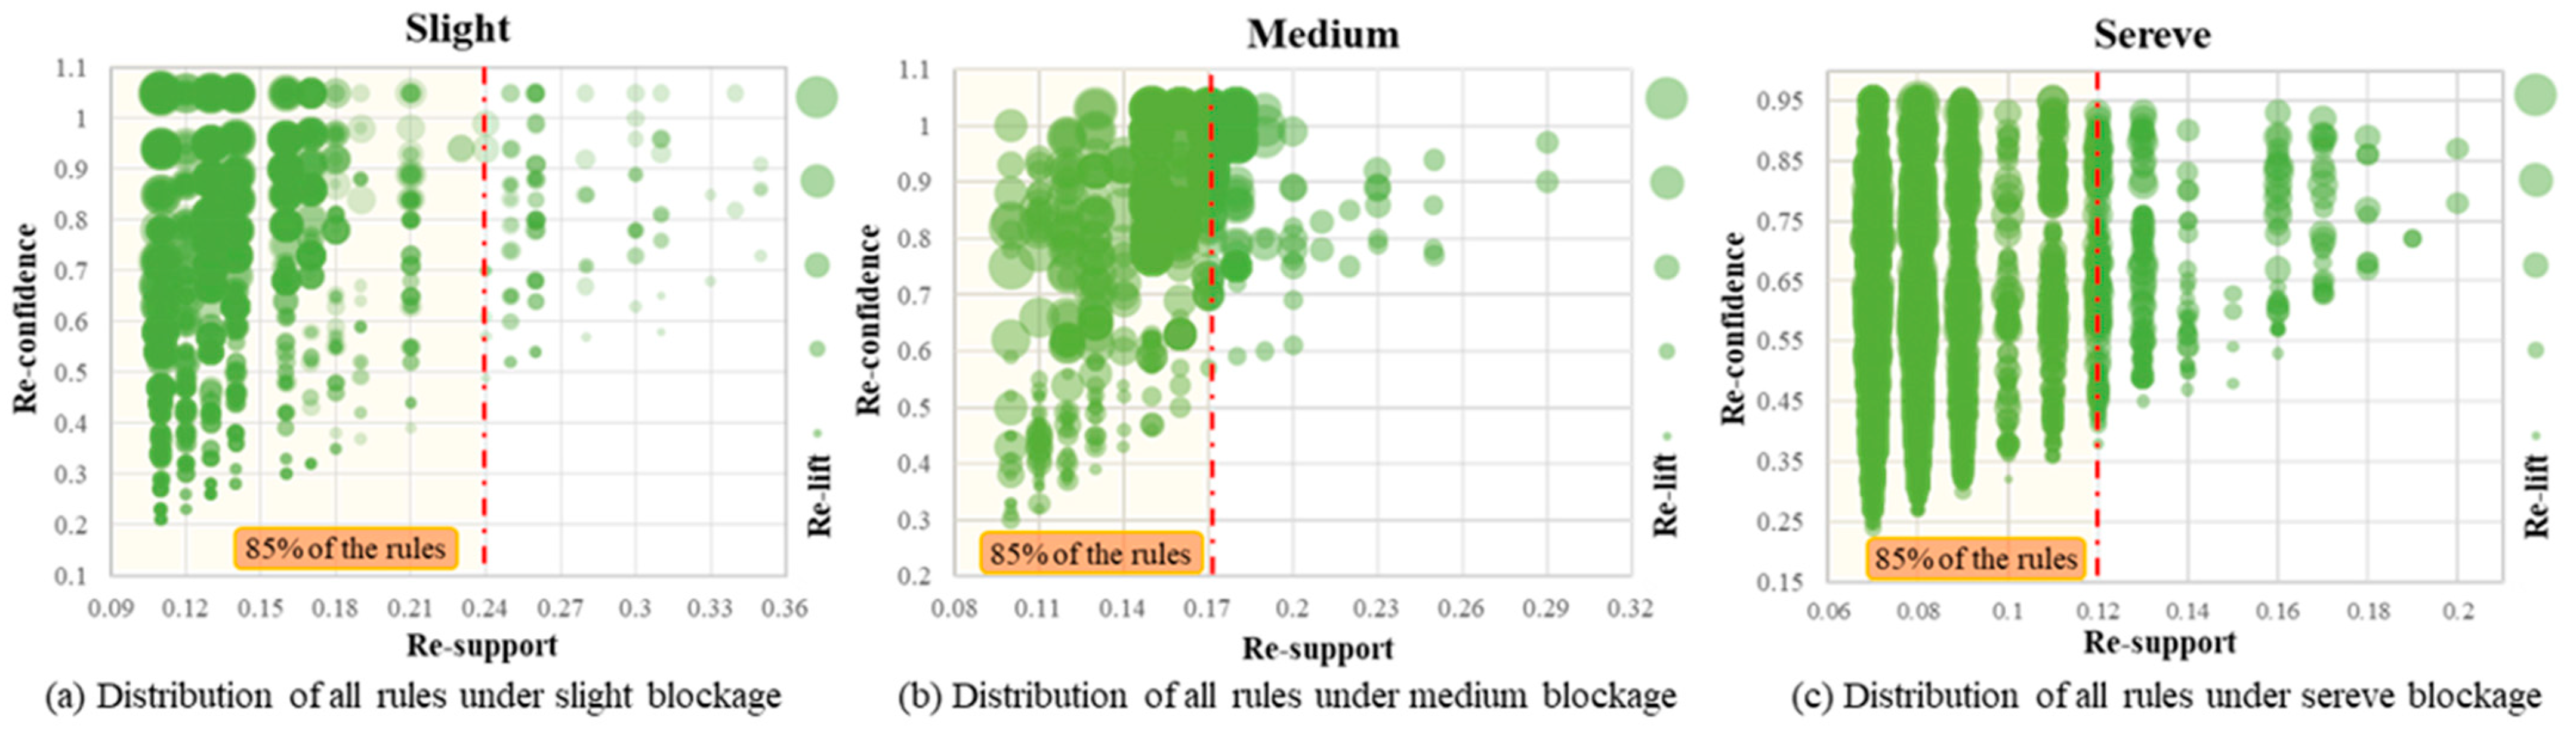
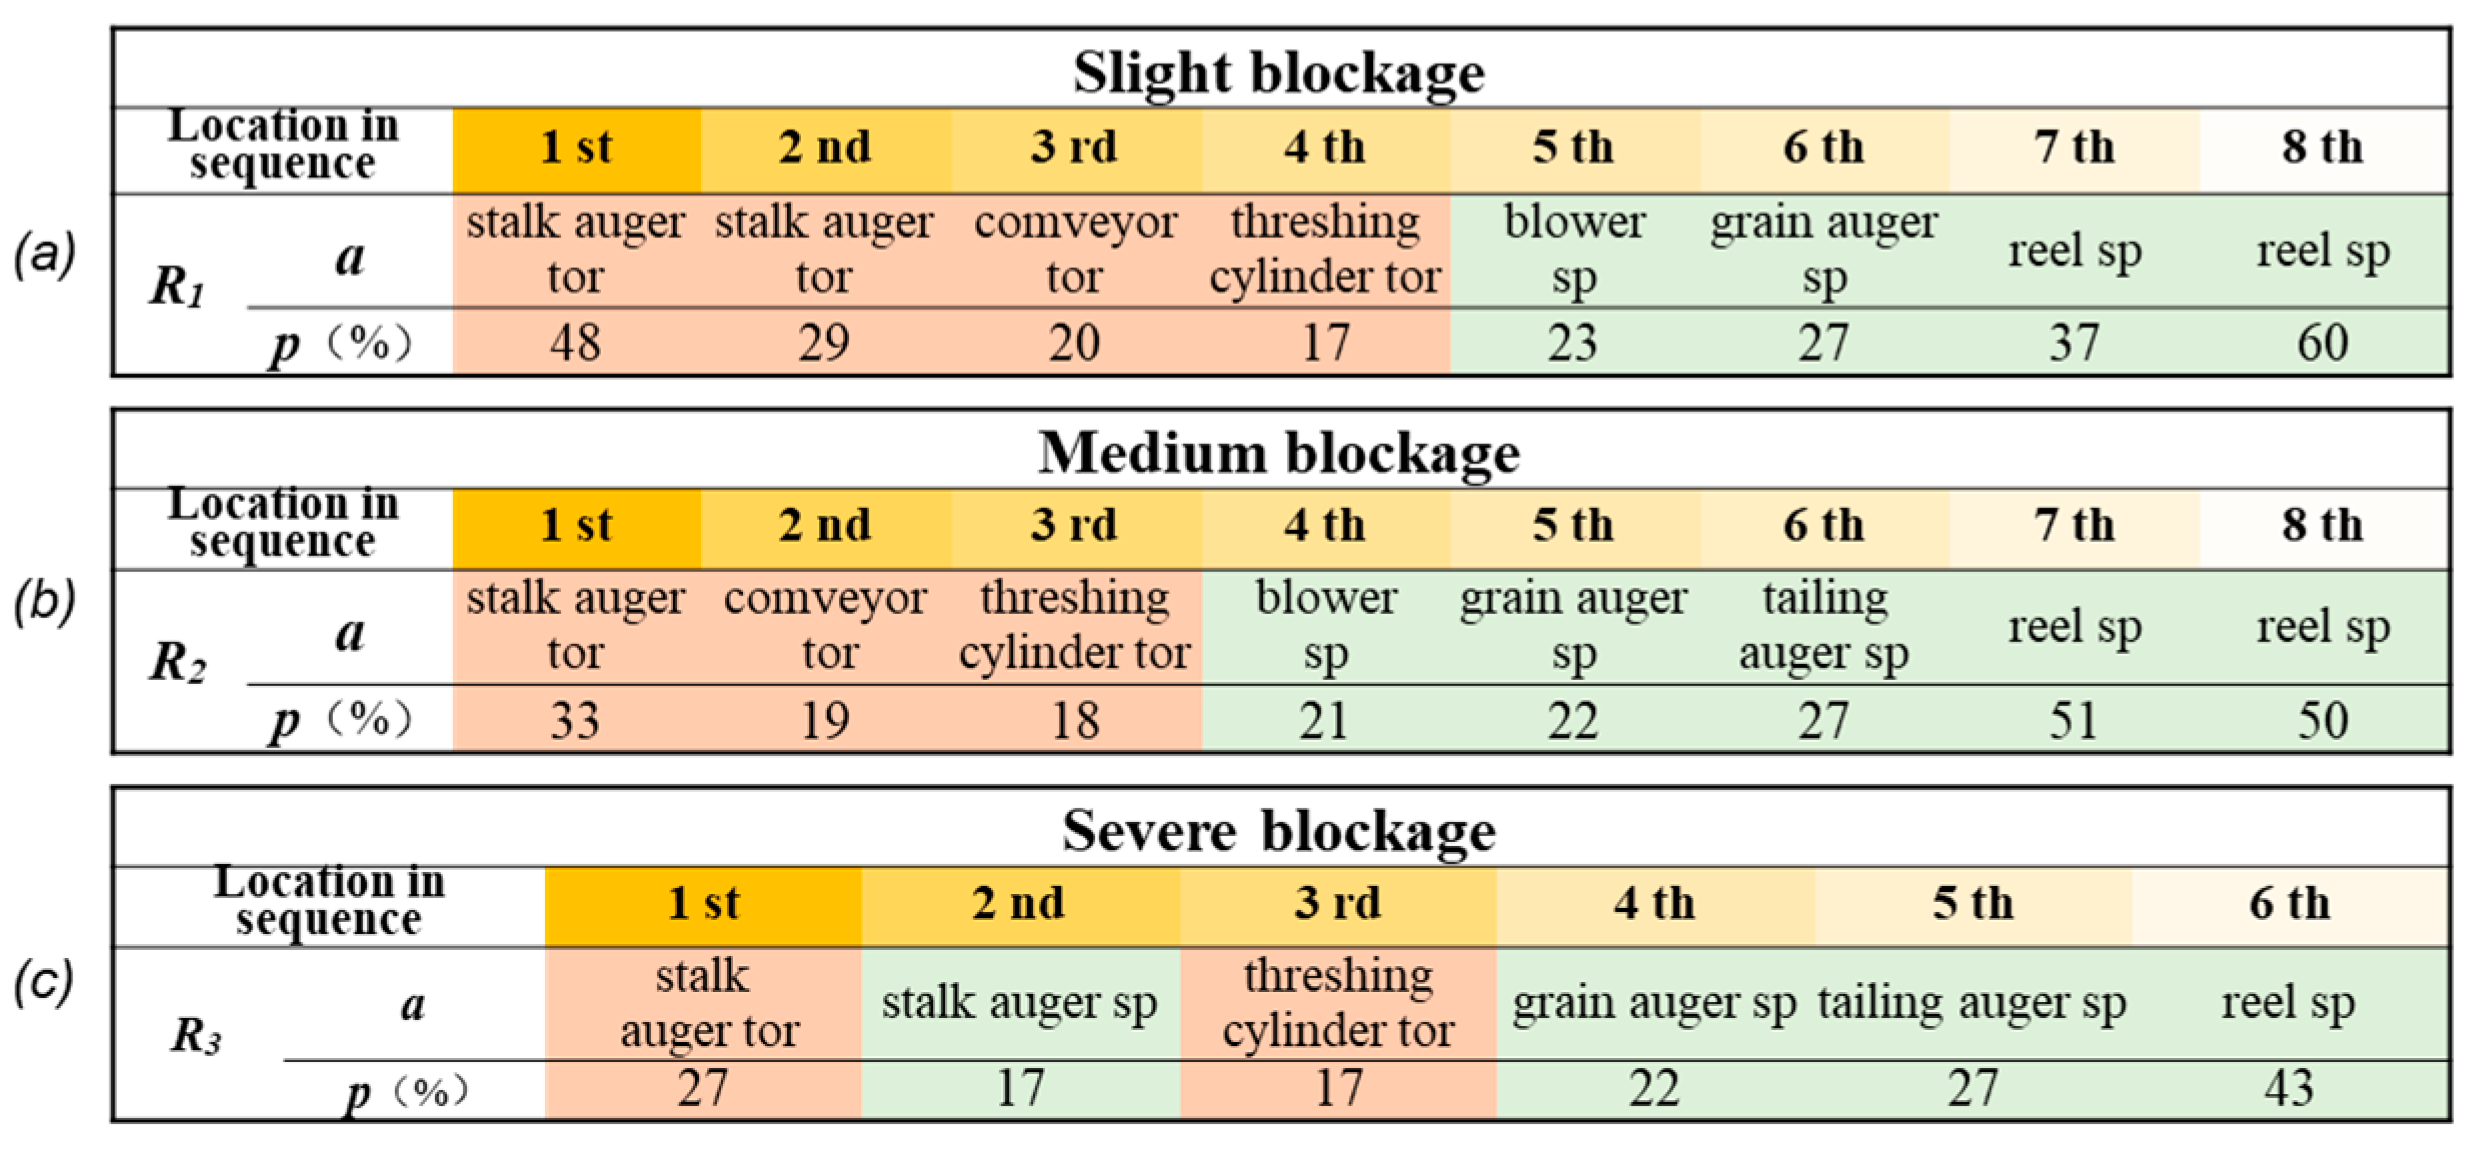
(2) The study employed cSpade to mine association rules in the transaction set. Initially, the method mined 3848 rules (under three blockage levels, 1091, 1068, and 1689 rules were obtained, respectively), and then it used the re-defined evaluation indicators re-support, re-confidence, and re-lift to filter the initially mined rules, which finally obtained 56 strong association rules. The results showed that the improved indicators minimized the impact of useless association rules. Additionally, by analyzing the positional information of the identified strong association rules, the study observed the varying levels of importance and sensitivity of the selected torque and speed feature parameters at different levels of blockage. This interpretation effectively reflected the changes in the working status of the crucial rotating components on the combine harvester when the threshing cylinder was obstructed.
(3) A threshing cylinder blockage classifier was developed based on the strong association rules mined. The model achieved an overall accuracy of 0.94 in testing. For slight, medium, and severe levels of blockage faults, the precisions were 0.90, 0.92, and 0.99, respectively, with a corresponding recall of 0.90, 0.93, and 0.98, respectively. Overall, the results obtained were robust and highly interpretable, demonstrating the effectiveness of the proposed method.

Author Contributions

Conceptualization, Y.L.; methodology, Y.L.; software, Y.L. and C.T.; validation, Y.L. and C.T.; formal analysis, Y.L.; investigation, D.D.; writing—original draft preparation, Y.L.; writing—review and editing, Y.L. and X.M.; supervision, X.W.; project administration, X.W., S.W., D.C. and Y.Z. All authors have read and agreed to the published version of the manuscript.

Funding

This research was funded by Research on Combine Harvester Operation Information Collection, Fault Early Warning and Remote Diagnosis Technology (No.2017YFD0700603) and Smart Sensing and Control Technology for Large-Scale Intelligent and Efficient Combine Harvester.

Institutional Review Board Statement

Not applicable.

Data Availability Statement

The data presented in this study are available upon request from the authors.

Acknowledgments

The authors are grateful for the provision of the experimental wheat field by the National Precision Agriculture Research Demonstration Center.

Conflicts of Interest

The authors declare no conflict of interest.

References

  1. Cecchini, M.; Piccioni, F.; Ferri, S.; Coltrinari, G.; Bianchini, L.; Colantoni, A. Preliminary Investigation on Systems for the Preventive Diagnosis of Faults on Agricultural Operating Machines. Sensors 2021, 21, 1547. [Google Scholar] [CrossRef] [PubMed]
  2. Fu, J.; Chen, Z.; Han, L.; Ren, L. Review of grain threshing theory and technology. Int. J. Agric. Biol. Eng. 2018, 11, 12–20. [Google Scholar] [CrossRef]
  3. Craessaerts, G.; De Baerdemaeker, J.; Saeys, W. Fault diagnostic systems for agricultural machinery. Biosyst. Eng. 2010, 106, 26–36. [Google Scholar] [CrossRef]
  4. Xi, C.; Yang, G.; Liu, L.; Liu, J.; Chen, X.; Ma, Z. Operation Fault Monitoring of Combine Harvester Based on SDAE-BP. J. Agric. Eng. 2020, 36, 46–53. [Google Scholar] [CrossRef]
  5. Wang, W.; Liu, W.; Yuan, L.; Qu, Z.; He, X.; Lu, Y. Modeling of wheat plants and simulation and experiment of single longitudinal axial flow material movement. Trans. Chin. Soc. Agric. Mach. 2020, 51, 170–180. [Google Scholar]
  6. Liu, Y.; Li, Y.; Dong, Y.; Huang, M.; Zhang, T.; Cheng, J. Development of a variable-diameter threshing drum for rice combine harvester using MBD-DEM coupling simulation. Comput. Electron. Agric. 2022, 196, 106859. [Google Scholar] [CrossRef]
  7. Tang, Z.; Li, Y.; Xu, L.; Kumi, F. Modeling and design of a combined transverse and axial flow threshing unit for rice harvesters. Span. J. Agric. Res. Sjar 2014, 12, 973–983. [Google Scholar] [CrossRef] [Green Version]
  8. Chen, M.; Zhai, X.; Zhang, H.; Yang, R.; Wang, D.; Shang, S. Study on control strategy of the vine clamping conveying system in the peanut combine harvester. Comput. Electron. Agric. 2020, 178, 105744. [Google Scholar] [CrossRef]
  9. Li, Y.; Wang, K.; Chen, X. Study on Fault Diagnosis and Load Feedback Control System of Combine Harvester. SPIE 2017, 10322, 103223I. [Google Scholar]
  10. Qiu, Z.; Shi, G.; Zhao, B.; Jin, X.; Zhou, L. Combine harvester remote monitoring system based on multi-source information fusion. Comput. Electron. Agric. 2022, 194, 106771. [Google Scholar] [CrossRef]
  11. Avci, O.; Abdeljaber, O.; Kiranyaz, S.; Hussein, M.; Gabbouj, M.; Inman, D.J. A review of vibration-based damage detection in civil structures: From traditional methods to Machine Learning and Deep Learning applications. Mech. Syst. Signal Proc. 2021, 147, 107077. [Google Scholar] [CrossRef]
  12. Lei, Y.; Yang, B.; Jiang, X.; Jia, F.; Li, N.; Nandi, A.K. Applications of machine learning to machine fault diagnosis: A review and roadmap. Mech. Syst. Signal Proc. 2020, 138, 106587. [Google Scholar] [CrossRef]
  13. Zhao, R.; Yan, R.; Chen, Z.; Mao, K.; Wang, P.; Gao, R.X. Deep learning and its applications to machine health monitoring. Mech. Syst. Signal Proc. 2019, 115, 213–237. [Google Scholar] [CrossRef]
  14. Wang, J.L.; Xu, C.Q.; Zhang, J.; Zhong, R. Big data analytics for intelligent manufacturing systems: A review. J. Manuf. Syst. 2022, 62, 738–752. [Google Scholar] [CrossRef]
  15. Tidriri, K.; Chatti, N.; Verron, S.; Tiplica, T. Bridging data-driven and model-based approaches for process fault diagnosis and health monitoring: A review of researches and future challenges. Annu. Rev. Control 2016, 42, 63–81. [Google Scholar] [CrossRef]
  16. Xiao, M.; Wang, W.; Wang, K.; Zhang, W.; Zhang, H. Fault Diagnosis of High-Power Tractor Engine Based on Competitive Multiswarm Cooperative Particle Swarm Optimizer Algorithm. Shock Vib. 2020, 2020, 1–13. [Google Scholar] [CrossRef]
  17. Ghazaly, N.M.; Moaaz, A.O.; Makrahy, M.M.; Hashim, M.A.; Nasef, M.H. Prediction of misfire location for SI engine by unsupervised vibration algorithm. Appl. Acoust. 2022, 192, 108726. [Google Scholar] [CrossRef]
  18. Zhou, X.; Xu, X.; Zhang, J.; Wang, L.; Wang, D.; Zhang, P. Fault diagnosis of silage harvester based on a modified random forest. Inf. Process. Agric. 2022. [Google Scholar] [CrossRef]
  19. Ni, H.; Lu, L.; Sun, M.; Bai, X.; Yin, Y. Research on Fault Diagnosis of PST Electro-Hydraulic Control System of Heavy Tractor Based on Support Vector Machine. Processes 2022, 10, 791. [Google Scholar] [CrossRef]
  20. Tao, Y.; Zheng, J.; Wang, T.; Hu, Y. A state and fault prediction method based on RBF neural networks. In Proceedings of the 2016 IEEE Workshop on Advanced Robotics and Its Social Impacts (ARSO), Shanghai, China, 8–10 July 2016; pp. 221–225. [Google Scholar] [CrossRef]
  21. Zhang, W.; Zhao, B.; Zhou, L.; Wang, J.; Niu, K.; Wang, F.; Wang, R. Research on Comprehensive Operation and Maintenance Based on the Fault Diagnosis System of Combine Harvester. Agriculture 2022, 12, 893. [Google Scholar] [CrossRef]
  22. Yang, G.; Cheng, Y.; Xi, C.; Liu, L.; Gan, X. Combine Harvester Bearing Fault-Diagnosis Method Based on SDAE-RCmvMSE. Entropy 2022, 24, 1139. [Google Scholar] [CrossRef]
  23. Sun, Y.; Liu, R.; Zhang, M.; Li, M.; Zhang, Z.; Li, H. Design of feed rate monitoring system and estimation method for yield distribution information on combine harvester. Comput. Electron. Agric. 2022, 201, 107322. [Google Scholar] [CrossRef]
  24. Wang, T.; Xu, X.; Wang, C.; Li, Z.; Li, D. From Smart Farming towards Unmanned Farms: A New Mode of Agricultural Production. Agriculture 2021, 11, 145. [Google Scholar] [CrossRef]
  25. Wolfert, S.; Ge, L.; Verdouw, C.; Bogaardt, M. Big Data in Smart Farming—A review. Agric. Syst. 2017, 153, 69–80. [Google Scholar] [CrossRef]
  26. Bai, S.; Yuan, Y.; Niu, K.; Zhou, L.; Zhao, B.; Wei, L.; Liu, L.; Liu, Y.; Pang, Z.; Wang, F.; et al. Design and Implementation of the Remote Operation and Maintenance Platform for the Combine Harvester. Appl. Sci. 2022, 12, 7637. [Google Scholar] [CrossRef]
  27. Chen, M.; Jin, C.; Ni, Y.; Yang, T.; Zhang, G. Online field performance evaluation system of a grain combine harvester. Comput. Electron. Agric. 2022, 198, 107047. [Google Scholar] [CrossRef]
  28. Chaure, T.M.; Singh, K.R. Frequent Itemset Mining techniques—A technical review. In Proceedings of the 2016 World Conference on Futuristic Trends in Research and Innovation for Social Welfare (Startup Conclave), Coimbatore, India, 29 February–1 March 2016; pp. 1–4. [Google Scholar]
  29. Zhang, S.; Wu, X. Fundamentals of association rules in data mining and knowledge discovery. Wiley Interdiscip. Rev. Data Min. Knowl. Discov. 2011, 1, 97–116. [Google Scholar] [CrossRef]
  30. Soni, J.; Ansari, U.; Sharma, D.; Soni, S. Intelligent and Effective Heart Disease Prediction System using Weighted Associative Classifiers. Int. J. Comput. Sci. Eng. 2011, 3, 2385–2392. [Google Scholar]
  31. Abd Ghani, M.K.; Noma, N.G.; Mohammed, M.A.; Abdulkareem, K.H.; Garcia-Zapirain, B.; Maashi, M.S.; Mostafa, S.A. Innovative Artificial Intelligence Approach for Hearing-Loss Symptoms Identification Model Using Machine Learning Techniques. Sustainability 2021, 13, 5406. [Google Scholar] [CrossRef]
  32. Yang, Y.; Yuan, Z.Z.; Meng, R. Exploring Traffic Crash Occurrence Mechanism toward Cross-Area Freeways via an Improved Data Mining Approach. J. Transp. Eng. Pt A-Syst. 2022, 148, 04022052. [Google Scholar] [CrossRef]
  33. Gu, C.W.; Xu, J.L.; Gao, C.; Mu, M.H.; Guangxun, E.; Ma, Y.J. Multivariate analysis of roadway multi-fatality crashes using association rules mining and rules graph structures: A case study in China. PLoS ONE 2022, 17, e0276817. [Google Scholar] [CrossRef] [PubMed]
  34. Moustafa, N.; Misra, G.; Slay, J. Generalized Outlier Gaussian Mixture Technique Based on Automated Association Features for Simulating and Detecting Web Application Attacks. IEEE Trans. Sustain. Comput. 2021, 6, 245–256. [Google Scholar] [CrossRef]
  35. Hadi, W.; Aburub, F.; Alhawari, S. A new fast associative classification algorithm for detecting phishing websites. Appl. Soft Comput. 2016, 48, 729–734. [Google Scholar] [CrossRef]
  36. Huang, R.; Liu, J.; Chen, H.; Li, Z.; Liu, J.; Li, G.; Guo, Y.; Wang, J. An effective fault diagnosis method for centrifugal chillers using associative classification. Appl. Therm. Eng. 2018, 136, 633–642. [Google Scholar] [CrossRef]
  37. Luna, J.M.; Fournier Viger, P.; Ventura, S. Frequent itemset mining: A 25 years review. WIREs Data Min. Knowl. Discov. 2019, 9, e1329. [Google Scholar] [CrossRef]
  38. Yin, S.; Liu, H. Wind power prediction based on outlier correction, ensemble reinforcement learning, and residual correction. Energy 2022, 250, 123857. [Google Scholar] [CrossRef]
  39. Yan, J.Z.; Liu, J.X.; Yu, Y.C.; Xu, H.X. Water Quality Prediction in the Luan River Based on 1-DRCNN and BiGRU Hybrid Neural Network Model. Water 2021, 13, 1273. [Google Scholar] [CrossRef]
  40. Ma, Y.Z.; Meng, X.F.; Wang, S.Y. Parallel similarity joins on massive high-dimensional data using MapReduce. Concurr. Comput.-Pract. Exp. 2016, 28, 166–183. [Google Scholar] [CrossRef]
  41. Segura Delgado, A.; Gacto, M.J.; Alcalá, R.; Alcalá Fdez, J. Temporal association rule mining: An overview considering the time variable as an integral or implied component. Wiley Interdiscip. Rev. Data Min. Knowl. Discov. 2020, 10, e1367. [Google Scholar] [CrossRef]
  42. Shi, J.; Jiang, M.; Zhao, Y.; Liao, N.; Wang, Z. Research on the Fault-Diagnosing Method in the Operation ofthe Threshing Cylinder of the Combine Harvester. In Proceedings of the 2021 IEEE 16th Conference on Industrial Electronics and Applications (ICIEA), Chengdu, China, 1–4 August 2021. [Google Scholar] [CrossRef]
Figure 1. Implementation process of SAX.
Agriculture 13 01299 g001
Figure 2. The process of the classifier to identify blockage faults.
Agriculture 13 01299 g002
Figure 3. Structure of fault diagnosis and monitoring system of combine harvester.
Agriculture 13 01299 g003
Figure 4. Changing travel speed to trigger blockage of threshing cylinder.
Agriculture 13 01299 g004
Figure 5. Changing crop quality to trigger blockage of threshing cylinder.
Agriculture 13 01299 g005
Figure 6. Exhibition of the execution process at the test site and the status of blockage faults.
Agriculture 13 01299 g006
Figure 7. Procedure for the construction of the database of transactions. (a) represents the original time series data collected; (b,c) describe the process of time series discretization and the resulting character series dataset; in (d), the process of constructing the transaction set using sliding windows and the final obtained transaction set results are shown.
Agriculture 13 01299 g007
Figure 8. Pre-mining process of association rules.
Agriculture 13 01299 g008
Figure 9. Visualization of a strong association rule.
Agriculture 13 01299 g009
Figure 10. Sensitivity comparison of each characteristic parameter under different blockage levels. (a) describes the distribution of feature parameters with the highest proportion at each sequence position in the association rule sequence during slight blockage faults. Similarly, (b) investigates the distribution of feature parameters during medium blockage faults, while (c) focuses on the distribution of feature parameters during severe blockage faults.
Agriculture 13 01299 g010
Figure 11. Diagnosis process of blockage fault.
Agriculture 13 01299 g011
Table 1. Pseudocode of cSpade.
cSPADE
1. P = { parent classes Pi};
2. for each parent class Pi ∈ P do Enumerate-Frequent(Pi);
Enumerate-Frequent(S):
1. for all sequences Ai ∈ S do
2.    if (maxgap) //join with F2
3.       p = Prefix-Item(Ai);
4.       N = { all 2-sequences Aj in class [p]}
5.    else // self-join
6.       N = { all sequences AjS, with j ≥ i}
7.    for all sequences α ∈ N do
8.         if (length(R) <= maxl and width(R) <= maxw and accuracy(R) ≠ 100%)
9.           L(R)=Constrained-Temporal-Join(L(Ai), L(α), min gap, max gap, window);
10.           if (σ(R, ci) ≥ min sup(ci)) then
11.               T = T ∪ {R}; print R;
12.       Enumerate-Frequent(T);
13.    delete S;
Table 2. Correspondence between feed rate and travel speed.
Travel SpeedFeed Rate
(kg/s)
Exceeding Range of Designated Feed Rate (%)
(km/h)(m/s)
61.676.051
71.947.0317
82.228.0434
92.59.1052
102.7810.0868
113.0611.0785
Table 3. Classification of threshing cylinder blockage grade.
Blockage LevelExceeding Range of Designated Feed Rate
slight<34%
medium34~68%
severe68~85%
Table 4. The distribution of each blockage level in the raw data.
Blockage LevelData Amount
Slight5022
Medium8050
Severe7011
Sum20,083
Table 5. The data distribution of each blockage level after pre-processing.
Data AmountTrain Data for ARCTest Data
Slight507235501522
Medium807256502400
Severe705649392117
Sum20,20017,1396039
Table 6. Identification number of the monitoring locations.
Names of Monitoring PointsNo.
Reel speed0
Stalk auger speed1
Stalk auger torque2
Conveyor speed3
Conveyor torque4
Threshing cylinder speed5
Threshing cylinder torque6
Blower speed7
Grain auger speed8
Tailing auger speed9
Table 7. Distribution of train transaction set and test transaction set.
Train Transaction SetTest Transaction Set
Slight20160
Medium32296
Severe28284
Sum805240
Table 8. Strong association rule mining results.
Minimum ThresholdThe Number of SAR
Min-Re-SupportMin-Re-ConfidenceMin-Re-Lift
Slight0.240.953.717
Medium0.173.220
Severe0.123.419
Table 9. Content display of the mined SARs.
No.Locations within the Sequence
1st2nd3rd4th3th6th7th8th
11A1A2B2A3A3B4C4C5A5A6C6C7D7C8C8D
21D1D2C2B3C3D4A4A5B5C6A6A7B7A8C8B
31D1C2A2A3D3C4A4B5C5D6A6A7B7A8B8B
Table 10. Confusion matrix of classifier diagnostic results.
Predicted Class
SlightMediumSevere
Actual classSlight5460
Medium6891
Severe0282
Table 11. The precision and accuracy values of the classifier.
PrecisionRecallAccuracy
Pslight0.90Rslight0.900.94
Pmedium0.92Rmedium0.93
Psevere0.99Rsevere0.98
Disclaimer/Publisher’s Note: The statements, opinions and data contained in all publications are solely those of the individual author(s) and contributor(s) and not of MDPI and/or the editor(s). MDPI and/or the editor(s) disclaim responsibility for any injury to people or property resulting from any ideas, methods, instructions or products referred to in the content.

