1. Introduction
China is the world’s leading apple grower and occupies a significant position in the global apple market [
1]. However, apple production is vulnerable to climate, pests, and diseases, which can cause negative impacts on both the quantity and quality of the fruit, as well as substantial financial losses [
2]. In the early stages of apple disease, most affected areas appear on the leaves, and visual observation is the primary method used to identify these diseases. However, identifying the specific type of disease is challenging, and misdiagnosis is common. Therefore, it is crucial to swiftly and accurately recognize the various types and complexities of apple diseases.
In agriculture, computer vision has been widely utilized [
3,
4,
5,
6,
7,
8], particularly in the field of plant disease detection [
9]. This technology is a critical factor in productive agriculture and economic growth. With advancements in machine learning, image processing techniques can now be used to solve problems using morphological features such as color, intensity, and size. Zhang Chuanlei et al. [
10] initially employed image processing to convert the color space of images, conduct background removal, and employ the region-growing algorithm to segregate lesions. The evolutionary algorithm and correlation feature selection method were then utilized to screen essential features, to improve the model’s accuracy. Finally, the support vector machine (SVM) was used for automatic identification, and the method accurately identified apple mosaic, rust, and other diseases with an accuracy rate of over 90%. Nuruzzaman et al. [
11] compared the results of machine learning algorithms such as the random forest classifier, support vector machine, and logistic regression on 1200 potato images. Ultimately, the logistic regression algorithm produced the best result. Similarly, Chakraborty et al. [
12] employed the Otsu threshold technique and histogram equalization to segregate diseased apple leaf sections, and then utilized a multiclass SVM to detect these sections, with an accuracy rate of 96%.
The application of machine learning technologies in practical agricultural settings has been challenging due to various constraints, such as the requirement for high-precision image acquisition equipment, homogeneous illumination, and simple image backgrounds. Recently, convolutional neural networks (CNNs) have emerged as a promising technique for directly learning important features from data, with good performance on large datasets and high adaptability. Consequently, CNNs have increasingly been applied to plant disease recognition and identification with impressive results [
13,
14,
15,
16,
17,
18].
To overcome the issue of overfitting, Jiang Peng et al. [
19] constructed datasets for five common leaf diseases, including apple brown spots, by enhancing and annotating the data. They utilized the VGG [
20] network as the basic framework and introduced the Inception module to extract multi-scale lesions, along with the feature pyramid’s context and fusion features to enhance recognition performance. The model obtained a recognition accuracy of 78.8% mAP. Similarly, Liu Aoyu et al. [
21] addressed the inadequacies of manual diagnosis of corn diseases by constructing and training the ResNet50 network on the PlantVillage dataset. They added data augmentation operations to the collected corn dataset and incorporated the focal loss function to handle difficult-to-classify samples, resulting in an average accuracy of 98.60%. Thapa Ranjita et al. [
22] introduced the Plant Pathology 2021 Challenge dataset, which comprised images captured from various distances, angles, and lighting conditions, to represent real-world scenarios of disease symptoms on cultivated apple leaves. The dataset featured a complex background and an uneven distribution of categories. The authors performed a multiclass classification task using ResNet34, and the experimental results revealed that the performance was poor for the combination of diseases such as apple scab and frog eye leaf spot, while the combination of snow apple rust and gray spot, as well as the combination of snow apple rust and other diseases, exhibited high accuracy. The corresponding rate scores were all above 0.75. Yan Qian et al. [
23] replaced the fully connected layer with the batch norm layer and the global average pooling layer, and pre-trained the VGG16 network to recognize three apple leaf diseases: scab, frost spot, and cedar rust. The model’s overall accuracy was 99.01%. Sardogan et al. [
24] employed Inceptionv2 to differentiate between healthy and diseased apple leaves in images with complex backgrounds. They first used the Faster R-CNN method to locate and mark various items and regions on the image and then achieved a typical accuracy rate of 84.5%. Finally, Li Xiaopeng et al. [
25] combined convolution and transformer to extract both global and local disease features. They utilized the self-attention mechanism and visual transformer to direct the convolutional network to focus on effective features and applied separable convolution and global average pooling operations to reduce model complexity. Their approach achieved equivalent identification accuracy to the Swin Tiny [
26] model, while being lighter in weight.
In real-world scenarios, the datasets collected for plant disease classification are often imbalanced due to a low incidence rate of a specific disease or the presence of multiple diseases simultaneously. However, using the conventional approach of classifying plant diseases as mainstream, through a convolutional neural network and cross-entropy loss function, does not yield satisfactory results on such datasets. In this research, we aim to enhance the detection ability of convolutional neural networks on an unbalanced plant disease dataset with complex backgrounds. Our primary contributions are:
Extraction of multi-scale lesion features based on the RFB module and adjusting the convolution kernel size to improve recognition accuracy.
Construction of the RFCA ResNet network, which utilizes ResNet18 as the backbone network, using focal loss in combination with the class balance approach to enhance the detection performance on the imbalanced dataset.
Building a dual attention mechanism that incorporates both the coordinate attention mechanism and the frequency attention mechanism to improve lesion feature extraction capabilities.
Comparison and evaluation of our proposed approach with the conventional cross-entropy loss function-based classification method, which has theoretical importance and practical relevance in real-world applications.
The remainder of this research paper is structured as follows.
Section 2 provides a detailed description of the network structure and loss function. In
Section 3, we introduce the dataset source, preprocessing method, experimental apparatus, experimental design, and evaluation indexes. The experimental results are presented and analyzed in
Section 4. In
Section 5, we discuss and evaluate our work. Finally, we conclude the research in
Section 6 and provide directions for future work.
2. Methods
2.1. RFCA ResNet Design
The apple leaf disease dataset used in this research has a complex visual background, which was collected under different lighting conditions and at different times. Due to the dispersed and varying sizes of the disease spots and the uneven number of photos in each category, model identification is challenging. Therefore, the aim of this research is to design a model, with relatively low computational complexity, that can accurately classify datasets with an uneven number of categories. To achieve this, we designed a convolutional neural network model based on a dual attention mechanism, utilizing the ResNet topology model. To limit computation and network complexity, we chose an 18-layer ResNet as the fundamental network. As using a single-sized convolution kernel may result in the loss of extracted feature information, we replaced the first convolutional layer in the ResNet with the RFB module, which can improve the recognition of lesions of various sizes on leaves by adjusting the receptive field’s size using parallel expansion convolution kernels of various sizes. The attention mechanism helps the model focus on relevant information while ignoring irrelevant information. Therefore, to enhance the ability to retrieve lesion features, we included the intended attention module in each residual structure. The precise structure of the RFCA ResNet model is shown in
Figure 1. The model mainly comprises the FCCA attention mechanism module and the enhanced ResNet18, designed to accurately classify complex datasets with an uneven number of categories while having relatively low computational complexity.
In the task of identifying plant diseases, some categories of images may have a very low probability of occurrence, or there may be multiple diseases coexisting on the leaves, resulting in certain categories having a significantly higher number of images than others. This can lead to overfitting of the network during training, where the model becomes biased towards the categories with a higher number of images. To address this issue, we employ focal loss in combination with the class balance approach in our model, to update the network parameters and mitigate the effects of the imbalanced dataset. The following are the specific steps in the implementation:
First, the probability of predicting each category is calculated:
where
denotes the predicted output of the
i category, and
o represents the sigmoid function.
Next, the loss function is computed using focal loss in combination with the class balance approach. This is achieved by adjusting the standard focal loss function to include a weight factor for each category based on its proportion in the training dataset. The class balance loss function can be expressed as:
where
N is the number of samples in the batch,
is the weight factor for the
i-th category, calculated using the class balance approach,
is the predicted probability of the
i-th category, and
is the focusing parameter. The class balance weight factor for each category is computed as the inverse of its frequency in the training dataset, raised to a power
. Thus, categories with low frequency will have a higher weight factor to balance their influence on the training process.
Incorporating class balance with focal loss helps to mitigate the negative effects of imbalanced categories during training and improves the model’s ability to accurately classify plant disease images.
2.2. Topology Fusion
As the number of layers in deep convolutional neural networks increases, the problem of gradient vanishing becomes more pronounced, leading to a decrease in network performance. The ResNet series of networks address this issue by utilizing residual structures that enable the stacking of layers without a loss in performance. The ResNet architecture is widely used in classification tasks due to its effectiveness.
The residual structure adds the input to the output of a layer through a shortcut connection, resulting in a straightforward addition operation that speeds up training without increasing model complexity or the number of required parameters. The precise calculation procedure for the residual is shown in Equation (
3):
where
represents the input of the
i-th layer,
represents the parameters of the
i-th layer,
represents the output of the
i-th layer convolution operation, and
represents the residual mapping of the input.
By stacking residual structures, ResNet increases the effectiveness of network training without degradation. To improve the network’s ability to extract feature information and enhance the receptive field, the RFB module borrows the structure of the Inception module and adds dilated convolution to the original foundation. The RFB module can extract feature information of different scales by using convolution kernels of different sizes in parallel, making it suitable for the characteristics of lesion features in this experimental dataset. The RFB module’s structure is illustrated in
Figure 2.
We present the mathematical reasoning for the receptive field block (RFB) module as follows: Let the input feature map be denoted by x, with dimensions , where H, W, and C represent the height, width, and number of channels, respectively. The output feature map is denoted by Y, with dimensions , where N is the output dimension. The RFB module consists of three parallel branches.
For the first branch, a
convolution operation, with kernel size
, is performed. The output feature map of this branch, denoted as
, can be expressed as:
where
denotes a
convolution operation.
The second branch includes two consecutive operations: a
convolution with kernel size
, followed by a
dilated convolution with kernel size
and dilation rate of 2, to capture multi-scale contextual information. The output feature map of this branch, denoted as
, can be expressed as:
where
denotes the convolution operation.
In the third branch, three consecutive operations are performed: two successive
convolutions with kernel size
, followed by a
dilated convolution with kernel size
and dilation rate of 3, to capture multi-scale context information. The output feature map of this branch, denoted as
, can be expressed as:
where
denotes the convolution operation.
After computing the feature maps for all three branches, a
convolution is applied to adjust the number of channels. The feature maps are then concatenated along the channel dimension to obtain the final output feature map
Y:
where
represents the concatenation operation along the channel dimension.
To leverage the benefits of each module, we replace the ResNet’s convolutional layer with the RFB convolution module to extract low-level feature information. This replacement allows our fused network to accomplish multi-scale extraction of image feature information more effectively than ResNet. As a result, our model’s generalization performance and feature discriminability are significantly improved.
2.3. FCCA Attention Module
Images of apple leaf diseases captured in natural settings often feature non-uniformly arranged leaves and complex backgrounds. Accurately identifying these diseases requires incorporating coordinated information on apple disease features present in the image. Existing channel attention approaches do not leverage global pooling to express adequate information. To address this, we propose integrating coordinate attention with frequency attention to creating a dual attention mechanism, as shown in
Figure 3.
The FCCA attention module utilizes input feature maps to simultaneously compute frequency and coordinate attention, employing two softmax multiplications and one additional operation. The mathematical operation of this module can be expressed as shown in Equation (
4):
where
denotes the feature map obtained through the dual attention module,
denotes the frequency feature map, and
represents the coordinate position feature map.
The FCCA attention module expands the amount of feature information introduced through channels and captures feature information across channels, effectively enhancing the attention of feature channel and position information. This results in increased accuracy in identifying apple leaf diseases.
2.3.1. Coordinate Attention Module
In recent times, several researchers have utilized the SE module proposed by Hu, Jie et al. [
27] in their research. This module initially employs global pooling to compress the global spatial information before learning the significance of each channel in the channel dimension. However, it overlooks the importance of position pairs in creating a spatial map. CBAM [
28] attempts to incorporate location information using global pooling, but it only considers local range information and cannot establish long-distance relationships. On the other hand, the coordinate attention module provided by Hou Q et al. [
29] is a lightweight and effective method, that enhances the expressiveness of learned features by integrating spatial coordinate information into attention maps and capturing the long-distance dependencies of input feature maps.
As illustrated in
Figure 4, the process of generating coordinate attention involves two crucial steps: embedding coordinate information and generating attention.
To generate coordinated attention, one-dimensional average pooling is utilized to encode position information in the horizontal and vertical spatial directions and to generate long-distance dependencies, as global pooling can result in the loss of position information. Specifically, size average pooling kernels of sizes (
H, 1) and (1,
W) are employed to encode the channels in the two directions, respectively. Thus, the output feature map for the
c-th channel and height
h is given by:
where
represents the output of the c-th channel in the overall height directions,
represents the input of the
c-th channel, and
W represents the width of the
c-th channel input.
The output feature map for the
c-th channel and width
w is given by:
where
represents the output of the c-th channel in the overall width directions,
represents the input of the
c-th channel, and
H represents the height of the
c-th channel input.
To create an attention map, the horizontal and vertical feature maps are transformed using a shared 1×1 convolution kernel. The resulting attention map is then split along the spatial axis and the number of channels is adjusted to match the number of input channels using two 1×1 convolutions. The sigmoid function is applied to normalize the weight, and the coordinated attention module (CA) is expressed as:
where
denotes the concatenation operation along the spatial dimension,
is a non-linear activation function,
and
,
o is the sigmoid function, and
represents the output of the
c-th channel at position
in the input image.
2.3.2. Frequency Attention Module
In order to enhance the feature representation ability, the channel attention module is utilized to focus on channels that contain important information by assigning weights to each channel. Typically, the channel relationship is extracted using global average pooling, and the weighted attention map is obtained by applying a fully connected layer and a sigmoid function, which can be expressed as:
where
o is the sigmoid function,
denotes a fully connected layer, and
is global average pooling.
Qin Z et al. [
30] demonstrated that global average pooling is a special case of discrete cosine transform (DCT), which can result in limited diversity in the features obtained and insufficient representation of information between different channels. To address this issue, they proposed a multi-spectral channel attention (MSCA) module, which first divides the input feature map into multiple groups and applies a two-dimensional DCT (2DDCT) operation to each group. The resulting frequency feature set is then weighted and fused using a fully connected layer and a sigmoid function, as follows:
where
,
o is the sigmoid function,
denotes a fully connected layer,
represents the frequency feature set of input features after 2DDCT operation, and
n is a constant indicating that the input features are divided into several parts.
3. Experiments
3.1. Dataset Source
This research employed a publicly available dataset, plant-pathology-fpgv8 [
22], sourced from the Kaggle website. The dataset comprises 18,632 high-quality photographs classified into 12 categories based on the complexity and diversity of the leaf diseases.
Figure 5 depicts the twelve categories in the dataset, and their corresponding names and counts are presented in
Table 1.
The dataset used in this research exhibits a background of complex disease leaves, a high number of images depicting a single disease, a limited number of images displaying multiple diseases, and an unequal distribution of categories, as illustrated in
Figure 5 and
Table 1. These characteristics pose significant challenges to accurate disease identification and increase the likelihood of model overfitting.
3.2. Image Preprocessing and Enhancement
If the pixels of the dataset’s images are excessively large and the number of samples is small, both the training infrastructure and the classification network will face significant challenges. The original dataset contains images with resolutions of 4000 × 2760 and 4000 × 3000 pixels. To increase the training set’s size and diversity, we cropped the images to 512 × 512 and performed the following three operations: (1) applied color dithering to the image to change saturation, brightness, contrast, and sharpness; (2) randomly rotated the image angle; and (3) added Gaussian noise.
Figure 6 shows the exact results of these operations. On the one hand, this process can expand the dataset’s diversity and the model’s ability to generalize. On the other hand, changing the image’s saturation can help to emphasize the lesion.
Table 1 shows the number of distinct categories in the dataset.
3.3. Equipment
All experiments were conducted on a host CPU with 10 cores, to ensure fairness.
Table 2 presents the network model’s architecture and other configuration options.
3.4. Experiment Settings
In this experiment, the original dataset was partitioned into three sets, namely the training set, the validation set, and the test set, using a Python script. The training and validation sets were divided in an 8:1 ratio, with the test set alone consisting of 1868 images.
For the purpose of network training and validation, the images were cropped to 224× 224 pixels using the center cropping approach, while images of size 512 × 512 pixels were used for testing during the testing phase. To facilitate training, all image data were standardized using Equation (
15):
where
represents the normalized output result,
represents the original image input data,
represents the mean values of
, which are (0.485, 0.456, 0.406), and
represents the standard deviations, which are (0.229, 0.224, 0.225).
During training, the focal loss function, in combination with the class balance approach, was employed, and the network parameters were optimized using the AdamW optimizer. A batch size of eight was used, with an initial learning rate set at
. The cosine annealing strategy was utilized, and the model was trained for 100 epochs. Finally, the predictions were tested, and the optimal training parameters were recorded. It is worth noting that all experiments were executed on a host CPU containing 10 cores, to ensure fairness, and the framework of the network model and other configuration options can be found in
Table 2.
3.5. Evaluation Indexes
In evaluating the performance of the classification model on the apple leaf diseases dataset, it is important to note that the dataset has imbalanced data, rendering the accuracy performance index insufficient. To address this limitation, this study employs additional evaluation metrics, such as precision rate, recall rate, and F1 score. The precision rate measures the proportion of properly predicted samples, while the recall rate relates to the proportion of projected positive samples among real positive samples. The F1 score considers both the recall and precision rates, thereby achieving a balanced and optimal outcome. Prior to computing these metrics, one must understand the concept of a confusion matrix, which consists of four components: true positives (TP), false positives (FP), true negatives (TN), and false negatives (FN), as depicted in
Figure 7.
4. Results
The experimental design comprises four distinct sections. Firstly, the impact of varying learning rates on the network model’s accuracy is compared. Secondly, the effectiveness of employing data augmentation techniques in identifying apple leaf diseases is evaluated. Thirdly, a comparison is made between the performance of the proposed network model and classical network models. Lastly, an ablation experiment is conducted utilizing the RFCA ResNet network model.
4.1. Comparative Experiments with Different Learning Rates
To investigate the effect of learning rates on image recognition, we employ the control variable method. The initial learning rate is set to 0.01, 0.001, 0.0001, 0.0002, 0.0003, and 0.0004, in order to ensure experiment comparability and increase recognition accuracy. The experiment uses the RFCA ResNet model and trains and tests the original dataset. The learning rate decay strategy, batch size, and training epoch all follow the same guidelines.
Table 3 presents the specific training parameters and test results. The highest test accuracy, of 89.61%, is achieved when the learning rate is set to
.
The graph of the model accuracy corresponding to the test learning rate is presented in
Figure 8. The results indicate that the model converges slowly and the curve is volatile when the learning rate is high. When the learning rate is set to the
level, the curve has iterated nearly 30 epochs and stabilized at an accuracy rate of about 85%.
4.2. Impact of Data Augmentation Methods on Models
A comparative experiment was conducted on the RFCA ResNet network model to verify the effectiveness of the data augmentation strategy in improving the model’s accuracy. The recognition accuracy and overall training time on the apple disease test set are presented in
Table 4. The results indicate that the model can converge faster and achieve better recognition performance during the same training epoch when the data augmentation strategy is employed, as illustrated in
Figure 9.
According to the results presented in
Table 4, we observe an improvement of 0.97 and 0.67 percentage points in precision and F1 score, although this requires sacrificing precision and recall for each class. In addition, as shown in
Figure 9, the performance of the model converges faster after adopting the data augmentation strategy.
First, the improvements in accuracy and F1 score mean that our method outperforms the state of the art in overall performance. However, sacrificing precision and recall may result in less accurate predictions for some classes. These differences may originate from the imbalance of the dataset and the effect of the adopted data augmentation strategies on different classes to different degrees.
Second, the fast convergence of the model performance demonstrates that our method can utilize limited training data more efficiently, by using data augmentation strategies. This is of great significance for improving model performance under limited resources, especially in large-scale datasets or real-time application scenarios.
4.3. Comparative Experiments of Different Network Models
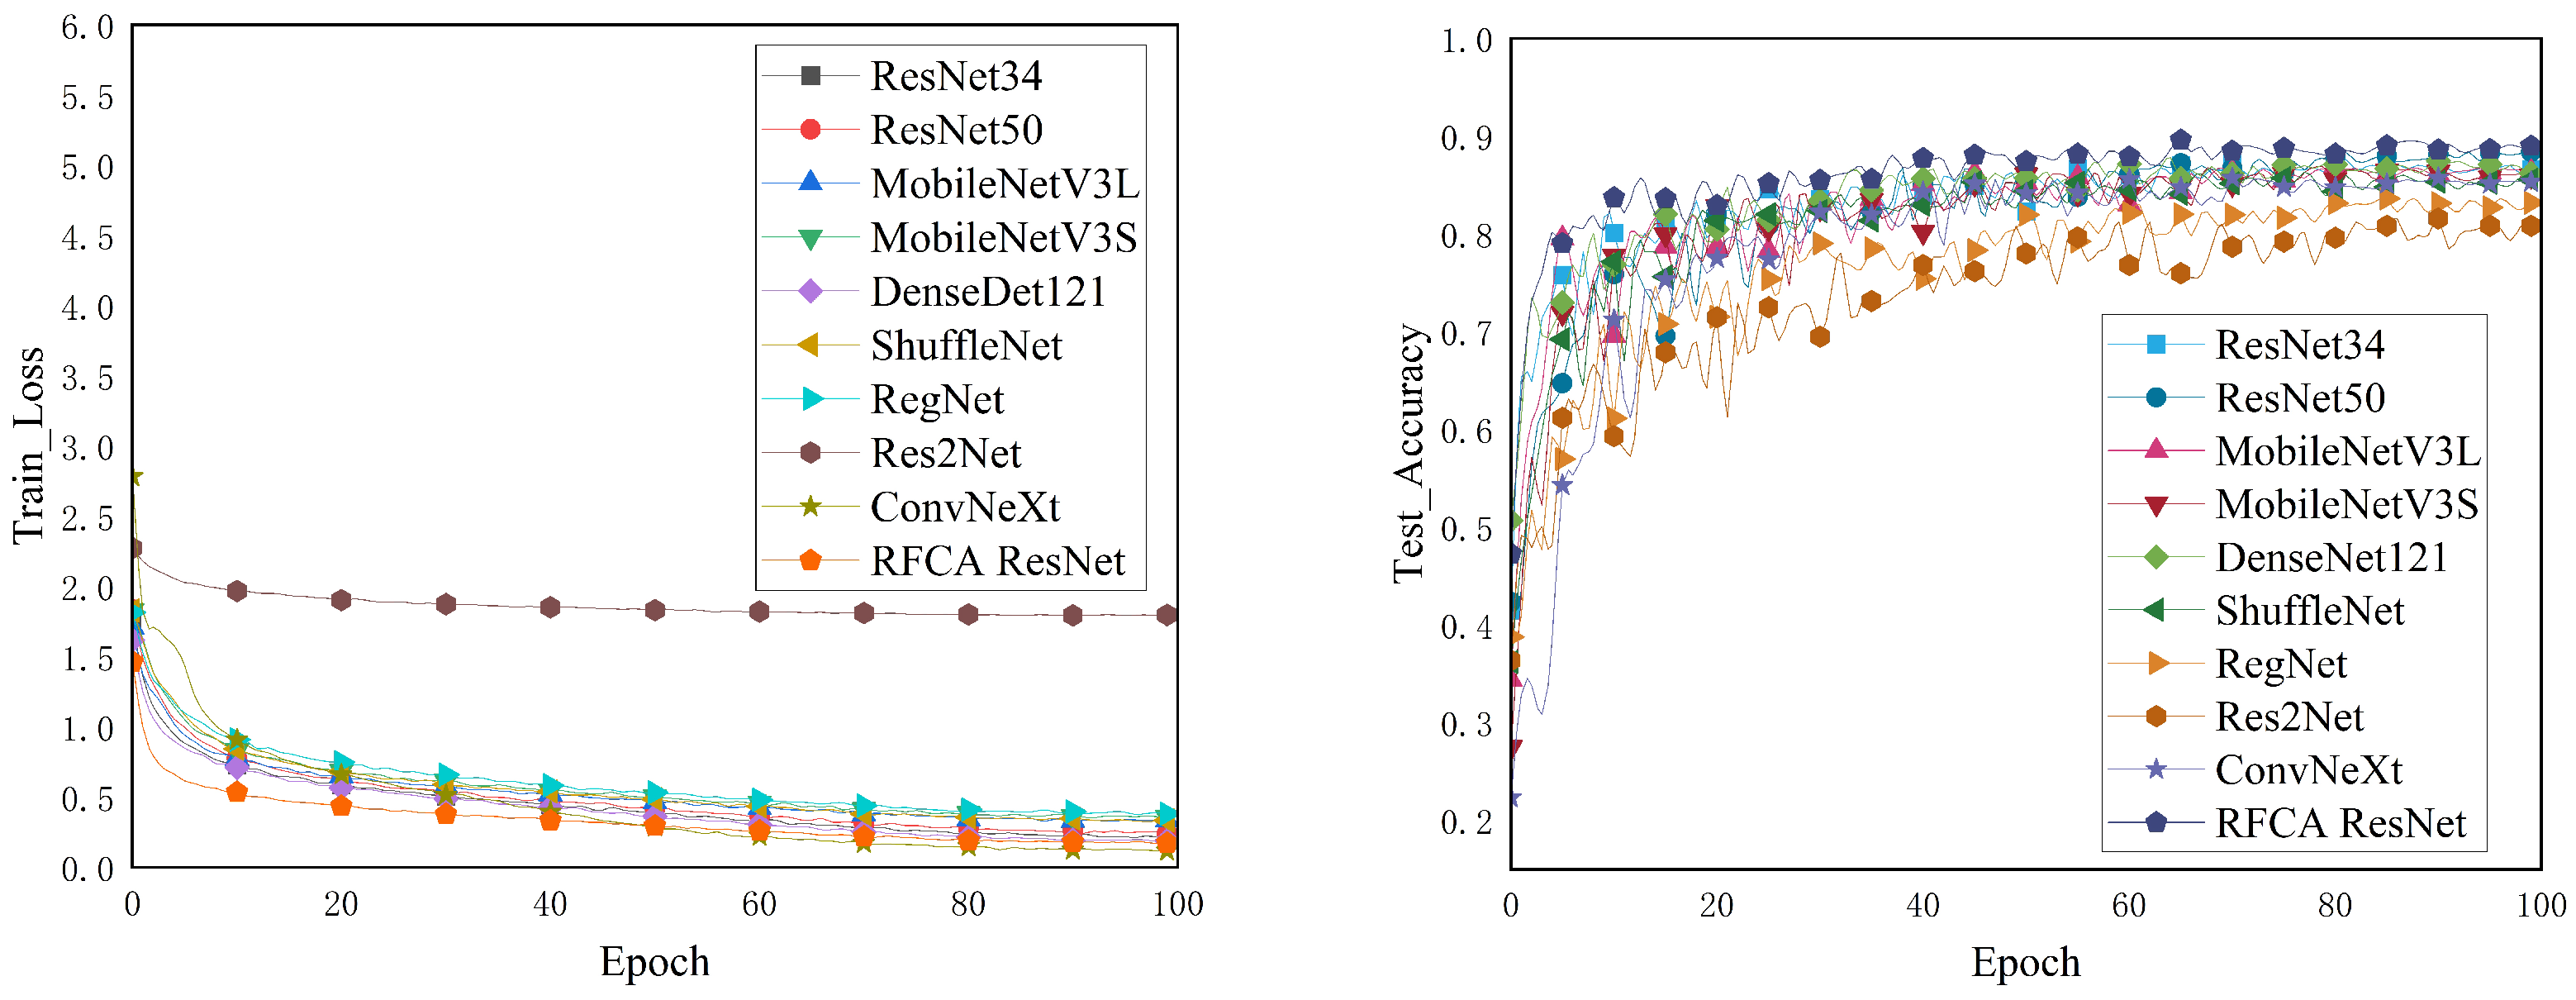
To demonstrate the superior performance of the RFCA ResNet network model, we conducted a comparative experiment with a commonly used CNN model. As presented in
Table 5, RFCA ResNet achieved an average classification accuracy rate, precision rate, recall rate, and F1 score of 89.61%, 56.66%, 72.76%, and 58.77%, respectively, outperforming other CNN methods. Moreover, as depicted in
Figure 10, while the loss of the Res2Net network remained nearly constant, the proposed RFCA ResNet achieved faster convergence, indicating that the Res2Net network may not be suitable for this dataset, and the method suggested in our research is more generalizable. The Densenet121 method connects all channels for feature reuse, which impacts the model’s classification accuracy, making it simpler for the model to maintain background noise information in complex contexts. In contrast, the Shufflenet, RegNet, Res2Net, and ConvNeXt neural network architectures may face difficulties in capturing fine-grained details in complex images, potentially hindering their ability to learn sufficiently representative features for all possible variations in apple leaves and complex backgrounds. Therefore, without additional modifications or preprocessing techniques, these networks may not be the most suitable choice for recognizing apple leaves with complex backgrounds.
To compare the performance of different models, we plotted the precision–recall (P–R) curve for each model. This approach provides a better evaluation of the performance of each model.
Figure 11 shows the P–R curves for each model, represented by different colors. The area covered by the blue curve is the largest, indicating the model has the best classification performance.
4.4. Ablation Experiment
To assess the effectiveness of various modifications made to the ResNet18 network model in improving its performance, we utilized accuracy, precision, recall, and F1 score as evaluation metrics, and the original dataset was used for training and testing. In particular, we replaced the first convolutional layer in the original network when using only the RFB module, incorporated it into the residual module when using only the attention method, and changed the cross-entropy loss function when replacing it with the focal loss in combination with the class balance approach alone.
Table 6 presents a comparison of the performance evaluation indicators of the network when adding RFB, class balance with focal loss, embedding the attention module, not adding any module, and the RFCA ResNet model. Additionally,
Figure 12 displays the loss changes of the RFCA ResNet network on the training set and the test accuracy change curve of the set.
To improve the performance of the ResNet18 network model, a series of enhancements were incorporated.
Table 6 presents the evaluation indicators of accuracy, precision, recall, and F1 score, using the original dataset for both training and testing. The first convolutional layer in the original network was replaced with the RFB module when only the RFB module was used, while the FCCA module was incorporated into the residual module when only the attention method was utilized. When focal loss was used in combination with the class balance approach alone, the cross-entropy loss function was modified. The results showed that adding the attention mechanism to ResNet18 increased the accuracy, precision, recall, and F1 score by 0.7, 10.17, 7.81, and 3.61 percentage points, respectively. The RFB structure was found to broaden the model’s receptive field, extract feature information at various scales, and improve its capacity for information representation. This resulted in an increase in accuracy of 1.12 percentage points and in F1 score of 1.99 percentage points. Altering the loss function to account for the effect of an unbalanced dataset on model performance improved all parts of the model’s performance evaluation indicators. Finally, the accuracy and F1 score of the RFFA ResNet model on the apple leaf disease dataset were found to be 89.16% and 58.77%, respectively, which were 1.83 and 9.31 percentage points higher than ResNet18. This was achieved by replacing the RFB module, embedding the attention mechanism, and using focal loss in combination with the class balance strategy.
Figure 12 shows that the recognition accuracy of the model on the test set was initially unstable but tended to stabilize and perform well afterward, when the focal loss in combination with the class balance approach was employed as the loss function. The training loss value decreased as more iterations were completed after adding the aforementioned modules to ResNet18, and the accuracy rate on the test set increased. This demonstrated the enhanced model’s strong generalization capabilities and the value of the several enhancements made to ResNet18 in this research.
5. Discussion
In our research, we propose a novel method for the classification and identification of apple leaf diseases based on a dual attention mechanism and multi-scale feature extraction. Our method is evaluated on a dataset that exhibits common challenges in plant disease classification, including complex backgrounds and class imbalance.
Owing to their effectiveness, attention mechanisms have been widely employed in the field of plant disease recognition. Zhu et al. [
38] combined the convolutional block attention module (CBAM) and EfficientNet-B4 to construct the EfficientNet-B4-CBAM model, which improved the ability to express regional information of camellia oleifera fruit and achieved a final model accuracy rate of 97.02%. Lin et al. [
39] employed a naive metric few-shot learning network as a baseline learning method, and embedded attention modules of channel, space, and mixed attention types. The experimental results revealed that the incorporation of these attention modules led to varying degrees of improvement in accuracy. In this research, we introduced the FCCA module and evaluated its impact on the baseline accuracy through ablation experiments (refer to
Table 6). Our findings indicated that the inclusion of the FCCA module enhanced the baseline accuracy by 0.7%. However, as disease complexity increases, the limitations of attention mechanisms can hinder their effectiveness, necessitating the exploration of models with enhanced feature extraction capabilities. To address this issue, we adopted a multi-scale feature extraction approach inspired by GoogleNet and ResNet, replacing the low-level feature extraction module of ResNet with the RFB module. Our experimental results demonstrated that our approach improved accuracy by 1.12%, making it an innovative and superior method for feature extraction.
In addition, in existing studies on plant disease identification, datasets almost always exhibit a balanced distribution, while studies on datasets exhibiting long-tailed distributions are rare. To address this problem, Hsiao et al. [
40] proposed the MTSbag method, which combines MTS with a bagging-based ensemble learning method to enhance the ability of traditional MTS to deal with imbalanced data. Min et al. [
41] developed a data augmentation technique that utilizes an image-to-image translation model to address the issue of category number bias by generating additional diseased leaf images to supplement the insufficient dataset. In this research, we adopted focal loss and class balancing strategies to optimize the model’s handling of imbalanced data. With these optimization strategies, our method exhibits significant advantages in handling imbalanced data. Data augmentation is a common method to improve the generalization ability of models. In this paper, we improved the model’s accuracy and F1 score by adding Gaussian noise and random rotation, but at the expense of precision and recall. We believe that these evaluation metrics may not fully reflect the model’s performance in real-world applications. Future research can design more comprehensive evaluation methods to explore the model’s performance in different scenarios and further optimize the model and data augmentation strategies.
In summary, our proposed method for crop disease recognition in complex backgrounds has significant advantages. We adopt a multi-scale feature extraction and attention mechanism, as well as focal loss and class balancing methods to deal with unbalanced data, achieve significant performance improvement, and provide a new approach and method for plant disease recognition.
6. Conclusions
We proposed a novel apple leaf disease classification and recognition method based on multi-scale feature extraction and a dual attention mechanism. Current apple orchard disease diagnosis relies heavily on manual inspection, which consumes significant human and material resources. These factors inspired us to explore deep learning methods for the classification of apple leaf diseases. In our experiments, we evaluated various metrics, including accuracy, precision, F1 score, and recall, and analyzed the following four aspects:
First, we investigated the impact of different learning rates on the network model’s accuracy. We found that the highest accuracy, reaching 89.61%, was achieved when the learning rate was 0.0003. In contrast, the accuracy decreased to 88.49% when the learning rate was 0.01. This highlights the importance of selecting an appropriate learning rate during model training.
Second, we studied the effects of data augmentation. By applying random rotation, color balance, and Gaussian noise to the training data, we found that data augmentation could improve the model’s performance in terms of accuracy and F1 score by 0.97% and 0.67%, respectively. However, the performance in precision and recall dropped by 0.91% and 5.53%, respectively. Specifically, before using data augmentation techniques, the model’s accuracy, precision, recall, and F1 score were 89.61%, 56.66%, 72.76%, and 58.77%, respectively. After applying data augmentation, these metrics changed to 90.58%, 55.75%, 67.23%, and 59.44%, respectively.
Third, we compared the performance of our proposed network model with traditional network models. We found that our model outperformed conventional convolutional neural networks in all considered metrics, including accuracy, precision, F1 score, and recall.
Last, we conducted ablation experiments using the RFCA ResNet network model. We found that each component in our proposed method played a crucial role in the model’s performance. Specifically, employing multi-scale feature extraction modules and dual attention mechanisms improved the model’s performance, while using the focal loss function and class balancing methods addressed imbalanced data issues. Moreover, the RFCA ResNet network model enhanced the model’s robustness.
In summary, we have proposed a method that incorporates multi-scale feature extraction modules and dual attention mechanisms, and applied the focal loss function and class balancing methods to handle imbalanced data for diagnosing apple leaf diseases. Our experimental results have demonstrated that this approach significantly improves the model’s performance, outperforming traditional convolutional neural networks. Our research findings have important implications for apple leaf disease diagnosis. However, the model’s parameters and computational complexity currently prevent it from being deployed on mobile devices. In the future, we plan to adopt lightweight methods, such as knowledge distillation, to reduce the model’s parameter size and computational complexity while considering resource limitations and processing capabilities on mobile devices, in order to achieve better performance and user experience in mobile deployment.
Author Contributions
Conceptualization, J.D. and Y.W.; methodology, J.D. and Y.Y.; formal analysis, C.Z.; resources, J.D.; data curation, C.Z.; writing—original draft preparation, J.D.; writing—review and editing, J.D. and X.C.; supervision, Y.W.; project administration, Y.W. and Y.Z.; funding acquisition, Y.W. and G.F. All authors have read and agreed to the published version of the manuscript.
Funding
This work was supported by the Anhui Provincial Engineering Laboratory for Beidou Precision Agriculture Information Open Fund Project (BDSYS2021003), the Special Fund for Anhui Characteristic Agriculture Industry Technology System (2021–2025), and the Anhui High School Natural Science Research Project (KJ2019A0211).
Institutional Review Board Statement
Not applicable.
Informed Consent Statement
Not applicable.
Data Availability Statement
Not applicable.
Acknowledgments
We thank Anhui Provincial Engineering Laboratory for Beidou Precision Agriculture Information for supporting our work and providing funding to us. We also thank all of the authors of the primary studies includes in this article. We also wish to thank the anonymous reviewers for their kind advice.
Conflicts of Interest
The authors declare no conflict of interest.
References
- Wu, Z.; Pan, C. State analysis of apple industry in China. In Proceedings of the IOP Conference Series: Earth and Environmental Science; IOP Publishing: Bristol, UK, 2021; Volume 831, p. 012067. [Google Scholar]
- Mupambi, G.; Anthony, B.M.; Layne, D.R.; Musacchi, S.; Serra, S.; Schmidt, T.; Kalcsits, L.A. The influence of protective netting on tree physiology and fruit quality of apple: A review. Sci. Hortic. 2018, 236, 60–72. [Google Scholar] [CrossRef]
- Duong, L.T.; Nguyen, P.T.; Di Sipio, C.; Di Ruscio, D. Automated fruit recognition using EfficientNet and MixNet. Comput. Electron. Agric. 2020, 171, 105326. [Google Scholar] [CrossRef]
- Gadade, H.D.; Kirange, D. Tomato leaf disease diagnosis and severity measurement. In Proceedings of the 2020 Fourth World Conference on Smart Trends in Systems, Security and Sustainability (WorldS4); London, UK, 27–28 July 2020, pp. 318–323.
- Habib, M.T.; Mia, M.J.; Uddin, M.S.; Ahmed, F. An in-depth exploration of automated jackfruit disease recognition. J. King Saud Univ. Comput. Inf. Sci. 2022, 34, 1200–1209. [Google Scholar] [CrossRef]
- Rozario, L.J.; Rahman, T.; Uddin, M.S. Segmentation of the region of defects in fruits and vegetables. Int. J. Comput. Sci. Inf. Secur. 2016, 14, 399. [Google Scholar]
- Xie, W.; Wang, F.; Yang, D. Research on carrot grading based on machine vision feature parameters. IFAC PapersOnLine 2019, 52, 30–35. [Google Scholar] [CrossRef]
- Jitanan, S.; Chimlek, P. Quality grading of soybean seeds using image analysis. Int. J. Electr. Comput. Eng. 2019, 9, 3495–3503. [Google Scholar] [CrossRef]
- Wani, J.A.; Sharma, S.; Muzamil, M.; Ahmed, S.; Sharma, S.; Singh, S. Machine learning and deep learning based computational techniques in automatic agricultural diseases detection: Methodologies, applications, and challenges. Arch. Comput. Methods Eng. 2022, 29, 641–677. [Google Scholar] [CrossRef]
- Zhang, C.; Zhang, S.; Yang, J.; Shi, Y.; Chen, J. Apple leaf disease identification using genetic algorithm and correlation based feature selection method. Int. J. Agric. Biol. Eng. 2017, 10, 74–83. [Google Scholar]
- Nuruzzaman, M.; Hossain, M.S.; Rahman, M.M.; Shoumik, A.S.H.C.; Khan, M.A.A.; Habib, M.T. Machine vision based potato species recognition. In Proceedings of the 2021 5th International Conference on Intelligent Computing and Control Systems (ICICCS), Madurai, India, 6–8 May 2021; pp. 1–8. [Google Scholar]
- Chakraborty, S.; Paul, S.; Rahat-uz Zaman, M. Prediction of apple leaf diseases using multiclass support vector machine. In Proceedings of the 2021 2nd International Conference on Robotics, Electrical and Signal Processing Techniques (ICREST), Dhaka, Bangladesh, 5–7 January 2021; pp. 147–151. [Google Scholar]
- Jia, X.; Song, S.; He, W.; Wang, Y.; Rong, H.; Zhou, F.; Xie, L.; Guo, Z.; Yang, Y.; Yu, L.; et al. Highly scalable deep learning training system with mixed-precision: Training imagenet in four minutes. arXiv 2018, arXiv:1807.11205. [Google Scholar]
- Hara, K.; Kataoka, H.; Satoh, Y. Can spatiotemporal 3d cnns retrace the history of 2d cnns and imagenet? In Proceedings of the IEEE Conference on Computer Vision and Pattern Recognition, Salt Lake City, UT, USA, 18–22 June 2018; pp. 6546–6555. [Google Scholar]
- Heusel, M.; Clevert, D.A.; Klambauer, G.; Mayr, A.; Schwarzbauer, K.; Unterthiner, T.; Hochreiter, S. ELU-networks: Fast and accurate CNN learning on imagenet. NiN 2015, 8, 35–68. [Google Scholar]
- Tugrul, B.; Elfatimi, E.; Eryigit, R. Convolutional neural networks in detection of plant leaf diseases: A review. Agriculture 2022, 12, 1192. [Google Scholar] [CrossRef]
- Ramesh, S.; Hebbar, R.; Niveditha, M.; Pooja, R.; Shashank, N.; Vinod, P.V. Plant disease detection using machine learning. In Proceedings of the 2018 International Conference on Design Innovations for 3Cs Compute Communicate Control (ICDI3C), Bangalore, India, 25–28 April 2018; pp. 41–45. [Google Scholar]
- Mohameth, F.; Bingcai, C.; Sada, K.A. Plant disease detection with deep learning and feature extraction using plant village. J. Comput. Commun. 2020, 8, 10–22. [Google Scholar] [CrossRef]
- Jiang, P.; Chen, Y.; Liu, B.; He, D.; Liang, C. Real-time detection of apple leaf diseases using deep learning approach based on improved convolutional neural networks. IEEE Access 2019, 7, 59069–59080. [Google Scholar] [CrossRef]
- Simonyan, K.; Zisserman, A. Very deep convolutional networks for large-scale image recognition. arXiv 2014, arXiv:1409.1556. [Google Scholar]
- Liu, A.; Wu, Y.; Zhu, X.; Fan, G.; Le, Y.; Zhang, Y. Corn disease recognition based on deep residual network. Jiangsu J. Agric. Sci. 2021, 37, 67–74. [Google Scholar]
- Thapa, R.; Zhang, K.; Snavely, N.; Belongie, S.; Khan, A. The Plant Pathology Challenge 2020 data set to classify foliar disease of apples. Appl. Plant Sci. 2020, 8, e11390. [Google Scholar] [CrossRef]
- Yan, Q.; Yang, B.; Wang, W.; Wang, B.; Chen, P.; Zhang, J. Apple leaf diseases recognition based on an improved convolutional neural network. Sensors 2020, 20, 3535. [Google Scholar] [CrossRef]
- SARDOĞAN, M.; Yunus, Ö.; TUNCER, A. Detection of apple leaf diseases using faster R-CNN. Düzce ÜNiversitesi Bilim Teknol. Derg. 2020, 8, 1110–1117. [Google Scholar] [CrossRef]
- Li, X.; Li, S. Transformer Help CNN See Better: A Lightweight Hybrid Apple Disease Identification Model Based on Transformers. Agriculture 2022, 12, 884. [Google Scholar] [CrossRef]
- Liu, Z.; Lin, Y.; Cao, Y.; Hu, H.; Wei, Y.; Zhang, Z.; Lin, S.; Guo, B. Swin transformer: Hierarchical vision transformer using shifted windows. In Proceedings of the IEEE/CVF International Conference on Computer Vision, Montreal, BC, Canada, 10–17 October 2021; pp. 10012–10022. [Google Scholar]
- Hu, J.; Shen, L.; Sun, G. Squeeze-and-excitation networks. In Proceedings of the IEEE Conference on Computer Vision and Pattern Recognition, Salt Lake City, UT, USA, 18–22 June 2018; pp. 7132–7141. [Google Scholar]
- Woo, S.; Park, J.; Lee, J.Y.; Kweon, I.S. Cbam: Convolutional block attention module. In Proceedings of the European Conference on Computer Vision (ECCV), Munich, Germany, 8–14 September 2018; pp. 3–19. [Google Scholar]
- Hou, Q.; Zhou, D.; Feng, J. Coordinate attention for efficient mobile network design. In Proceedings of the IEEE/CVF Conference on Computer Vision and Pattern Recognition, Nashville, TN, USA, 20–25 June 2021; pp. 13713–13722. [Google Scholar]
- Qin, Z.; Zhang, P.; Wu, F.; Li, X. Fcanet: Frequency channel attention networks. In Proceedings of the IEEE/CVF International Conference on Computer Vision, Montreal, BC, Canada, 11–17 October 2021; pp. 783–792. [Google Scholar]
- He, K.; Zhang, X.; Ren, S.; Sun, J. Deep residual learning for image recognition. In Proceedings of the IEEE Conference on Computer Vision and Pattern Recognition, Las Vegas, NV, USA, 27–30 June 2016; pp. 770–778. [Google Scholar]
- Howard, A.; Sandler, M.; Chu, G.; Chen, L.C.; Chen, B.; Tan, M.; Wang, W.; Zhu, Y.; Pang, R.; Vasudevan, V.; et al. Searching for mobilenetv3. In Proceedings of the IEEE/CVF International Conference on Computer Vision, Seoul, Republic of Korea, 27 October–2 November 2019; pp. 1314–1324. [Google Scholar]
- Huang, G.; Liu, Z.; Van Der Maaten, L.; Weinberger, K.Q. Densely connected convolutional networks. In Proceedings of the IEEE Conference on Computer Vision and Pattern Recognition, Honolulu, HI, USA, 21–26 July 2017; pp. 4700–4708. [Google Scholar]
- Radosavovic, I.; Kosaraju, R.P.; Girshick, R.; He, K.; Dollár, P. Designing network design spaces. In Proceedings of the IEEE/CVF Conference on Computer Vision and Pattern Recognition, Seattle, WA, USA, 13–19 June 2020; pp. 10428–10436. [Google Scholar]
- Zhang, X.; Zhou, X.; Lin, M.; Sun, J. Shufflenet: An extremely efficient convolutional neural network for mobile devices. In Proceedings of the IEEE Conference on Computer Vision and Pattern Recognition, Salt Lake City, UT, USA, 18–22 June 2018; pp. 6848–6856. [Google Scholar]
- Gao, S.H.; Cheng, M.M.; Zhao, K.; Zhang, X.Y.; Yang, M.H.; Torr, P. Res2net: A new multi-scale backbone architecture. IEEE Trans. Pattern Anal. Mach. Intell. 2019, 43, 652–662. [Google Scholar] [CrossRef]
- Liu, Z.; Mao, H.; Wu, C.Y.; Feichtenhofer, C.; Darrell, T.; Xie, S. A convnet for the 2020s. In Proceedings of the IEEE/CVF Conference on Computer Vision and Pattern Recognition, New Orleans, LA, USA, 18–24 June 2022; pp. 11976–11986. [Google Scholar]
- Zhu, X.; Zhang, X.; Sun, Z.; Zheng, Y.; Su, S.; Chen, F. Identification of oil tea (Camellia oleifera C. Abel) cultivars using EfficientNet-B4 CNN model with attention mechanism. Forests 2022, 13, 1. [Google Scholar] [CrossRef]
- Lin, H.; Tse, R.; Tang, S.K.; Qiang, Z.P.; Pau, G. The Positive Effect of Attention Module in Few-Shot Learning for Plant Disease Recognition. In Proceedings of the 2022 5th International Conference on Pattern Recognition and Artificial Intelligence (PRAI), Chengdu, China, 19–21 August 2022; pp. 114–120. [Google Scholar]
- Hsiao, Y.H.; Su, C.T.; Fu, P.C. Integrating MTS with bagging strategy for class imbalance problems. Int. J. Mach. Learn. Cybern. 2020, 11, 1217–1230. [Google Scholar] [CrossRef]
- Min, B.; Kim, T.; Shin, D.; Shin, D. Data Augmentation Method for Plant Leaf Disease Recognition. Appl. Sci. 2023, 13, 1465. [Google Scholar] [CrossRef]
| Disclaimer/Publisher’s Note: The statements, opinions and data contained in all publications are solely those of the individual author(s) and contributor(s) and not of MDPI and/or the editor(s). MDPI and/or the editor(s) disclaim responsibility for any injury to people or property resulting from any ideas, methods, instructions or products referred to in the content. |
© 2023 by the authors. Licensee MDPI, Basel, Switzerland. This article is an open access article distributed under the terms and conditions of the Creative Commons Attribution (CC BY) license (https://creativecommons.org/licenses/by/4.0/).


 and
and 


