Article

SSMDA: Self-Supervised Cherry Maturity Detection Algorithm Based on Multi-Feature Contrastive Learning

College of Information Engineering, Dalian University, Dalian 116622, China
*
Author to whom correspondence should be addressed.
Agriculture 2023, 13(5), 939; https://doi.org/10.3390/agriculture13050939
Submission received: 1 April 2023 / Revised: 14 April 2023 / Accepted: 19 April 2023 / Published: 25 April 2023

Abstract

:
Due to the high cost of annotating dense fruit images, annotated target images are limited in some ripeness detection applications, which significantly restricts the generalization ability of small object detection networks in complex environments. To address this issue, this study proposes a self-supervised cherry ripeness detection algorithm based on multi-feature contrastive learning, consisting of a multi-feature contrastive self-supervised module and an object detection module. The self-supervised module enhances features of unlabeled fruit images through random contrastive augmentation, reducing interference from complex backgrounds. The object detection module establishes a connection with the self-supervised module and designs a shallow feature fusion network based on the input target scale to improve the detection performance of small-sample fruits. Finally, extensive experiments were conducted on a self-made cherry dataset. The proposed algorithm showed improved generalization ability compared to supervised baseline algorithms, with better accuracy in terms of mAP, particularly in detecting distant small cherries.

1. Introduction

Fruit maturity detection aims to identify and determine whether fruit instances in fruit images are mature and is a crucial technology for the intelligent interpretation of picking robots and monitoring systems [1,2,3]. As an essential branch of agricultural vision object detection, fruit maturity detection has many applications in cherry, tomato, blue-berry, and other species. As one of the important fruit species in China, cherries have high nutritional value, but with the continuous growth of the fruit, mature cherries can easily fall off the mother plant, so there is a need for real-time automated picking. In recent years, with the rapid development of machine vision, supervised learning-based maturity object detection algorithms have been proposed one after another. For instance, to mitigate the challenges posed by the intricate nature of the environment and the similarity between fruits and their background, Parvathi et al. [4] incorporated advanced techniques such as image rotation and color conversion into the data augmentation process of the Faster R-CNN algorithm. Gao et al. [5] designed a dense fruit wall tree multi-class apple detection network for fruit image target multi-scene occlusion feature extraction for the fruit branch occlusion problem, which significantly improved the performance of maturity object detection. Wang et al. [6] designed Detail Semantics Enhancement (D.S.E) to construct exponentially enhanced bifurcation cross-entropy (E.B.C.E) and doubly enhanced mean squared error (D.E.M.S.E) loss functions for small targets with complex backgrounds. Although supervised learning-based ripeness detection algorithms have greatly improved in accuracy, annotating cherry-dense small sample fruit images as data support can incur high labor costs. In some ripeness detection applications, the amount of annotated data is easily scarce due to cost issues. However, supervised learning-based algorithms can only improve the model performance by enhancing the annotated data, which very easily causes the model to have low generalization ability in complex environments such as lighting, branch and leaf shading, and similar fruit shading. Cost data limitations and small sample miss detection in complex environments remain essential challenges for fruit ripeness detection.
Self-supervised learning-based object detection algorithms are an effective solution to the limitation of data scarcity [7,8,9,10,11,12,13] and can greatly improve the performance of maturity object detection under data limitations. For example, Zhang [14] used a detection algorithm combining a self-supervised module rotated below with an object detection module to solve the complex environment and vehicle image annotation problem. Ling [15] improved the generalization performance of limited data in remote sensing images with a multi-modal CutPaste self-supervised module. Zhang et al. [16] designed a momentum contrast self-supervised representation learning algorithm to train unlabeled data in response to the slow development of detection due to the scar-city of sea surface sample data. Cai et al. [17] proposed a non-parametric computational self-supervised model SimDet+ to avoid the overfitting phenomenon in response to the problem that the model is prone to overfitting due to too little labeled data. However, the above algorithm extracts a fixed single feature, which limits the adaptability of the detection network in complex backgrounds, affects the generalization performance of the network, and is not suitable for cherry maturity detection. Therefore, this paper designs a self-supervised module with multi-feature contrastive learning to solve the problems of single-feature extraction and reduce complex background interference.
Since fruit images are generally collected at a long distance, many types of fruit image sample pixels belong to the small sample category, making the detection work frequently miss the detection phenomenon. Some scholars have started to study small-sample fruit image detection one after another. Wu et al. [18] improved the detection performance of small-scale fruits by K-means++ clustering pre-defined annotation frames for the problem of dense small-scale litchi image fruits. Sun et al. [19] accurately detected small apples by designing a balanced feature pyramid and introducing Kullback-Leibler distillation loss features. Although the above methods can effectively improve the detection performance of small samples, they do not apply to the case of small dense fruits in complex environments. For this reason, this paper designs a shallow feature fusion network combined with K-means clustering to solve the complex environment-dense small fruit underdetection situation.
To address the above problems, this paper proposes a Self-Supervised cherry Maturity Detection Algorithm based on multi-feature contrastive learning (S.S.M.D.A), which can effectively use unlabeled image data to solve the labeling cost problem. The algorithm comprises a multi-feature contrastive self-supervised module and an object detection module. First, the multi-feature contrastive self-supervised module aims to use Data Augmentation to perform random cropping, flipping, daylighting, and other data enhancements on unlabeled cherry images, learn various intrinsic features based on the NT-Xent (the normalized temperature-scaled cross-entropy loss) contrastive function, and reduce the interference of complex background information on the detection results. The object detection module aims to build a cherry image target shallow feature fusion network, pre-set matching K-means clustering anchor frames, and optimize the learning strategy using Adaptive Moment Estimation (Adam) function and Stochastic Gradient Descent (S.G.D) function. Finally, this paper migrates the pre-trained backbone weights of the self-supervised module to the detection module to construct a self-supervised maturity detection algorithm with multi-feature contrast learning and validates the effectiveness of the algorithm on a homemade cherry image dataset.

2. Materials and Methods

2.1. Experimental Data

In order to design a more effective self-supervised cherry maturity detection method, this study uses a homemade cherry dataset. It is obtained from video intercepts taken by several cameras, which are divided into 6000 images of different periods such as germination, flowering, fruiting, and ripening stages. However, the detection task of this study is cherry maturity detection, so only 4400 images with cherries were selected. These images have different distances, such as close cherry images, medium-distance cherry images, and long-distance cherry images, as shown in Figure 1.

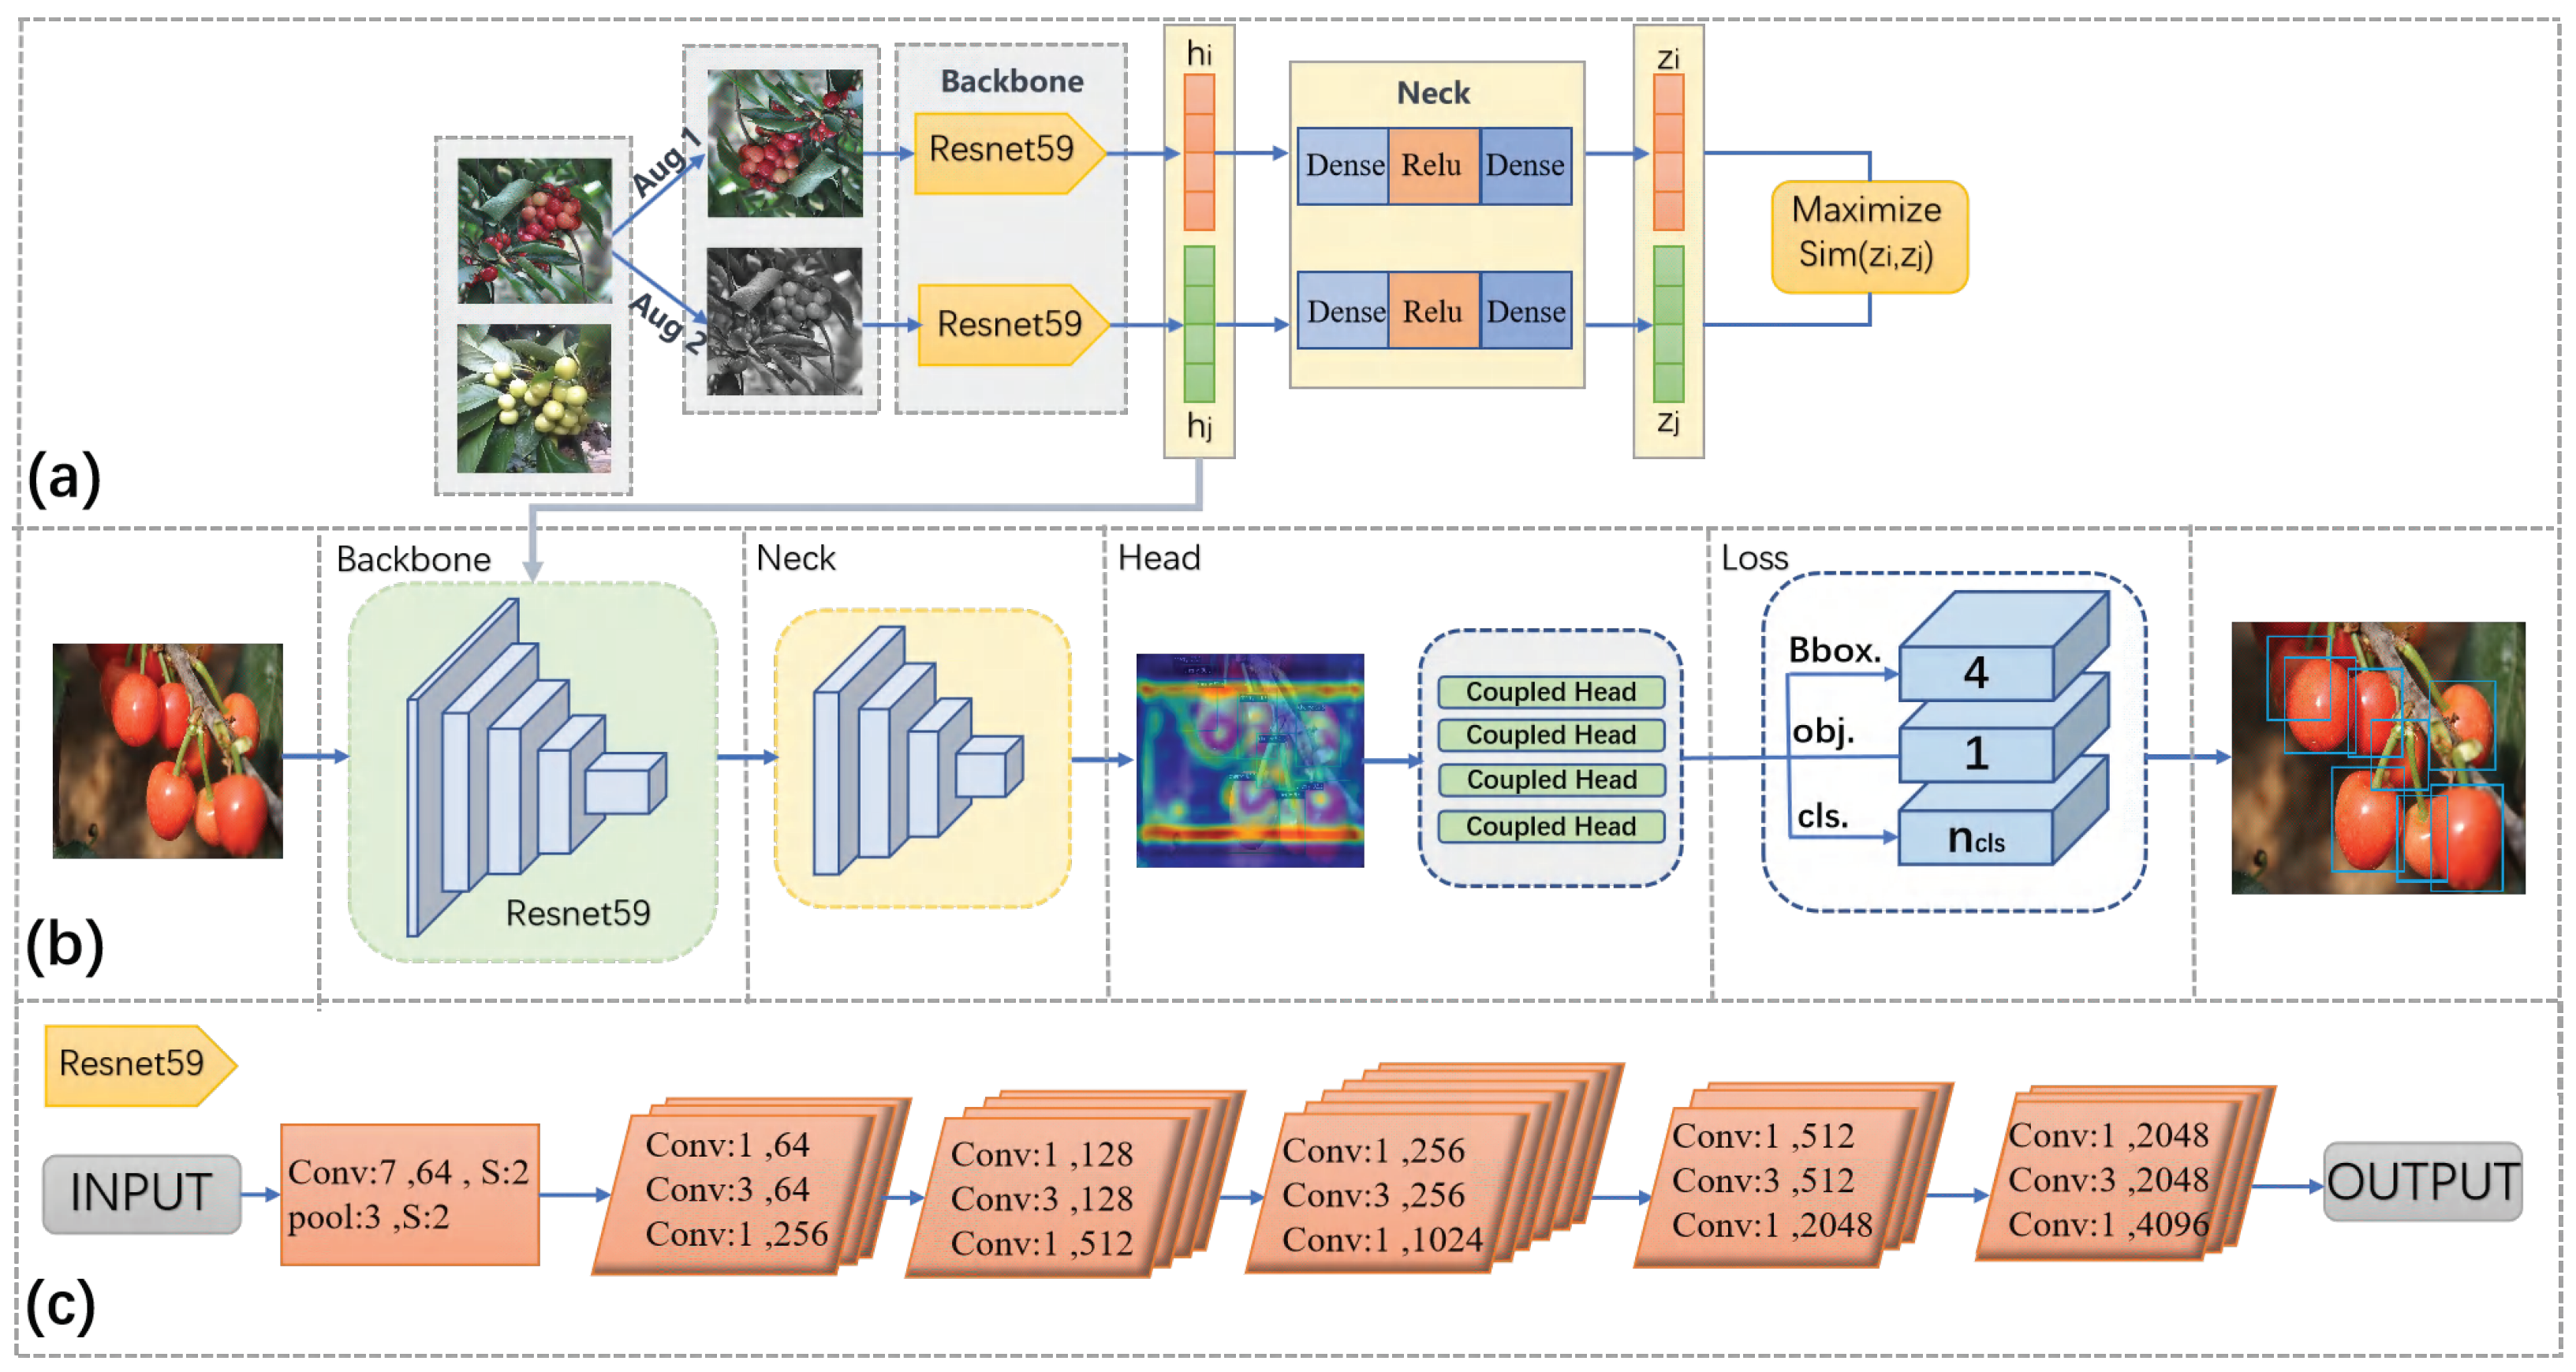
2.2. Algorithm Description

In cherry images, 70% of cherry fruits have only a few tens of pixels, and even distracting factors such as lighting and occlusion is present. Therefore, it is incredibly challenging to train a high-performance real-time detection algorithm with a limited annotated dataset [20].
Most of the existing maturity object detection algorithms use data expansion to solve the problems of small sample miss detection and sparse labeling data without considering the intrinsic correlation of labeled images, and the resulting images are only superimposed with the original image features, which restricts the generalization of the detection network model. Although most self-supervised object detection algorithms extract features from unlabeled data, the feature extraction is single, ignoring the problems of sample scale and illumination, which affects the feature learning of small sample fruit detection and is not suitable for the maturity detection algorithm of cherry. To address the described problem, a Self-Supervised cherry Maturity Detection Algorithm based on multi-feature contrastive learning is proposed in this paper. The algorithm consists of two modules: a multi-feature contrastive self-supervised module and an object detection module, and the general algorithm flow is shown in Figure 2.
The self-supervised module, Figure 2a, first performs multi-feature random contrastive data augmentation on the Aug (Data Augmentation) of the self-supervised module based on the input unlabeled cherry images so that the constructed sample pairs of images learn diverse association information in the NT-Xent contrastive function to form Encoder. Then some parameters are extracted from the self-supervised module Encoder and migrated to the object detection task. The object detection module uses the K-means clustering method for a prior bounding box prediction for a small number of labeled cherry images, designs a shallow fusion network by combining cherry characteristics, and fine-tunes the learning strategy using the Adam function and SGD function optimization.

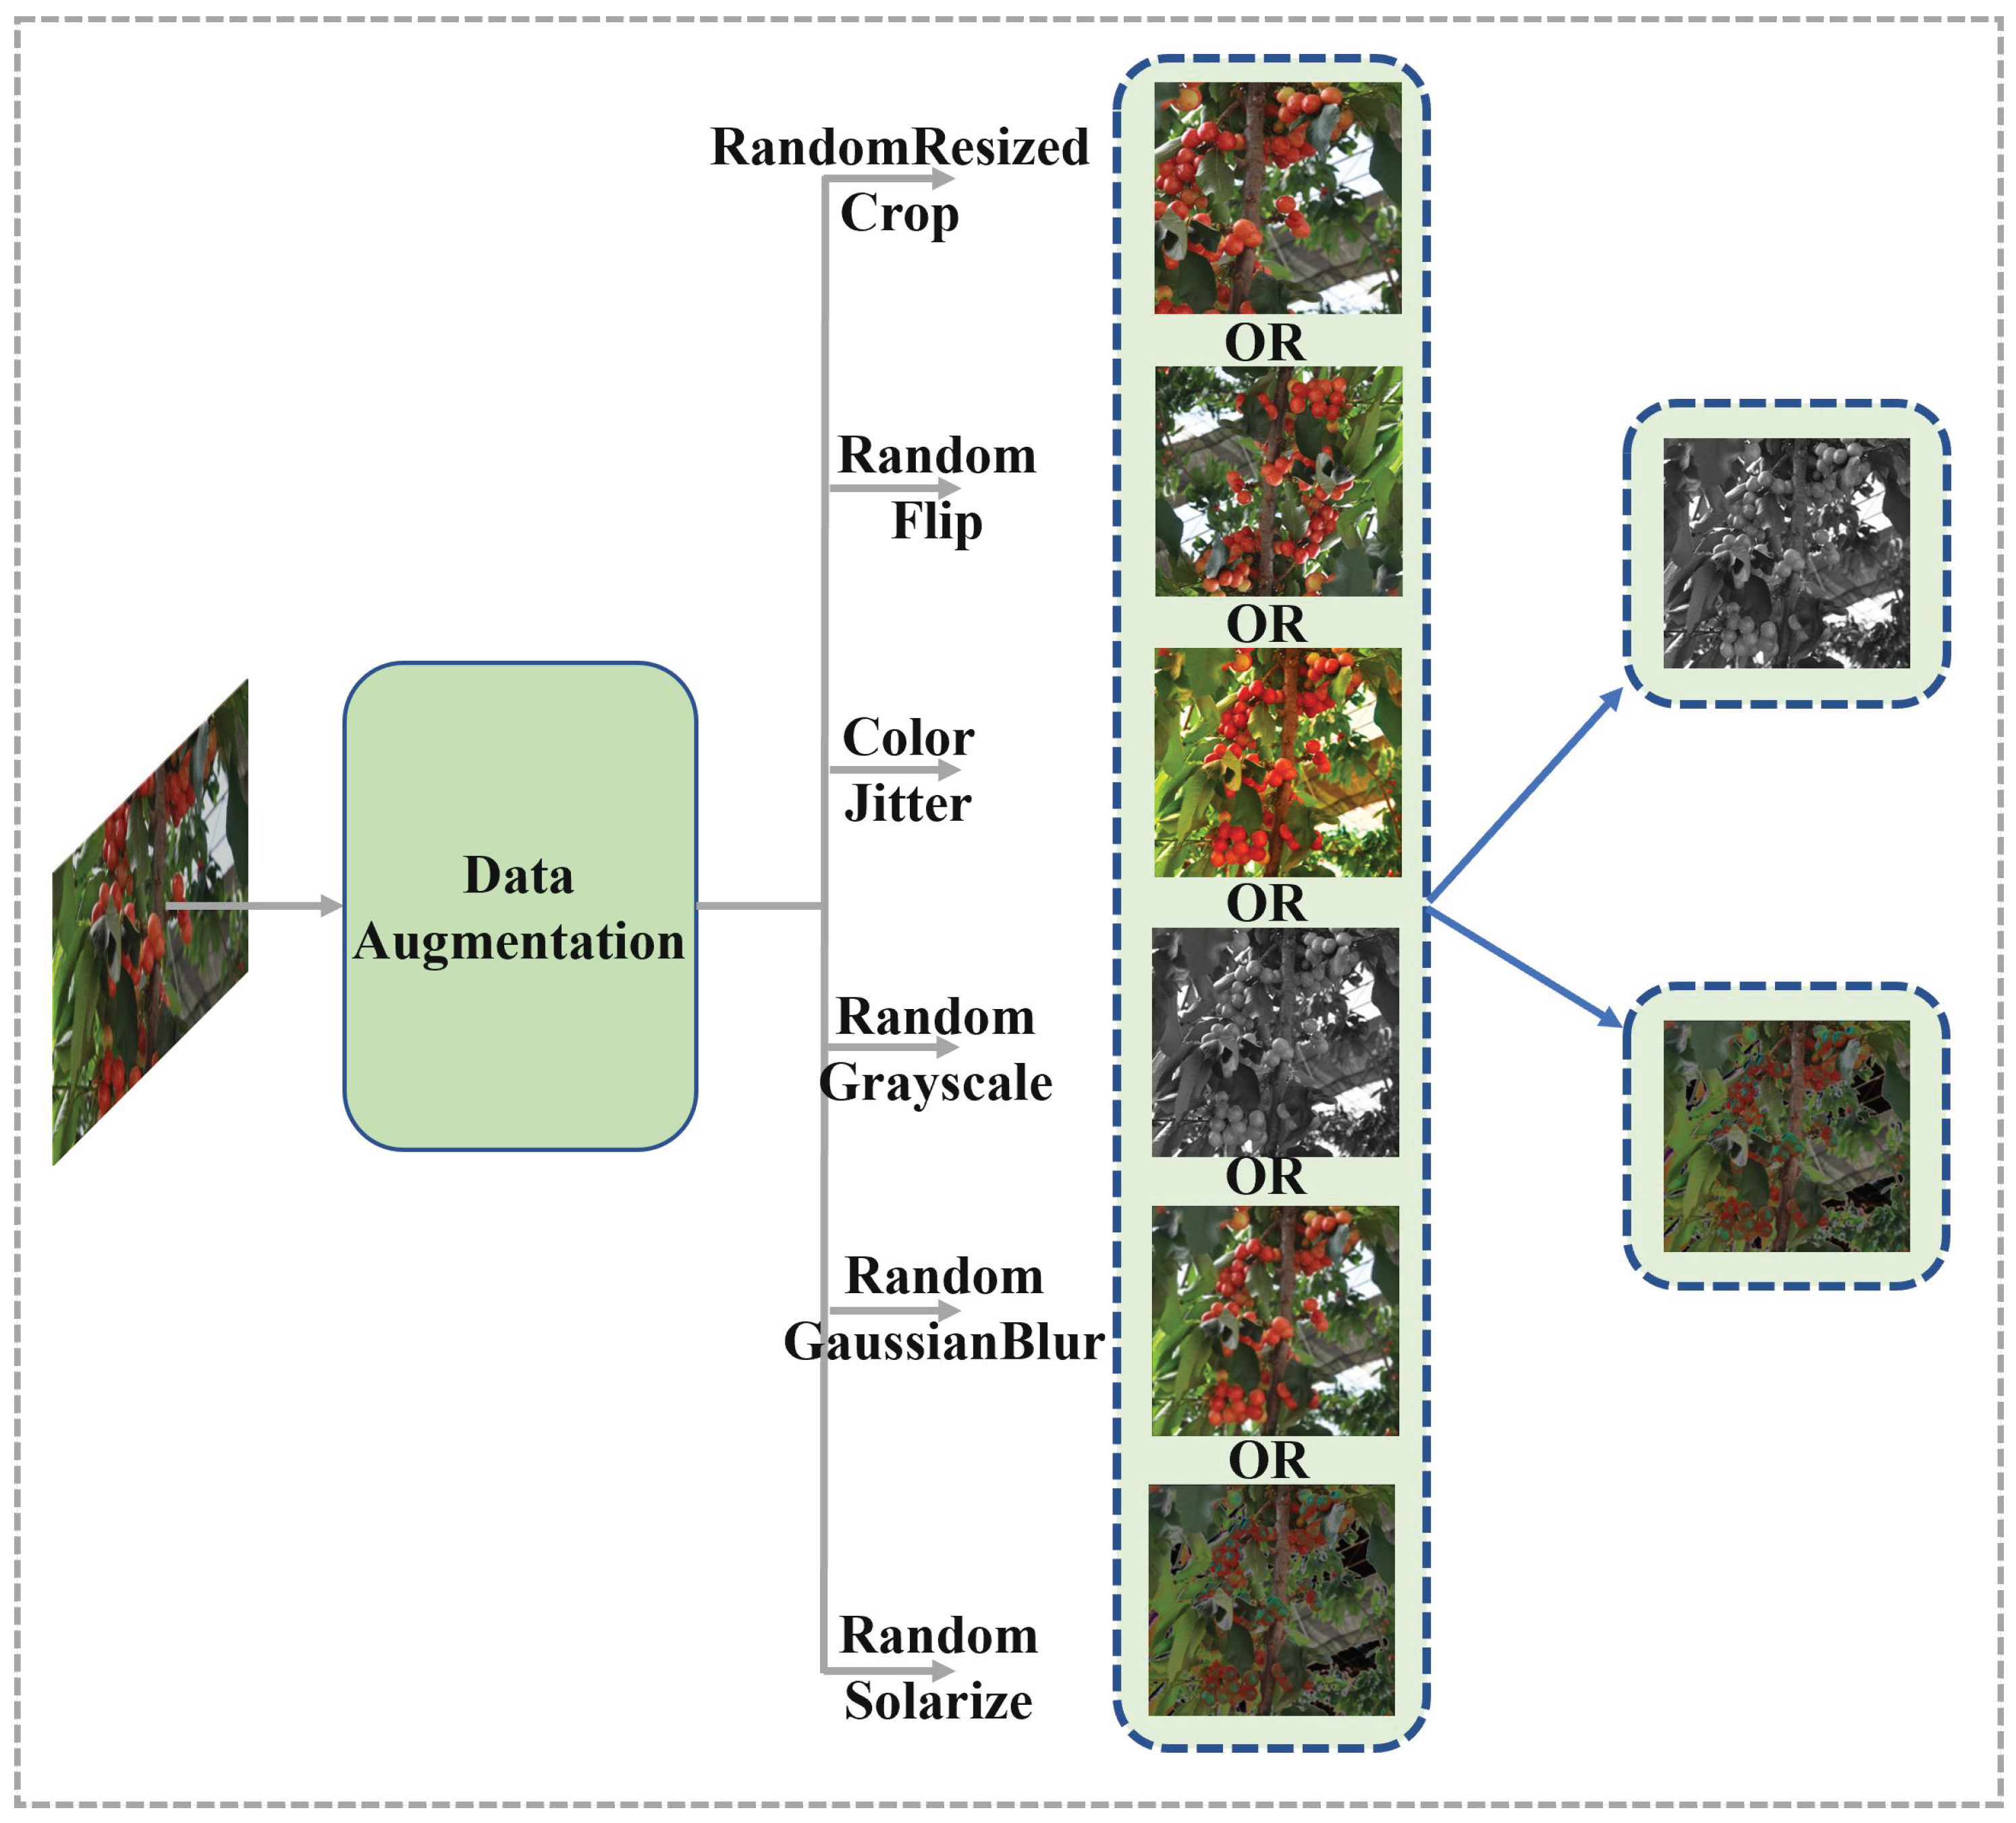
2.2.1. Multi-Feature Contrastive Self-Supervised Module

Due to the complex background of cherry images, direct data comparison reduces the differentiation between cherry and background, affecting the feature learning of the encoder and limiting the detection module’s generalization ability. Therefore, selective feature enhancement of the image before computing the contrast loss is necessary. Inspired by Simclr [10], a Data Augmentation module with 6 types of data augmentation, as shown in Figure 3, was designed. This module randomly selects 2 image augmentation techniques from RandomResizedCrop, RandomFlip, ColorJitter, RandomGrayscale, RandomGaussianBlur, and RandomSolarize to construct sample pairs.
As in Figure 2a, the multi-feature contrastive self-supervised module can effectively solve the overfitting caused by the limited labeling of cherry images and reduce the interference of complex environments. The module first uses unlabeled cherry images in Data Augmentation to construct sample pairs. Then it uses the contrast loss function to update and optimize the feature extractors of the two branch networks. In order to improve the extraction capability of the module and avoid the problem of gradient disappearance, Resnet59 (Improved Resnet50 [21] model structure) is designed in this paper to generate the feature vectors h i , h j , as shown in Figure 2c. Neck mainly maps 4096-dimensional feature vectors h i , h j into 128-dimensional space by Nonlinear Transformation through Dense, Relu, and Dense modules and obtains the representation ( z i , z j ). Finally, the training is completed using NT-Xent in the contrastive loss. NT-Xent is called the extension method of similarity, and its related formula is expressed as:
l i , j = l o g e s i m ( z i , z j ) τ 2 N k = 1 [ k i ] e s i m ( z i , z j ) τ
L = 1 2 N N k = 1 [ l ( 2 k 1 , 2 k ) + l ( 2 k , 2 k 1 ) ]
where z i , z j from the same cherry image in the upper and lower branches of the output of two mutually positive samples of the vector, z i , z k from different cherry images in the upper and lower branches of the output of two mutually negative samples of the vector, τ denotes the temperature parameter, used to control the sensitivity of the loss to negative samples. The smaller the τ in Equation (1), the greater the similarity of the negative samples will be given a larger penalty to enhance the sensitivity. the larger the τ , the smaller the similarity of the negative samples will be given a smaller penalty to reduce the sensitivity. In this paper, the value of τ is taken as the optimal parameter according to the selection of cherry sample detection task. By Equation (1) in the sample pairs obtained loss l, in Equation (2) take the average loss of L when the Batch size is N.

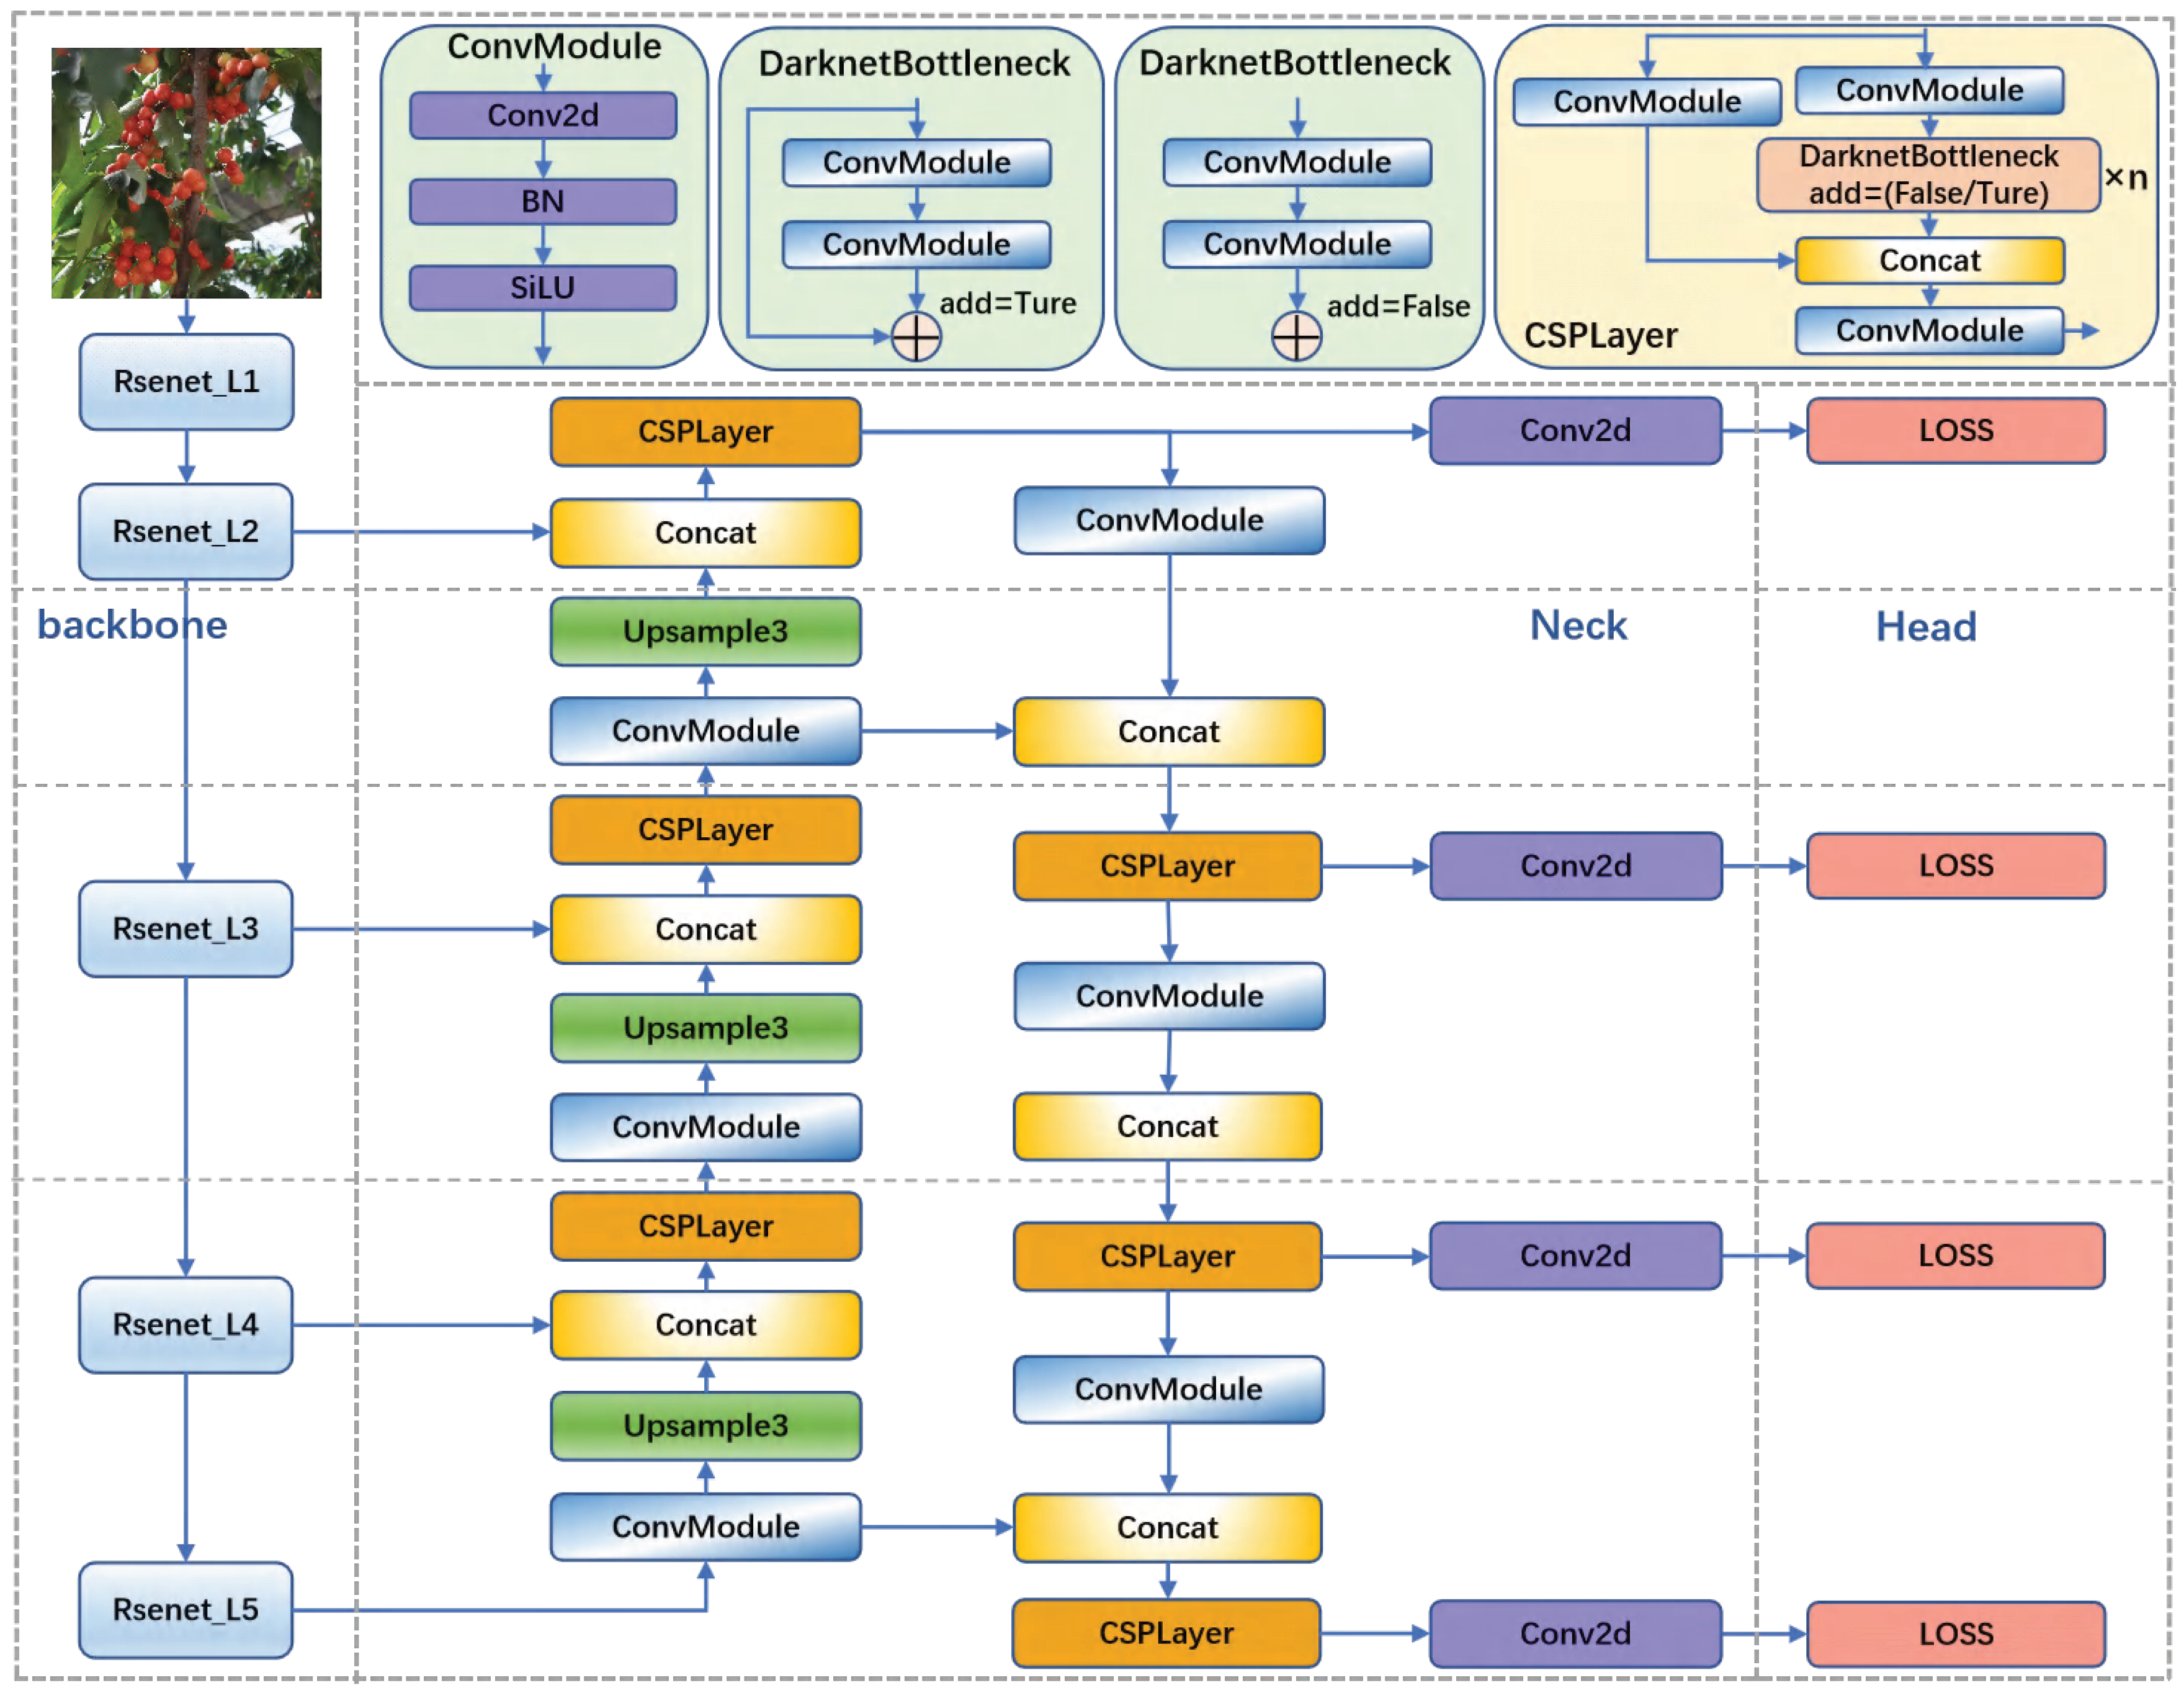
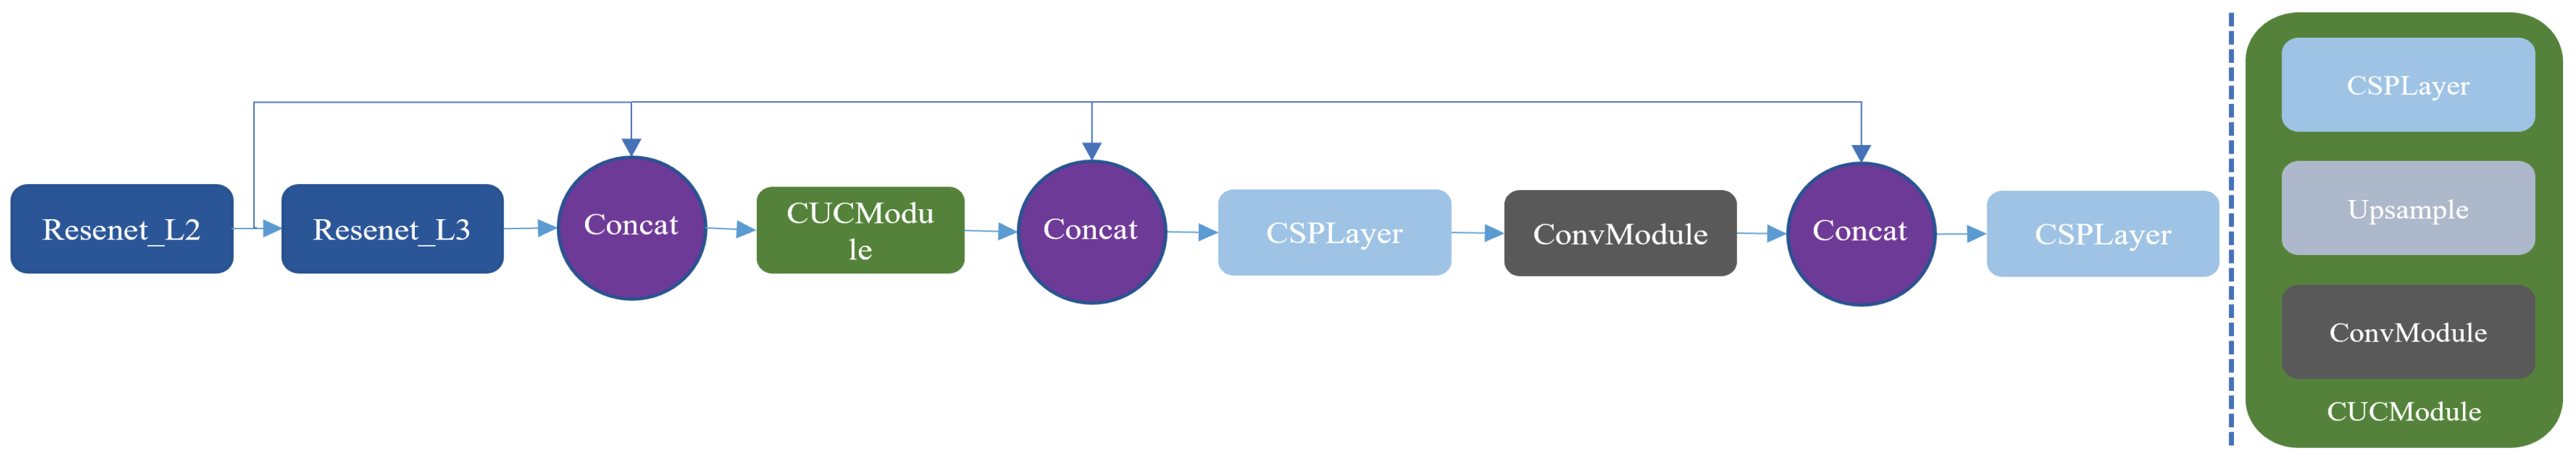
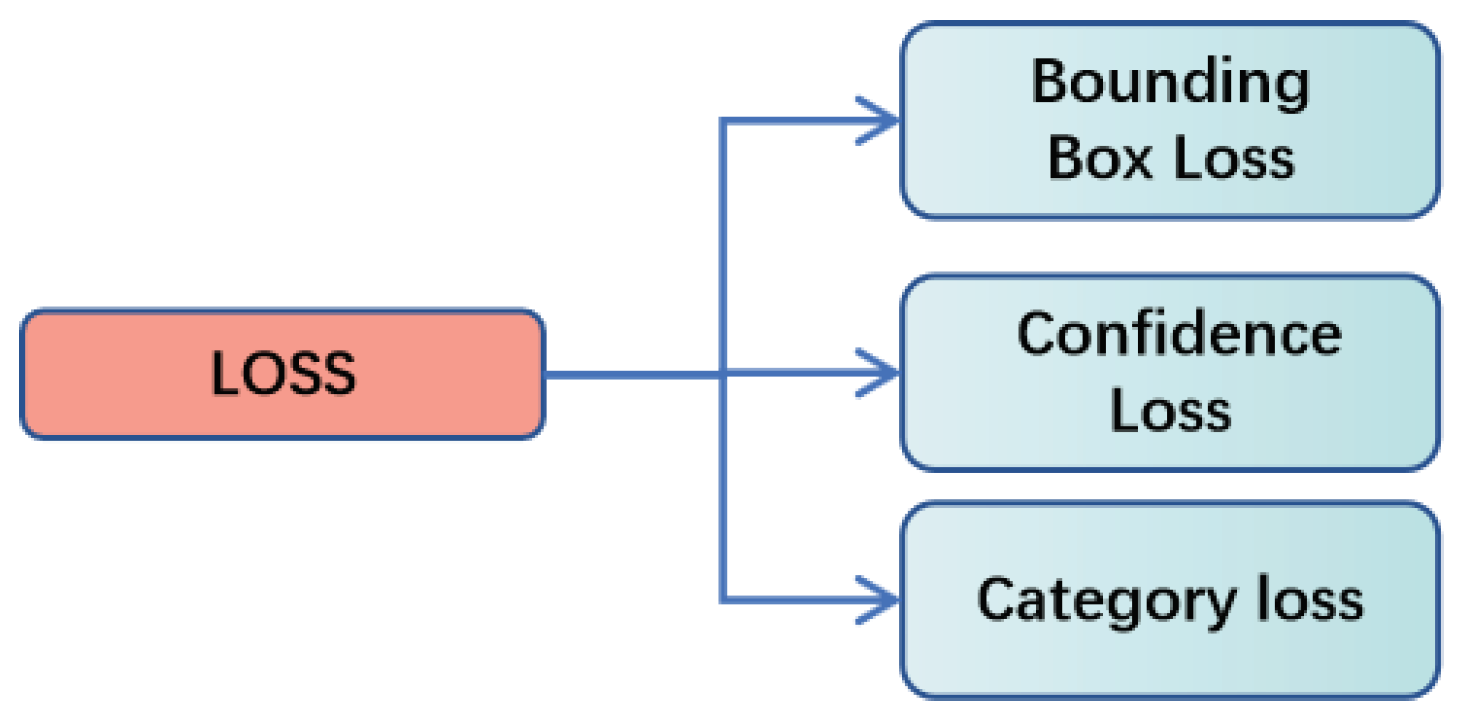
2.2.2. Object Detection Module

Since most of the cherry image instance pixels belong to the small target category, to improve the maturity detection performance. In this paper, the YOLOv5 network framework is selected to design YOLOv5-ST (You Only Look Once version 5—Small Target) small object detection module. The module mainly consists of Backbone, Neck, and Head; the general structure is shown in Figure 4.
In order to enhance the consistency between the extraction of target feature in-formation and self-supervised migration, Resnet59 is used as the Backbone of the detection network, a 9-layer residual network is added to improve the deeper feature ex-traction, and a multi-scale feature fusion network is established. The Neck layer follows the idea of the network structure of FPN [22] + PAN [23], and a 4-fold down-sampling feature fusion network is designed to fuse the rich location information of the shallow feature map with the rich semantic information of the deep feature map. Improve the feature extraction ability of the algorithm and enhance the sensitivity of small target information.
In order to enrich the feature information of the shallow convolutional network and enhance the feature extraction of small targets, a shallow feature fusion network is designed. Concat and Upsample are spliced and upsampled, as shown in Figure 5.
Head uses four scale feature maps for prediction (assuming that the input is 1280 × 1280, and the feature map scales are: 160 × 160, 80 × 80, 40 × 40, 20 × 20). The loss function Loss in the Head is also an essential structure for the whole network prediction, mainly composed of Bounding Box Loss, Confidence Loss, and Category Loss, as shown in Figure 6. The Bounding Box Loss formula is expressed as:
L o s s = L C I o U + L c o n f + L c l a s s ,
L C I o U = 1 I O U + ( ρ 2 ( b , b g t ) c 2 + γ v ) ,
I O U = ( a r e a ( P ) a r e a ( G ) ) ( a r e a ( P ) a r e a ( G ) ) ,
v = 4 π 2 ( a r c t a n w g t h g t h g t a r c t a n w h ) 2 .
where P and G are the prediction box and the real box, respectively; IOU is the ratio of P to G; γ is the weight coefficient of the wide-high proportional loss, and the IOU loss; w g t , h g t , w and h are the width and height of the true box and the prediction box respectively; v is the similarity of P and G ratio; ρ 2 ( b , b g t ) denotes the square of the distance between the two center points; b denotes the coordinates of the center point of the prediction frame; b g t denotes the coordinates of the center point of the G; c 2 denotes the square of the diagonal length of the smallest outer rectangle of the two rectangles.
Due to the problem of dense shading of cherry fruits, which is more complicated to handle in the detection stage, in order to make more efficient cherry maturity detection, in this paper, Soft-NMS [24] (Non-maximum suppression) with Gaussian function as the weight is used to reject overlapping prediction frames, as in Equation:
S i = S i e i o u ( M , b i ) 2 σ , b i D
where S i is the score of the current detection frame, D is the set of final detection frames, and M is the highest scoring detection frame.

3. Results

3.1. Experimental Configuration

The self-supervised module used 4300 unlabeled original images for training, while the detection module selected 100 cherry images to be labeled on the Labeling tool and stored in voc format. Due to the criteria of the model evaluation metrics and convert them to coco format dataset.
To make the model optimal, a series of hyperparameters were therefore adjusted. For the self-supervised module, the layer-wise adaptive scaling optimizer Layer-wise Adaptive Rate Scaling (L.A.R.S) was used in this study, along with the cosine annealing learning rate (C.A.L.R), setting the initial learning rate to 0.6, τ is set to 0.1, and the batch size to 92. For the object detection module, the Adam function and SGD function to optimize the learning strategy, in addition to using the K-means clustering method to perform cluster analysis on the homemade coco dataset to obtain a prior bounding box more suitable for cherry image instances (Table 1), where the feature layer step sizes are 8, 16, 32, and 64.

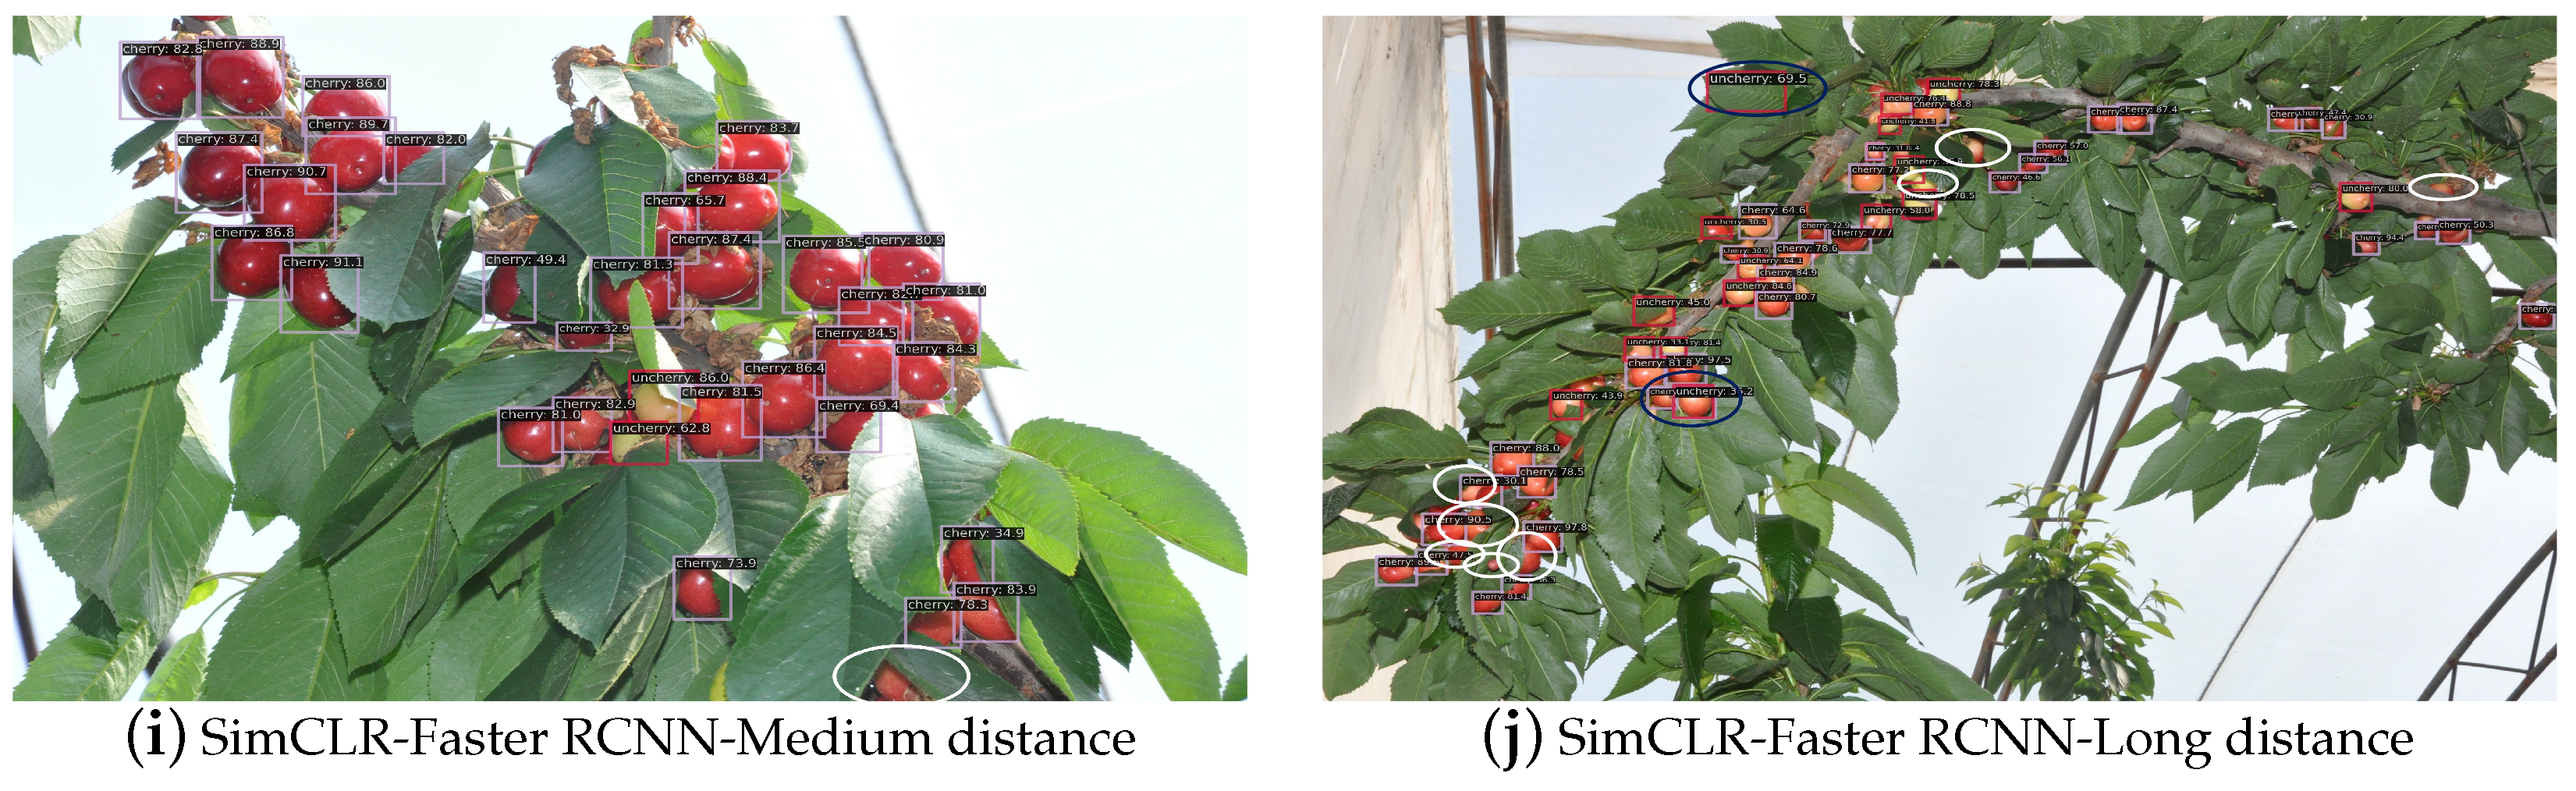
3.2. Compare to Baseline Method

In order to verify the performance of cherry maturity detection in this study, the proposed model SSMDA is compared with the supervised models, which include the single-stage object detection algorithms YOLOv5s and YOLOv4, and the two-stage detection model Faster RCNN. To demonstrate the effectiveness of the self-supervised module, the backbone weights obtained from SimCLR pre-training were migrated to Faster RCNN for contrastive. Both the self-supervised module uses 4300 randomly selected cherry images, and the detection module uses 100 labeled images and classifies cherries into two categories, mature and immature, with two labels: cherry (mature) and uncherry (immature). The mAP and m A P 50 serve as metrics for evaluating object detection algorithms with comprehensive assessments, a focus on localization accuracy, wide adoption in the research community, and flexibility in terms of customization. These metrics provide a robust and standardized method for evaluating and comparing different object detection algorithms, making them a suitable choice for assessing the performance of maturity detection algorithms. Therefore, mAP, as well as mAP50, are used as evaluation criteria, with the relevant equations:
A P = n ( r n + 1 r n ) P i n t e r p ( r n + 1 ) ,
m A P = k i = 1 A P I k .
where m A P : average AP, calculated when the IOU value is taken from 0.5 to 0.95 in steps of 0.05; m A P 50 : calculated when the IOU is taken to 0.5: Data_time: the time to process the image data for each epoch. When the training process of each model reaches stability, the corresponding detection accuracy is recorded, as shown in Table 2.
As shown by Table 2, the model algorithm proposed in this study has the highest mAP value among the six network models. The data processing speed of this model is faster than the efficient YOLOv4 and Faster RCNN networks. Although the data processing speed is slightly lower than the original YOLOv5s network, it can meet the requirements of cherry maturity identification.
In order to show the detection performance of the model more clearly, this study selected the middle and long-distance pictures which are difficult to detect in the near, middle, and far distances in the complex background environment for detection and comparison. As shown in Figure 7, this study proposes that the cherry maturity detection algorithm SSMDA has the highest recognition efficiency, with only a few missed detections. At medium and long distances, SSMDA, YOLOv4, YOLOv5s, and SimCLR-Faster RCNN, Faster RCNN networks (marked with white ellipses in Figure 7) were not successfully identified. In addition to the model algorithm proposed in this study, other networks also have false detection and overlapping boxes (marked with a blue oval in Figure 7).
As shown by the comparison results in Table 2 and Figure 7, the model SSMDA proposed in this study is in the optimal detection performance at both medium and long distances. Among them, the Faster RCNN model is larger and has better detection performance than YOLO v4, and YOLOv5s at medium distances, but is relatively poor at long distances. In the middle and long-distance cherry maturity detection, by comparing Figure 7g with Figure 7i, Figure 7h with Figure 7j, it can be seen that the self-supervised detection method is better under limited labeled data.

3.3. Ablation Experiment

3.3.1. Object Detection Module Ablation Experiment

This paper conducted five ablation experiments on the homemade cherry dataset using YOLOv5 as the baseline module to verify the effects of Soft-NMS, shallow feature fusion network, Resnet59, and K-means clustering, respectively, and the results are shown in Table 3. The baseline method YOLOv5 has a m A P 50 of 91.1% in the homemade cherry dataset. After introducing Soft-NMS to eliminate overlapping prediction bounding box effectively, the m A P 50 increased from 91.1% to 91.3%. With the introduction of the Soft-NMS module, m A P 50 rose from 91.3% to 92.2% when only the shallow feature fusion network was added. When only the Resnet59 backbone network was replaced by the detection module after introducing the Soft-NMS module, m A P 50 increased from 91.3% to 92.6%. With the introduction of the Soft-NMS module, the m A P 50 rises from 91.3% to 93.2% when Resnet59 is used as the backbone network while fusing the shallow feature network. Finally, with the introduction of the Soft-NMS module, the replacement of the backbone network, and the addition of the shallow feature fusion network, the m A P 50 rises from 93.2% to 93.7% using the K-means clustering prior frame. This shows that each module carries a gain in performance.

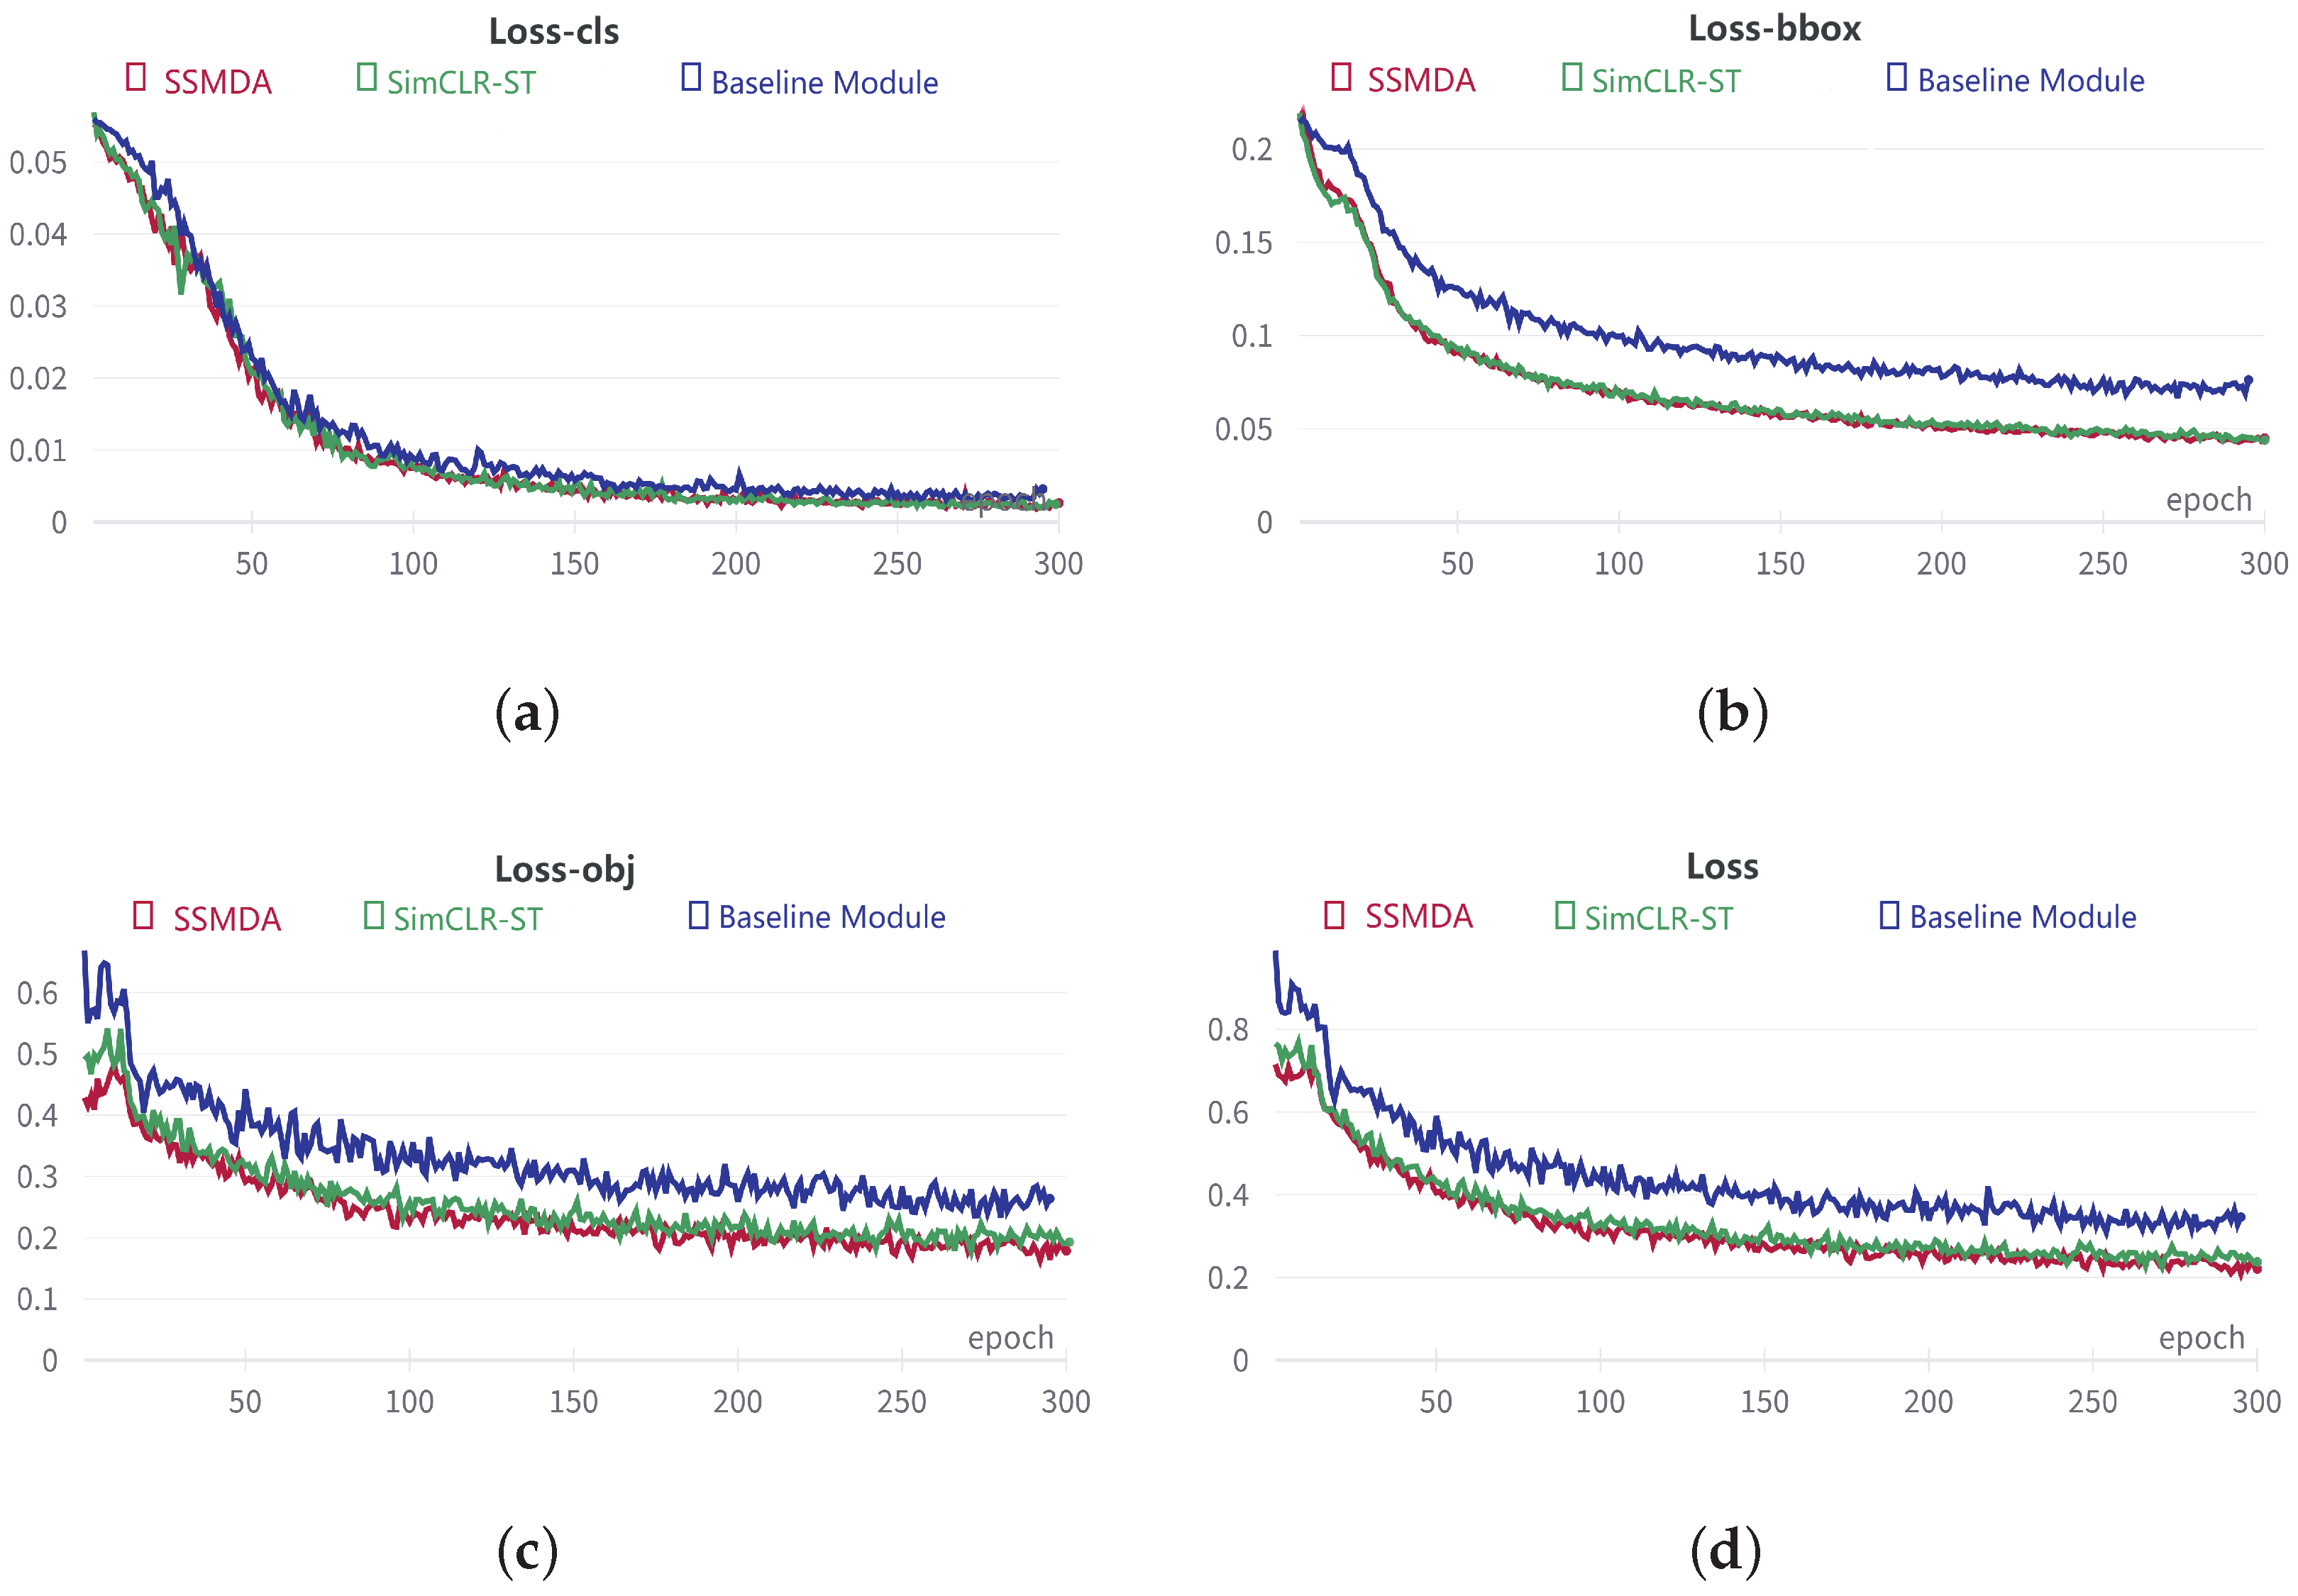
3.3.2. Self-Supervised Module Ablation Experiment

To verify the effectiveness of the multi-feature contrastive self-supervised module, this ablation experiment was done with YOLOv5-ST as the baseline module, and three sets of ablation experiments were done by contrastive loss functions using the homemade cherry dataset. The backbone weights of SimCLR pre-training are migrated to the baseline module called SimCLR-ST(SimCLR-Small Target). This experiment is trained under the same environment and parameters, and the loss curve of the model algorithm after training is shown in Figure 7.
Table 4 shows that SimCLR-ST with migrated SimCLR pre-trained backbone weights is 0.0919 lower than Baseline Module in Loss, and 0.0018, 0.0296 and 0.0576 lower in Loss-cls, Loss-bbox, and Loss-obj, respectively. The SSMDA algorithm obtained by migrating the self-supervised detection module designed in this paper to SimCLR-ST is 0.137 lower than the baseline module in Loss, and 0.0019, 0.0312 and 0.1063 lower in Loss-cls, Loss-bbox, and Loss-obj, respectively. As shown in Table 4 and Figure 8, the self-supervised module loss function of multi-feature contrastive learning proposed in this paper decreases faster. Therefore, the validity of the module proposed by SSMDA is verified.

4. Discussion

4.1. Impact of Weight Loading Selection

When the entire network model structure was designed, test training was performed for loading self-supervised pre-training weights alone and loading YOLOv5 weights with self-supervised pre-training weights at the same time [28]. From the results, there is no significant difference in their cherry maturity detection performance as well as accuracy. One possible reason is that most of the representational learning ability of the whole network is determined by the backbone network, and the two pre-training weights have the effect of covering.

4.2. Defects of SSMDA

During the experimental process, this algorithm exhibited a small amount of missed detections, primarily attributed to severe occlusion of cherry fruits by leaves and tree branches. Based on current research analysis, there may be two contributing factors. Firstly, during the self-supervised training phase, there may not have been sufficient occluded negative samples to support the model, resulting in severe occluded fruit contours and pixel information being mistakenly recognized as background information. Secondly, the highly unstable image resolution due to data collection using basic camera equipment for video cropping could also be a contributing factor. In the future, it is recommended to focus on designing features for occluded targets, constructing images of severely occluded fruit as negative samples, improving the structural framework of the self-supervised module and its alignment with the detection module, and assembling higher-resolution image collectors.

5. Conclusions

The limited number of labeled images limits the generalization ability of dense small object detection networks in complex environments. This study continues the self-supervised idea based on contrastive learning and proposes a self-supervised detection algorithm based on multi-feature contrastive learning. The algorithm includes a multi-feature contrastive self-supervised module and object detection module. The multi-feature contrastive self-supervised module performs multi-feature semantic contrastive learning on unlabeled fruit images to reduce the interference of complex backgrounds and the limitations of cost data. The object detection module designs a small-scale feature learning network for fruit examples, improving small sample fruits’ detection performance.Finally, the pre-trained backbone weights from the self-supervised module were transferred to the object detection module to construct the fruit maturity detection algorithm. Large-scale experiments on a homemade cherry dataset verified the algorithm’s effectiveness.
This research demonstrates that the self-supervised learning method is particularly valuable in cases where insufficient samples exist due to cost.

Author Contributions

Conceptualization, R.-L.G.; methodology, R.-L.G.; software, R.-L.G.; validation, P.-F.W. and K.W.; formal analysis, K.W.; investigation, P.-F.W.; resources, R.-L.G.; data curation, K.W.; writing—original draft preparation, K.W.; writing—review and editing, R.-L.G.; visualization, K.W.; supervision, R.-L.G.; project administration, R.-L.G.; funding acquisition, R.-L.G. All authors have read and agreed to the published version of the manuscript.

Funding

This work was supported by the Dalian Science and Technology Innovation Fund: Research on Dynamic Feature Extraction and Modeling of Sweet cherry Growth in Solar greenhouse Based on Intelligent Internet of Things, No.2020JJ26SN058.

Institutional Review Board Statement

Not applicable.

Data Availability Statement

Data available on request due to privacy.

Acknowledgments

We also would like to thank “Dalian AI Computing Center” and “Dalian AI Ecosystem Innovation Center” for providing inclusive computing power and technical support.

Conflicts of Interest

The authors declare no conflict of interest.

References

  1. Zhou, P.; Pei, Y.; Wei, R.; Zhang, Y.; Gu, Y. Real-time detection of orchard cherry based on YOLOV4 model. Acta Agric. Zhejiangensis 2022, 34, 2522. [Google Scholar]
  2. Zhou, Z.; Guo, Y.; Dai, M.; Huang, J.; Li, X. Weakly supervised salient object detection via double object proposals guidance. IET Image Process. 2021, 15, 1957–1970. [Google Scholar] [CrossRef]
  3. Sparrow, R.; Howard, M. Robots in agriculture: Prospects, impacts, ethics, and policy. Precis. Agric. 2021, 22, 818–833. [Google Scholar] [CrossRef]
  4. Parvathi, S. Detection of maturity stages of coconuts in complex background using Faster R-CNN model. Biosyst. Eng. 2021, 202, 119–132. [Google Scholar] [CrossRef]
  5. Gao, F.; Fu, L.; Zhang, X.; Majeed, Y.; Li, R.; Karkee, M.; Zhang, Q. Multi-class fruit-on-plant detection for apple in SNAP system using Faster R-CNN. Comput. Electron. Agric. 2020, 176, 105634. [Google Scholar] [CrossRef]
  6. Wang, Y.; Yan, G.; Meng, Q.; Yao, T.; Han, J.; Zhang, B. DSE-YOLO: Detail semantics enhancement YOLO for multi-stage strawberry detection. Comput. Electron. Agric. 2022, 198, 107057. [Google Scholar] [CrossRef]
  7. Fan, J.; Zhang, J.; Tao, D. Sir: Self-supervised image rectification via seeing the same scene from multiple different lenses. IEEE Trans. Image Process. 2023, 32, 865–877. [Google Scholar] [CrossRef] [PubMed]
  8. Zheng, R.; Zhong, Y.; Yan, S.; Sun, H.; Shen, H.; Huang, K. MsVRL: Self-Supervised Multiscale Visual Representation Learning via Cross-Level Consistency for Medical Image Segmentation. IEEE Trans. Med. Imaging 2022, 42, 91–102. [Google Scholar] [CrossRef] [PubMed]
  9. He, K.; Fan, H.; Wu, Y.; Xie, S.; Girshick, R. Momentum contrast for unsupervised visual representation learning. In Proceedings of the 2020 IEEE/CVF Conference on Computer Vision and Pattern Recognition (CVPR), Seattle, WA, USA, 13–19 June 2020; pp. 9729–9738. [Google Scholar]
  10. Chen, T.; Kornblith, S.; Norouzi, M.; Hinton, G. A simple framework for contrastive learning of visual representations. In Proceedings of the International Conference on Machine Learning, Virtual, 13–18 July 2020; pp. 1597–1607. [Google Scholar]
  11. Grill, J.B.; Strub, F.; Altché, F.; Tallec, C.; Richemond, P.; Buchatskaya, E.; Doersch, C.; Avila Pires, B.; Guo, Z.; Gheshlaghi Azar, M.; et al. Bootstrap your own latent-a new approach to self-supervised learning. Adv. Neural Inf. Process. Syst. 2020, 33, 21271–21284. [Google Scholar]
  12. Chen, X.; Fan, H.; Girshick, R.; He, K. Improved baselines with momentum contrastive learning. arXiv 2020, arXiv:2003.04297. [Google Scholar]
  13. Chen, X.; He, K. Exploring simple siamese representation learning. In Proceedings of the IEEE/CVF Conference on Computer Vision and Pattern Recognition, Virtual, 19–25 June 2021; pp. 15750–15758. [Google Scholar]
  14. Wang, S.; Wang, Z.; Che, W.; Zhao, S.; Liu, T. Combining Self-supervised Learning and Active Learning for Disfluency Detection. Trans. Asian-Low-Resour. Lang. Inf. Process. 2021, 21, 1–25. [Google Scholar] [CrossRef]
  15. Jian, L.; Pu, Z.; Zhu, L.; Yao, T.; Liang, X. SS R-CNN: Self-Supervised Learning Improving Mask R-CNN for Ship Detection in Remote Sensing Images. Remote Sens. 2022, 14, 4383. [Google Scholar] [CrossRef]
  16. Zhang, Q.; Zhang, Y.M.; Li, X.L.; Song, R.; Zhang, W. Maritime Object Detection Method Based on Self-Supervised Representation Learning. J. Underw. Unmanned Syst. 2020, 28. [Google Scholar]
  17. Cai, R.J.; Jiang, W.X.; Qi, L.Z.; Sun, Y.Q. Object Detection in Disinfection Scenes Based on Self-supervised Learning and SimDet Model under Condition of Few Samples. Comput. Syst. Appl. 2022, 31, 51–58. [Google Scholar]
  18. Wu, J.; Zhang, S.; Zou, T.; Dong, L.; Peng, Z.; Wang, H. A Dense Litchi Target Recognition Algorithm for Large Scenes. Math. Probl. Eng. 2022, 2022, 4648105. [Google Scholar] [CrossRef]
  19. Sun, M.; Xu, L.; Chen, X.; Ji, Z.; Zheng, Y.; Jia, W. Bfp net: Balanced feature pyramid network for small apple detection in complex orchard environment. Plant Phenomics 2022, 2022, 9892464. [Google Scholar] [CrossRef] [PubMed]
  20. Xu, Z.F.; Jia, R.S.; Liu, Y.B.; Zhao, C.Y.; Sun, H.M. Fast method of detecting tomatoes in a complex scene for picking robots. IEEE Access 2020, 8, 55289–55299. [Google Scholar] [CrossRef]
  21. He, K.; Zhang, X.; Ren, S.; Sun, J. Deep residual learning for image recognition. In Proceedings of the 2016 IEEE Conference on Computer Vision and Pattern Recognition (CVPR), Las Vegas, NV, USA, 27–30 June 2016; pp. 770–778. [Google Scholar]
  22. Lin, T.Y.; Dollár, P.; Girshick, R.; He, K.; Hariharan, B.; Belongie, S. Feature pyramid networks for object detection. In Proceedings of the 2017 IEEE Conference on Computer Vision and Pattern Recognition (CVPR), Honolulu, HI, USA, 21–26 July 2017; pp. 2117–2125. [Google Scholar]
  23. Liu, S.; Qi, L.; Qin, H.; Shi, J.; Jia, J. Path aggregation network for instance segmentation. In Proceedings of the 2018 IEEE/CVF Conference on Computer Vision and Pattern Recognition, Salt Lake City, UT, USA, 18–22 June 2018; pp. 8759–8768. [Google Scholar]
  24. Bodla, N.; Singh, B.; Chellappa, R.; Davis, L.S. Soft-NMS–improving object detection with one line of code. In Proceedings of the 2017 IEEE International Conference on Computer Vision, Venice, Italy, 22–29 October 2017; pp. 5561–5569. [Google Scholar]
  25. Gai, R.; Li, M.; Wang, Z.; Hu, L.; Li, X. YOLOv5s-Cherry: Cherry Target Detection in Dense Scenes Based on Improved YOLOv5s Algorithm. J. Circuits Syst. Comput. 2023, 2350206. [Google Scholar] [CrossRef]
  26. Gai, R.; Chen, N.; Yuan, H. A detection algorithm for cherry fruits based on the improved YOLO-v4 model. Neural Comput. Appl. 2021, 1–12. [Google Scholar] [CrossRef]
  27. Ren, S.; He, K.; Girshick, R.; Sun, J. Faster r-cnn: Towards real-time object detection with region proposal networks. In Proceedings of the Advances in Neural Information Processing Systems 28 (NIPS 2015), Montreal, QC, Canada, 11–12 December 2015; Volume 28. [Google Scholar]
  28. Jiang, B.; Wu, Q.; Yin, X.; Wu, D.; Song, H.; He, D. FLYOLOv3 deep learning for key parts of dairy cow body detection. Comput. Electron. Agric. 2019, 166, 104982. [Google Scholar] [CrossRef]
Figure 1. Cherry dataset. (a) Medium distance cherry data image. (b) Long distance cherry image. (c) Close distance cherry image.
Agriculture 13 00939 g001
Figure 2. SSMDA structure diagram. (a) Structure of multi-feature contrastive self-supervised module. (b) Structure of object detection module. (c) Structure of 59 network.
Agriculture 13 00939 g002
Figure 3. Data Augmentation structure diagram. RandomResizeCrop randomly crops the image; RandomFlip randomly flips the image, ColorJitter randomly adjusts the brightness, contrast, saturation and hue of the image; RandomGrayscale performs probabilistic grayscale conversion of the image; RandomGaussianBlur performs random Gaussian filter smoothing of the image; RandomSolarize randomly exposes the image.
Agriculture 13 00939 g003
Figure 4. YOLOv5-ST module structure. where Resnet_L1–Resnet_L5 are the five network modules of Resnet59; ⊕ is the element-by-element summation operation; ConvModule is the convolution module, consisting of Conv2d, Batch Normalization, and SilU activation functions; Upsample is the upsampling module; Concat is the feature fusion module.
Agriculture 13 00939 g004
Figure 5. Shallow feature fusion network diagram.
Agriculture 13 00939 g005
Figure 6. Object detection module Loss structure diagram.
Agriculture 13 00939 g006
Figure 7. Contrastive of model algorithms for medium and long distance cherry maturity detection. Figures (a), Figure (c), Figure (e), Figure (g), and Figure (i) are the maturity detection results of SSMDA, YOLOv5s, YOLOv4, Faster RCNN, and SimCLR-Faster RCNN on medium distance cherry images, respectively. Figures (b), Figure (d), Figure (f), Figure (h), and Figure (j) are the maturity detection results of SSMDA, YOLOv5s, YOLOv4, Faster RCNN, and SimCLR-Faster RCNN on long-distance cherry images, respectively.The white ellipse in the figure marks the missed detection, and the blue ellipse marks the false detection and overlapping boxes.
Agriculture 13 00939 g007aAgriculture 13 00939 g007b
Figure 8. Training contrast loss curve. (a) Is the loss curve of obj (confidence prediction). (b) Is the loss curve of bbox (rectangular box regression prediction). (c) Is the loss curve of cls (classification prediction). (d) Consists of (ac).
Agriculture 13 00939 g008
Table 1. Before and after comparison table of the cell a priori bounding box for different size feature maps.
Cell SizePrior Bounding Box Size (Original)Prior Bounding Box Size (k-Means)
20 × 20(116,90), (156,198), (373,326)(496,478), (616,627), (723,753)
40 × 40(30,61), (62,45), (59,119)(259,264), (334,328), (408,400)
80 × 80(10,13), (16,30), (33,23)(129,129), (204,153), (191,198)
160 × 160(10,10), (45,45), (87,81)
Table 2. Contrastive of Baseline methods.
ModelmAPmAP50Data_Time (Data/Epoch)Size of ModelReference
SSMDA64.4%95.0%0.018 s89 MB
YOLOv5s62.1%91.1%0.012 s13 MB[25]
YOLOv460.3%85.4%0.022 s244 MB[26]
Faster RCNN58.9%84.7%0.034 s326 MB[27]
SimCLR-Faster RCNN60.7%92.1%0.034 s328 MB
Table 3. Object detection module ablation experiment.
 Soft-NMSShallow Feature
Fusion Network
Replace
Resnet59
K-Means mAP 50
Baseline Module 91.1%
Baseline Module+ 91.3%
92.2%
92.6%
93.2%
93.7%
Table 4. Contrastive loss record table of training before and after improvement.
LossLoss-clsLoss-bboxLoss-obj
Baseline Module0.34720.00400.07520.2711
SimCLR-ST0.25530.00220.04560.2135
SSMDA0.21020.00210.04400.1648
Disclaimer/Publisher’s Note: The statements, opinions and data contained in all publications are solely those of the individual author(s) and contributor(s) and not of MDPI and/or the editor(s). MDPI and/or the editor(s) disclaim responsibility for any injury to people or property resulting from any ideas, methods, instructions or products referred to in the content.

