Article

Early Warning of Poverty Returning against the Background of Rural Revitalization: A Case Study of Two Counties in Guangxi Province, China

Research Institute of Forestry Policy and Information, Chinese Academy of Forestry, Beijing 100091, China
*
Author to whom correspondence should be addressed.
Agriculture 2023, 13(5), 1087; https://doi.org/10.3390/agriculture13051087
Submission received: 20 April 2023 / Revised: 17 May 2023 / Accepted: 18 May 2023 / Published: 19 May 2023
(This article belongs to the Section Agricultural Economics, Policies and Rural Management)

Abstract

:
China has achieved the goal of building a moderately prosperous society in a well-rounded way by 2020. At this stage, effectively dealing with poverty and not returning to it has become the bottom-line task of rural revitalization. The purpose of this study is to construct a poverty-return early warning and evaluation system for X and Y counties in Guangxi. Based on the field survey data of 150 households from the questionnaire survey in X County and Y County of Guangxi Province, an early warning evaluation system for returning to poverty in the two counties of Guangxi Province is constructed. The AHP analytic hierarchy process is used to evaluate the early warning of returning to poverty for farmers. The BP neural network algorithm is used to verify the rationality of the method; the overall poverty relief situation in the two counties is stable and the living conditions are good. The early warning results are as follows: One household in X County has a severe early warning, six households have a slight early warning, and sixty-four households have no early warning; in Y County, six households had severe early warning, six households had mild early warning, and sixty-seven households had no early warning. For farmers, serious early warnings are mainly caused by the lack of labor force and low annual per capita net income, as well as the lack of the main means of livelihood and capacity. The characteristics of mild early warnings for farmers are mainly that the proportion of non-labor income is relatively high, and the farmers lack the ability and way of long-term development. Different suggestions are put forward for farmers with different early-warning levels, focusing on improving their viability and development ability.

1. Introduction

Poverty reduction is a common international mission. In recent years, there has been worldwide discussion on the issue of poverty in developing countries. In 2011, the United Nations proposed integrating tourism as a means of poverty reduction development, which plays a positive role in reducing poverty in most dimensions [1]. In 2019, research also analyzed the key factors of poverty alleviation in India, and sorted out the methodology for designing, managing, and implementing poverty alleviation programs [2]. In 2020, China successfully completed the task of poverty alleviation, and achieved the goal of building a moderately prosperous society in all respects. China’s task in the new period is to promote the effective connection between consolidating and expanding the achievements of poverty alleviation and rural revitalization [3]. The development of existing poverty alleviation achievements is an important basis for the implementation of the rural revitalization strategy. Developing the existing poverty alleviation achievements and establishing the monitoring and assistance mechanism rapidly, which prevents poverty returning, are important foundations for the implementation of China’s rural revitalization strategy. As an important method to maintain the stability of poverty alleviation, long-term monitoring of farmers can not only predict the risk of returning to poverty of marginal poor people, but also reduce the incidence of returning to poverty. In terms of the relationship between the rural revitalization strategy and the consolidation of the achievements in poverty alleviation, both of these factors are aimed at achieving the overall revitalization of rural areas and the overall well-being of the poor [4]. They are targeted to identify and eliminate the factors that signify the risk of returning to poverty. Therefore, it is important to resolve the conflicts between consolidating poverty reduction achievements and the threat of returning to poverty, and promote a smooth transition to the primary stage of rural revitalization. These factors are of great strategic significance for the deep and efficient governance of poverty reduction, the modernization of agriculture and rural areas, and the comprehensive revitalization of rural areas. How to establish a poverty-return early warning and evaluation system for X and Y counties in Guangxi Province? How to define early warning standards for returning to poverty? How to determine the degree of early warning for farmers returning to poverty? Answering these questions is of great significance for China to achieve long-term stable poverty alleviation and overall rural revitalization, as well as for the development of poverty reduction worldwide.
In previous studies, income or consumption was often taken as the standard to define poverty, and poverty was defined if these values were lower than the specified standard income line [5]. With the continuous development of research in this field, more influencing factors are considered in the judgment of poverty. Some scholars put forward the “functional poverty theory”, “capacity poverty theory”, etc., believing that poverty should include deprivation of basic viability (freedom from hunger, disease, education) in addition to low income [6,7]. Recently, for the research on the causes of poverty, scholars have explored the causes of poverty from more perspectives. Culture plays a more and more important role in reducing poverty. The lack of cultural atmosphere is believed to lead to the formation of poverty-prone thinking patterns and behavior patterns of the poor, which is also the reason for intergenerational transmission of poverty [8]. In addition, human and intellectual capital are regarded as the dynamic factors to change the poverty situation. The increase in human capital leads to the increase in poverty reduction opportunities. Furthermore, the increase in intellectual capital leads to the enhancement of development capacity, facilitation the achievement of a long-term and stable state of poverty alleviation [9].
There are two main types of research of poverty returning. One is the identification and assessment of the risk of returning to poverty so as to understand the source of the risk. The other is the discussion of the governance of returning to poverty, which helps to establish early warning and long-term blocking mechanisms. In the research on the risk of returning to poverty of China’s rural population, scholars often calculate the livelihood capital of a regional group and draw different conclusions. For example, taking a village in Hubei Province of China as an example, the risk of returning to poverty is identified by calculating the livelihood capital of poverty-free farmers, and it is concluded that the village mainly faces financial capital and human capital risks [10]. In addition, the assessment of the risk of returning to poverty of the out-of-poverty households in the southwest ethnic areas of China shows that the risk of returning to poverty is mainly concentrated in human risk and financial risk, which is a highly complex form with a certain degree of natural, material and social risks [11]. It is generally believed that the governance of returning to poverty is important for increasing income and promoting economic growth. The “poverty alleviation” policy alone without good governance performance is not enough to promote poverty reduction equally [12]. The key to governance of returning to poverty is previous prevention. In order to strengthen the monitoring of the risk of returning to poverty, the endogenous driving force for poverty alleviation, the endowment of livelihood resources and the impact of external disasters should be taken as the main monitoring dimensions [13]. In the research on the construction of the mechanism to stop the return to poverty, Chinese scholars generally believe that the policies and material capital should be integrated to achieve the optimization and integration of systems, resources, talents and organizations, which is in line with China’s national conditions and can also improve the governance performance of the return to poverty [14,15,16]. In 2020, China entered a new period of consolidating poverty alleviation and linking up with rural revitalization. In view of the change of its goals, poverty return monitoring has become more and more important. Establishing a poverty-return early warning evaluation index system and conducting poverty-return early warning evaluation on farmers is of great significance for rural revitalization. The goal of this study is to establish an early warning and evaluation system for returning to poverty in two counties in Guangxi Province. The study area was visited and surveyed, data were collected, and warning intervals were divided using the Analytic Hierarchy Process. The scores of farmers were calculated, and the warning levels of farmers were classified. The effectiveness of the results was verified using the BP neural network algorithm.

2. Materials and Methods

2.1. Study Area

The Guangxi Zhuang Autonomous Region, also known as Guangxi Province, is located in South China, covering an area of 237,600 square kilometers. Guangxi Province is mainly covered with mountains, hills, platforms, plains and other types of landforms. The central and southern parts are mostly hilly and flat in the form of basins. Plains and platforms account for 23.4% of the land area of the province. There are twelve ethnic groups, including Zhuang and Han, among which the Zhuang group accounts for 31.4% of the permanent population in the region. Guangxi was one of the main battlefields for China to fight against poverty before 2020. In 1978, the number of rural poor people in Guangxi once reached 21 million, and the incidence of poverty in the region was as high as 70%. Since the implementation of targeted poverty alleviation, a total of 6.34 million poor people have been identified in Guangxi, and all of them have been registered. According to statistics, the per capita disposable income of rural residents in poor areas in Guangxi reached 13,676 yuan in 2019, an increase of 4209 yuan over 2015, with an average annual growth of 9.63% [17]. As the province with the largest minority population in China, Guangxi aimed to have 54 poverty-stricken counties and 5379 poverty-stricken villages lifted out of poverty by 2020 [18]. As the only coastal minority autonomous region, Guangxi Province has a large number of marginal poor groups, and it faces more difficulties to achieve rural revitalization. The per capita income, climate and education level of X County and Y County before 2020 are shown in Figure 1; both of these counties are considered middle-income counties in China [19]. Therefore, X County and Y County can represent the poverty level of many poor counties, and the research results can be generalized. Therefore, it is of great significance to focus on the situation of farmers returning to poverty in X County and Y County that have been lifted out of poverty for the realization of comprehensive rural revitalization in China.

2.2. Method

2.2.1. Analytic Hierarchy Process (AHP)

The Analytic Hierarchy Process (AHP), first proposed by Professor Staaty of the University of Pittsburgh, an American operations research scientist, refers to the decomposition of multiple objectives or criteria into objectives, criteria, indicator levels and other levels. By comparing the importance of the two indicators one by one and building a matrix of comparative judgment, the qualitative indicators are fuzzily quantified by level to calculate the weight of each indicator [20,21]. The Analytic Hierarchy Process (AHP) is widely used in the research of poverty return, and it is suitable for building the early warning evaluation index system of poverty return [22,23]. There are many influencing factors in the early warning research of poverty return. Through the analytic hierarchy process, multiple influencing factors can be classified into several types of constituent elements, corresponding to the target, criterion and indicator levels, respectively. By comparing the factors in pairs, we can determine the relative importance of each influencing factor in the early warning study of returning to poverty.

2.2.2. BP Neural Network Algorithm

BP is short for Back Propagation. BP network can learn and store a large number of input–output mode mapping relations without revealing the mathematical equations describing the mapping relations in advance. Its learning rule is to use the steepest descent method to continuously adjust the network weight and threshold through backpropagation so as to minimize the total square error of the network [24,25,26]. Its main feature is that the signal is forward propagation, while the error is reverse propagation. Benefiting from this self-learning mechanism, we do not need to assume any paradigm when using neural networks. We just need to reasonably collect some data and then send them to the neural network for training. Sometimes, we may even receive some unexpected performance results. Based on the characteristics of self-learning and high performance of BP neural network, it has been widely used in decision-making, prediction, classification and other subdivision scenarios [27,28,29,30]. The task background of poverty-return early warning to be performed in this paper is very consistent with the field that BP neural network is good at. Therefore, BP neural network and analytic hierarchy process are used to jointly evaluate the poverty-return early warning of two counties in Guangxi Province.

2.3. Early Warning Evaluation Indicator System for Returning to Poverty

China’s standard for poverty alleviation is “two no worries, three guarantees”, that is, the absence of concern about food and drink, education, medical care and housing are guaranteed when poverty is alleviated. By 2020, China aimed to eliminate absolute poverty, as well as quarantee the basic needs of rural residents such as food and clothing, education, medical care and housing. However, in addition to basic security, the strategy of rural revitalization requires meeting the higher expectations of farmers for a better life. Farmers’ expectations for a well-off life are diversified. In addition to being provided with living security, they are eager to rely on their own development ability to achieve self-sufficiency and obtain more satisfactory income and living environment. Therefore, we considered two parts in the evaluation system: livelihood capacity and development capacity. Based on the livelihood capital involved in the sustainable livelihood framework theory and the existing research on the impact factors of poverty-return early warning [31,32,33], nine indicators were selected from the dimensions of natural capital, financial capital, physical capital, human capital, etc., to build the evaluation indicator system for returning to poverty. As shown in Table 1, we take the early warning evaluation of poverty return as objective A, the survival capability and development capability as primary indicators (B1 and B2), and we divided the specific impact factors examined by the evaluation corresponding to B1 and B2 into secondary indicators represented by Cx.
Survival capability mainly examines the influencing factors that guarantee farmers meet their basic livelihood, mainly including annual net income per capita (C11) at the economic level, basic medical coverage (C12), housing security (C13) and forest land area (C14). Per capita income is an important indicator to visualize the characteristics of poverty, and in developed countries, the average or middle income is often simply used as the standard line to consider whether or not a certain group is considered poor [34,35,36]. However, as a developing country, China’s per capita income is already lower than that of developed countries, and the number of the marginally poor is also higher, so it is not suitable to use foreign standards for reference, and the characteristics of returning to poverty are different in each region, so we should refer to the domestic standards for poverty eradication, especially in Guangxi Province. The level of health directly affects individual labor productivity and social labor productivity, and housing security similarly affects basic human labor efficiency [37]. Stability of both can lead to more social opportunities, which is why medical and housing security are mentioned in China’s “three guarantees”. The main source of food for farmers comes from their own cultivated land, so the area of cultivated land is regarded as an important indicator to examine farmers’ ability to survive. However, since the subjects of this study in the two counties are mainly forest farmers, we innovatively replaced “arable land area” with “forest land area” to better apply to the evaluation process of poverty return for this group.
The development capacity takes into account the compulsory education guarantee (C21), the number of people burdened by the labor force per capita (C22), the percentage of non-labor income (C23), the sick and disabled population (C24), and the salary per capita of the labor force (C25). The higher the level of education, the more likely an individual is to enter the upper social class; conversely, the lower the level of education, the more likely an individual is to enter the lower social class or even fall into relative poverty [38]. Compulsory education guarantee has made an important contribution to China’s poverty alleviation efforts. The number of labor burden per capita (C22), the proportion of non-labor income (C23), the sick and disabled population (C24), and the wage per labor force (C25) all affect the labor productivity of farm households and the likelihood of facing greater opportunities in society. These factors determine the level of development capacity of a household in terms of human capital, economic capital, and physical capital.

2.4. Data Collection

From May to July 2021, more than ten investigators were organized to carry out field monitoring and research in X County and Y County of the Guangxi Zhuang Autonomous Region. The research team sampled 71 households and 79 households in X County and Y County of Guangxi Province for field household survey. In order to avoid homogeneity and specificity of the research objects, a random sampling method was adopted, and 8 households were selected from 4 administrative villages in each county for questionnaire research. Afterwards, non-quantifiable fuzzy data and unanswered blank data were removed. The indicators were positively and negatively classified, and the negative indicators were negative. After data cleaning, 19,770 pieces of field verified farmer data were obtained, including the location of the administrative village, the basic information of family members, the name of the head of household, the number of family members and the labor force, the participation in medical insurance, the participation of school-age children in compulsory education, the status of the sick and disabled population, housing, forest land area, annual income and other information. In this paper, the method of combining AHP and the BP neural network algorithm is used to evaluate the poverty early warning situation of X County and Y County in Guangxi Province. After determining the relative weight of indicators through AHP, we used the BP neural network to make simulation prediction to verify the rationality of using this method.
Descriptive statistics were conducted on the collected data (Table 2), and it was found that the mean values of most indicators in X and Y counties did not differ significantly. However, the difference in the values of the number of people born by the labor force per capita was significant, mainly due to the lack of labor force among individual farmers in X County. Standard error is an important indicator of the degree of dispersion in the distribution of data. The larger the value, the more discrete the distribution. The distribution of the values of annual net income per capita and salary per capita of the labor force was relatively discrete, and there were significant differences in income indicators among farmers, while the comprehensive education guarantee value was stable.

3. Results

3.1. Indicator Weight

This paper uses the expert scoring method to assign weight to the influencing factors. The selected experts include professors who have been engaged in poverty research in universities for a long time and village staff who have been engaged in front-line poverty relief work for a long time.
In order to determine the weight of the second-level indicators, namely B1 and B2, this paper selects seven weight combinations for expert scoring, namely (0.8, 0.2), (0.7, 0.3), (0.6, 0.4), (0.5, 0.5), (0.4, 0.6), (0.3, 0.7), (0.2, 0.8) [39,40]. The two figures in brackets represent the weight of livelihood capacity B1 and development capacity B2, respectively. Within the range of 1~5 points, the experts score according to the degree of recognition of each weight combination, and finally obtain the total score of each weight combination. As shown in Table 3, the highest score (0.6, 0.4) is selected as the second-level index weight.
In order to determine the weight of the third-level indicators, it is necessary to build a judgment matrix for the indicators in the evaluation system and compare them in pairs [41]. Survival capability judgment matrix B1 and development capability judgment matrix B2 are as follows:
B 1 = 1 3 2 2 1 / 3 1 1 / 3 1 / 2 1 / 2 3 1 1 / 2 1 / 2 2 2 1   B 2 = 1 3 3 4 2 1 / 3 1 1 / 2 2 2 1 / 3 2 1 3 2 1 / 4 1 / 2 1 / 3 1 1 / 3 1 / 2 1 / 2 1 / 2 3 1 .
Through SPSSAU software (https://spssau.com/index.html, accessed on 20 April 2023), the eigenvector weights of the two matrices can be calculated, and their consistency can be checked. CI is the consistency indicator, CR is the consistency ratio, and CR < 0.10 means that the consistency test has been passed [42]. Finally, both B1 and B2 matrices passed the consistency test, and the results of the two matrices are as follows:
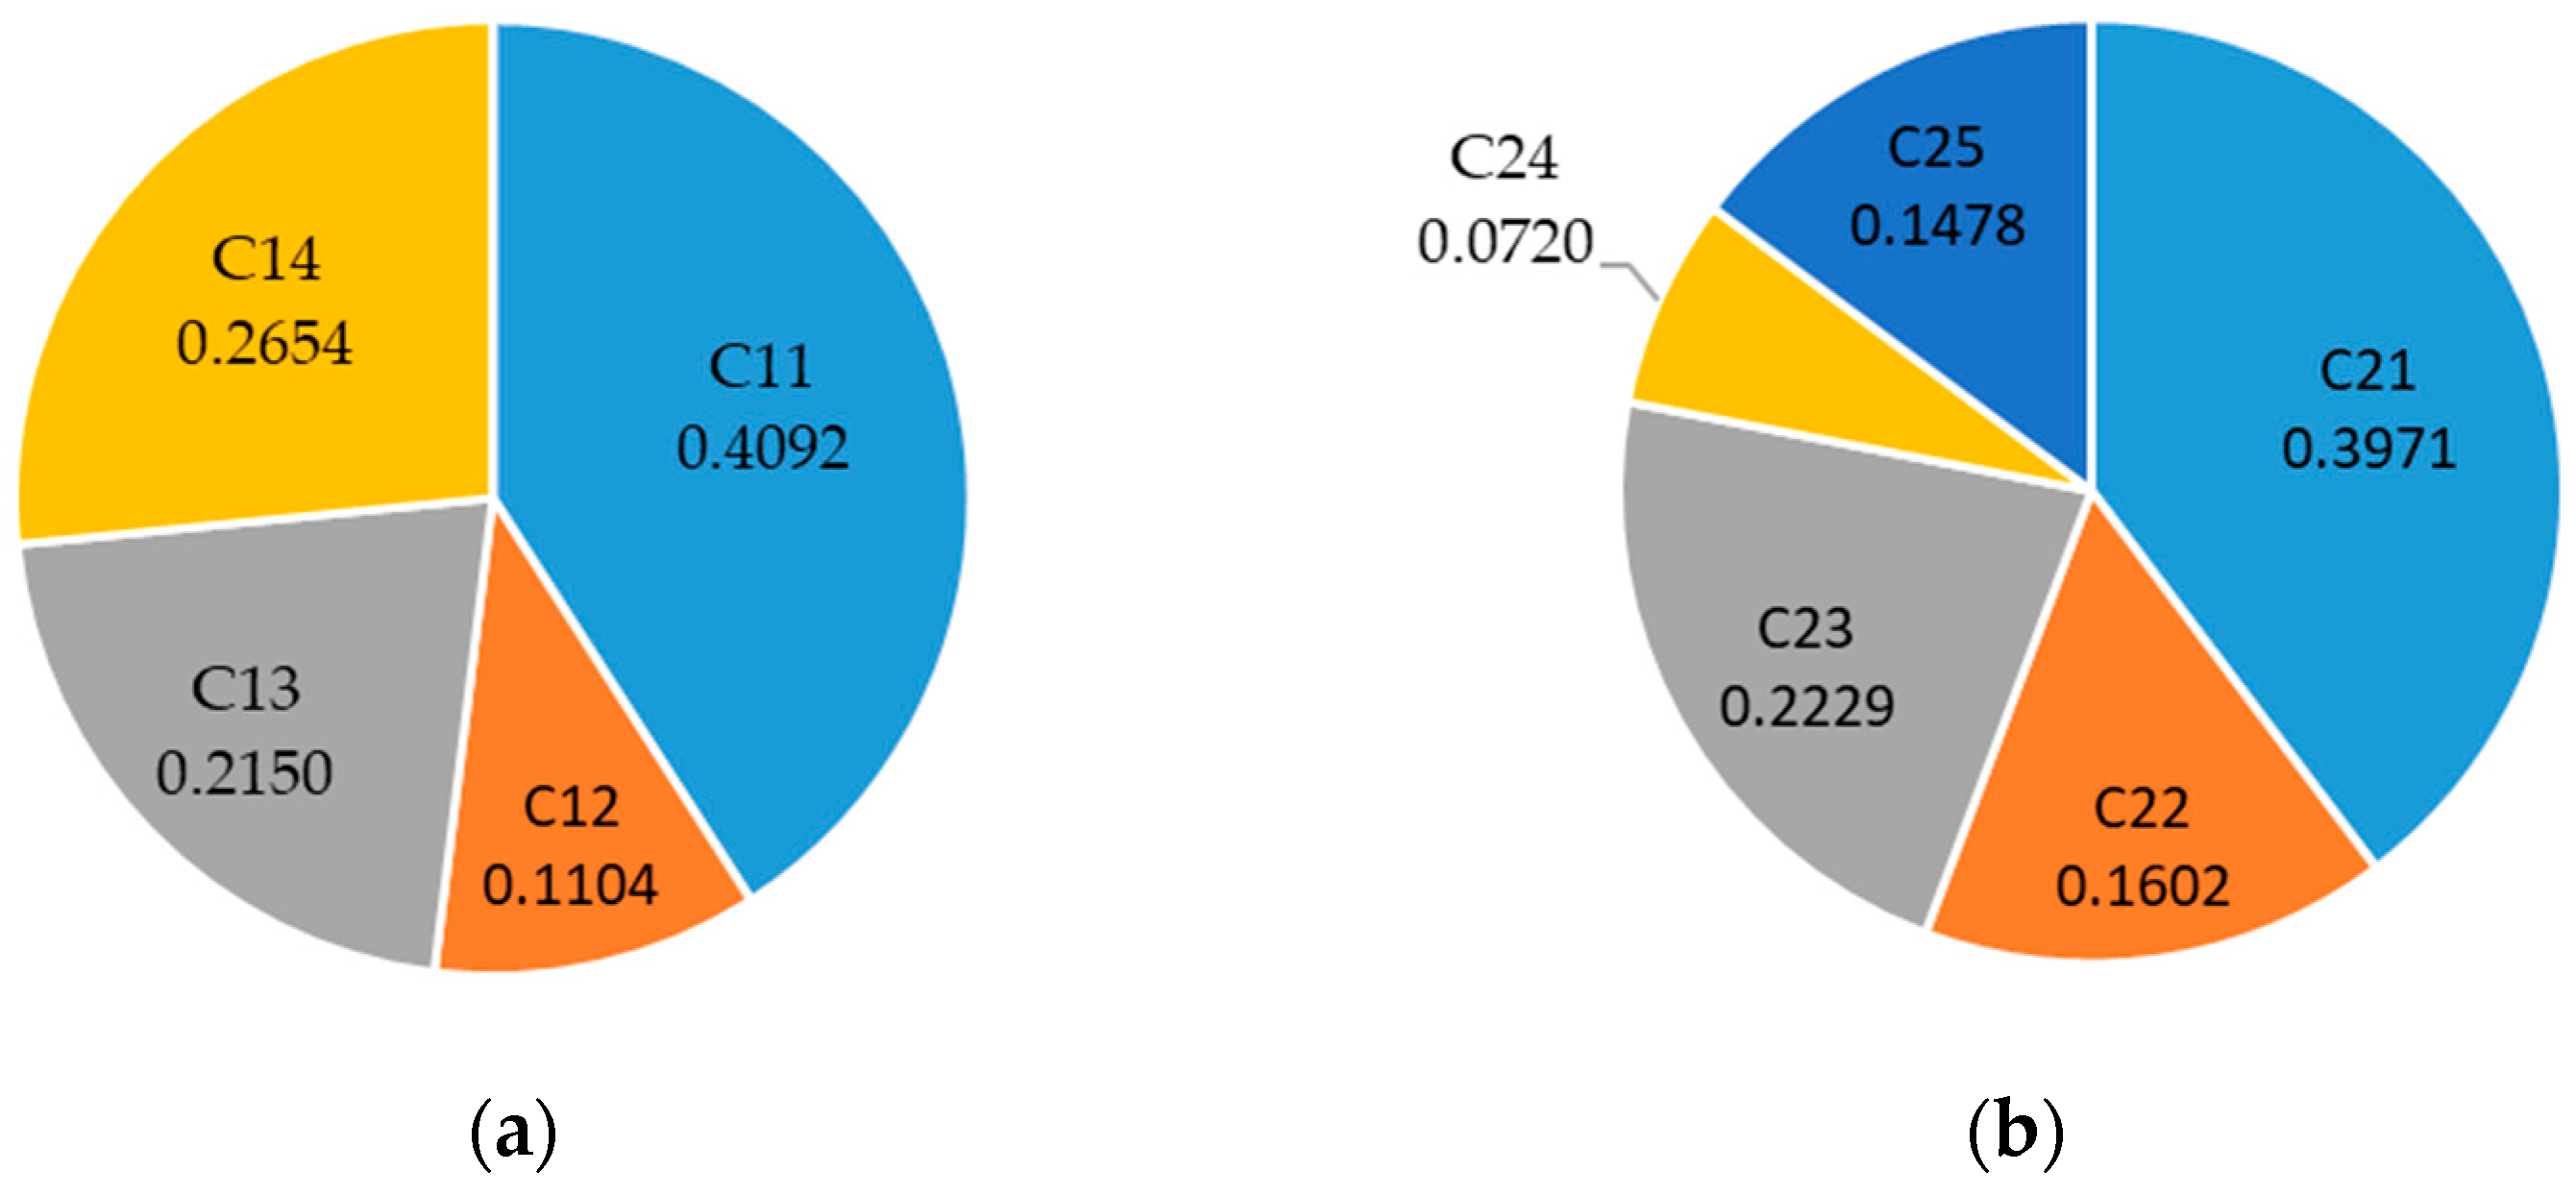
Q1 = (0.4092, 0.1104, 0.2150, 0.2654), CI1 = 0.048, CR1 = 0.054,
Q2 = (0.3971, 0.1602, 0.2229, 0.0720, 0.1478), CI2 = 0.063, CR2 = 0.056.
The weights of survival capability and development capability as well as their corresponding secondary index weights can be calculated from the above calculations, as shown in Figure 2.
The comprehensive weight of the secondary indicators can be calculated by multiplying the weight of the primary indicators and the secondary indicators, as shown in Table 4.

3.2. Division of Early Warning Intervals for Returning to Poverty

Through the weighted average method, we can use the comprehensive weights of the indicators we obtained above to calculate the current quantitative assessment criteria of poverty and obtain the comprehensive score of the threshold of poverty return so as to carry out early warning evaluation on individual farmers. When calculating the poverty threshold, different regions have different conditions. We should consider the definition of poverty in China, preferably in Guangxi. According to the latest provisions of Guangxi on the poverty alleviation standard of “Eight Haves and One Excess” [43], the critical values of each factor in the evaluation system are: the annual per capita net income is not less than 3050 yuan, the proportion of basic medical security is not less than 80%, the housing security is not less than 30 points, the per capita forest area is not less than 1 mu, the compulsory education security is not less than 20%, the per capita burden of labor is not more than four people, the proportion of non-labor income is less than 100%, and the per capita salary of labor is not less than 600 yuan. Since most of the survey objects are forest farmers, we innovatively adjusted the per capita cultivated land area index to per capita forest land area. For some farmers who do not have forest land, the poverty alleviation standard mentions that “the per capita cultivated land is greater than or equal to 0.5 mu”, and the area of their cultivated land is uniformly converted into the area of forest land so that they can be evaluated under the same standard. The per capita burden of labor force, the proportion of non-labor income and the proportion of disabled people are negatively related factors, and the rest are positively related factors. Therefore, the standard value of the negative factors is set as 0 [44]. If it is lower than the standard value, it is positive, and if it is higher than the standard value, it is negative.
According to the calculation of comprehensive weight, the critical value of returning to poverty is determined to be 788.3489 points. The closer to this score, the higher the degree of early warning of returning to poverty. The Heinrich accident rule 300:29:1 is used to divide the early warning range. The Heinrich accident rule is frequently applied in the field of safety early warning. The rule was proposed by Heinrich, an American, and it defines the best business plan for insurance companies, analyzing the probability of industrial injury. The rule states that there must be 29 minor accidents behind a major accident and 300 potential hidden dangers, which is known as the 300:29:1 rule [45,46]. From this, that the following interval points can be calculated. Interval point 1: 788.3489 × (331/330) = 790.7378; Interval point 2: 788.3489 × (360/330) = 860.0170; Interval point 3: 788.3489 × (660/330) = 1576.6978. According to the above calculation results, the results of alert range division are shown in Table 5.

3.3. Test Results of BP Neural Network

The data are trained through Python 3.7 combined with the deep learning framework TensorFlow. The total data size is 2863. Through random sampling, 2317 data are selected as the training set, 526 as the test set, and 20 data are discarded due to integrity issues. By setting the learning rate to 0.1–0.01 (decreasing 0.01 every 1000 training cycles in 10,000 training cycles), 10,000 training sessions are completed.
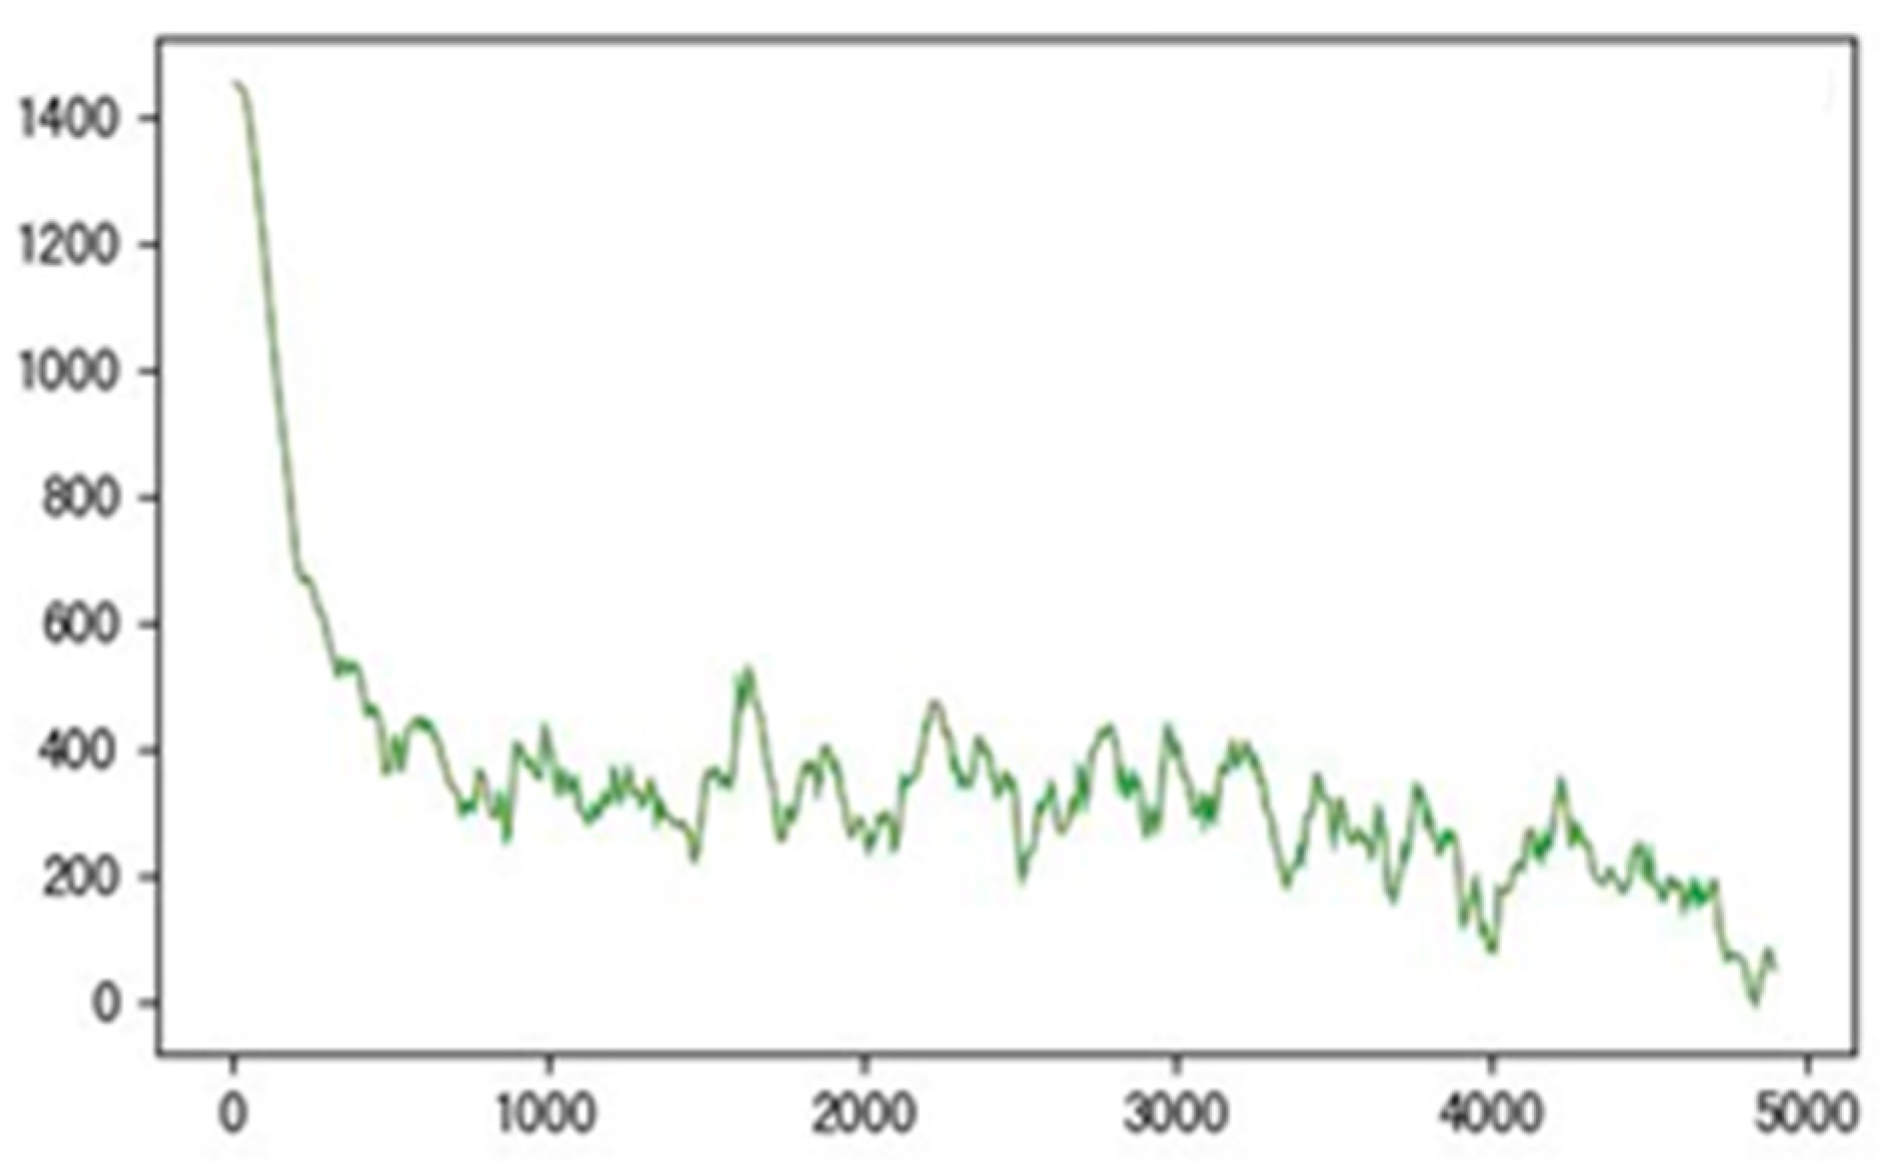
As shown in Figure 3, the gradient in the training process has a significant decline and convergence process. The number of training errors rapidly decreases in the early stage, with approximately 800 episodes entering a convergence state. Subsequent training errors can remain stable at lower values without a surge in training errors. Benefiting from a reasonable neural network structure and parameter selection, the training results are also ideal. Optimizing from around 1400 to around 200 from the beginning of training, compared to other similar studies [47], the training error of 200 also represents excellent performance. The trained neural network model can achieve good results on the test set, with the mean square error of only 0.0315381.
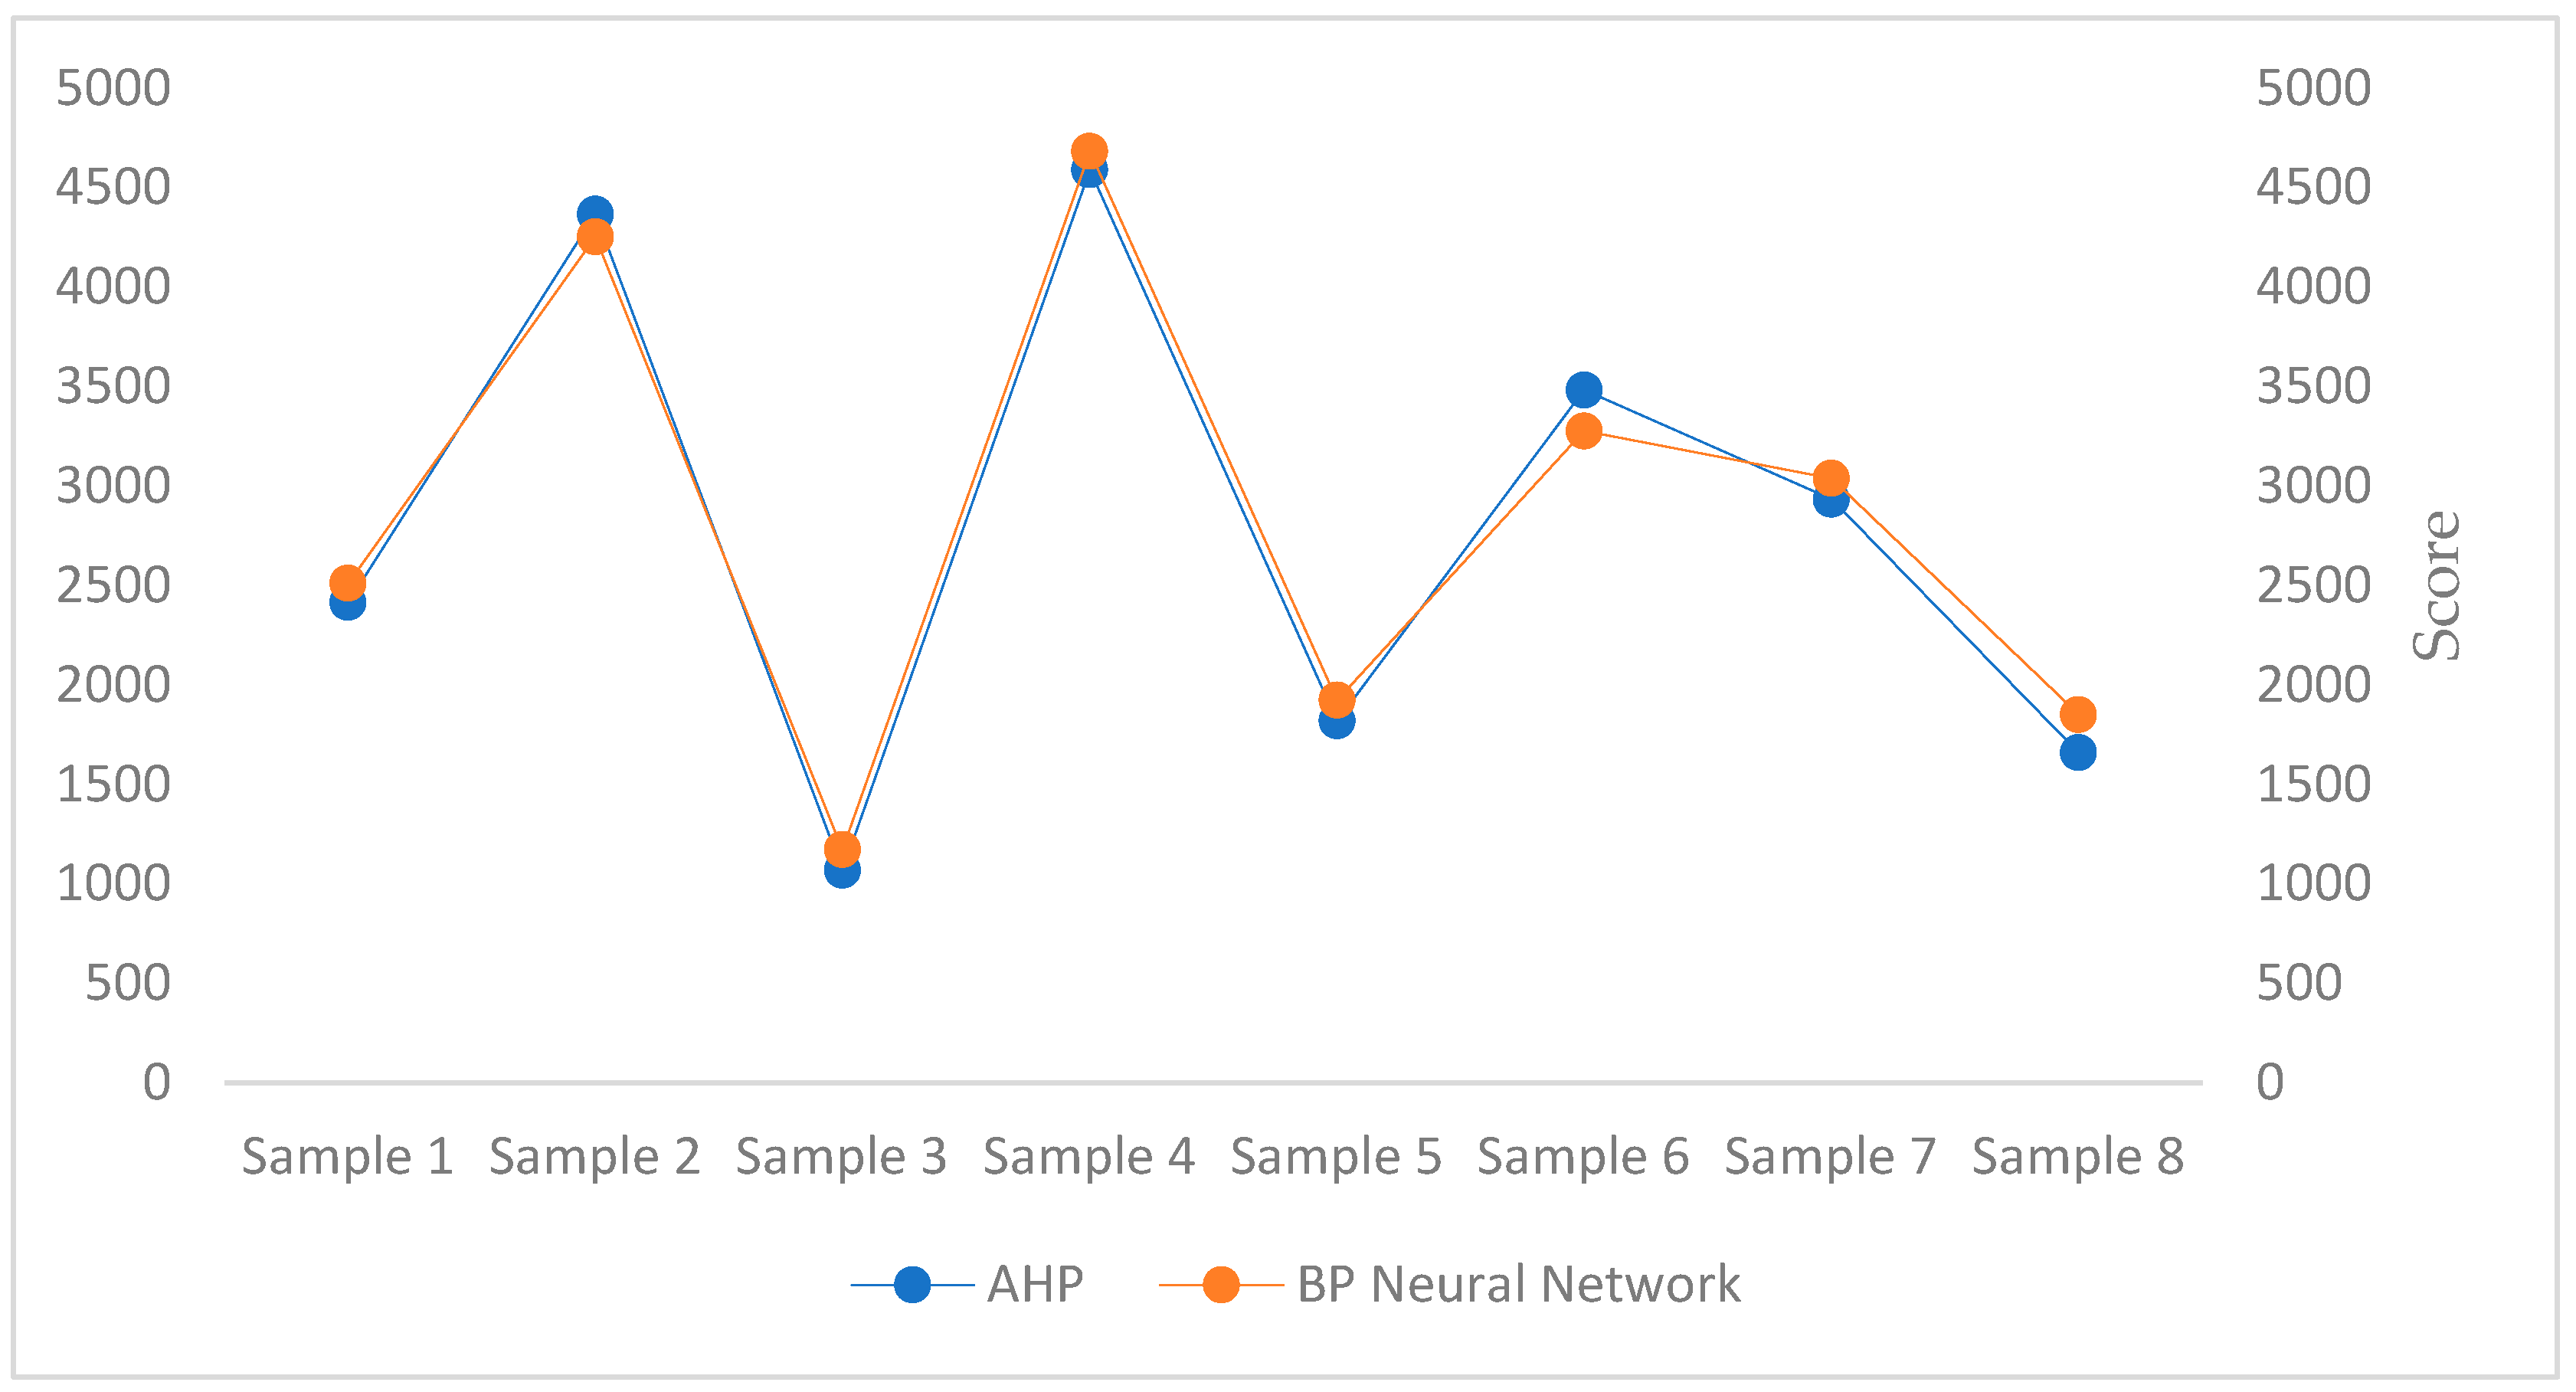
Eight samples are extracted from the data results of completing the BP neural network training, compared with the sample scores calculated by the Analytic Hierarchy Process, and the degree of numerical fitting of the extracted samples is observed to verify the effectiveness and credibility of the results obtained by the Analytic Hierarchy Process. The test results are shown in Figure 4, which is completely within the ideal range. Therefore, it is feasible and ideal to use the BP neural network for poverty early warning.

4. Discussion

This article employed two counties in ethnic minority areas of Guangxi as the research objects and set up a poverty-return monitoring survey questionnaire from five dimensions based on the sustainable livelihood framework theory. This theory has been applied in the field of poverty-return monitoring for a long time and has high feasibility [48,49,50]. Farmer data from multiple villages in two counties were collected. The Analytic Hierarchy Process was used to analyze the collected data, determine indicator weights, divide warning degree intervals, and calculate farmers’ warning scores. Afterwards, the BP neural network algorithm was used to verify the accuracy and rationality of the data. The following conclusion is drawn: X and Y counties are mainly composed of farmers without poverty warning, with a few mild and severe warnings present. The findings of this article regarding the main group of farmers without warning in most regions are consistent with those of previous studies. This is mainly due to the high cost of China’s investment in poverty alleviation work [51,52], which has achieved good results in poverty alleviation. It also made important contributions to the development of poverty reduction in the world. Contrary to earlier findings, however, this study found that there are a few households with mild and severe poverty warnings in ethnic minority areas, causing a certain risk of returning to poverty. A possible explanation for this might be that the resource endowment in ethnic minority areas is poor, and farmers lack livelihood development opportunities. This leads to lower risk resistance among farmers and a higher likelihood of early warning due to diseases and disasters [46]. Moreover, the quality of personnel in ethnic minority areas is relatively low, lacking the ability to develop independently. They are easily affected by the external environment, and there is a high possibility of returning to poverty [53].
Firstly, the previous research on groups vulnerable to poverty has focused on multiple contiguous areas or specific districts and counties [54,55,56,57]. This article innovatively considers individual farmers as research units, strengthening the targeted evaluation and improving the efficiency of early warning. Secondly, compared to the previous research on the application of sustainable livelihood framework theory [58,59], this article innovates the evaluation index system. This study considers ecological indicators within the evaluation system, enriching and improving the evaluation content. This is mainly due to the poor natural resource endowment and susceptibility to natural disasters in ethnic areas, which pose a significant threat to farmers’ lives. Changes in the ecological environment can also have an impact on farmers’ poverty warning levels. In addition, based on China’s poverty alleviation standards, this study innovatively converts cultivated land area into forest land area for score calculation, which is more applicable to the characteristics of forest farmers with more forest land area and less cultivated land area.
The major limitations of the present study are the difficulty in obtaining data resulting in a small sample size. In addition, the universality of the research results needs further verification. Notwithstanding these limitations, the theoretical foundation of the research is solid, and the methods are scientific and reasonable, which does not affect the effectiveness of the results.

5. Conclusions

Against the background of rural revitalization, through theoretical learning and analysis of poverty-returning factors, a poverty-returning early warning evaluation system was established. The data of 150 households sampled and collected in the two counties were calculated and analyzed using the AHP analytic hierarchy process and the BP neural network algorithm, and the following conclusions were drawn:
(1)
According to the existing poverty reduction standards, four warning intervals have been identified. Farmers with a poverty-return warning evaluation score lower than or equal to 789.8923 are considered serious-warning farmers; farmers with scores above 789.8923 but below 859.0973 are classified as moderate-warning farmers; farmers with scores above 859.0973 and below 1575.0118 belong to households with mild warning; farmers with a score greater than 1575.0118 are non-warning farmers, with the lowest likelihood of returning to poverty and the most stable effects of poverty alleviation.
(2)
One household in X County has a severe early-warning status, accounting for 1.41% of the total number of households in the county; six households have a mild early-warning status, accounting for 8.45% of the total number of households in the county; sixty-four households do not have early-warning status, accounting for 90.14% of the total number of households in the county.
(3)
There are six households in Y County with severe early-warning status, 7.59% of the total number of households in the county, six households have mild early-warning status, 7.59% of the total number of households in the county, and sixty-seven households do not have early-warning status, accounting for 84.81% of the total number of households in the county.
(4)
The significant number of early-warning farmers is mainly caused by a lack of labor force and low annual per capita net income, as well as the lack of major livelihood means and capabilities. The presence of mild early-warning farmers is mainly caused by low annual per capita income and high proportion of non-labor income, as well as the lack of long-term development capabilities and methods.
According to the results of poverty early warning evaluation of X County and Y County, the following suggestions were offered to reduce the risk of farmers returning to poverty:
(1)
For severe early-warning households: The government should provide social assistance such as minimum living security and special hardship support for this group, increase the proportion of medical expense reimbursement, improve the system of serious illness medical insurance, increase government transfer payments, and ensure that the existing rural labor force is not idle due to illness as much as possible. The government should also improve the borrowing and lending financial system, such as government guarantees for bank loans, providing start-up funds for farmers to participate in local planting and breeding industries, increasing per capita annual net income, and enhancing farmers’ livelihood ability.
(2)
For mild early-warning households: The government needs to encourage and guide this group to improve their self-development capabilities. Farmers need to be encouraged to develop industries with local regional characteristics such as rural tourism and planting and breeding, the implementation of corresponding supporting policies should be promoted, such as interest-free loans and tax exemptions, and opportunities should be provided for farmers to learn and train in science and technology. Technical support and problem-solving should be provided for farmers in deep rural areas in order to achieve the transformation of poverty alleviation models.
Developing poverty reduction is a common issue faced by the world, and China has provided many practices that other countries can refer to in reducing poverty. X and Y counties in Guangxi Province, as ethnic minority areas, have unique resource endowments and development difficulties, and their populations face greater risks of returning to poverty than those of ordinary areas. It is necessary to establish a specialized evaluation system for this region. Although policies lean towards assisting ethnic minority areas, more practical exploration is needed to determine whether these populations can lift themselves out of poverty without returning to poverty. In the future, more panel data will be used to analyze the research in this field, and more reasonable results will be obtained, providing solid support for the development of poverty reduction in the world.

Author Contributions

Conceptualization, Y.D. and R.Z.; data curation, R.Z.; formal analysis, Y.D.; investigation, Y.D. and R.Z.; supervision, R.Z.; writing—original draft preparation, Y.D.; writing—review and editing, Y.D. and R.Z. All authors have read and agreed to the published version of the manuscript.

Funding

National Social Science Foundation of China (22BGL313).

Institutional Review Board Statement

Not applicable.

Informed Consent Statement

Not applicable.

Data Availability Statement

The data presented in this study are available on request from the corresponding author.

Acknowledgments

The valuable comments and suggestions of editors and reviewers are gratefully acknowledged.

Conflicts of Interest

The authors declare no conflict of interest.

References

  1. Susana, L.; Celeste, E.; Partidário, M.D. Determinants for tourism and poverty alleviation. Tour. Manag. Stud. 2011, 7, 43–53. [Google Scholar]
  2. Pramod, K.; Harpalsinh, C. Evaluating poverty alleviation strategies in a developing country. PLoS ONE 2020, 15, e0227176. [Google Scholar] [CrossRef]
  3. Du, Y.; Zhao, R. Research progress on the effective connection between the achievements of consolidating and expanding poverty alleviation in ethnic areas and rural revitalization. Res. For. Grass Policies 2021, 1, 7. [Google Scholar] [CrossRef]
  4. Wang, Z.; Feng, Q. Strategies for consolidating poverty governance: From targeted poverty alleviation to rural revitalization. Res. Financ. Issues 2021, 10, 14–23. [Google Scholar] [CrossRef]
  5. Craig, D.; Porter, D. Poverty reduction strategy papers: A new convergence. World Dev. 2003, 31, 53–69. [Google Scholar] [CrossRef]
  6. Che, S.; Xie, J.; Shu, W. Multidimensional poverty measurement and analysis based on different weights. J. Quant. Econ. 2018, 9, 2. [Google Scholar] [CrossRef]
  7. Sen, A. Poverty: An Ordinal Approach to Measurement. Econometrica 1976, 3, 44. [Google Scholar] [CrossRef]
  8. Kimenyi, M.S. Rational Choice, Culture of Poverty, and the Intergenerational Transmission of Welfare Dependency. South. Econ. J. 1991, 57, 947–960. [Google Scholar] [CrossRef]
  9. Ahluwalia, M.; Carter, N.; Chenery, H. Growth and Poverty in developing Countries. J. Dev. Econ. 1979, 6, 299–341. [Google Scholar] [CrossRef]
  10. Luo, Y.; Li, H.; Hou, L.; Zhao, Z. Risk identification and early warning mechanism construction of rural tourism destination returning to poverty from the perspective of sustainable livelihood—Take W Village, Enshi Prefecture, Hubei Province as an example. Resour. Environ. Arid Areas 2022, 36, 186–193. [Google Scholar] [CrossRef]
  11. Huang, G.; Liu, Y.; Shi, P. Risk Assessment and Early Warning Mechanism Construction of Poverty Alleviation in Ethnic Areas. J. Huazhong Agric. Univ. (Soc. Sci. Ed.) 2021, 4, 79–88+181–182. [Google Scholar] [CrossRef]
  12. Sittha, P. Governance and Poverty Reduction in Thailand. Mod. Econ. 2012, 3, 487–497. [Google Scholar] [CrossRef]
  13. Hu, S.; Cao, Y. Risk Monitoring of Poverty Alleviation: Mechanism Setting, Dimensional Focus and Implementation Path. J. Northwest Univ. Agric. For. Sci. Technol. (Soc. Sci. Ed.) 2021, 21, 29–38. [Google Scholar] [CrossRef]
  14. Shen, Q. Research on the Early Warning Mechanism of Poverty Return in Northeast Border Minority Areas in the “Post Poverty Alleviation Era”. J. North Univ. Natl. 2020, 6, 41–48. [Google Scholar]
  15. Chen, S.; Ye, X.; Hou, D. Innovation of the governance mechanism for returning to poverty in the post targeted poverty alleviation era: An empirical survey based on H County, Jiangsu Province. J. Jiangsu Univ. Adm. 2021, 3, 113–120. [Google Scholar]
  16. Jiang, H.; Li, X.; Tian, Y. Research on the Long term Mechanism of Blocking Poverty Return. J. Soc. Sci. Jilin Univ. 2020, 60, 24–34+231–232. [Google Scholar] [CrossRef]
  17. Circular of the General Office of the State Council on Supervising and Encouraging the Implementation of “Relevant Major Policies and Measures with Remarkable Results” in 2019. Available online: http://www.gov.cn/zhengce/zhengceku/2020-05/08/content_5509889.htm (accessed on 11 May 2020).
  18. All the 54 Poverty-Stricken Counties in Guangxi “Take Off the Hat”, and the Guangxi Zhuang People Get Rid of Poverty as a Whole. Available online: https://www.chinanews.com.cn/gn/2020/11-20/9343242.shtml (accessed on 21 November 2020).
  19. 2019 Statistical Bulletin of National Economic and Social Development of X and Y Counties in Guangxi. Available online: https://www.monseng.com/1542783.html (accessed on 21 April 2020).
  20. Saaty, T.L. The Analytic Hierarchy Process; McGraw-Hill: New York, NY, USA, 1980. [Google Scholar]
  21. Saaty, T.L. Absolute and relative measurement with the AHP. Most Livable Cities United States. Socio-Econ. Plann. Sci. 1986, 20, 327–331. [Google Scholar] [CrossRef]
  22. Zhu, H.; Ren, X. On the Poverty in the Rocky Desertification Areas of Southwest China Based on AHP: A Case Study of Liupanshui City in. Asian Agric. Res. USA-China Sci. Cult. Media Corp. 2014, 6, 56–65. [Google Scholar] [CrossRef]
  23. Zhang, X.; Shi, L. Construction and demonstration of poverty early warning evaluation indicator system in the context of rural revitalization. Stat. Decis. Mak. 2021, 577, 58–62. [Google Scholar] [CrossRef]
  24. Rotermund, D.; Pawelzik, K.R. Back-Propagation Learning in Deep Spike-By-Spike Networks. Front. Comput. Neurosci. 2019, 13, 55. [Google Scholar] [CrossRef]
  25. Xu, B.; Zhang, H.; Wang, Z. Model and Algorithm of BP Neural Network Based on Expanded Multichain Quantum Optimization. Math. Probl. Eng. 2015, 5, 15–26. [Google Scholar] [CrossRef]
  26. Lee, J.H.; Delbruck, T.; Pfeiffer, M. Training Deep Spiking Neural Networks Using Backpropagation. Front. Neurosci. 2016, 10, 508. [Google Scholar] [CrossRef] [PubMed]
  27. Cheng, B.; Jia, G. Research on improved AHP-BP neural network algorithm—Taking circular economy evaluation of construction enterprises as an example. Manag. Rev. 2015, 27, 36–47. [Google Scholar] [CrossRef]
  28. Sun, C. Tunnel rockburst prediction model based on improved MATLAB BP neural network algorithm. J. Chongqing Jiaotong Univ. (Nat. Sci. Ed.) 2019, 38, 41–49. [Google Scholar]
  29. Lan, Q. Empirical Research on Comprehensive Stock Selection Based on Principal Component Analysis and BP Neural Network Algorithm; Jinan University: Guangzhou, China, 2017. [Google Scholar]
  30. Gu, J.; Wang, J.; Deng, J.; Wang, R. Water quality prediction based on ARIMA model and BP neural network algorithm. Water Purif. Technol. 2020, 39, 73–82. [Google Scholar] [CrossRef]
  31. Zhang, W.; Wu, Y.; Gong, Y. Risk prediction and cause analysis of returning to poverty of poor households with registered cards—Based on the field monitoring and research data of 25 provinces (districts and cities) in 2019. Reform 2020, 12, 110–120. [Google Scholar]
  32. Xie, N.; Zhang, L.; Fu, S. Sustainable livelihood and risk analysis of poverty free households in deep poverty areas—Based on the survey of 812 poor households in Liangshan Yi District. Soft Sci. 2020, 34, 6. [Google Scholar] [CrossRef]
  33. Zhang, W. Establishing an Early Warning Mechanism for Poverty Return Risk to Resolve the Risk of Poverty Return. People’s Forum 2019, 23, 68–69. [Google Scholar]
  34. Townsend, P. Poverty in the United Kingdom: A Survey of Household Resources and Standards of Living; University of California Press: Berkeley, CA, USA, 1979. [Google Scholar]
  35. UK Poverty 2019/2020 Report. Available online: https://www.Jrf.org.uk/report/uk-poverty-2019-20 (accessed on 7 February 2020).
  36. Henderson, R.F. Poverty in Australia. Canberra Aust. Gov. Publ. Serv. 1975, 1, 269–281. [Google Scholar]
  37. Hou, X.; Wu, H.; Wang, W. Identification and Measurement of Multidimensional Relative Poverty of Chinese Rural Adults Considering Climate Factors. Front. Environ. Sci. 2022, 10, 891077. [Google Scholar] [CrossRef]
  38. Thomas, H. The Effect of Education on Poverty: A European Perspective. Econ. Educ. Rev. 2021, 83, 102124. [Google Scholar] [CrossRef]
  39. Wu, M.; Jiao, L. A Study on the Quality of Life of Residents in Rural Tourism Destinations: A Case Study of Riga Village, Brazil. Front. Econ. Cult. 2022, 220, 52–55. [Google Scholar]
  40. Mao, Y.; Jin, Y.; Ouyang, H.; Li, C.; Hu, P. Research on the Safety Evaluation Index System of Mechanical Parking Equipment Based on Analytic Hierarchy Process and Expert Scoring Method. Lift. Transp. Mach. 2023, 623, 20–24. [Google Scholar]
  41. Saaty, T.L. Decision making— the Analytic Hierarchy and Network Processes (AHP/ANP). Syst. Sci. Syst. Eng. 2004, 13, 35. [Google Scholar] [CrossRef]
  42. Zhang, Y.; Wu, L. Stock market prediction of S&P 500 via combination of improved BCO approach and BP neural network. Expert Syst. Appl. 2009, 36, 8849–8854. [Google Scholar] [CrossRef]
  43. Some Standards and Assessment Requirements for Guangxi to Adjust Poverty Alleviation. Available online: http://www.gov.cn/xinwen/2018-05/07/content_5288754.htm (accessed on 7 May 2018).
  44. Chen, P. Linear Dimensionless Method Comparison and Reverse Index Forward Method. Oper. Res. Manag. 2021, 30, 95–101. [Google Scholar]
  45. Li, J.; Chen, W. Analysis of the Academic Impact of Heinrich’s Safety Theory. Chin. J. Saf. Sci. 2017, 27, 1–7. [Google Scholar] [CrossRef]
  46. Li, D. Research on Early Warning Evaluation of Poverty Return in the Context of Targeted Poverty Alleviation in Hebei Province; Hebei University: Baoding, China, 2020. [Google Scholar]
  47. Adato, M.; Meinzendick, R.S. Assessing the impact of agricultural research on poverty using the sustainable livelihoods framework. Biometrika 2010, 7, 452–504. [Google Scholar]
  48. Liu, Y.; Xu, Y. A geographic identification of multidimensional poverty in rural China under the framework of sustainable livelihoods analysis. Appl. Geogr. 2016, 73, 62–76. [Google Scholar] [CrossRef]
  49. Wang, Y.; Wang, M.; Huang, B.; Li, S.; Lin, Y. Evaluation and Analysis of Poverty-Stricken Counties under the Framework of the UN Sustainable Development Goals: A Case Study of Hunan Province, China. Remote Sens. 2021, 13, 4778. [Google Scholar] [CrossRef]
  50. Wang, G.; Xing, T. Analysis of the Mechanism of Precision Poverty Alleviation in China. Rural Econ. 2015, 395, 46–50. [Google Scholar]
  51. Yang, R.; Yang, Z. Poverty Alleviation by Helping the Disabled in Impoverished Mountainous Areas of Western China:Taking Luquan Yi and Miao Autonomous County in Yunnan Province as an Example. Asian Agric. Res. 2019, 11, 55–59. [Google Scholar] [CrossRef]
  52. Anh, V.T. Implementation of Poverty Reduction Policies in Ethnic Minority Regions in Vietnam: Evidence from CBMS; Socio-Economic Development Centre: Hanoi, Vietnam, 2004; pp. 314–318. [Google Scholar]
  53. Yang, J.; Li, Y. A Study on the Population Quality in the Development Process of Ethnic Poverty stricken Areas: A Case Study of Central Hainan. Guizhou Ethn. Stud. 2004, 3, 195–199. [Google Scholar]
  54. Zhao, Y. Research on Dynamic Monitoring of Poverty Prevention Based on Household Reports—Taking Qinba Mountain Area as an Example. Financ. Account. Commun. 2022, 19, 81–84+97. [Google Scholar] [CrossRef]
  55. Li, Z. Practice exploration and system construction of poverty prevention monitoring and assistance mechanism in poverty relief areas—Based on comparative analysis of two counties. J. Shanxi Agric. Univ. (Soc. Sci. Ed.) 2022, 21, 49–56. [Google Scholar] [CrossRef]
  56. Sun, Z.; Wang, T. Research on the construction of big data driven anti-poverty early warning mechanism from the perspective of dynamic poverty—Based on the practice and exploration of Sichuan L District. Electron. Gov. 2021, 12, 110–120. [Google Scholar] [CrossRef]
  57. Peng, J.; Chen, L.; Yu, B.; Zhang, X.; Huo, Z. Effects of multiple cropping of farmland on the welfare level of farmers: Based on the perspective of poverty vulnerability. Front. Ecol. Evol. 2022, 10, 988757. [Google Scholar] [CrossRef]
  58. Xie, C.; Li, T.; Liao, H.; Zhu, L.; Liu, T.; Zhou, T. Research on the influencing factors of stable poverty alleviation among farmers in Chongqing under the framework of sustainable livelihoods. J. Southwest Univ. (Nat. Sci. Ed.) 2023, 45, 2–13. [Google Scholar] [CrossRef]
  59. Ye, D.; Liu, Y. Evaluation and Application of Design Poverty Alleviation in Yao Ethnic Areas Based on Sustainable Framework Theory. Packag. Eng. 2022, 43, 157–165+175. [Google Scholar]
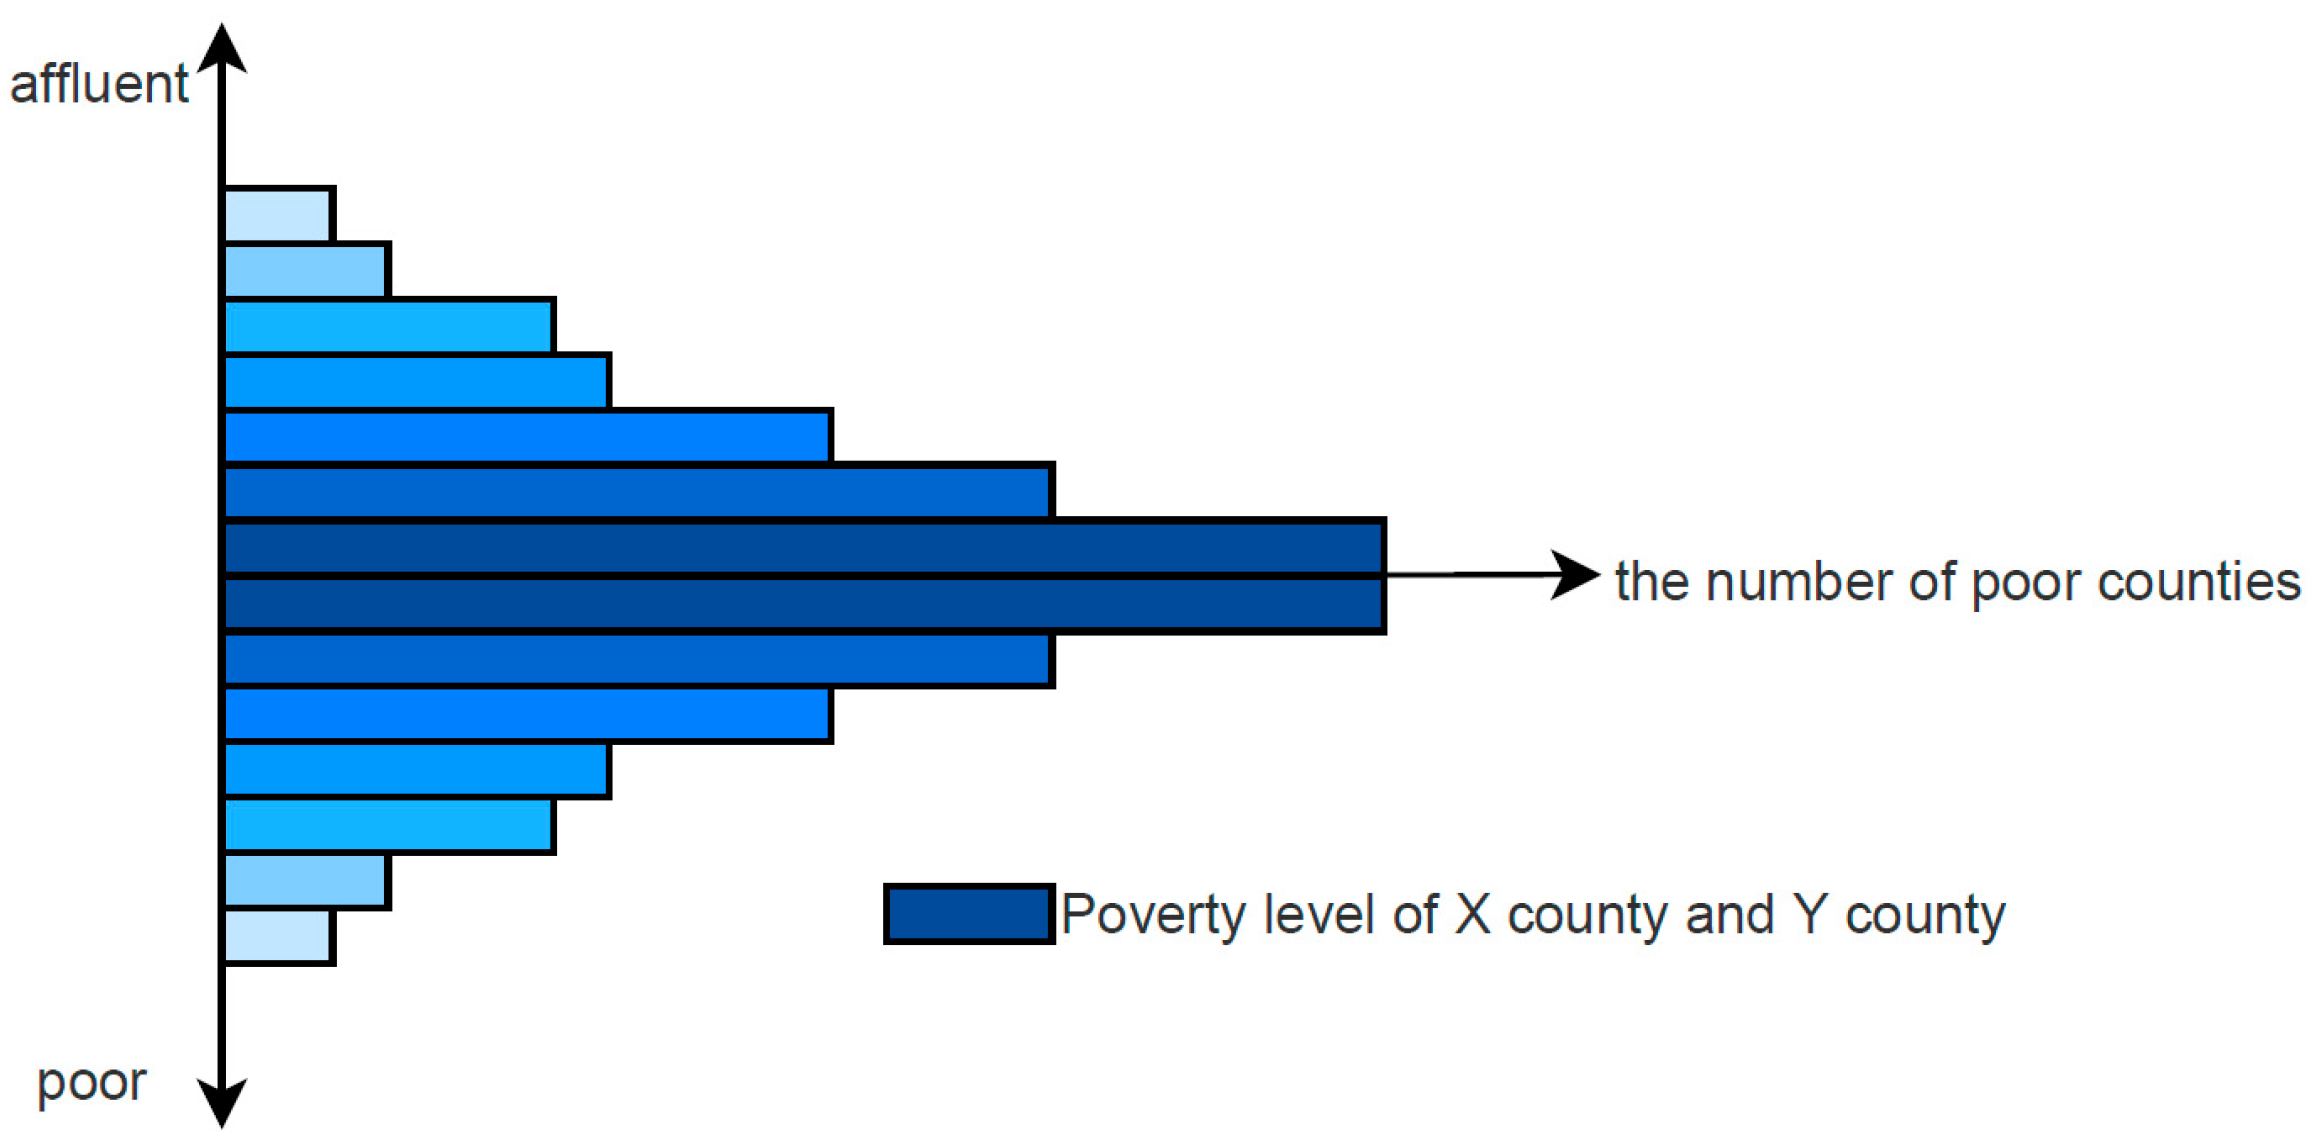
Figure 1. Poverty Level of X County and Y County in China Before 2020.
Agriculture 13 01087 g001
Figure 2. The Weight of Each Indicator in Survival Capability and Development Capability. (a) The Weight of Each Indicator in Survival Capability. (b) The Weight of Each Indicator in Development Capability.
Agriculture 13 01087 g002
Figure 3. Training Error of BP Neural Network.
Agriculture 13 01087 g003
Figure 4. Comparison of BP Neural Network Training Results.
Agriculture 13 01087 g004
Table 1. Early warning evaluation index system for returning to poverty.
ObjectiveGrade 1Grade 2
Early Warning Evaluation of Returning to Poverty (A)Survival Capability (B1)Annual net income per capita (yuan) C11
Basic medical coverage (%) C12
Housing security (points) C13
Forest land area (mu) C14
Development Capability (B2)Compulsory education guarantee (%) C21
Number of people burdened by the labor force per capita (person) C22
Percentage of non-labor income (%) C23
Sick and disabled population (%) C24
Salary per capita of the labor force (yuan) C25
Table 2. Descriptive Statistics of Indicators.
IndexMeanSE.County
Annual net income per capita (yuan)11,868.57740.11X
9223.64592.56Y
Basic medical coverage (%)98.54%0.01X
98.24%0.01Y
Housing security (points)41.380.61X
32.540.72Y
Forest land area (mu)3.380.41X
8.291.45Y
Compulsory education guarantee (%)100.00%0.00X
100.00%0.00Y
Number of people burdened by the labor force per capita (person)−4999.552452.08X
2.050.12Y
Percentage of non-labor income (%)78.40%0.03X
86.28%0.02Y
Sick and disabled population (%)79.18%0.03X
72.98%0.04Y
Salary per capita of the labor force (yuan)17,914.031402.66X
14,019.60974.92Y
Table 3. Expert Scoring Form.
NumberWeight CombinationScore Summary
1(0.8, 0.2)12
2(0.7, 0.3)27
3(0.6, 0.4)45
4(0.5, 0.5)41
5(0.4, 0.6)32
6(0.3, 0.7)15
7(0.2, 0.8)11
Table 4. Comprehensive Weight of Poverty Early Warning Evaluation Indicators.
ObjectiveGrade 1Grade 2Comprehensive Weight
Early Warning Evaluation of Returning to Poverty (A)Survival Capability (B1)Annual net income per capita (yuan) C110.2455
Basic medical coverage (%) C120.0662
Housing security (points) C130.1290
Forest land area (mu) C140.1592
Development Capability (B2)Compulsory education guarantee (%) C210.1589
Number of people burdened by the labor force per capita (person) C220.0641
Percentage of non-labor income (%) C230.0892
Sick and disabled population (%) C240.0288
Salary per capita of the labor force (yuan) C250.0591
Table 5. Early Warning Range for Returning to Poverty.
Early Warning Range(−∞, 789.8923](789.8923, 859.0973](859.0973, 1575.0118](1575.0118, +∞)
Early warning levelSevere Early WarningModerate Early WarningMild Early WarningNo Early Warning
Disclaimer/Publisher’s Note: The statements, opinions and data contained in all publications are solely those of the individual author(s) and contributor(s) and not of MDPI and/or the editor(s). MDPI and/or the editor(s) disclaim responsibility for any injury to people or property resulting from any ideas, methods, instructions or products referred to in the content.