Abstract
On 15 March 2022, the European Council reached an agreement on the relevant rules of the Carbon Border Adjustment Mechanism (CBAM). In order to study the impact of the implementation of carbon tariffs on China’s agricultural trade, this paper sets three control groups, namely, economic development, the impact of the “Belt and Road” initiative’s (BRI’s) trade facilitation level, and separate taxation by different countries, and uses the dynamic Global Trade Analysis Project—Environment (GTAP-E) model for policy simulation. The empirical results show that, firstly, carbon tariffs can suppress international demand for agricultural products and increase international market prices. At the same time, under the pressure of carbon tariffs, China will reduce the main agricultural product’s Free on Board (FOB) prices to ensure that their Cost, Insurance and Freight (CIF) prices can maintain a competitive advantage in the international market after increasing the cost of carbon tariffs, and the market share of China’s agricultural products exported to recipient countries will decline. Secondly, China’s “Belt and Road” initiative has a two-way impact on carbon tariff policy. On the one hand, it reduces the negative impact of carbon tariffs through trade facilitation, and on the other hand, it will decrease the effectiveness of carbon emission reduction because of the huge trade demand and encourage countries to develop green and low-carbon agriculture. Finally, there is heterogeneity in the impact of carbon tariffs imposed by the United States, Japan, and Europe on Chinese agricultural trade.
1. Introduction
In November 2020, the Biden administration promised to return to the Paris Agreement and hoped to use high-carbon tariffs as a tool of trade. On 15 March 2022, the European Council reached an agreement on the relevant rules of the Carbon Border Adjustment Mechanism (CBAM), and the world’s first carbon tariff will be formally implemented. According to the agreement, 2023–2025 is the pilot phase of the CBAM mechanism. In the current complex international context, it is important to consider and evaluate the forward-looking economic impact of carbon tariffs, and how countries plan and update institutional arrangements in advance during the pilot phase has become the focus of current academic attention.
The global warming problem caused by carbon emissions is actually a manifestation of negative environmental externalities in the international community. The imposition of carbon tariffs and related measures is to internalize the external cost of carbon emissions from exports, thereby improving the allocation efficiency of environmental resources. This is also the application of the “Pigou tax” (Pigou, 1924 [1]), which was expanded from the theoretical basis of externalities (Marshall, 1890 [2]). Nordhaus (2021) [3] proposed a global climate policy and constructed a “climate club”, where members agreed to deeply reduce carbon emissions and unanimously imposed tariff penalties on non-club members. This is actually a further optimization of the carbon tariff policy, which is aimed at avoiding “setting trade barriers in the name of protecting environment”.
The current academic research on carbon tariffs mainly includes the following two aspects: First, several studies discuss the legitimacy of carbon tariffs. Lin et al. (2012) [4] found that carbon tariffs can lead to higher carbon emission reduction costs and carbon leakage rates, and their contribution to world carbon dioxide emission reduction is relatively low compared to other equivalent measures, thereby denying the rationality of carbon tariffs as a tool for emission reduction. Zhu (2015) [5] discussed the legality of carbon tariffs under the General Agreement on Tariffs and Trade 1994 (GATT 1994) based on the legal text of the World Trade Organization Dispute Resolution Body. Böhringer et al. (2016) [6] believed that carbon targets might lower the cost of reductions in world carbon emissions by inducing unregulated regions to adapt emission controls. The second is to study the impact of carbon tariff implementation on the economy and trade. A large number of research results indicate that the economic and trade losses caused by carbon tariffs will outweigh the gains. McKibbin et al. (2009) [7] used the Computable General Equilibrium (CGE) model to analyze the economic and environmental effects of carbon tariffs. The results showed that for most traded goods, the carbon tariff policy had limited effects on carbon emission reduction, and the policy reduced global trade volume, thereby reducing world gross domestic product (GDP). Pan (2012) [8] analyzed the impact mechanism of carbon tariffs on export trade, and found that due to the limited level of technological innovation and capital stock, the environmental regulation policies implemented by developing countries under the pressure of carbon tariffs did not produce positive effects. Septiyas et al. (2019) [9] used the GTAP-E model to explore the impact of China’s coal import tariffs on the global economy and carbon dioxide emissions, and found that coal import tariffs can lead to trade bias and trade depression. While Burniaux et al. (2013) [10] used the CGE model to assess the impact of carbon border adjustment taxes (BTAs) on the global economy, he pointed out that even though the economic effects of BTAs vary somewhat depending on how they are implemented, their welfare impact is typically small, and slightly negative at the world level.
For a long time, academia has generally “attached importance to industry and despised agriculture” in the research on carbon tariffs. Most scholars have focused their research on traditional high-energy-consuming industries such as the mining industry and manufacturing. In fact, China’s agriculture has deviated from the traditional perception of “low-carbon industries”. The development of modern agriculture is accompanied by the extensive use of pesticides, fertilizers, and agricultural machinery, which has gradually made China’s agriculture one of the “high carbon industries with high emissions, high pollution, and high energy consumption”, further enhancing the characteristics of high-carbon emissions. In recent years, some research has also begun to focus on the carbon emissions of agriculture. For example, Huang et al. (2019) [11] evaluated the implied carbon emissions from China’s agriculture, and Wen et al. (2022) [12] also elaborated on the spatiotemporal evolution characteristics and sources of agricultural carbon emissions in China. The above studies have concluded that China’s agriculture is gradually entering a high-carbon industry. With the gradual expansion of international trade in agricultural products and the increasingly serious problem of agricultural carbon emissions, agriculture will also be deeply affected by carbon tariffs, like other high-carbon industries.
Summing up the relevant research literature, it can be found that the research on the impact of carbon tariffs on the economy and trade still has the following shortcomings: First, the research on carbon tariffs in early articles focused on high-energy-consuming economic sectors, while the research on relatively low-energy-consuming agricultural products was less. Second, most of the studies on carbon tariffs were distributed in 2010–2013, and few papers analyzed carbon tariffs from the perspective of the “Belt and Road”. Thirdly, there are still few studies on the dynamic simulation of the forward-looking economic impact of carbon tariff implementation.
On 28 March 2022, China issued the Opinions on Jointly Building the “Belt and Road” Green Development, which pointed out that we should strengthen green trade cooperation, optimize trade structure, and develop high-quality green product trade. It can be seen that in the future, carbon tariffs will have an important and far-reaching impact on China’s agricultural trade. Agricultural issues are not only concerned by China, but also by countries along the “Belt and Road”. Research by Sun et al. (2022) [13] shows that both political and economic risks of a country will seriously affect the agricultural product trade. In February 2022, Russia and Ukraine, as major agricultural producers and members of the “Belt and Road” initiative, had a military conflict, and many countries were tightening food exports, which caused a worldwide food crisis. Under the complex international situation, the research on agricultural trade has profound practical significance.
We have constructed a theoretical model of the impact of carbon tariffs on agricultural trade, and selected the United States, European Union and Japan as mock objects to impose carbon tariffs.. In this scenario, we will comprehensively discuss the impact of carbon tariffs on China’s agricultural trade. The reasons why we chose the United States, the European Union and Japan as mock objects are as follows: In recent years, China’s agricultural exports to the United States, the European Union and Japan have also gradually increased. According to China’s customs statistics, from 2002 to 2019, China’s agricultural exports to the European Union increased by 4.9 times; the average annual growth rate is 11%. The average annual growth rate of China’s agricultural exports to the United States reached 2.7%, and China’s agricultural trade with Japan continued to grow. Under the influence of the COVID-19 pandemic, China’s agricultural exports to the United States, Europe and Japan continued to grow from January to August 2022 (Figure 1). The above facts indicate that China’s agricultural trade cooperation with the United States, the European Union, and Japan is very close. In addition, Europe is one of the first regions in the world to propose carbon tariffs; once European and American countries impose carbon tariffs on China, it will have a significant impact on China’s agricultural trade. Thus, we selected the United States, Europe and Japan as mock objects.
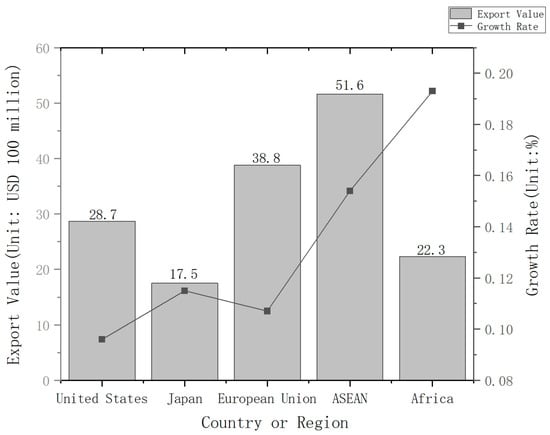
Figure 1.
China’s agricultural export value from January to August 2022. Data source: General Administration of Customs of China.
The issue of hidden carbon in agriculture has increasingly become a focus of attention in the field of carbon research. The impact of carbon tariffs imposed by Europe and America on China will become increasingly significant as bilateral agricultural trade continues to grow. The specific impacts include:
(1) Carbon tariffs may increase the cost of Chinese agricultural exports, making them less competitive in European and American markets. (2) Due to the decline in competitiveness of agricultural products, China may need to find alternative markets for its agricultural products, thereby increasing trade activities with countries without carbon tariffs. (3) The carbon tariffs of European and American countries may encourage China to implement more sustainable and low-carbon agricultural reforms, which means reducing its carbon footprint through technological innovation. (4) If China considers carbon tariff measures to be trade protectionism, it will trigger bilateral trade disputes and further worsen trade relations.
Based on the above, will China’s agricultural trade be significantly affected by the implementation of carbon tariffs, like traditional high-carbon industries, or will the government take this opportunity to develop green agricultural product trade? During the short preparation period before the carbon tariff has been officially implemented, how should governments and enterprises prepare in advance? In the future complex and diverse tax environment, how will the government make decisions to minimize the negative impact of carbon tariffs? In order to solve the above-mentioned problems, this paper dynamically simulates the international macroeconomic environment in 2022, 2025 and 2030 from the perspective of the “Belt and Road” and uses the GTAP-E model with the carbon module for policy simulation to analyze the impact of carbon tariffs on China’s agricultural trade.
2. Mechanism Analysis of the Impact of Carbon Tariff on Agricultural Trade
2.1. Short-Term Inhibitory Effects on Export Terms of Trade
Carbon tariffs belong to border regulation taxes, and terms of trade are related to external prices. Therefore, when analyzing the impact of carbon tariffs on China’s agricultural product trade, it is necessary to understand their impact on the relative supply and demand of world agricultural products as a function of external prices.
We refer to the standard trade model mentioned by Krugman (2007) [14] to explore the short-term impact of carbon tariffs on China’s agricultural export terms of trade, as shown in Figure 2. In this model, Krugman measures the improvement or deterioration of terms of trade by increasing or decreasing the ratio of a country’s export to the price of imported goods. In Figure 2, the horizontal axis represents the relative supply and demand of agricultural products in the world market, and the vertical axis represents the relative prices of agricultural products in the world market, that is, the terms of trade of world agricultural products. represents the relative supply curve of world agricultural products, and represents the relative demand curve of world agricultural products. 1 represents the situation where carbon tariffs are not imposed, and 2 represents the situation where carbon tariffs are imposed. “Point 1” indicates the equilibrium point of the world agricultural market when carbon tariffs are not imposed, and the corresponding terms of trade for agricultural products in the world market are .
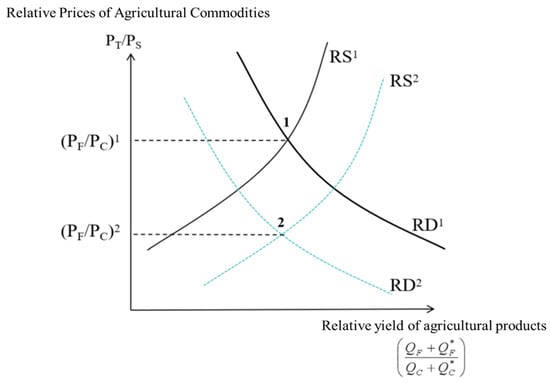
Figure 2.
Impact of carbon tariffs on terms of trade of agricultural products.
Assuming that a 20% carbon tariff is imposed on countries importing Chinese agricultural products, the relative prices of agricultural products faced by producers and consumers in that country will be 20% higher than those in the international market. In the short term, for any given relative price of world agricultural products, producers in the importing country will tend to produce more agricultural products and reduce consumption of imported agricultural products. Therefore, if the world market is considered as a whole, when the relative prices of world agricultural products are fixed in the short term, the relative supply of world agricultural products will increase (from to , as shown in Figure 2), while the relative demand will decrease (from to ). Obviously, the relative price of world agricultural products will decrease from to the corresponding relative world price corresponding to the new equilibrium point. Therefore, the terms of trade of China’s agricultural products have deteriorated, while the terms of trade of importing countries improved.
The impact of carbon tariffs on the terms of trade of agricultural products depends on the size of the economies of countries that impose carbon tariffs relative to the rest of the world. If a small country imposes a carbon tariff, it will have a small impact on the relative supply and demand of the world and will not have a serious impact on the terms of trade. If large economies such as the United States and Europe impose high-carbon tariffs on agricultural products, it will have a serious impact on agricultural exporting countries. According to the “2021 Global Economic and Trade Friction Index Report” released by the China Council for the Promotion of International Trade, the global economic and trade friction indexes of large economies such as the United States and the European Union are all at high levels, and the issuance of trade measures is more frequent and concentrated. Therefore, in our empirical test, we intend to select economically powerful countries for policy simulation.
2.2. Price Effect on Exported Agricultural Products
According to tariff theory, setting tariff barriers on export products will affect their export prices. Due to China’s huge influence on the world market, once encountering carbon tariffs, the domestic price of its agricultural products will decrease from to . Additionally, the world price will change from to , and these two changes occur simultaneously. Therefore, China’s export tariff was borne by domestic exporters, and the income from carbon tariff was taken by the importing country. As shown in Figure 3, if developed countries such as the United States impose carbon tariffs on China’s agricultural exports, China faces a net welfare loss of , where is the total of producer surplus and consumer surplus value, and is the welfare gained from the improvement of terms of trade.
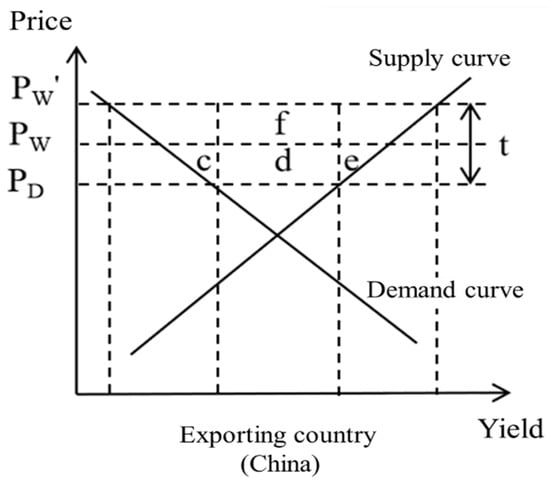
Figure 3.
Partial equilibrium analysis of China’s export carbon tariff.
2.3. Scenario Assumption of the Impact of Taxation on Chinese Agricultural Products
The impact mechanism mainly includes the following aspects:
Firstly, carbon tariffs have led to an increase in the cost of China’s agricultural exports. After European and American countries impose carbon tariffs, the cost of China’s agricultural exports to these countries will increase. This is because the production and transportation of Chinese agricultural products will generate a certain amount of carbon emissions, which will be subject to carbon tariffs. In the context of rising export costs, the competitiveness of Chinese agricultural products in the European and American markets will further weaken, leading to a decrease in Chinese agricultural product exports.
Secondly, carbon tariffs have exacerbated trade barriers for Chinese agricultural products in the European and American markets. European and American countries have relatively more trade restrictions on Chinese agricultural products. After imposing carbon tariffs, these restrictions will further intensify. This is because imposing carbon tariffs will affect the trade balance between China and European and American countries, leading to more trade restrictions and restrictions on Chinese agricultural products entering their markets.
Thirdly, carbon tariffs affect the production and transportation patterns of Chinese agricultural products. In order to reduce carbon emissions, China’s agricultural production and transportation models need to be improved, which will lead to more investment in technology and equipment, thereby increasing the production cost of Chinese agricultural products.
3. Policy Simulation of the Impact of Carbon Tariffs on China’s Agricultural Trade
3.1. Models and Methods
When discussing the economic impact of carbon emissions, most studies have used the general equilibrium method for policy simulation. Lin et al. (2010) [4], using the CGE trade model from a competitiveness perspective, found that carbon tariffs can cause industrial restructuring and market share changes in developing countries, and lead to carbon leakage. Babatunde et al. (2017) [15] conducted empirical tests with large amounts of data and believed that CGE was crucial in addressing climate change mitigation issues at national, regional, and global levels. Most studies focused on carbon taxes, emission reduction targets, emissions trading, renewable energy, energy efficiency, and the impact of carbon capture and storage on economic development and climate policy. Some studies also simulated China’s response measures. Hübler (2012) [16] analyzed the contractive and convergent climate system in the CGE model, including international capital flows and technology diffusion, and found that when China did not participate in the system and imposed carbon tariffs on Chinese exports, the negative impact was greater, while the comparative effect in other developing countries was not significant. Zhang et al. (2019) [17] set up a dual policy between China and the United States, that is, imposing carbon tariffs and taxes simultaneously. It was found that China’s adoption of the same carbon tariff policy as the United States to respond to the corresponding policies of the United States is not significantly effective, while adopting domestic carbon tax policies can effectively reduce carbon emissions. Zhu et al. (2020) [18] used the GTAP-E model to test whether China responded to the threat of carbon tariffs from the United States by imposing differentiated or homogeneous carbon tariffs. The results showed that the negative impact of adopting differentiated carbon tax policies between China and the United States was far less than the same carbon tariff measures.
The advantage of the Computable General Equilibrium (CGE) method is that it takes the economic system as a whole and considers the interactions between different sectors and economic variables. The GTAP model (Global Trade Analysis Project, GTAP) developed under the leadership of Thomas Hertel’s team is one of the more widely used models. It adopts a global closure approach to macroeconomics and solves nonlinear equations by linearizing them [19]. However, the standard GTAP model is difficult to consider the changes in carbon emissions, so we plan to select the GTAP-E model for empirical research. The GTAP-E model was created by Bumiaux et al. (2002) [20] based on the improvement in the energy module of the standard GTAP model. It is an important application of the GTAP model in energy policy. Compared to the traditional GTAP model, the GTAP-E model incorporates energy as a factor input into the production structure. The GTAP-E model uses the fixed substitution elasticity CES function to reflect the price changes caused by carbon taxes and adds carbon tax variables and carbon dioxide emission modules. Therefore, the GTAP-E model can better study international trade and environmental policy issues.
3.2. Simulation Scheme Design
3.2.1. Conversion of Carbon Tariffs into ad Valorem Taxes
The specific derivation formula is as follows:
Although the GTAP-E model includes the carbon tax impact indicator related to carbon emissions, it does not set a separate carbon tariff. Through the previous analysis, we can consider the carbon tariff as a special import tariff. Therefore, we will convert the carbon tariffs levied from volume into ad valorem taxes that can be brought into the simulation calculation of the GTAP-E model.
The specific derivation formula is as follows:
where represents the carbon tariff standard imposed per ton of carbon, represents the CIF price of goods exported by China to country , represents the carbon emission intensity of industry , and the multiplication of the three variables is the total amount of carbon tariffs imposed by country on goods , .
Similarly, the total carbon tax amount can also be expressed as a multiplication of three variables, including the market value of the product exported by China to country (including import tariffs), the intensity of the import tariffs imposed by country on the Chinese product , and the percentage change in tariff intensity .
Therefore, it can be concluded that:
Additionally, because the intensity of the import tariffs equals the market price of goods divided by the CIF price of goods :
The simplified formula can be obtained as follows:
The specific values of and can be obtained from the GTAP-E database. In addition, with reference to Zhu (2010) [21], we calculate the carbon dioxide emission intensity of each industrial sector. In many studies, the carbon tariff rate ranges from 30 to 60 USD /ton of carbon dioxide. Based on this, we select 60 USD /ton of carbon dioxide, and the specific calculation values are as Table 1 (the tariff is converted at the exchange rate of 7.5 RMB/USD in 2007):

Table 1.
Calculation results of carbon tariff and valorem tax rate.
3.2.2. Dynamic Recurrence of Economic Variables
Given that the base period of the GTAP 10th edition database used is 2014, this paper intends to use the Walmsley dynamic recursive method to simulate the baseline scenarios for 2022 to 2030, respectively [22]. In the benchmark scheme, this paper uses the global forecast data of the French Center for International Economic Research (CEPII) recommended by the GTAP official website to adjust the changes in macroeconomic indicators such as national economy (GDP), capital stock, population, skilled and unskilled labor force during this period.
Walmsley (2000) [23] pointed out that this program takes macro and policy forecasts as input. Although its case is designed with the GTAP model, it can be generally used with other models because it only focuses on the standard macro aggregation. With reference to the calculation method of Walmsley, projections for capital stocks (Kt(r)) were determined by adding projected gross domestic investment (GDI(r)) to the previous years’ projected capital stock (Kt−1(r)) less depreciation. Among them, the predicted values of capital stock and its growth rate of all countries and years include gross domestic product (GDP), GDI, and population.
Kt(r) = Kt−1(r) × (1 − DEPR(r)) + GDI(r)
The forecast of the total labor force will distinguish the skilled labor force from the unskilled labor force, corresponding to the expected number of people receiving tertiary and secondary education. This is found by multiplying the projected share with the projected labor force, where i is used to distinguish tertiary education from secondary education.
SKLABt(i,r) = KLABSHRt(i,r) × LABt(r)
3.2.3. Simulation Policy Settings
Country Grouping
As analyzed above in this paper, only large economies that impose high-carbon tariffs on agricultural products will have a serious impact on agricultural-product-exporting countries. Therefore, this paper proposes to group 141 countries in the GTAP10A database according to Table 2.
Table 2.
Classification of countries (regions) in this study.
Industrial Grouping
The GTAP-E model expands the energy module of the standard GTAP model, so this paper divides the energy sectors such as coal mining, crude oil, natural gas mining, petroleum products, and electric power into separate groups, while the agricultural sector is divided into nine groups according to the categories of rice, grain, and oil. As this paper focuses on simulating and testing the macro impact of carbon tariffs on agricultural trade, the empirical results for non-agricultural sectors will not be displayed. The specific industry groupings are shown in Table 3.
Table 3.
Classification of the industrial sectors in this study.
Scenario Grouping
Due to the recursive economic index changes in 2022, 2025, and 2030 in this paper’s simulation experiment, we plan to use the swap command to modify the default closure, so that different simulation scenarios are more in line with the economic operation rules. We set 2022 as a short-term closure, which means that the output of labor force remains unchanged and the actual wage of labor force is variable. We set the years 2025 and 2030 as a long-term closure, that is, the capital output remains unchanged and the return on capital is variable. S1, S2, and S3 in control group 1 are the scenarios where the United States, Japan, and Europe simultaneously impose carbon tariffs on China in 2022, 2025, and 2030, respectively. S3 and S4 in control group 2 are, respectively, scenarios in which the United States, Japan, and Europe impose carbon tariffs on China at the same time in 2030 and take into account the improvement in the trade facilitation level of the “Belt and Road” under the same conditions (for the convenience of presenting the data results below, the simulation time of this group is 2030). As S3 is included into both group 1 and group 2, its simulation results will be presented only once in the following tables. S5, S6, and S7 in control group 3 represent scenarios in which the United States, Japan, and Europe will impose carbon tariffs on China in 2025 (due to the highest simulation accuracy in 2025 when dynamic recursion is performed previously, the time for this group is set to 2025). The specific scenario assumptions are shown in Table 4.
Table 4.
Scenario assumptions.
4. Empirical Test of the Impact of Carbon Tariff on China’s Agricultural Trade
4.1. Impact on China’s Agricultural Product Trade
4.1.1. Impact on Output
Carbon tariffs will inhibit the international market demand for taxed products, thereby affecting the output of relevant taxed departments in the exporting country. The simulation results of the output changes in various sectors of agricultural products in China are as follows (Table 5):
Table 5.
Simulation results of output changes in agricultural products in China under different scenarios.
In control group 1 (scenarios S1, S2, and S3), the United States, Japan, and Europe simultaneously imposed carbon tariffs on China in the economic environment of 2022, 2025, and 2030. From a horizontal perspective, the output of most sectors decreased, with meat and other agricultural products experiencing the largest decline, reaching 0.14% and 0.19%, respectively, while the output of the oil, fruit and vegetable, and dairy products sectors increased, with the largest increase in oil production, reaching 14%. By 2030, the impact of carbon tariffs on the output of the agricultural sector will fluctuate smoothly. The output of rice, grains, tobacco, and aquatic products experienced such a great increment after the carbon tariff between S2 and S3, for the carbon intensity of these products is generally lower than that of other agricultural products. A carbon tariff would increase the cost of producing products with high-carbon emissions. As a result, producers have an incentive to shift production to products with lower carbon emissions. In this case, rice, grain, tobacco, and aquatic products are less carbon-intensive than other agricultural products and thus more attractive to producers after a carbon tariff, which could lead to a shift in the production for these products, further increasing their output.
In control group 2 (scenarios S3 and S4), the output of China’s agricultural product sectors changes in the opposite direction. After adding the influence factor of the “Belt and Road” trade facilitation level under the S4 scenario, the output of most agricultural product sectors increases, and only the output of oil and other agricultural products decreases, by 3.15% and 2.49%, respectively.
In control group 3 (scenarios S5, S6, and S7), the United States, Japan, and Europe imposed carbon tariffs on China, respectively. Regardless of which scenario, the output of most agricultural product sectors would decline, while only the outputs of oil, fruits and vegetables, and dairy products would not be affected by the carbon tariffs. Overall, the impact of carbon tariffs imposed by the United States on output is the largest, while Japan has the smallest impact.
4.1.2. Impact on the Import and Export Quantity of Agricultural Products
Carbon tariffs can lead to a general increase in the price of products on the international market and inhibit import demand. Therefore, under all scenarios S1–S7, the import volume of China’s various agricultural product industrial sectors has generally decreased, while the export volume shows different degrees of increase or decrease depending on the tax scenarios. The simulation results are shown in Table 6.
Table 6.
Simulation results of the changes in the import quantity of the main agricultural products in China under different scenarios (unit: %).
In control group 1 (Scenarios S1, S2, and S3), the import demand for rice, grains, meat, and dairy products decreased the most. It can be seen that the elasticity of demand for staple foods is relatively large, with the highest sensitivity to the international market price, while the elasticity of demand for tobacco, fruits and vegetables, and oil is relatively small, resulting in a smaller decline. From 2022 to 2030, the overall decline in the import volume of China’s agricultural products trade showed a trend of first increasing and then decreasing.
In control group 2 (scenarios S3 and S4), the import volume of China’s agricultural products in all sectors changes in the opposite direction, and the increase in scenario S4 is far greater than the decrease in scenario S3. On the one hand, it shows that carbon tariffs and the “Belt and Road” initiative have different economic impacts on China’s agricultural exports, and on the other hand, it reflects the huge economic and trade potential and economic benefits of the “Belt and Road” initiative. Among them, rice, grain, and meat have the most significant changes, all exceeding 10%, reflecting the large elasticity of demand for staple foods.
In control group 3 (scenarios S5, S6, and S7), the United States, Japan, and Europe imposed carbon tariffs on China, respectively. Overall, the imposition of carbon tariffs by the United States has the greatest impact on the import demand for Chinese agricultural products. Specifically, when the United States and Japan levy taxes, grain, meat, and other agricultural products have experienced the largest decline. When taxed by the European Union, rice, meat, and dairy products saw the largest declines. This reflects the different trade tendencies of agricultural products between China and the United States, Japan, and EU countries.
From Table 7, we can see that due to the imposition of carbon tariffs by developed countries, the prices of agricultural products in the international market have increased, and China’s import demand for most other agricultural products has been suppressed, while exports remain competitive. The degree of impact on exports is less than that on imports, and the overall performance is an increase in net exports. However, dairy products are highly dependent on the markets of developed countries, resulting in serious export barriers, which is reflected in the expansion of the trade deficit.
Table 7.
Simulation results of the export volume changes in China’s agricultural product industry under different scenarios (unit: %).
As shown in Table 8, China still maintains a trade surplus when only considering the carbon tariff element for the vast majority, which is consistent with the above analysis of imports and exports. Only when Japan imposes a carbon tariff (Scenario S6) will sectors such as rice, grain, and aquatic products experience trade deficits.
Table 8.
Simulation results of trade balance changes in various sectors of agricultural products in China under different scenarios (unit: USD million).
4.1.3. Impact on Export Price
As mentioned above, under the pressure of carbon tariffs, China has had to reduce its export prices to maintain its competitive advantage in the international market. Therefore, except for scenarios S3 and S4, the export prices of various sectors of China’s agricultural products have significantly decreased under other scenarios. Due to the slight impact of carbon tariffs on the import price of Chinese agricultural products, the simulation results will not be displayed. The simulation results are shown in Table 9.
Table 9.
Simulation results of changes in China’s agricultural product export market under different scenarios (unit: %).
In control group 1 (Scenarios S1, S2, and S3), the export markets of the rice and dairy sectors have always been severely compressed, and this trend has not improved over time. By 2030, the export shares of these two sectors will be decreased by 30.1405% and 25.7504%, respectively. At this time, agricultural products from these two sectors will be more likely to be sold in the domestic market. In the same control group, the export share of other agricultural product sectors fluctuated relatively smoothly, with fluctuations within 10%.
In control group 2 (scenario S3, S4), after adding the factor of the “Belt and Road” trade facilitation, the export share of China’s agricultural products in all sectors has significantly decreased. The reason is that the infrastructure construction promoted by the “Belt and Road” initiative has squeezed the export share of agricultural-product-related sectors.
In control group 3 (scenarios S5, S6, and S7), the United States, Japan, and Europe imposed carbon tariffs on China, respectively. Overall, the export share of Chinese agricultural products is most affected when Japan imposes carbon tariffs alone, followed by the United States, and the European Union has the smallest impact. This is quite different from the trend of other trade indicators mentioned above, which indicates that under this scenario, Chinese agricultural products are facing the greatest resistance to entering the Japanese market, and the share of rice exports has even decreased by 23.8046%. When the United States and Europe separately imposed carbon tariffs, the export share of most agricultural products increased slightly.
4.2. Impact on Macro-Economy
4.2.1. Impact on Social Welfare
Social welfare has always been the focus of discussions among scholars around carbon tariffs, and it is also an important consideration for countries when making economic decisions.
As can be seen from Table 10, in any case where carbon tariffs are imposed, China will suffer huge social welfare losses. From the perspective of control group 1 (scenarios S1, S2, and S3), the degree of social welfare losses in China has shown a trend of first increasing and then decreasing. In 2022, due to the implementation of carbon tariffs, some Chinese agricultural products with comparative advantages will flow to other international markets, and the United States, Japan, and Europe will also lose social welfare due to the imposition of carbon tariffs. By 2030, the social welfare of the United States, Japan, and Europe as economies that impose carbon tariffs will increase, while China’s social welfare has improved compared to the previous period, but it is still in the process of loss. From the perspective of control group 2 (scenarios S3 and S4), the trade facilitation brought by “the Belt and Road” will largely mitigate the impact of carbon tariffs. In addition, social welfare in the United States and the European Union will increase under all simulation scenarios, while social welfare benefits in Japan will be the least. From the perspective of control group 3 (scenarios S5, S6, and S7), the impact of the United States, Japan, and Europe on China’s social welfare is related to the volume of domestic economy and trade, that is, the United States imposing carbon tariffs alone causes the most severe welfare damage, followed by the European Union and Japan.
Table 10.
Simulation results of social welfare changes in different regions of the world under different scenarios (unit: USD million).
4.2.2. Impact on Terms of Trade
Terms of trade are macroeconomic indicators that measure the trade benefits of a country’s exports over imports over a certain period of time. Generally, when the ratio of export prices to import prices is higher than the base period, it can be considered that the terms of trade have improved, that is, fewer exports have been exchanged for more imports. From the simulation results of changes in terms of trade in various regions of the world (see Table 11), except for the S4 scenario, China is the country with the most severe deterioration in terms of trade in all other scenarios, indicating that under the pressure of carbon tariffs, China has had to reduce its export prices to maintain its competitive advantage in the international market, while almost all countries that impose carbon tariffs have improved their terms of trade. In general, the United States achieved the optimal improvement in terms of trade under most scenarios, but when the “Belt and Road” factor is added, its terms of trade deteriorated sharply, which is why the United States opposes the Paris Climate Agreement and the “Belt and Road” initiative.
Table 11.
Simulation results of changes in terms of trade in various regions of the world under different scenarios (unit: %).
Although “the Belt and Road” initiative has promoted the increase in agricultural exports in some cases, it has also led to trade imbalances in some countries. This can be attributed to the following reasons. First, “the Belt and Road” initiative has promoted the construction of transport infrastructure in countries along the line, which makes it easier for countries to export agricultural products to other countries. Secondly, the facilitation of imported goods has also increased the country’s dependence on imports, which may be beneficial for export-oriented countries. Third, “the Belt and Road” initiative has increased competition in emerging markets, making it more challenging for individual countries to maintain or increase market share. In short, “the Belt and Road” initiative will, on the one hand, promote the growth of agricultural exports, and on the other hand, will readjust the import and export trade system, and ultimately achieve trade balance.
Through the analysis of the above policy simulation results on social welfare and terms of trade, we can find that with the development of China’s economic and trade level, the negative impact of carbon tariffs on China’s macroeconomic indicators will gradually weaken. At the same time, the in-depth development of the “Belt and Road” initiative in recent years also provides a good buffer opportunity for China to deal with the carbon game. Comparing the policy simulation results of carbon tariffs imposed by the United States, Japan, and Europe under different scenarios, Japan has the smallest profit, and in individual scenarios, its economy and trade may even be adversely affected. From this perspective, some carbon tariff advocates may need to re-examine the advantages and disadvantages of their carbon regulation policies in the new international environment.
4.3. Impact on Carbon Emissions
The previous section mainly explained the economic indicators that affect China’s agricultural trade. The GTAP-E model adds indicators for regional carbon emissions based on the basic GTAP model. The simulation results of the total carbon emission changes in various regions of the world are shown in Table 12. In control group 1 (scenarios S1, S2, S3), by 2025, carbon tariffs will have a significant effect on reducing emissions in all regions of the world. China, as a country subject to carbon tariffs imposed by other countries, will reduce carbon emissions by 0.18%, while Japan, the European Union, and countries along the “Belt and Road” will also reduce carbon emissions by more than 0.10%. From this perspective, carbon tariffs have a certain contribution to global carbon emissions reduction. In control group 2 (scenarios S3 and S4), after adding the factor of the “Belt and Road” trade facilitation, global carbon emissions increased slightly, because the “Belt and Road” initiative promoted infrastructure construction to some extent, which led to the development of some high-carbon industries, and offset the emission reduction effect of some carbon tariffs under the scenario setting of this paper. In control group 3 (scenarios S5, S6, and S7), the emission reduction effects of imposing carbon tariffs alone in the United States and Europe are almost the same, while the emission reduction effects of imposing carbon tariffs alone in Japan are limited, and on the contrary, carbon emissions in some countries will slightly rebound.
Table 12.
Simulation results of carbon emissions in different regions of the world under different scenarios (unit: %).
5. Conclusions and Policy Recommendations
5.1. Conclusions
This paper constructs a theoretical model, which is the impact of carbon tariffs on agricultural trade. Based on scenario analysis and quantitative simulation, we calculated the impact of carbon tariffs on China’s agricultural trade under different scenarios, and reached the following conclusions:
First, imposing carbon tariffs will affect China’s agricultural trade. Carbon tariffs will suppress international demand, which will lead to a reduction in the output of most taxed agricultural products. Under long-term closure, carbon tariffs lead to an increase in international market prices, which leads to an overall decline in the import volume of Chinese agricultural products, while the export volume varies depending on policy scenarios. Under the pressure of carbon tariffs, China will reduce the main agricultural product’s FOB prices to ensure that their CIF prices can maintain a competitive advantage in the international market after increasing the cost of carbon tariffs, and the market share of China’s agricultural products exported to recipient countries will decline. The market share of China’s agricultural products exported to the receiving countries will decline, and these products will flow to non-taxed countries and regions.
Secondly, the “Belt and Road” initiative has a two-way impact on carbon tariff policy. On the one hand, actively promoting the improvement of trade facilitation under “the Belt and Road” framework can alleviate the negative impact of carbon tariffs on China’s agricultural trade, and at the same time have a certain effect on stabilizing China’s agricultural output and trade prices. On the other hand, the “Belt and Road” initiative will also have an impact on the market share of China’s agricultural products. The huge trade potential will increase the production and export of China’s agricultural products, thus increasing carbon emissions. Therefore, while promoting trade cooperation with countries along the “Belt and Road”, China should continue to promote the development of green agriculture.
Finally, there is heterogeneity in the impact of carbon tariffs imposed by the United States, Japan, and Europe on Chinese agricultural products. The impact of carbon tariffs imposed by the United States on China’s agricultural trade is the largest, followed by the European Union, and Japan has the smallest impact. Affected by the balance of the global market, the imposition of carbon tariffs by the United States, Japan, and Europe will also have a negative impact on themselves, with Japan suffering the greatest negative reaction and the EU suffering the smallest loss.
5.2. Policy Recommendations
To address the impact of carbon tariffs imposed by other countries on China’s agricultural trade, the following aspects can be taken into account:
After countries around the world proposed carbon-neutrality goals, carbon has changed the comparative advantage of Chinese agricultural products. Therefore, China should actively adapt to the changing trend of the international market environment, develop green agriculture under the “Belt and Road” initiative, apply low-carbon emission reduction technologies in agriculture, promote low-carbon transformation of agricultural products, and improve the quality of export products.
The imposition of carbon tariffs by developed economies has increased the pressure on China’s agricultural exports, and China should consider expanding other parts of international markets. Implementing a diversified market strategy can help spread the risk of carbon tariffs. The ongoing conflict between Russia and Ukraine, two major agricultural exporting countries, has weakened their dominant position in the global food production chain to varying degrees. As the global grain market pattern changes, China should improve the share of the world grain market, as a major country, China should maintain the food security of countries along the “Belt and Road” and stabilize the regional food supply chain. At present, China’s major agricultural export countries include Japan, South Korea, Vietnam, Thailand, Malaysia, the Philippines, and Indonesia, all of which are partners of the “Belt and Road” initiative. China can carry out all-round agricultural trade cooperation with these countries, steadily promote the green development of countries along the “Belt and Road”, and build green silk roads.
China should improve its domestic carbon tax mechanism as soon as possible, minimize the impact of carbon tariffs, and make full use of market mechanisms to adjust the allocation of agricultural resources in the long term to promote the development of low-carbon agriculture. At the same time, it is necessary to establish the “carbon label” for agricultural products, which is conducive to tracing the “carbon footprint” of agricultural products. Agricultural enterprises should increase the investment in technological innovation; optimize agricultural industrial chains and supply chains; and build a production system with green, low-carbon, and circular development. China can establish low-carbon agricultural parks and zero-carbon agricultural parks, making full use of the Internet of Things technology to achieve a precise carbon reduction in agricultural production.
Author Contributions
Conceptualization, F.Y. and C.Z.; methodology, F.Y. and C.Z.; software, C.L. and C.Z.; validation, C.L. and C.Z.; formal analysis, F.Y. and C.Z.; investigation, C.L. and C.Z.; resources, F.Y. and C.Z.; data curation, C.L. and C.Z.; writing—original draft preparation, F.Y. and C.Z.; writing—review and editing, F.Y. and C.Z.; visualization, C.L. and C.Z.; supervision, F.Y.; project administration, F.Y.; funding acquisition, F.Y. All authors have read and agreed to the published version of the manuscript.
Funding
This research was funded by the Humanities and Social Science Foundation of the Ministry of Education of China (Grant No. 21YJC790142).
Institutional Review Board Statement
Not applicable.
Data Availability Statement
The data presented in this study are available on demand from the corresponding author at (tylct@stu.xmu.edu.cn).
Acknowledgments
We would like to express our sincere gratitude to the editor and anonymous referees for their insightful and constructive comments. Especially we would like to appreciate the experts who participated in the evaluation and improvement of this manuscript.
Conflicts of Interest
The authors declare no conflict of interest.
References
- Pigou, A.C. The economics of welfare. Macmillan 1924, 2, 202–210. [Google Scholar]
- Marshall, A. Principles of Economics: Unabridged Eighth Edition; Cosimo. Inc.: New York, NY, USA, 2009. [Google Scholar]
- Nordhaus, W. Dynamic climate clubs: On the effectiveness of incentives in global climate agreements. Proc. Natl. Acad. Sci. USA 2021, 118, e2109988118. [Google Scholar] [CrossRef] [PubMed]
- Boqiang, L.; Aijun, L. What is the Rationality of Carbon Tariff? Econ. Res. 2012, 11, 118–127. [Google Scholar]
- Zhu, Z. A discussion on the legitimacy of carbon tariffs under the WTO. J. WTO China 2015, 5, 86. [Google Scholar]
- Böhringer, C.; Carbone, J.C.; Rutherford, T.F. The strategic value of carbon tariffs. Am. Econ. J. Econ. Policy 2016, 8, 28–51. [Google Scholar] [CrossRef]
- McKibbin, W.J.; Wilcoxen, P.J.; Braathen, N.A.; Levinson, A. The Economic and Environmental Effects of Border Tax Adjustments for Climate Policy [with Comments]//Brookings Trade Forum; Brookings Institution Press: Washington, DC, USA, 2008; pp. 1–34. [Google Scholar]
- Hui, P. The impact of carbon tariffs on China’s export trade and countermeasures. Chinese Population. Resour. Environ. 2012, 22, 41–46. [Google Scholar]
- Septiyas Trisilia, M.; Widodo, T. Impacts of China Coal Import Tariff against US on Global Economy and CO2 Emissions. Available online: https://ideas.repec.org/p/pra/mprapa/91231.html (accessed on 7 January 2019).
- Burniaux, J.M.; Chateau, J.; Duval, R. Is there a case for carbon-based border tax adjustment? An applied general equilibrium analysis. Appl. Econ. 2013, 45, 2231–2240. [Google Scholar] [CrossRef]
- Huang, X.; Xu, X.; Wang, Q.; Zhang, L.; Gao, X.; Chen, L. Assessment of agricultural carbon emissions and their spatiotemporal changes in China, 1997–2016. Int. J. Environ. Res. Public Health 2019, 16, 3105. [Google Scholar] [CrossRef] [PubMed]
- Wen, S.; Hu, Y.; Liu, H. Measurement and Spatial–Temporal Characteristics of Agricultural Carbon Emission in China: An Internal Structural Perspective. Agriculture 2022, 12, 1749. [Google Scholar] [CrossRef]
- Sun, Q.; Hou, M.; Shi, S.; Cui, L.; Xi, Z. The Influence of Country Risks on the International Agricultural Trade Patterns Based on Network Analysis and Panel Data Method. Agriculture 2022, 12, 361. [Google Scholar] [CrossRef]
- Krugman, P.R.; Obstefeld, M.; Melitz, M.J. International Finance: Theory and Policy; Pearson Educ: New York, NY, USA, 2018. [Google Scholar]
- Babatunde, K.A.; Begum, R.A.; Said, F.F. Application of computable general equilibrium (CGE) to climate change mitigation policy: A systematic review. Renew. Sustain. Energy Rev. 2017, 78, 61–71. [Google Scholar] [CrossRef]
- Hübler, M. Carbon tariffs on Chinese exports: Emissions reduction, threat, or farce? Energy Policy 2012, 50, 315–327. [Google Scholar] [CrossRef]
- Zhang, L.; Jiang, D.; Imran, M. Feasibility analysis of China’s carbon taxation policy responding to the carbon tariff scheme of USA. Carbon Lett. 2019, 29, 99–107. [Google Scholar] [CrossRef]
- Zhu, N.; Qian, L.; Jiang, D.; Mbroh, N. A simulation study of China’s imposing carbon tax against American carbon tariffs. J. Clean. Prod. 2020, 243, 118467. [Google Scholar] [CrossRef]
- Hertel, T.W. Global Trade Analysis: Modeling and Applications; Cambridge University Press: Cambridge, UK, 1997. [Google Scholar]
- Burniaux, J.M.; Truong, T.P. GTAP-E: An energy-environmental version of the GTAP model. GTAP Tech. Pap. 2002, 18, 1–30. [Google Scholar]
- Qirong, Z. Research on CO2 Emissions in China’s Export Trade. China Ind. Econ. 2010, 38, 55–64. [Google Scholar]
- Ianchovichina, E.; Walmsley, T.L. Dynamic Modeling and Applications for Global Economic Analysis; Cambridge University Press: Cambridge, UK, 2012. [Google Scholar]
- Walmsley, T.; Dimaranan, B.; McDougall, R. A Base Case Scenario for the Dynamic GTAP Model. Available online: https://citeseerx.ist.psu.edu/document?repid=rep1&type=pdf&doi=4969ddfad892e23bc47882a34a81ad2cb859930b (accessed on 1 July 2000).
Disclaimer/Publisher’s Note: The statements, opinions and data contained in all publications are solely those of the individual author(s) and contributor(s) and not of MDPI and/or the editor(s). MDPI and/or the editor(s) disclaim responsibility for any injury to people or property resulting from any ideas, methods, instructions or products referred to in the content. |
© 2023 by the authors. Licensee MDPI, Basel, Switzerland. This article is an open access article distributed under the terms and conditions of the Creative Commons Attribution (CC BY) license (https://creativecommons.org/licenses/by/4.0/).