Article

SSR and SNP Marker-Based Investigation of Indian Rice Landraces in Relation to Their Genetic Diversity, Population Structure, and Geographical Isolation

1
Division of Genomic Resources, ICAR-National Bureau of Plant Genetic Resources, New Delhi 110012, India
2
Division of Plant Exploration and Germplasm Collection, ICAR-National Bureau of Plant Genetic Resources, New Delhi 110012, India
3
Division of Germplasm Evaluation, ICAR-National Bureau of Plant Genetic Resources, New Delhi 110012, India
4
ICAR-Central Institute for Subtropical Horticulture, Rehmankhera, P.O Kakori 226101, India
5
ICAR-Indian Institute of Wheat and Barley Research, GaehoonVihar, Karnal 132001, India
6
International Crops Research Institute for Semi-Arid Tropics, Patancheru, Hyderabad 502324, India
7
ICAR-National Institute for Plant Biotechnology, New Delhi 110012, India
*
Author to whom correspondence should be addressed.
Agriculture 2023, 13(4), 823; https://doi.org/10.3390/agriculture13040823
Submission received: 30 January 2023 / Revised: 14 March 2023 / Accepted: 29 March 2023 / Published: 3 April 2023

Abstract

:
India is blessed with an abundance of diverse rice landraces in its traditional cultivated areas. Two marker systems (simple sequence repeats (SSR) and single nucleotide polymorphism (SNP)) were used to study a set of 298 rice landrace accessions collected from six different regions of India (Andaman and Nicobar Islands, Chhattisgarh, Jharkhand, Uttar Pradesh, Uttarakhand, and West Bengal). Thirty hyper-variable simple sequence repeats (HvSSRs) and 32,782 single nucleotide polymorphisms (SNPs) were used in inferring genetic structure and geographical isolation. Rice landraces from Uttar Pradesh were the most diverse, with a gene diversity value of 0.42 and 0.49 with SSR and SNP markers, respectively. Neighbor-joining trees classified the rice landraces into two major groups with SSR and SNP markers, and complete geographical isolation was observed with SSR markers. Fast STRUCTURE analysis revealed four populations for SSR markers and three populations for SNP markers. The population structure with SSR markers showed that few individuals from Uttarakhand and Andaman and Nicobar Islands were grouped in small clusters. Population structure analysis with SNP markers showed not very distinct region-wise clustering among the rice landraces. Discriminant analysis of principal components (DAPC) and minimum spanning network (MSN) using SSR markers showed region-wise grouping of landraces with some intermixing, but DAPC and MSN with SNP markers showed very clear region-wise clustering. Genetic differentiation of rice landraces between the regions was significant with both SSR (Fst 0.094–0.487) and SNP markers (Fst 0.047–0.285). A Mantel test revealed a positive correlation between the genetic and geographic distance of rice landraces. The present study concludes that rice landraces investigated in this study were very diverse, and unlinked SSR markers show better geographical isolation than a large set of SNP markers.

1. Introduction

Population growth, disordered environmental conditions, and declining agricultural resources have a profound impact on world agricultural resources. The current global yield in major crops such as rice, wheat, and maize is not sufficient to meet the food demand for the next few years [1]. In the current scenario, the genetic improvement of rice plays a very important role [2]. Landraces exhibit vast genetic diversity as elite cultivars (or commercial cultivars), and they represent an intermediary stage in domestication between wild rice and the elite [3,4]. Landraces are defined as geographically distinct populations which are very diverse in their genetic composition, and they are identifiable by their unique morphologies [5]. Landraces are a rich source of genetic variation in attributes such as high grain quality, strong environmental tolerance, wide adaptability, and disease and insect resistance. They form a repository of gene pools which can be useful if brought into domestication. Characterization of rice landraces has shown good genetic differentiation and local adaptation [6,7,8]. The genetic diversity of improved varieties has been shaped due to breeding, but insights into the genetic diversity of landraces remain unfulfilled [3,9]. Displacement of landraces by improved varieties has threatened their conservation. This rich diversity has been declining in phases due to the use of high-yielding varieties. Social and demographic forces have added to this declining trend [7]. The need to characterize available landraces has therefore become very important for further utilization and conservation.
Molecular markers allow accurate and fast varietal identification and have proven to be an efficient tool for crop germplasm characterization and studying population structure. Among the available molecular marker systems, simple sequence repeats (SSRs) and single nucleotide polymorphisms (SNPs) display high allelic variance between organisms. Studies of SSRs have been reported in many crops showing high genetic variability, e.g., maize [10], wheat [11], grape [12], potato [13], rape [14], and rice [15]. SSR markers are low in price, easy to use, and provide high degrees of polymorphism, but for high throughput genotyping, assays of SNPs are found to be useful. This is because SNPs are found in abundance and have a bi-allelic nature, which makes them a basis for superior and highly informative genotyping assays. The two main high-multiplexing SNP genotyping systems being utilized today are genotyping by sequencing (GBS) and high-density array-based SNP detection [16]. Although GBS is highly efficient and cost-effective, its experimental operation involves extensive data analysis that is beyond the capabilities of an average rice breeding group. High-density arrays, however, can be utilized to quickly genotype several common SNPs across samples with relatively easy data analysis, but they are expensive [17]. Molecular makers have been applied in crops such as cotton, and multiplex marker-assisted assays have been developed for the early detection of pathogens [18]. Similarly, using informative biomarkers, useful volatiles have been identified in bananas [19]. This shows the potential and application of molecular markers.
In the present study, Indian rice landraces collected from six different states were used to study the genetic diversity, population structure, and geographical isolation using SSR and SNP markers.
Here, we have addressed the following objectives: (1) to decipher the genetic diversity and population structure of rice landraces of different geographical regions and (2) to provide useful information regarding the differences in outputs obtained with SSRs and SNPs while studying genetic variance.

2. Materials and Methods

2.1. Plant Materials

A panel of 298 rice landraces collected from five different states and one union territory of India was constituted for this study. These five states comprise Chhattisgarh (44 landraces), Jharkhand (23 landraces), Uttar Pradesh (47 landraces), Uttarakhand (138 landraces), West Bengal (34 landraces), and one union territory, i.e., Andaman and Nicobar Islands (12 landraces). Information regarding the locations from where the sample was collected, its latitude, and longitude are listed in Supplementary Table S1 (five accessions were in replicates). These locations have been depicted in the Indian subcontinent map as shown in Figure 1. These landraces were collected independently from the abovementioned geographical locations and were assigned indigenous collection numbers by the National gene bank, ICAR-NBPGR (New Delhi, India).

2.2. DNA Extraction

Seeds were collected from different regions and placed in separate packets and stored in a 4 °C refrigerator. Eight to ten seeds were carefully placed on seed germination paper of size 30 × 45 cm with a gap of 2 to 3 cm. The germination paper was folded properly and kept in a germination tray with a water level of up to three centimeters. These trays were placed in a growth chamber at 28 °C and 90% relative humidity. Rice landraces were grown in batches of six for two weeks, taking each region’s accessions at a time to avoid confusion. Fresh leaves were collected, and DNA isolation was conducted simultaneously. Storing leaf samples in deep freezers was avoided to get maximum yield and good-quality DNA. DNA isolation was conducted using the CTAB method [20]. DNA quality was assessed on a 0.8% agarose gel and quantified using a nanodrop spectrophotometer (NanoDrop Thermo Scientific, Waltham, MA, USA).

2.3. Genotyping of Rice Landraces Using SSR Markers

For initial screening and profiling, 120 highly variable simple sequence repeat markers (HvSSR) [21] with repeat lengths of 51–70 bp were chosen from all twelve rice chromosomes. With a few rice samples, gradient PCR (polymerase chain reaction) was used to set each primer’s amplification temperature (Ta). Out of 120 HvSSR primers, thirty primers exhibiting good amplification were chosen for the final study. To create working stocks of 10 ng/µL, the genomic DNA of all 298 rice landraces was diluted. The PCR reaction was run in a total volume of 10 µL, containing 2 µL of genomic DNA (10 ng/µL), 1 µL of 10X buffer, 0.8 µL of 25 mM MgCl2, 0.2 µL of 10 mM dNTPs, 0.2 µL of each primer (10 nmol), 0.2 µL of Taq DNA polymerase (Thermo Scientific), and 5.6 µL of distilled water. The following procedure was used for amplification in a thermocycler: initial denaturation at 94 °C for 5 min, followed by 36 cycles of 94 °C for 30 s, Ta for 45 s, 72 °C for 1 min, and final extension at 72 °C for 10 min. PCR products were checked on 4% metaphor agarose. The gel was run for 3–4 h, and gel pictures were recorded using a Gel Documentation System.

2.4. Genotyping of Rice Landraces Using SNP Markers

Axiom OsSNPnks 96 array was used to genotype the same set of 298 rice DNA samples. A specially created 50 K SNP chip was used for high-throughput genotyping. The chip was based on single-copy genes and covered all 12 rice chromosomes with an average distance of less than 1 kb between adjacent SNP markers. The procedures for DNA amplification, fragmentation, chip hybridization, single-base extension through DNA ligation, and signal amplification were carried out as described by Singh et al. [16].

2.5. Genetic Diversity Indices and Population Differentiation Using SSR Markers

PowerMarker (V3.25) [22] was used to analyze the results of SSR data to calculate major allele frequency, observed heterozygosity, gene diversity, and PIC (polymorphic information content). Genetic distances [23] of each genotype were computed, and a neighbor-joining (NJ) tree was generated and visualized using iTOL v3 (http://itol.embl.de, accessed on 17 November 2022) [24]. To infer historical origin, fastSTRUCTURE [25] was used, which provides clusters of related genotypes. In fastSTRUCTURE, each individual was run from K = 1 to K = 10 with ten iterations being used for each run. The best K was estimated using an online available tool Structure Selector [26]. Here, the method of cluster determination by Puechmaille 2016 [27] was used, which has four alternative K estimators: the MaxMedK (the maximum of medians), the MaxMeaK (the maximum of means), the MedMedK (the median of medians), and the MedMeaK (the median of means). The analysis was carried out regardless of the individuals’ geographical origin.

2.6. SNP Filtering, Genetic Diversity Indices, and Population Differentiation Using SNP Markers

The results obtained from 50,051 SNP markers were filtered for minor allele frequency (MAF) <5% and maximum missing sites per SNP >20%. After filtration, 32,782 markers were obtained, and further analysis was conducted with the same set of markers. These 32,782 markers comprised 14,454 CSCWR (conserved single-copy genes common to wheat and rice)-based SNP markers, 17,011 SCR (single-copy genes unique to rice)-based SNP markers, 987 AGCR (agronomically important cloned rice genes)-based SNP markers, and 330 MCR (multi-copy rice genes)-based SNP markers. The extent of polymorphism, observed heterozygosity, nucleotide diversity, and PIC for the SNP markers were computed using the R package Poppr [28]. The neighbor-joining tree was constructed using Tassel v5 [29], and the tree was visualized using iTOL v3 (http://itol.embl.de, accessed on 17 November 2022) [24]. To infer historical origin, fastSTRUCTURE [25] was used, and several genetic clusters (K) were identified; each individual was run from K = 1 to K = 10 with 10 iterations for each population. The best K was estimated using an online available tool Structure Selector [26].

2.7. Discriminant Analysis of Principal Components (DAPC)

Discriminant analysis of principal components (DAPC) was used to analyze population differentiation of 298 rice landraces using both SSR and SNP markers. DAPC uses K-means clustering based on the genetic distance to identify the groups to which each individual belongs. The optimum number of clusters was estimated using Bayesian information criterion (BIC). The DAPC analysis was conducted using the R package Adegenet [30].

2.8. Analysis of Molecular Variance of 298 Rice Landraces Using SSR and SNP Markers

Analysis of molecular variance (AMOVA) between the fastSTRUCTURE populations and between the original geographic populations was performed using R packages. The data set was sorted according to populations obtained in fastSTRUCTURE, converted to Hap Map, and then converted to vcf format using PLINK. AMOVA was conducted using the “Poppr” package [28]. “Poppr” was also used to construct the minimum spanning network (MSN) based on a simple dissimilarity coefficient without assuming any evolutionary hierarchy.

2.9. Study of the Index of Differentiation (Fst) and Mantel Test

Genetic differentiation between the regions with SSR markers was assessed using GenAlex 6.501 [30], and Vcf tools [31,32] were used to test genetic differentiation using SNP markers. To evaluate the relationship between geographic distance and genetic distance, a Mantel test was conducted using GenAlex 6.501 [30] with both marker systems.

3. Results

3.1. Study of Genetic Diversity Parameters of 298 Rice Landraces

The genetic diversity of rice landraces was assessed using thirty HvSSR markers and 32,782 SNP markers distributed across the genome. The values of diversity parameters of the total collection using SSR markers are summarized in Supplementary Table S2, and SNP markers are summarized in Supplementary Table S3. SSR marker HvSSR11-21 on chromosome 11 gave the highest gene diversity value of 0.842. SNP marker AX-95952669 on chromosome 5 gave the highest Shannon diversity value of 0.909. SSR marker HvSSR11-58 on chromosome 11 gave the highest heterozygosity value of 0.77, and SSR marker HvSSR11-25 on chromosome 11 gave the highest PIC of 0.82. The highest PIC of 0.624 and the highest heterozygosity of 0.499 with SNP markers were given by five and three different markers, respectively, listed in Supplementary Table S3. Region-wise average diversity parameters, i.e., major allele frequency, gene diversity, Shannon diversity, heterozygosity, and PIC, were calculated and summarized in Table 1. With SSR markers, the highest value of major allele frequency was 0.80 (Uttarakhand) and the lowest was 0.67 (Uttar Pradesh). The highest value of gene diversity was 0.42 (Uttar Pradesh), and the lowest value was 0.26 (Uttarakhand). The highest value of heterozygosity was 0.30 (Chhattisgarh) and the lowest was 0.10 (West Bengal). The highest value of PIC was 0.38 (Uttar Pradesh) and the lowest was 0.21 (Uttarakhand). With SNP markers, the highest value of major allele frequency was 0.45 (Andaman) and the lowest was 0.42 (Chhattisgarh and Jharkhand). The highest value of Shannon diversity was 0.49 (Uttar Pradesh, Uttarakhand, and West Bengal), and the lowest value was 0.47 (Jharkhand). The highest value of heterozygosity was 0.81 (Andaman) and the lowest was 0.67 (West Bengal). The highest value of PIC was 0.37 (Andaman, Uttar Pradesh, West Bengal, and Uttarakhand) and the lowest was 0.36 (Chhattisgarh and Jharkhand). Landraces from Uttar Pradesh seemed to be the most diverse, as they had the highest diversity value with both SSR and SNP markers. The lowest diversity was observed with landraces from Uttarakhand (0.26 with SSR markers) and Jharkhand (0.47 with SNP markers). The observed PIC values showed both sets of markers to be informative regarding the genetic diversity of the landraces. Genetic differentiation or pairwise Fst values for six geographic populations ranged from 0.094 (Chhattisgarh/Jharkhand) to 0.487 (Chhattisgarh/Uttarakhand) with SSR markers (Supplementary Table S4). Pairwise Fst values ranged from 0.047 (Chhattisgarh/UP) to 0.285 (Andaman/Jharkhand) with SNP markers (Supplementary Table S5). Genetic differentiation is an important indicator of differences between individuals of two different populations; here the values indicate substantial differences between populations, indicating that the individuals from the different regions are different from each other.

3.2. Genetic Relatedness Study of Rice Landraces Using SSR Markers

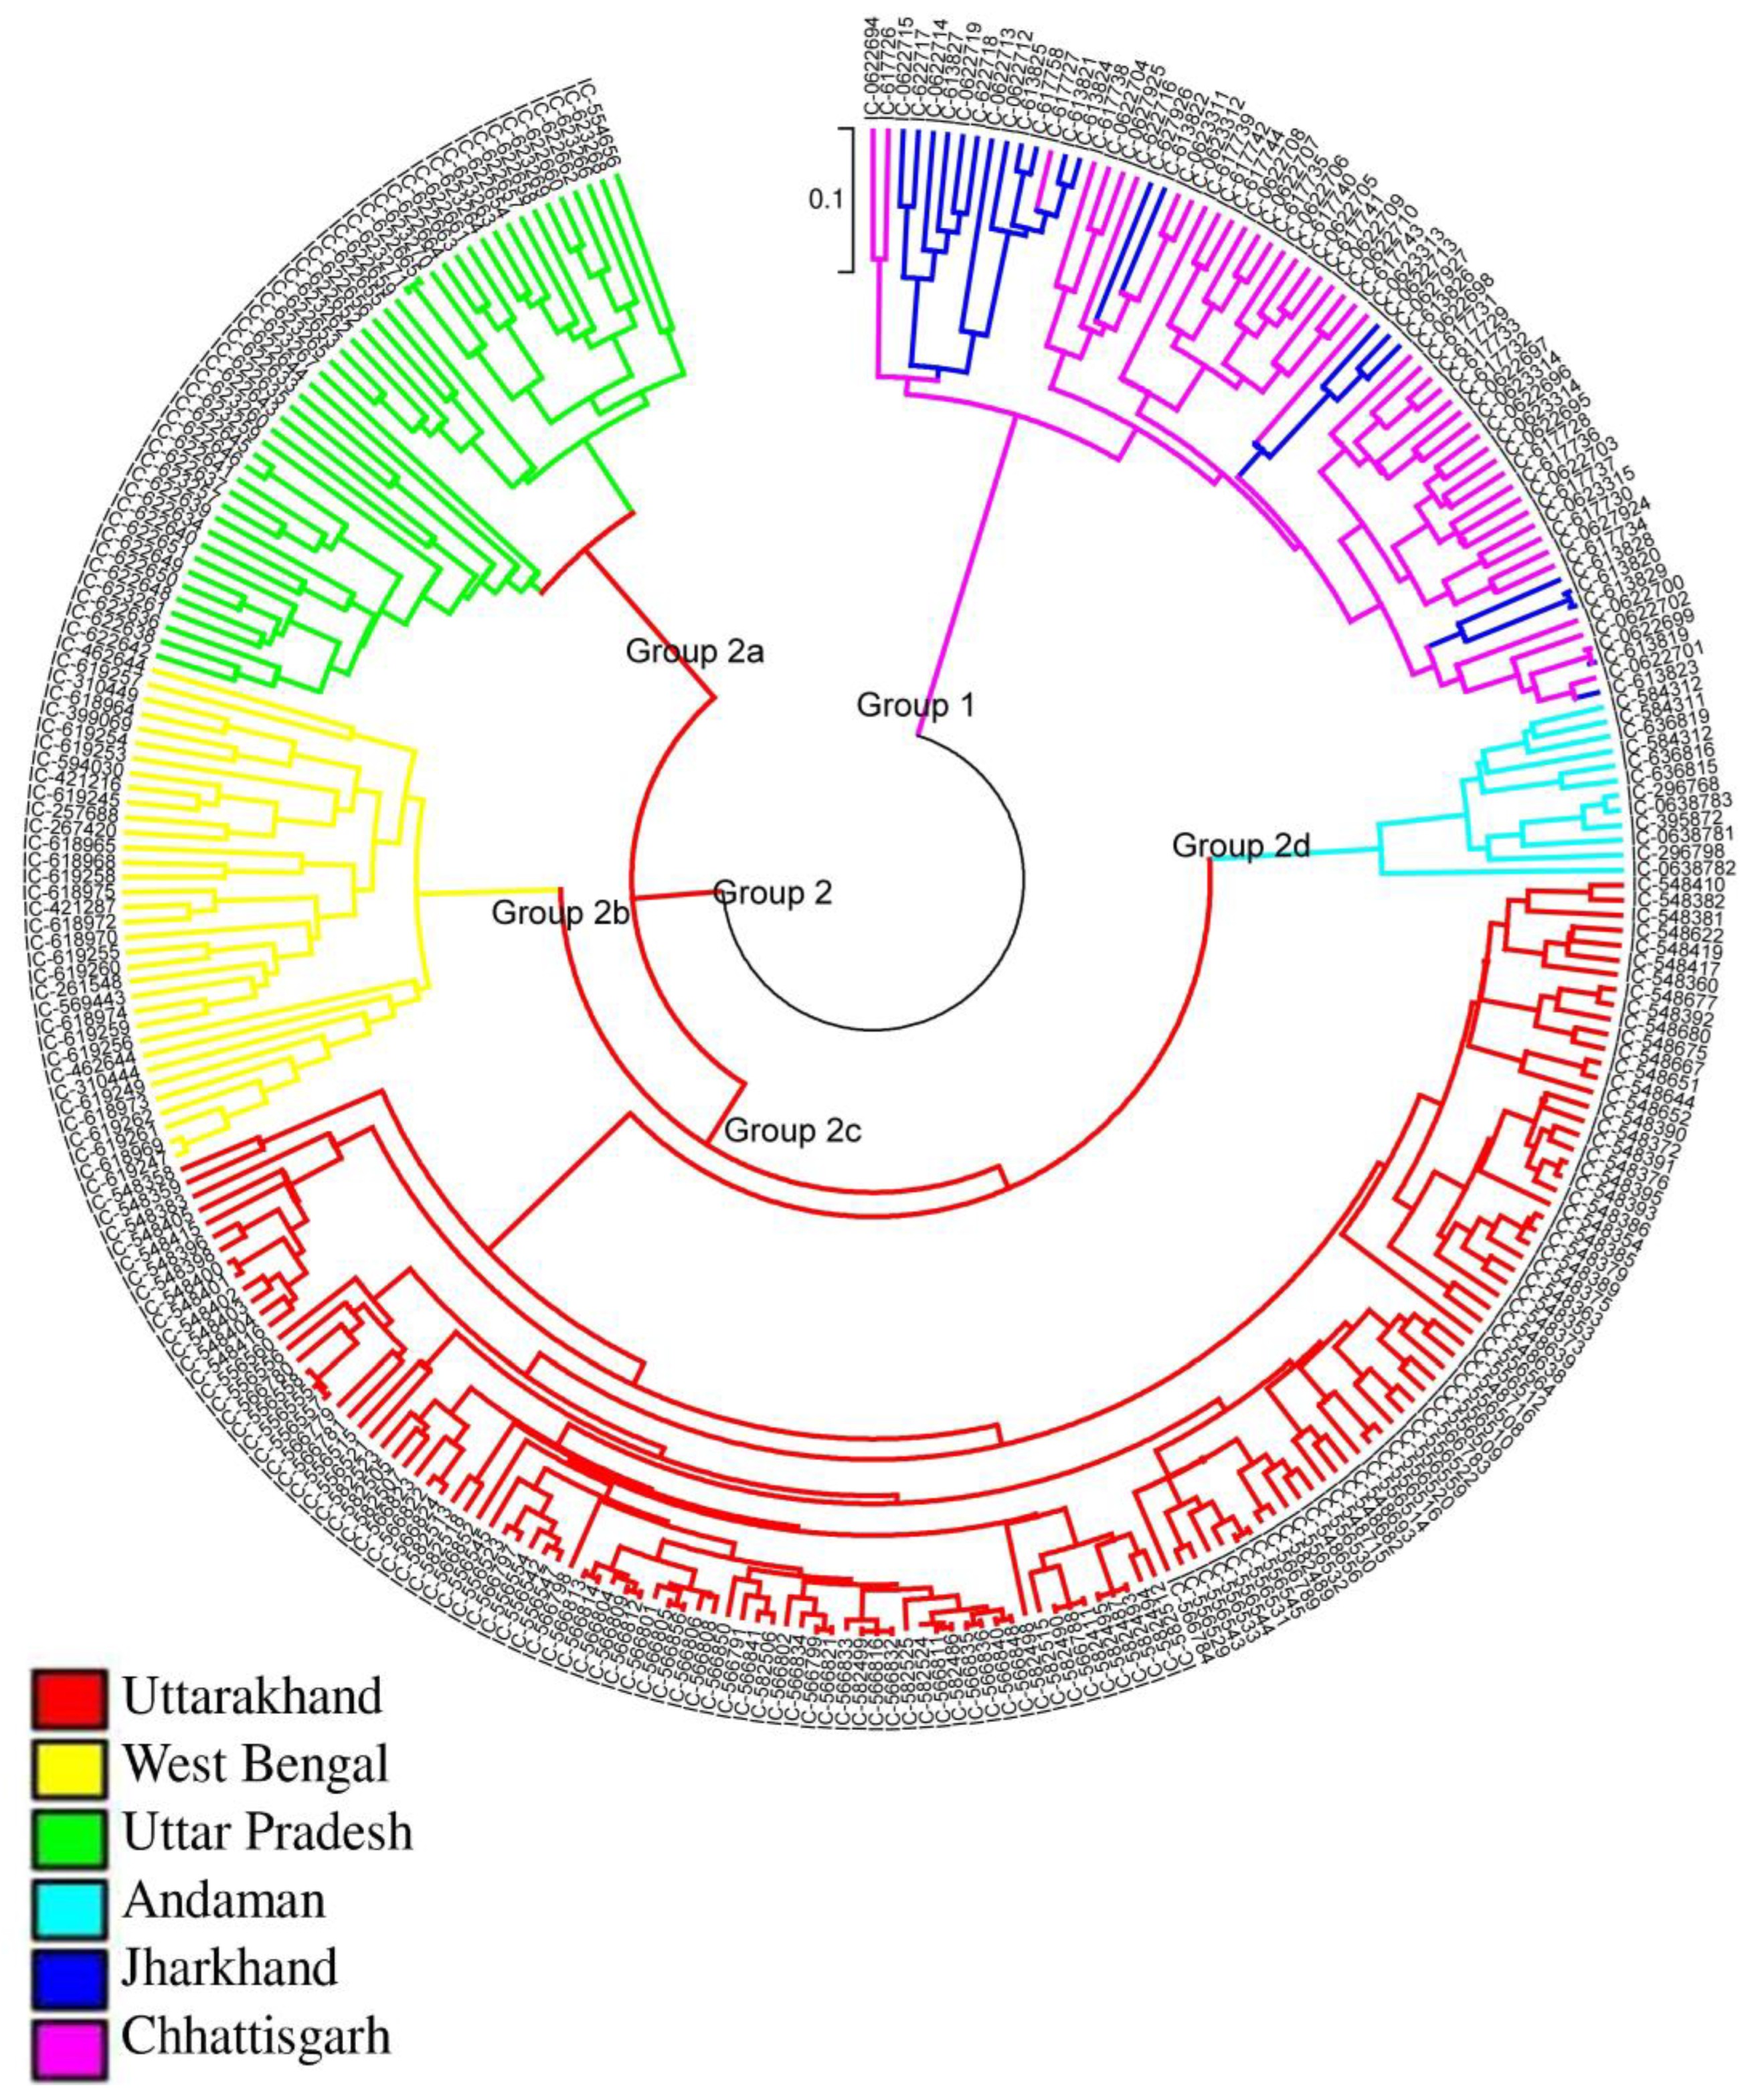
The unrooted NJ tree of rice landraces with SSR markers showed two major groups (Figure 2). In group 1, all landraces were from Jharkhand and Chhattisgarh. For group 2, after being further divided into subgroups, it was observed that landraces were being grouped according to their respective geographical locations. Group 2a had landraces from Uttar Pradesh. Group 2b had landraces from West Bengal. Group 2c had landraces from Uttarakhand, and group 2d had landraces from Andaman. There was no intermixing among landraces of different regions except for landraces from Chhattisgarh and Jharkhand, which came in the same group possibly due to the close proximity of these two regions (Figure 1). Therefore, SSR markers were able to make a distinction between landraces according to their geographical location.

3.3. Study of Genetic Relatedness of Rice Landraces Using SNP Markers

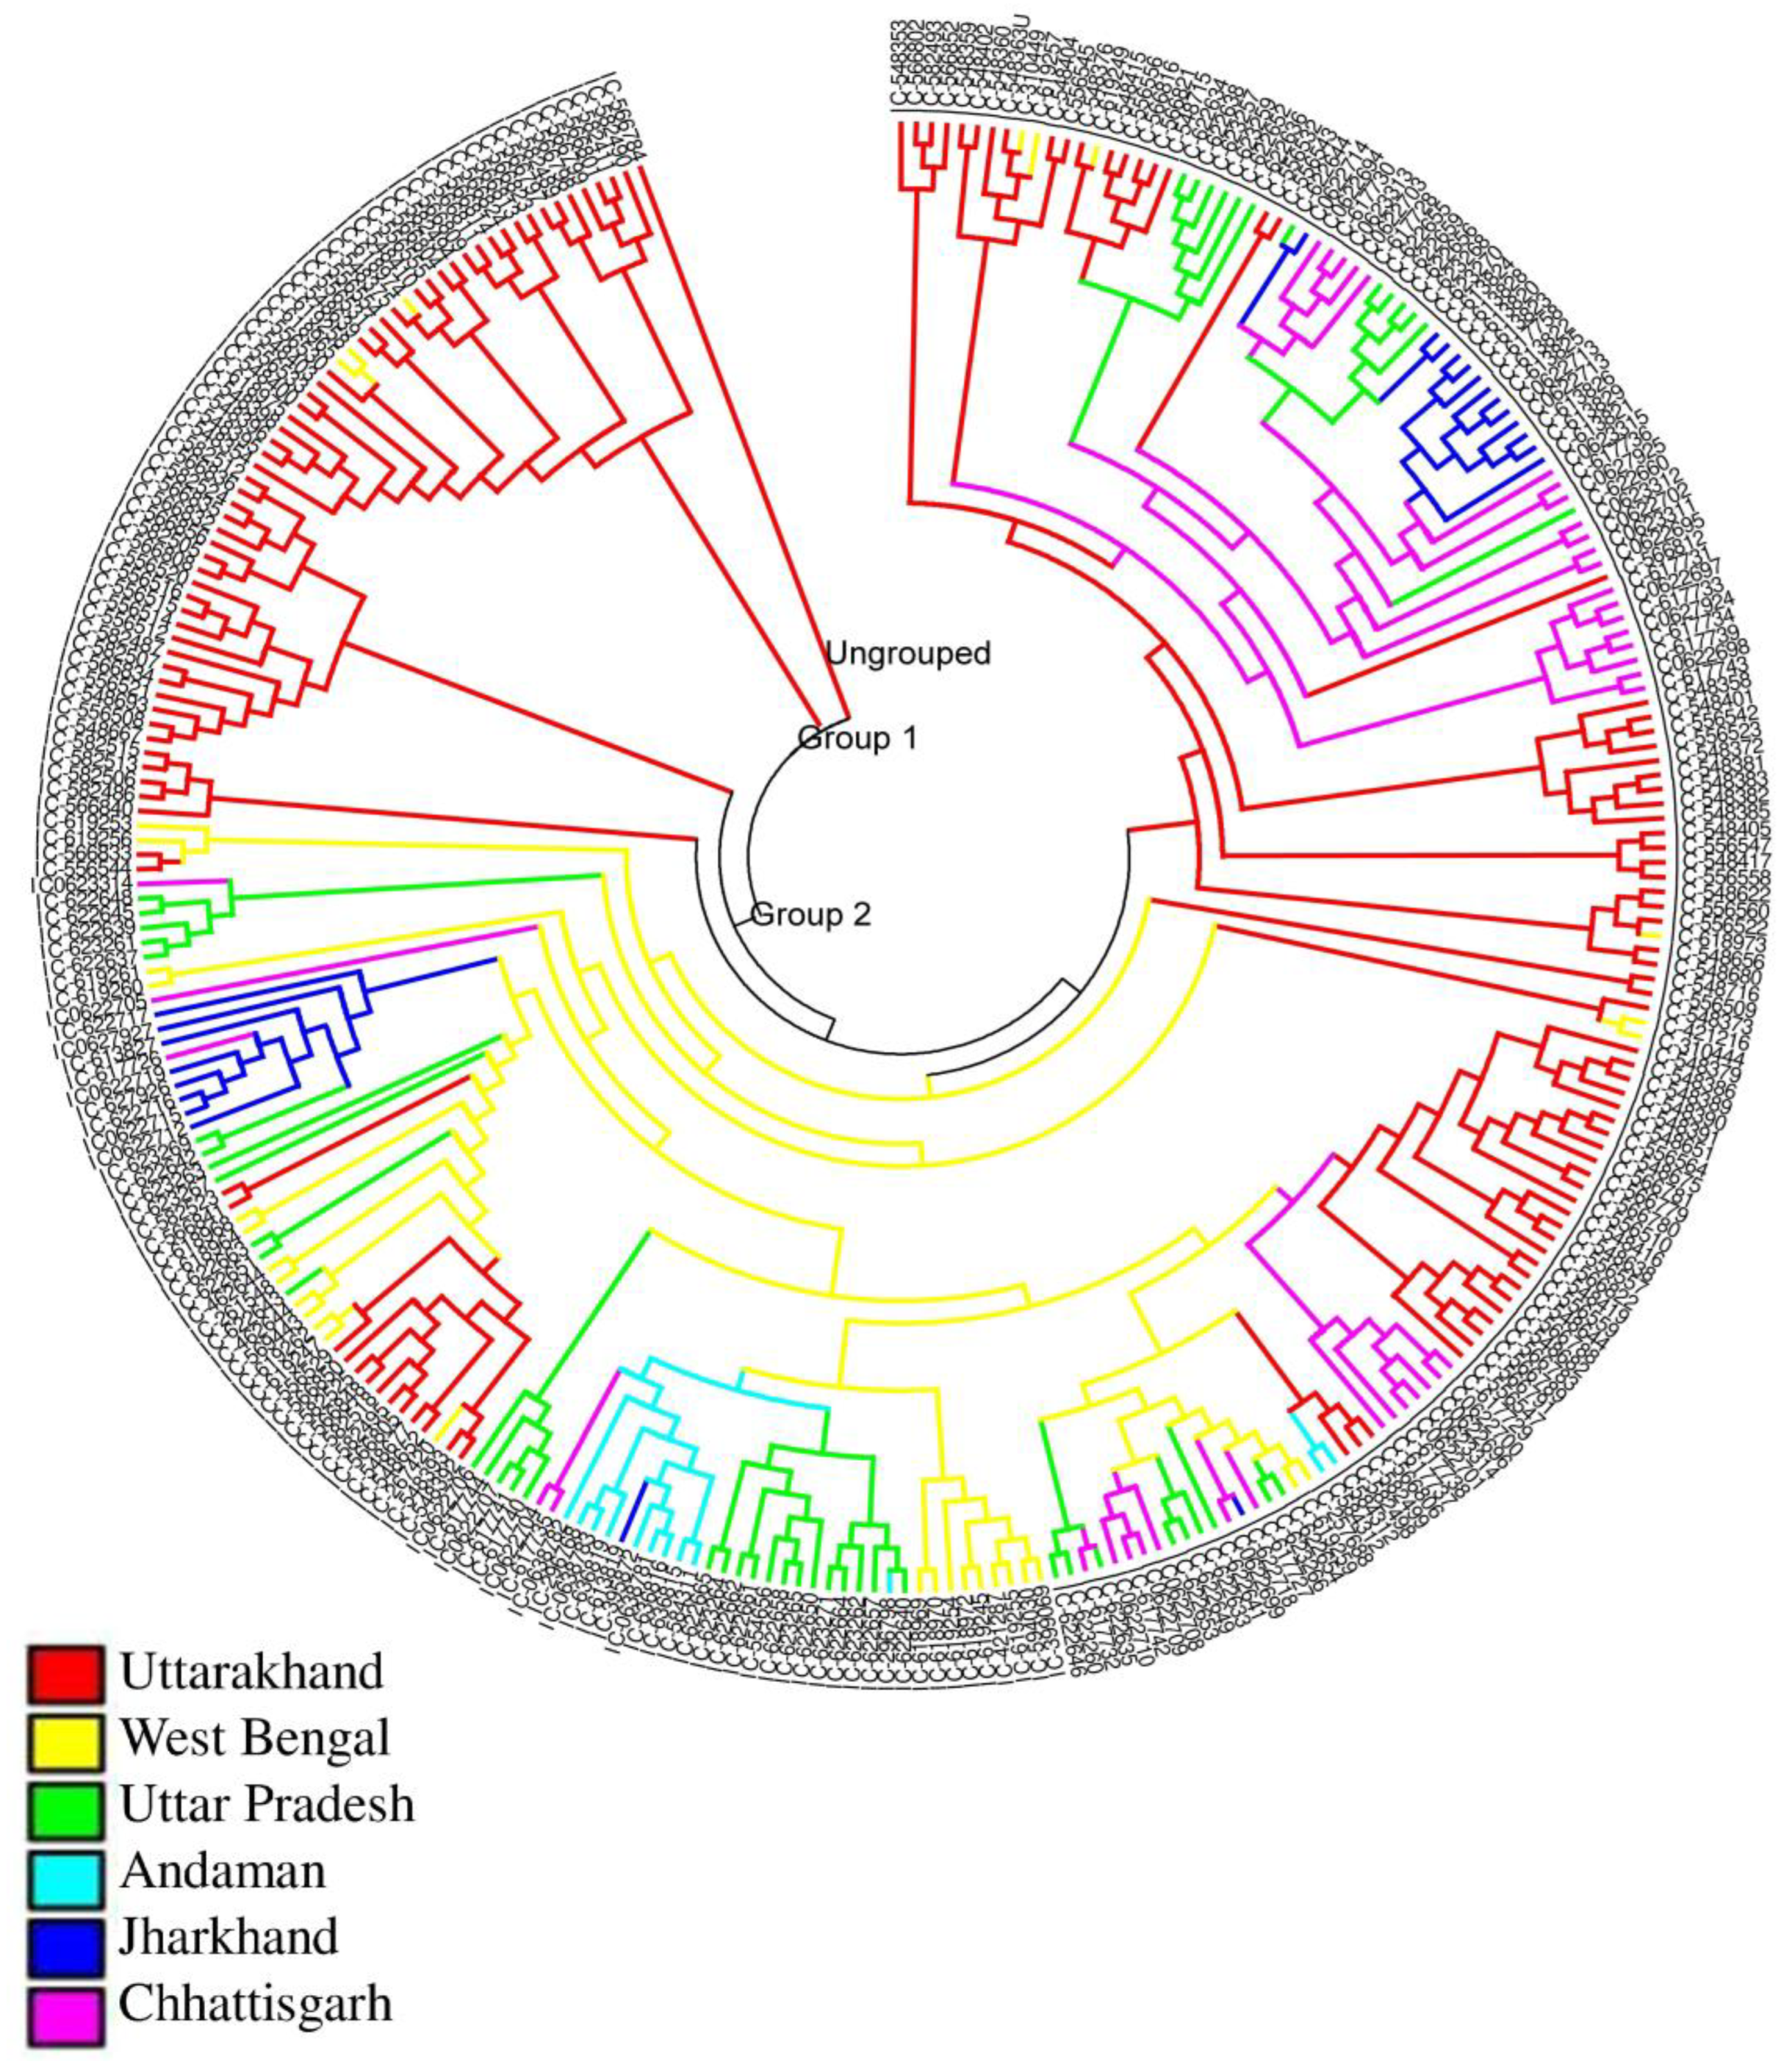
The unrooted NJ tree of 298 rice landraces using SNP markers formed two major groups and one ungrouped landrace from Uttarakhand (Figure 3). Group 1 had 33 landraces, which are from Uttarakhand and West Bengal, and group 2 had 264 landraces from all other regions. Individuals from Uttarakhand, Andaman, Jharkhand, and Uttar Pradesh were found to make small, scattered clusters in group 2. To study the grouping pattern of individuals with 32,782 SNP markers and with their four categorically divided SNP markers, the NJ tree was constructed using (i) 14,454 CSCWR (conserved single-copy genes conserved to wheat and rice) (Supplementary Figure S1), (ii) 987 AGCR (agronomically important cloned rice genes) (Supplementary Figure S2), (iii) 17,011 SCR (single copy genes unique to rice) (Supplementary Figure S3), and (iv) 330 MCR (multi-copy rice genes)-based markers (Supplementary Figure S4). Phylogenetic analysis with CSCWR SNP markers showed three groups. Group 1 and group 2 comprised landraces from Uttarakhand. In group 3, landraces from Uttarakhand were found in scattered clusters having few to a large number of individuals in one cluster. An AGCR SNP-based tree showed three groups. Group 1 and group 2 comprised landraces from Uttarakhand (except one landrace from West Bengal). Group 3 had landraces from all the regions. Individuals from Uttarakhand, i.e., IC-566809, IC-566811, IC-566813, IC-566823, IC-566814, and IC-566824, were common in group 1 of the AGCR SNP-based NJ tree and group 2 of the CSCWR SNP-based NJ tree. All these individuals were from the Pithoragarh district of Uttarakhand. Major individuals from Uttarakhand of group 3 of the CSCWR SNP-based NJ tree and AGCR SNP-based NJ tree showed a similar pattern of grouping. A few landraces (IC-622640, IC-622657, IC-623262, IC-622664, IC-623271, IC-622650, IC-622661, and IC-622662) from Uttar Pradesh in group 3 of the CSCWR SNP-based NJ tree, the AGCR SNP-based NJ tree, and in group 2 of the SCR SNP-based NJ tree were found to make a small cluster. The clustering pattern of Uttarakhand landraces reveals genetic similarity among them.
Phylogenetic analysis of SCR SNP-based markers and MCR SNP-based markers showed two groups and one ungrouped individual (IC-566784 from Uttarakhand). Group 1 of the SCR-based NJ tree and group 2 of the MCR-based NJ tree had few landraces from Uttarakhand in common (IC-566823, IC-566813, IC-566824, IC-566814, IC-566811, IC566809, IC-556554, IC582494, IC-566804, IC-582490, IC-582411, IC-566801, IC-566799, IC-582489, IC-566798, IC-566797, IC-566832, and IC-566856). These landraces were from Pithoragarh, Bageshwar, Uttarkashi, Champawat, and Tehri districts. Few individuals from Jharkhand (IC-613824, IC-613828, IC-613820, IC-613823, IC-617758, IC-613822, IC-613825, IC-613826, IC-613829, and IC-613821) were found to group in CSCWR, AGCR, SCR, and MCR SNP-based NJ trees. Additionally, individuals from Andaman (IC-584311, IC-636815, IC-636816, IC-0638781, IC-0638783, and IC-296768) were found to group in CSCWR, AGCR, SCR, and MCR SNP-based NJ trees. Some Uttar Pradesh rice germplasm (IC-622640, IC-622657, IC-623262, IC-623271, IC-622650, IC-623265, IC-622658, IC-554656, IC-622661, IC-622662, IC-623264, and IC-622665) were found to group in CSCWR, AGCR, SCR SNP-based trees.
Phylogenetic analysis showed that SSR markers were better at differentiating landraces according to their geographical locations, although SNP markers also showed region-wise clustering to a lesser extent. However, the relative utility of both SSRs and SNPs depends on the goals of the study, the availability of genetic resources, and the number of individuals sampled.

3.4. Population Structure Differentiation Using SSR Markers

To determine the genetic link between individual rice landraces, fastSTRUCTURE analysis was conducted. Optimal genetic clusters were visualized in Structure Selector, which suggested four clusters (populations) within the set rice landraces (Figure 4). In the fastSTRUCTURE bar plot, population 1 (individuals in red) had 45 landraces with 44 pure and 1 admix among them. It had 9 landraces from UP, 35 landraces from Chhattisgarh, and 1 from Jharkhand. It was observed that 79.5% (35 out of 44) of the landraces from Chhattisgarh were found in population 1. In population 2 (individuals in green), there were 33 landraces; 28 were pure and 5 were admixed. There were 9 landraces from Uttarakhand, 17 landraces from Jharkhand, and 5 landraces from Chhattisgarh. A total of 73.9% (17 out of 23) of the landraces from Jharkhand were grouped in population 2. Population 3 (individuals in blue) had 40 landraces, and all were pure with no admixture. There were 3 landraces from Chhattisgarh, 21 landraces from UP, 10 landraces from West Bengal, 4 landraces from Uttarakhand, and 2 landraces from Jharkhand confined to this population. This population formed a mixture of individuals from all regions. Population 4 (individuals in yellow) had the highest number of landraces, with a total of 181. Of these, 180 were pure and 1 was admixed. There were 125 landraces from Uttarakhand, 3 landraces from Jharkhand, 16 landraces from Uttar Pradesh, 24 landraces from West Bengal, 12 landraces from Andaman, and 1 from Chhattisgarh grouped in this population. A total of 90.5% (125 out of 138) of landraces from Uttarakhand and 100% (12 out of 12) of landraces from Andaman were grouped in population 4 (IC numbers with their corresponding regions are listed in Supplementary Table S1). It was observed that the landraces from six different regions were grouped into four populations, whereby major individuals from Chhattisgarh and Jharkhand, though located closely to one another, were grouped into different populations, unlike in the NJ tree, where they were grouped together (Figure 2). Major individuals from Uttarakhand and Andaman were grouped in population 4 even though Uttarakhand and Andaman are distantly located (Figure 1). Population structure in the case of SSR markers did not completely demarcate landraces according to their geographical location, but it showed some grouping of landraces from Chhattisgarh, Jharkhand, and Uttarakhand.

3.5. Discriminant Analysis of Principal Components (DAPC) Using SSR Markers

The results of the DAPC analysis showed five clusters (Figure 5). Landraces from Uttarakhand were found mixed with landraces from West Bengal and a few Uttar Pradesh landraces (first cluster). Landraces from Uttar Pradesh, Andaman, Jharkhand, and Chhattisgarh formed four different clusters. The results of DAPC and fastSTRUCTURE showed some similarities between the grouping patterns of landraces. fastSTRUCTURE (Figure 4) showed that 79% of the landraces from Chhattisgarh were grouped in population 1, while in the DAPC analysis, Chhattisgarh landraces formed a distinct cluster (Figure 5). A total of 73.9% of the landraces from Jharkhand were found in population 2, whereas DAPC analysis also showed a distinct cluster of Jharkhand landraces. More than 90% of the landraces from Uttarakhand were grouped in population 4 along with 70% of landraces from West Bengal and 34% of landraces from Uttar Pradesh. Landraces from Uttarakhand were seen overlapping with landraces of West Bengal and Uttar Pradesh in the DAPC plot as well. The results of the fastSTRUCTURE and DAPC analysis showed somewhat distinct clusters with overlapping results among landraces from different geographical regions. The minimum spanning network (MSN) (Supplementary Figure S5) showed a closed cluster of Chhattisgarh landraces, but landraces from other regions showed mixing.

3.6. Population Structure Differentiation Using SNP Markers

fastSTRUCTURE outputs revealed three populations (clusters) among the 298 rice landraces. The fastSTRUCTURE bar plot (Figure 6) with three populations showed that population 1 (individuals in red) had 32 landraces with 17 pure and 15 admixes. A total of 10% (5 out of 47) of Uttar Pradesh landraces, 10% of Uttarakhand landraces (14 out of 138), 14% of West Bengal landraces (5 out of 34), 2% of Chhattisgarh landraces (1 out of 44), and 30% of Jharkhand landraces (7 out of 23) were confined to population 1. Population 2 (individuals in green) had 108 landraces with 91 pure and 17 admixes. There were 57% (27 out of 47) of Uttar Pradesh landraces, 100 % (12 out of 12) of Andaman landraces, 21% (29 out of 138) of Uttarakhand landraces, 50% (22 out of 44) of Chhattisgarh landraces, 44% (15 out of 34) of West Bengal landraces, and 13% (3 out of 23) of the Jharkhand landraces in this population. Population 3 (individuals in blue) had 158 landraces with 145 pure and 13 admixes. A total of 68% (95 out of 138) of Uttarakhand landraces, 47% (21 out of 44) of Chhattisgarh landraces, 56% (13 out of 23) of Jharkhand landraces, 31% (15 out of 47) of Uttar Pradesh, and 41% (14 out of 34) of West Bengal landraces were confined to population 3. Here complete geographical distinction was not observed. This depicted weak clustering and more mixing among the landraces in population structure analysis with SNP markers.

3.7. Discriminant Analysis of Principal Components (DAPC) Using SNP Markers

The results of the DAPC analysis (Figure 7) showed landraces from Uttar Pradesh, Chhattisgarh, Andaman, and Jharkhand forming clusters with few overlapping individuals. A small cluster of Uttarakhand landraces was found mixed with individuals of West Bengal, Uttar Pradesh, Chhattisgarh, and Jharkhand, which was similar to the one found in population 3 of fastSTRUCTURE. Apart from this, not much similarity was observed in DAPC and fastSTRUCTURE outputs, but SNP markers were able to demarcate the landraces of Uttar Pradesh, Chhattisgarh, Andaman, and Jharkhand, depicting isolation in these populations with less mixing and high molecular variance. To summarize, SNP marker-based NJ tree (Figure 3), fastSTRUCTURE (Figure 6), and MSN (Supplementary Figure S6) all showed loose region-wise clustering of rice landraces. Though entire geographic discrimination was not seen in the case of SNP markers, they were able to detect a sufficient amount of genetic diversity among the individual geographic landraces.

3.8. Analysis of Molecular Variance (AMOVA) from fastSTRUCTURE Populations Using SSR and SNP Markers

The distribution of genetic diversity between populations and within the populations obtained following fastSTRUCTURE analysis showed 24.7% variation between populations and 75.3% variation within populations with SSR markers (Figure 8A). For SNP markers, there was an 11.6% variation between populations and an 88.4% variation within populations (Figure 8B). It was observed that greater within-population variation contributed more to the genetic diversity of the landraces.

3.9. Region-Wise Analysis of Molecular Variance (AMOVA) of 298 Rice Landraces Using SSR and SNP Markers

AMOVA analysis using landraces’ geographical location was considered to see how SSR markers and SNP markers differentiate individuals of different geographical locations. Each region was considered as a population, and altogether there were six populations (Chhattisgarh, Jharkhand, Uttar Pradesh, Uttarakhand, West Bengal, and Andaman). Region-wise analysis of molecular variance showed 27.8% variation between populations and 72.2% variation within the population with SSR markers (Figure 8C). With SNP markers, there was a 9.7% variation between populations and a 90.3% variation within a population (Figure 8D). Greater variations between populations (27.8%) with SSR markers than with SNP markers (9.7%) show a better geographic distinction as seen in the NJ tree and DAPC plot. There is low genetic variability between the populations (9.7%) as assessed by SNP markers, which means populations are less distinct and more mixed. This was evident from the NJ tree, fastSTRUCTURE analysis, and MSN.
In both cases (Figure 8C,D), it was observed that variation within the population was higher, which is likely due to the smaller geographical area from which these landraces were derived and greater genetic diversity prevailing in the selected geographical areas.

3.10. Mantel Test

A mantel test was performed to obtain a correlation coefficient between genetic distance and geographic distance of rice landraces. Overall, a correlation coefficient of Rxy 0.525 (Supplementary Figure S7) was observed with SSR markers, indicating a high value for correlation and less gene flow. This correlation further supports the idea that the rice landraces studied are geographically isolated when SSR marker-based analysis was conducted. The SNP marker-based correlation coefficient was Rxy 0.173 (Supplementary Figure S8), indicating a moderate correlation and a small amount of gene flow, and this may be the reason for the poor geographical isolation observed.

4. Discussion

Previous studies have reported genetic diversity analysis using SSR markers in various crops such as rice [33,34], olives [35], maize [10], etc. There are some recent studies where genetic diversity was assessed using SNP markers in wheat [36,37,38], rutabaga [39], and soybean [40]. There are studies where comparative patterns of diversity analysis between the two marker systems have been reported, such as Courtois et al. [41], who showed characterization of ERGC (Europian Rice Germplasm Collection) accessions using SSR and SNP markers, and Van Inghelandt et al. [42], who reported genetic diversity and population structure in elite breeding maize germplasm based on 359 SSRs and 8244 SNPs. To the best of our knowledge, none of the previous studies reported the characterization of rice landraces using SSR and SNP markers. SSR and SNP marker-based studies revealed that rice landraces are very diverse, and they are geographically isolated. This study also showed comparative genetic diversity statistics between a smaller number of SSRs and a large set of SNPs. Previous studies [43,44,45,46] have suggested SSRs would do better in performing population genetic structure analysis than a large set of genome-wide distributed SNPs. However, SNPs provide a better view in terms of demographic inferences, as suggested by Garcia et al. [44]. DNA amplification using SSR markers may produce artifacts because of Taq polymerase. The production of artifacts can cause difficulty in allele sizing; hence, it can affect the quality of data. Because point mutations, SNPs lead to greater accuracy in genotyping. However, these SNP arrays require extensive validation to confirm their usefulness in general diversity analyses. Hence, SSRs will do better in such cases [39]. Our study also showed better region-wise grouping with SSRs than with SNPs markers.
Geographically, we found that Uttar Pradesh landraces were highly diverse, having the highest gene diversity value with both SSR (0.42) and SNP (0.49) markers. A lower value of gene diversity (0.3) was observed by Singh et al. [47] with SSR markers while studying rice varieties, and a higher value (0.7) was observed by Hour et al. [3] when studying 47 rice cultivars and 59 landraces from Taiwan using SSR and STS markers. High genetic diversity is important in the case of landraces, as they would provide useful alleles for further study [3]. In this study, individuals from West Bengal showed low PIC values of 0.34 and 0.37 with SSR and SNP markers, respectively, depicting low genetic variance. In a similar study, Das et.al. [33] reported a PIC value of 0.5 with another set of rice landraces from West Bengal. Umakanth et. al. [48] reported a higher PIC value (0.44) with rice landraces from northeast India [48]. The highest pairwise fixation index (Fst) obtained in the current study was 0.487 (Chhattisgarh/Uttarakhand) with SSR markers and 0.285 (Andaman/Jharkhand) with SNP markers. The results confirm a substantial amount of differentiation with SNPs and strong differentiation with SSRs, showing low genetic exchange within rice landraces collected from different geographical locations. In contrast, low genetic differentiation (Fst 0.133) was observed in Brassica accessions using SNP markers, suggesting a high degree of genetic exchange [39]. According to Chen et al. [49], values over 0.15 are considered to indicate moderate genetic differentiation, and values over 0.4 indicate strong genetic differentiation. In our case, a value of 0.487 was observed with SSR markers in Chhattisgarh/Uttarakhand rice landraces.
The neighbor-joining tree revealed two groups with SSR markers. Group 1 was mixed with landraces from Jharkhand and Chhattisgarh. This could be due to nearby areas forming a close cluster. Group 2, after being further divided into subgroups, gave a higher resolution geographically. Such region-wise grouping was observed by Das et al. [33] while studying landraces from northeast India. SNP markers, on the other hand, did not completely differentiate individuals according to their geographic location. The polymorphisms of SSRs and SNPs are generated via different mechanisms, (replication slippage in the case of SSR and point mutation in the case of SNP [41]). Thus, the two marker types can provide different views on phylogenetic analysis, as seen in this case. Results regarding the differences in the outcome of SSRs and SNPs for different types of evolutionary analyses might also depend on the availability of resources, sample size, and goal of the study.
Population structure analysis with SSR markers showed four populations, and analysis with SNP markers showed three populations. At the population level, no clear population structure according to geographical regions for the rice landraces was observed with both marker systems. This could be due to large genetic variation among landraces of different geographical regions. Similar outputs were observed in 600 bread wheat landraces from eight different countries showing common ancestries and high admixture [50].
In our study, DAPC analysis showed small region-wise clusters among landraces from Uttar Pradesh, Chhattisgarh, Andaman, and Jharkhand with both marker types. The extent of heterogeneous clustering showing high molecular variance was more in the case of SNP markers. Larger and older populations tend to have higher genetic variance than small and newly established populations due to high levels of maintained genetic diversity [51]. The landraces included in this study were collected from large populations towards the interiors of districts and villages of India. Hence, a large amount of variation could be seen. A similar result showing high genetic variance was obtained by Tehseen et al. [50] while studying wheat landraces. Based on AMOVA analysis, it was observed that variation within the population was higher. Thus, the vast majority of the genetic variability could be attributed to within-population differences due to smaller geographic areas and high genetic diversity. This could be due to the cultivation of cultivars restricted to that particular geographic region and that are less used in traditional breeding. Results showing high within-population variation were observed in rice and wheat [50,52].
From the Mantel test, based on genetic distance and geographical distance, a positive correlation between genetic and geographic distance using SSR markers (R 0.525) indicated isolation among rice populations. The correlation coefficient with SNP markers (R 0.173) also showed a positive trend with a moderate amount of isolation. A low level of correlation was seen while studying the genetic diversity of Thai rice landraces with SNP markers [53], indicating that gene flow between Indian landraces is lower in comparison to Thai landraces.

5. Conclusions

SSR and SNP markers used for genetic diversity and population structure study of rice landraces collected from six different states of India exhibited wider genetic diversity and showed different population structures. SSR markers showed better geographical isolation between the rice landraces collected from different geographical locations than SNP markers. Fst values with SSR markers depicted good genetic differentiation and isolation between the individual landraces. A positive correlation between genetic distance and geographical location with both the marker systems was observed, and a high R-value with SSRs indicated distinct geographical isolation between the landraces. The rice landraces used in the present study had vast genetic diversity and were geographically isolated with almost no gene flow, and they may be an ideal material for the rice breeding program. Since rice landraces are known to harbor many novel genes for various biotic, abiotic, and nutritional traits, these unique landraces collected from different states of India may be utilized for rice improvement programs.

Supplementary Materials

The following supporting information can be downloaded at: https://www.mdpi.com/article/10.3390/agriculture13040823/s1.

Author Contributions

R.S. conceived and designed the experiments; D.R.C. and R.K. performed the experiments; R.S., A.M. and D.R.C. analyzed the data; D.P.S., R.S.R., R.K.G., A.K.T., S.P.A. and S.K.B. collected rice samples from different geographic locations; D.R.C. and R.S. contributed to the writing of the manuscript; and K.S. and N.K.S. edited the manuscript. All authors have read and agreed to the published version of the manuscript.

Funding

This research was funded jointly by the Indian Council of Agricultural Research (ICAR), New Delhi, India, under project PGR/GRD-BUR-DEL-01.02 and ICAR-Network project on Functional Genomics and Genetic Modification in Crops. Project code no 1001381, Scheme code no 19693.

Institutional Review Board Statement

Not applicable.

Data Availability Statement

All the data and Supplementary Materials are available with the manuscript.

Acknowledgments

We are thankful to the Director, ICAR-NBPGR, New Delhi, for providing facilities to carry out this work.

Conflicts of Interest

The authors declare no conflict of interest.

References

  1. Vasumathy, S.K.; Alagu, M. SSR marker-based genetic diversity analysis and SNP haplotyping of genes associating abiotic and biotic stress tolerance, rice growth, and development and yield across 93 rice landraces. Mol. Biol. Rep. 2021, 48, 5943–5953. [Google Scholar] [CrossRef] [PubMed]
  2. Nachimuthu, V.V.; Muthurajan, R.; Duraialaguraja, S.; Sivakami, R.; Aravindhan Pandian, B.; Ponniah, G.; Gunasekaran, K.; Swaminathan, M.; Suji, K.K.; Sabariappan, R. Analysis of Population Structure and Genetic Diversity in Rice Germplasm Using SSR Markers: An Initiative Towards Association Mapping of Agronomic Traits in Oryza Sativa. Rice 2015, 8, 30–35. [Google Scholar] [CrossRef] [Green Version]
  3. Hour, A.; Hsieh, W.; Chang, S.; Wu, Y.P.; Chin, H.S.; Lin, Y.R. Genetic Diversity of Landraces and Improved Varieties of Rice (Oryza sativa L.) in Taiwan. Rice 2020, 13, 82–85. [Google Scholar] [CrossRef] [PubMed]
  4. Londo, J.P.; Chiang, Y.C.; Hung, K.H.; Chiang, T.Y.; Schaal, B.A. Phylogeography of Asian Wild Rice, Oryza rufipogon, Reveals Multiple Independent Domestications of Cultivated Rice, Oryza sativa. Proc. Natl. Acad. Sci. USA 2006, 103, 9578–9583. [Google Scholar] [CrossRef] [PubMed] [Green Version]
  5. Pusadee, T.; Jamjod, S.; Chiang, Y.C.; Rerkasem, B.; Schaal, B.A. Genetic structure and isolation by distance in a landrace of Thai rice. Proc. Natl. Acad. Sci. USA 2009, 106, 13880–13885. [Google Scholar] [CrossRef] [Green Version]
  6. Roy, S.; Marndi, B.C.; Mawkhlieng, B.; Banerjee, A.; Yadav, R.M.; Misra, A.K.; Bansal, K.C. Genetic diversity and structure in hill rice (Oryza sativa L.) landraces from the North-Eastern Himalayas of India. BMC Genet. 2016, 17, 107–122. [Google Scholar] [CrossRef] [Green Version]
  7. Peringottillam, M.; Kunhiraman Vasumathy, S.; Selvakumar, H.K.; Alagu, M. Genetic diversity, and population structure of rice (Oryza sativa L.) landraces from Kerala, India analyzed through genotyping-by-sequencing. Mol. Genet. Genom. 2022, 297, 169–182. [Google Scholar] [CrossRef]
  8. Fujino, K.; Shirasawa, K. Fine-scale genetic structure of the rice landrace population in Japan. Mol. Genet. Genom. 2022, 297, 711–718. [Google Scholar] [CrossRef] [PubMed]
  9. Kumbhar, S.D.; Kulwal, P.L.; Patil, J.V.; Sarawate, C.D.; Gaikwad, S.D.; Jadhav, A.S. Genetic Diversity and Population Structure in Landraces and Improved Rice Varieties from India. Rice Sci. 2015, 22, 99–107. [Google Scholar] [CrossRef] [Green Version]
  10. Adu, G.B.; Awuku, F.J.; Amegbor, I.K.; Haruna, A.; Manigben, K.A.; Aboyadana, P.A. Genetic characterization and population structure of maize populations using SSR markers. Ann. Agric. Sci. 2019, 64, 47–54. [Google Scholar] [CrossRef]
  11. Farhangian-Kashani, S.; Azadi, A.; Khaghani, S.; Changizi, M.; Gomarian, M. Association analysis and evaluation of genetic diversity in wheat genotypes using SSR markers. Biol. Future 2021, 72, 441–452. [Google Scholar] [CrossRef] [PubMed]
  12. Dangi, G.S.; Mendum, M.L.; Prins, B.H.; Walker, M.A.; Meredith, C.P.; Simon, C.J. Simple sequence repeat analysis of a clonally propagated species: A tool for managing a grape germplasm collection. Genome 2001, 44, 432–438. [Google Scholar] [CrossRef]
  13. Coombs, J.J.; Frank, L.M.; Douches, D.S. An applied fingerprinting system for cultivated potato using simple sequence repeats. Am. J. Potato Res. 2004, 81, 243–250. [Google Scholar] [CrossRef]
  14. Louarn, S.; Torp, A.M.; Holme, I.B.; Andersen, S.B.; Jensen, B.D. Database-derived microsatellite markers (SSRs) for cultivar differentiation in Brassica oleracea. Genet. Resour. Crop Evol. 2007, 54, 1717–1725. [Google Scholar] [CrossRef]
  15. Rahman, M.S.; Molla, M.R.; Alam, M.S.; Rahman, L. DNA fingerprinting of rice (Oryza sativa L.) cultivars using microsatellite markers. Aust. J. Crop Sci. 2009, 3, 122–128. [Google Scholar]
  16. Singh, N.; Jayaswal, P.K.; Panda, K.; Mandal, P.; Kumar, V.; Singh, B. Single-copy gene-based 50 K SNP chip for genetic studies and molecular breeding in rice. Sci. Rep. 2015, 5, 11600. [Google Scholar] [CrossRef] [Green Version]
  17. Chen, H.; Xie, W.; He, H.; Yu, H.; Chen, W.; Li, J.; Yu, R.; Yao, Y.; Zhang, W.; He, Y.; et al. A High-Density SNP Genotyping Array for Rice Biology and Molecular Breeding. Mol. Plant. 2014, 7, 541–553. [Google Scholar] [CrossRef] [Green Version]
  18. Chavhan, R.L.; Sable, S.; Narwade, A.V.; Hinge, V.R.; Kalbande, B.B.; Mukherjee, A.K.; Chakrabarty, P.K.; Kadam, U.S. Multiplex molecular marker-assisted analysis of significant pathogens of cotton (Gossypium sp.). Biocatal. Agric. Biotechnol. 2023, 47, 102557. [Google Scholar] [CrossRef]
  19. Hinge, V.R.; Shaikh, I.M.; Chavhan, R.L.; Deshmukh, A.S.; Shelake, R.M.; Ghuge, S.A.; Dethe, A.M.; Suprasanna, P.; Kadam, U.S. Assessment of genetic diversity and volatile content of commercially grown banana (Musa spp.) cultivars. Sci. Rep. 2022, 12, 7979. [Google Scholar] [CrossRef]
  20. Murray, M.G.; Thomson, W.F. Rapid isolation of high molecular weight plant DNA. Nucleic Acid Res. 1980, 8, 4321–4325. [Google Scholar] [CrossRef] [Green Version]
  21. Singh, H.; Deshmukh, R.K.; Singh, A.; Singh, A.K.; Gaikwad, K.; Sharma, T.; Mohapatra, T.; Singh, N.K. Highly variable SSR markers suitable for Rice genotyping using Agarose gels. Mol. Breed. 2009, 25, 359–364. [Google Scholar] [CrossRef]
  22. Liu, K.; Muse, S.V. PowerMarker: An Integrated Analysis Environment for Genetic Marker Analysis. Bioinformatics 2005, 21, 2128–2129. [Google Scholar] [CrossRef] [PubMed] [Green Version]
  23. Nei, M.; Tajima, F.; Tateno, Y. Accuracy of Estimated Phylogenetic Trees from Molecular Data. J. Mol. Evol. 1983, 19, 153–170. [Google Scholar] [CrossRef]
  24. Letunic, I.; Bork, P. Interactive tree of life (iTOL) v3: An online tool for the display and annotation of phylogenetic and other trees. Nucleic Acids Res. 2016, 8, 242–245. [Google Scholar] [CrossRef]
  25. Raj, A.; Stephens, M.; Pritchard, J.K. fastSTRUCTURE: Variational inference of population structure in large SNP data sets. Genetics 2014, 197, 573–589. [Google Scholar] [CrossRef] [PubMed] [Green Version]
  26. Li, Y.L.; Liu, J.X. StructureSelector: A web-based software to select and visualize the optimal number of clusters using multiple methods. Mol. Ecol. Resour. 2018, 18, 176–177. [Google Scholar] [CrossRef]
  27. Puechmaille, S. The program STRUCTURE does not reliably recover the correct population structure when sampling is uneven: Sub-sampling and new estimators alleviate the problem. Mol. Ecol. 2016, 16, 608–627. [Google Scholar] [CrossRef]
  28. Kamvar, Z.N.; Tabima, J.F.; Grünwald, N.J. Poppr: An R package for genetic analysis of populations with clonal, partially clonal, and/or sexual reproduction. Peer J. 2014, 2, e281. [Google Scholar] [CrossRef] [Green Version]
  29. Bradbury, P.J.; Zhang, Z.; Kroon, D.E.; Casstevens, T.M.; Ramdoss, Y.; Buckler, E.S. TASSEL: Software for Association Mapping of Complex Traits in Diverse Samples. Bioinformatics 2007, 23, 2633–2635. [Google Scholar] [CrossRef]
  30. Jombart, T. Adegenet: A R package for the multivariate analysis of genetic markers. Bioinformatics 2010, 24, 1403–1405. [Google Scholar] [CrossRef] [Green Version]
  31. Peakall, R.; Smouse, P.E. genalex 6: Genetic analysis in Excel. Population genetic software for teaching and research. Mol. Ecol. Notes 2006, 6, 288–295. [Google Scholar] [CrossRef]
  32. Danecek, P.; Auton, A.; Abecasis, G.; Albers, C.A.; Banks, E.; DePristo, M.A.; Handsaker, R.E.; Lunter, G.; Marth, G.T.; Sherry, S.T. The variant call format and VCFtools. Bioinformatics 2011, 27, 2156–2158. [Google Scholar] [CrossRef] [PubMed]
  33. Das, B.; Sengupta, S.; Parida, S.K.; Roy, B.; Ghosh, M.; Prasad, M.; Ghose, T.K. Genetic Diversity and Population Structure of rice Landraces from Eastern and North Eastern States of India. BMC Genet. 2013, 14, 71–85. [Google Scholar] [CrossRef] [Green Version]
  34. Hassan, D.A.; Hama-Ali, E.O. Evaluation of gene flow and genetic diversity in rice accessions across Kurdistan region-iraq using SSR markers. Mol. Biol. Rep. 2022, 49, 1007–1016. [Google Scholar] [CrossRef] [PubMed]
  35. Sarri, V.; Baldoni, L.; Porceddu, A.; Cultrera, N.G.M.; Contento, A.; Frediani, M.; Belaj, A.; Trujillo, I.; Cionini, P. Microsatellite markers are powerful tools for discriminating among olive cultivars and assigning them to geographically defined populations. Genome 2006, 49, 1606–1615. [Google Scholar] [CrossRef] [Green Version]
  36. Yang, X.; Tan, B.; Liu, H.; Zhu, W.; Xu, L.; Wang, Y.; Fan, X.; Sha, L.; Zhang, H.; Zeng, J.; et al. Genetic diversity and population structure of Asian and Europian common wheat accessions based on genotyping–by–sequencing. Front. Genet. 2020, 11, 580782–580796. [Google Scholar] [CrossRef]
  37. Kumar, D.; Chhokar, V.; Sheoran, S.; Singh, R.; Sharma, P.; Jaiswal, S.; Jaisri, J.; Angadi, U.B. Characterization of genetic diversity and population structure in wheat using array-based SNP markers. Mol. Biol. Rep. 2020, 47, 293–306. [Google Scholar] [CrossRef] [PubMed]
  38. Tomar, V.; Dhillon, G.S.; Singh, D.; Singh, R.P.; Poland, J.; Joshi, A.K.; Tiwari, B.S.; Kumar, U. Elucidating SNP-based genetic diversity and population structure of advanced breeding lines of bread wheat (Triticum aestivum L.). Peer J. 2021, 22, e11593. [Google Scholar] [CrossRef]
  39. Yu, Z.; Fredua-Agyeman, R.; Hwang, S.F.; Strelkov, S.E. Molecular genetic diversity and population structure analyses of rutabaga accessions from Nordic countries as revealed by single nucleotide polymorphism markers. BMC Genom. 2021, 22, 442–451. [Google Scholar] [CrossRef]
  40. Chander, S.; Garcia-Oliveira, A.L.; Gedil, M.; Shah, T.; Otusanya, G.O.; Asiedu, R.; Chigeza, G. Genetic Diversity and Population Structure of Soybean Lines Adapted to Sub-Saharan Africa Using Single Nucleotide Polymorphism (SNP) Markers. Agronomy 2021, 11, 604–618. [Google Scholar] [CrossRef]
  41. Courtois, B.; Frouin, J.; Greco, R.; Bruschi, G.; Droc, G.; Hamelin, C.; Ruiz, M.; Clément, G.; Evrard, J.-C.; van Coppenole, S. Genetic diversity and population structure in a European collection of rice. Crop. Sci. 2012, 52, 1663–1675. [Google Scholar] [CrossRef]
  42. Van Inghelandt, D.; Melchinger, A.E.; Lebreton, C.; Stich, B. Population structure and genetic diversity in a commercial maize breeding program assessed with SSR and SNP markers. Theor. Appl. Genet. 2010, 120, 1289–1299. [Google Scholar] [CrossRef] [Green Version]
  43. Guichoux, E.; Lagache, L.; Wagner, S.; Chaumeil, P.; Léger, P.; Lepais, O.; Lepoittevin, C.; Malausa, T.; Revardel, E.; Salin, F.; et al. Current trends in microsatellite genotyping. Mol. Ecol. Resour. 2011, 11, 591–611. [Google Scholar] [CrossRef]
  44. García, C.; Guichoux, E.; Hampe, A. A comparative analysis between SNPs and SSRs to investigate genetic variation in a juniper species (Juniperus phoenicea ssp. turbinata). Tree Genet. Genomes 2017, 14, 87–95. [Google Scholar] [CrossRef]
  45. Tsykun, T.; Rellstab, C.; Dutech, C.; Sipos, G.; Prospero, S. Comparative assessment of SSR and SNP markers for inferring the population genetic structure of the common fungus Armillaria cepistipes. Heredity 2017, 119, 371–380. [Google Scholar] [CrossRef] [Green Version]
  46. Tanhuanpää, P.; Erkkilä, M.; Tenhola-Roininen, T.; Tanskanen, J.; Manninen, O. SNP diversity within and among Brassica rapa accessions reveals no geographic differentiation. Genome 2016, 59, 11–21. [Google Scholar] [CrossRef] [PubMed] [Green Version]
  47. Singh, N.; Choudhury, D.R.; Singh, A.K.; Kumar, S.; Srinivasan, K.; Tyagi, R.K.; Singh, N.K.; Singh, R. Comparison of SSR and SNP markers in the estimation of genetic diversity and population structure of Indian rice varieties. PLoS ONE 2013, 8, e84136. [Google Scholar] [CrossRef] [Green Version]
  48. Umakanth, B.; Vishalakshi, B.; Sathish Kumar, P.; Rama Devi, S.J.S.; Bhadana, V.P.; Senguttuvel, P.; Kumar, S.; Kumar, S.S.; Sharma, P.K.; Prasad, M.S.; et al. Diverse Rice Landraces of North-East India Enables the Identification of Novel Genetic Resources for Magnaporthe Resistance. Front. Plant Sci. 2017, 8, 1500. [Google Scholar] [CrossRef] [Green Version]
  49. Chen, R.; Shimono, A.; Aono, M.; Nakajima, N.; Ohsawa, R.; Yoshioka, Y. Genetic diversity and population structure of feral rapeseed (Brassica napus L.) in Japan. PLoS ONE 2020, 15, e0227990. [Google Scholar] [CrossRef] [PubMed] [Green Version]
  50. Tehseen, M.M.; Tonk, F.A.; Tosun, M.; Istipliler, D.; Amri, A.; Sansaloni, C.P.; Kurtulus, E.; Mubarik, M.S.; Nazari, K. Exploring the Genetic Diversity and Population Structure of Wheat Landrace Population Conserved at ICARDA Genebank. Front. Genet. 2022, 13, 900572. [Google Scholar] [CrossRef]
  51. Gadissa, F.; Tesfaye, K.; Dagne, K.; Geleta, M. Genetic diversity and population structure analyses of Plectranthus edulis (Vatke) Agnew collections from diverse agro-ecologies in Ethiopia using newly developed EST-SSRs marker system. BMC Genet. 2018, 19, 92–107. [Google Scholar] [CrossRef] [PubMed] [Green Version]
  52. Melaku, G.; Labroo, M.; Liyu, H.; Shilai, Z.; Guangfu, H.; Jing, Z.; Tesfaye, K.; Haileselassie, T.; Hu, F. Genetic diversity and differentiation of the African wild rice (Oryza longistaminata chev. et roehr) in Ethiopia. Sci. Afr. 2019, 6, e00138. [Google Scholar] [CrossRef]
  53. Aesomnuk, W.; Ruengphayak, S.; Ruanjaichon, V.; Sreewongchai, T.; Malumpong, C.; Vanavichit, A.; Toojinda, T.; Wanchana, S.; Arikit, S. Estimation of the Genetic Diversity and Population Structure of Thailand’s Rice Landraces Using SNP Markers. Agronomy 2021, 11, 995. [Google Scholar] [CrossRef]
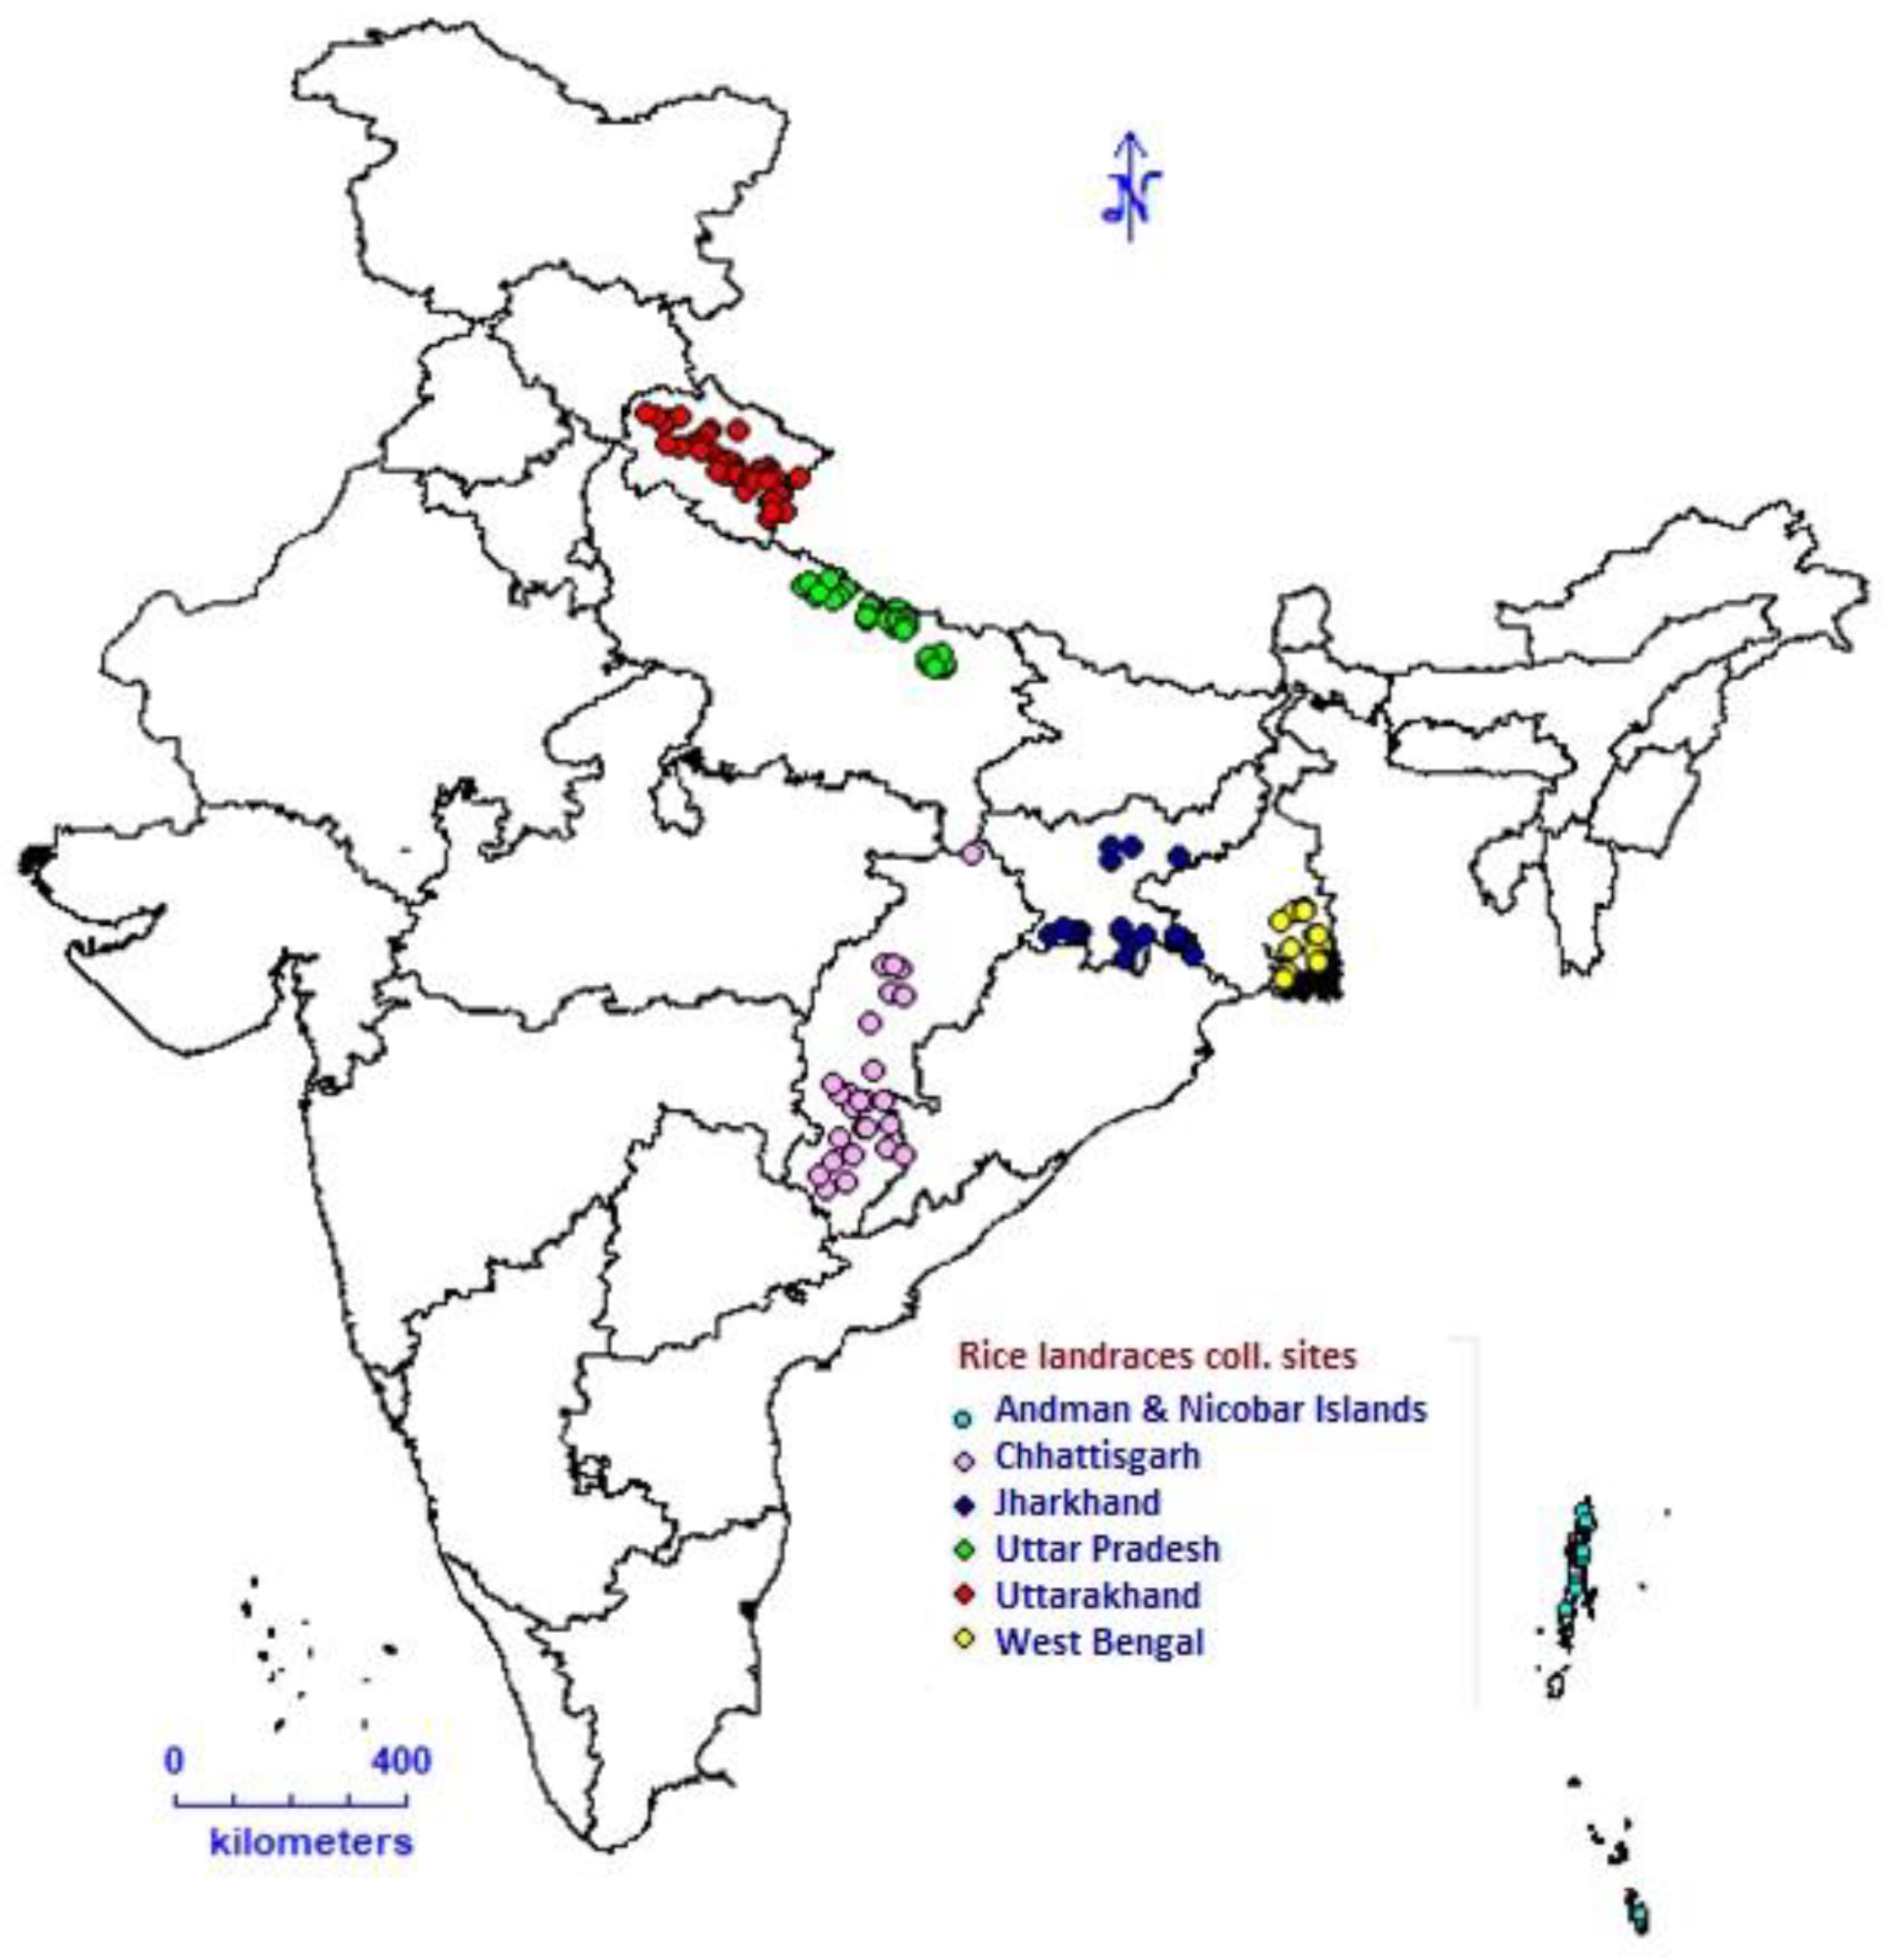
Figure 1. Map of India showing the locations where rice collection was conducted.
Agriculture 13 00823 g001
Figure 2. Neighbor-joining tree of 298 rice landraces using SSR markers.
Agriculture 13 00823 g002
Figure 3. Neighbor-joining tree of 298 rice landraces using SNP markers.
Agriculture 13 00823 g003
Figure 4. fastSTRUCTURE bar plot showing the population number (K = 4) of 298 rice landraces using SSR markers.
Agriculture 13 00823 g004
Figure 5. Discriminant analysis of principal components (DAPC) plot of 298 rice landraces showing five clusters with SSR markers.
Agriculture 13 00823 g005
Figure 6. fastSTRUCTURE bar plot showing the number of population (K = 3) of 298 rice landraces using SNP markers.
Agriculture 13 00823 g006
Figure 7. Discriminant analysis of principal components (DAPC) plot of 298 rice landraces showing five clusters with SNP markers.
Agriculture 13 00823 g007
Figure 8. Analysis of molecular variance (AMOVA) of 298 rice landraces using SSR and SNP markers.
Agriculture 13 00823 g008
Table 1. Average values of major allele frequency, gene diversity, observed heterozygosity, and pic according to landraces’ geographical location.
SSR Marker
AndamanWest BengalChhattisgarhJharkhandUPUttarakhand
Major Allele Frequency0.780.700.690.710.670.80
Gene Diversity0.270.390.380.380.420.26
Heterozygosity0.190.100.300.270.210.13
PIC0.220.340.310.320.380.21
SNP Marker
AndamanWest BengalChhattisgarhJharkhandUPUttarakhand
Major Allele frequency0.450.440.420.420.440.44
Shannon Diversity0.480.490.480.470.490.49
Heterozygosity0.810.670.740. 760.70.75
PIC0.370.370.360.360.370.37
Disclaimer/Publisher’s Note: The statements, opinions and data contained in all publications are solely those of the individual author(s) and contributor(s) and not of MDPI and/or the editor(s). MDPI and/or the editor(s) disclaim responsibility for any injury to people or property resulting from any ideas, methods, instructions or products referred to in the content.