Article

The Effects of Agricultural Technology Progress on Agricultural Carbon Emission and Carbon Sink in China

College of Economics and Management, Southwest University, Chongqing 400715, China
*
Author to whom correspondence should be addressed.
Agriculture 2023, 13(4), 793; https://doi.org/10.3390/agriculture13040793
Submission received: 18 January 2023 / Revised: 26 March 2023 / Accepted: 27 March 2023 / Published: 30 March 2023

Abstract

:
The development mode of expanding agricultural scale will inevitably lead to an increase in agricultural carbon emissions but the impacts of agricultural technology progress on agricultural carbon emission and carbon sink are still not quite clear. This paper firstly discuss the definition of agricultural technology level. Then the estimating methods of agricultural technology, agricultural carbon emission and carbon sink are introduced. Based on the China’s provincial panel data with 31 province from 2000 to 2019, the indicators are calculated and statistically analysed. After that, the representativeness of the three secondary classifications of the agricultural technology is empirically checked. Panel data regression models especially the fixed effect model is employed to estimate the effects of agricultural technology level as well as its components on agricultural carbon emission and carbon sink. Results show that the agricultural carbon sink is approximately 10 times higher than agricultural carbon emission. Agricultural technology level in general has significant effect on the carbon emission rather than the carbon sink. Our suggestion is that (1) it is not necessary to worry about the agricultural carbon emission since the net effect of agriculture is carbon neutrality; (2) the development of agricultural production technology and agricultural management technology needs strong support, and the two need to develop coordinated.

1. Introduction

Agricultural technology progress is an important source of promoting agricultural economic growth and even macroeconomic growth. Agricultural technological progress has played an important role in ensuring China’s food security and promoting the long-term sustainable development of agriculture and the national economy. Liang (2005) [1] claimed that, in the 1990s and 2000s, although the contribution rate of China’s agricultural technology progress to economic growth has reached to 45%, the contribution rate of the developed countries such as Britain, France and Germany has already reached to approximately 75%. It can be seen that the contribution of China’s labour and factor inputs to agricultural economic growth is still more than half. So, there is still much room to develop agricultural economy from the perspective of technological progress. On the other hand, it is an objective fact that due to the limitation of cultivated land area, with the development of agricultural economy, the contribution rate of labor and factor input to agricultural economic growth will gradually decline. Therefore, to develop agricultural technology is a sustainable and effective way for agricultural economic growth. As the third largest land area country in the world, China’s agricultural technology progress plays a more important role in promoting agricultural development. However, there will inevitably be negative externalities in the agricultural production process, such as environmental pollution and carbon emissions. General Secretary Mr Xi announced to the world at the United Nations General Assembly in 2017 that China will strive to achieve carbon neutrality from 2020 and to achieve carbon peak by 2030. If the main way to increase agricultural output is to expand agricultural scale, agricultural economic growth and carbon emission reduction will inevitably conflict [2]. However, if we develop the agricultural economy in the way of scientific and technological progress, it is not quite clear what will happen to carbon emissions and carbon sinks. In light of this, the impacts of agricultural technology progress on agricultural carbon emissions and carbon sinks need to be theoretically and empirically studied. This is of great significance to the adjustment of agricultural structure, the sustainable development of agriculture, the development of ecological agriculture and the formulation of relevant policies.

2. Literature Review

The definition of agricultural technology is a issue that needs to be discussed and clarified first. The theory of technological progress can be traced back to Adam Smith’s thought of division of labor promoting economic growth. Generally speaking, the definitions of agricultural technology can be divided into two: “narrow sense” and “broad sense”. Gong et al. (2020) [3] describes narrow sense of agricultural technology as the natural science and technology used in agricultural production, such as mechanical technology, cultivation technology, biochemical technology and other substantive technologies. Wu (1996) [4] stressed that these natural sciences and technologies must be applied in practice and become value-added technologies for agricultural products. On this basis, some scholars [4] believe that not only the natural sciences are agricultural technology, but some social science such as management technology should also belong to the category of agricultural technology. For example, under the condition that the natural science used in agriculture remain unchanged, reasonable adjustment of labour force, factor inputs and agricultural structure will lead to agricultural economic benefits. Some scholars even expressed this view that high level of natural science and technology means nothing if there is no use of the social science and technology in agricultural. In other words, the natural science and social science used in agriculture should be considered jointly. After that, more scholars joined into the discussion of the definition of agricultural technology and found that not only the technologies directly used for agricultural development need to be included in the agricultural technology, but also the technologies indirectly used in agricultural development also need to be taken into account, such as communication technology, transportation facilities and meteorological information. Therefore, a broad sense of the definition of agricultural technology was proposed. Gong et al. (2020) [3] describes the board sense of agricultural technology as the change in total agricultural output that cannot be explained by the change in the quantity of physical production factors (e.g., labour and capital) attributed to agricultural technology progress. Wu (1996) [4] simply described the broad sense of agricultural technology as all agricultural technologies that lead to the improvement of agricultural production efficiency. Some scholars support the definition of agricultural technology progress in a narrow sense. This is because increasing agricultural research support will mainly lead to the growth of agricultural technology in the narrow sense, while social science such as management technology and other indirect technologies such as meteorological technology will not be significantly affected by the agricultural indicators. Some scholars support more on the definition of the board sense of agricultural technology. One of the main reasons is that the board sense of agricultural technology is theoretically easier to be measured. In short, after excluding the agricultural economic growth caused by labour force and agricultural production factor inputs, the remaining agricultural economic growth can be seen as the result of agricultural technology progress in a broad sense. Here is a extra point that needs to be mentioned. By definition all technologies used in agricultural activities but the estimated board sense agricultural technology progress refers to the agricultural production technologies. The technologies developed for other purposes, such as improving taste and food safety technologies are not taken into account in the for example Solow residual model [1]. This kind of models cannot measure the level of technology developed for non-productive purposes.
Technological progress has a long research history. In the classical economic growth theory, for example Adam Smith proposed the theory of division of labour to promote economic growth in The Wealth of Nations [5]. One of the reasons why labour division can improve production efficiency is explained as the improvement of workers’ technical level. At this stage, scholars have recognized the importance of technological progress for economic growth, but they have not quantified and measured the technology progress. In neoclassical economic growth theory such as the Solow-Swan economic growth model [6,7], economic output is described as a Cobb-Douglas production function of technology progress, labour force and capital input. Then the technology progress can be measured by Solow residual model. Most of the methods of estimating the technology progress are developed from the Solow residual model and the estimation methods will be discussed later. In the endogenous growth theory [8], technology is regarded as an endogenous factor and is affected by many factors such as labour and capital. For example, labour has direct effect on output and will also indirectly affect output through technology. In other words, the residuals estimated from the Solow residual model are the exogenous part of technology progress. For example, Liang (2005) [1] found that there is a very high correlation between the estimated national technology progress and the estimated agricultural technology progress. So she believes that the agricultural technology progress should be affected by the national technology progress.
In the field of agricultural technology progress, there are many theories. The three most famous theories are the induction theory, the tread milling theory and the technology resource complementary theory. Induction theory believes that a breakthrough in a key agricultural technology will bring a series of technological innovations then agricultural technology progress will show a cyclical phenomenon [9]. Tread milling theory shows that agricultural technology progress in one region will force neighboring regions to make technology progress [4]. The technology resource complementary theory means that the route of technological progress in each region/country is complementary to the local resource situation. In other words, regional land quality, climate characteristics and other endowments determine the direction of agricultural technology development [10]. These different theories will result in a slight difference in the measurement method of agricultural technological progress.
There are three main approaches to estimate the agricultural technology progress: total efficiency method, Solow residual method and composite index method. The total efficiency method is relatively simple. The agricultural technology is assumed to linearly determines the total efficiency of agricultural production. The total efficiency of agricultural production can be measured by the ratio of total agricultural input to the total agricultural output. One of the advantages of the total efficiency method is that, since the total efficiency is a ratio, both the input and output can be the nominal values. The disadvantages are also quite clear. On one hand, the total efficiency of agricultural production perhaps is not a proportion of the agricultural technology progress. On the other hand, to transfer all inputs such as agricultural machinery and irrigation into monetary form is not quite easy. Solow residual method is originally developed from the standard Solow economic growth model where the production process can be described by the Cobb-Douglas production function as Equation (1) where Y is total output; A is the technology level; K is capital; L is labour; and α is coefficient.
Y = A · K α · L 1 α
Y = A 0 e δ t · K α · L 1 α
Y = A 0 e δ t · X 1 α 1 · X 2 α 2 · · · X n α n
For the purpose of estimating the time varying technology level, Equation (1) can be represented as Equation (2). In Equation (2), A 0 is the technology level in the base period; e is used to show the continuous type growth rate; t is time; and δ is the average growth rate for each period of time. This standard method can be used to estimate the technology level for most of the production process including agricultural production process. Lots of the very famous economists develop their own approaches to estimate the technology level for different areas [1]. The popularly accepted approach typically for the issue of agricultural technology progress is given by Equation (3) where X i is the amount of i’s input and α i is the coefficient for this input. Notice that, the sum of the coefficients is not necessarily equal to 1 ( Σ i = 1 n α i 1 ). This equation is particularly useful for agricultural issue since, as we have discussed in the first approach, the total input of agricultural production is hard to be measured. In contrast, in Equation (3), we can estimate the coefficient δ by econometric models and all possible cost variables can be put into the regression. The third approach of estimating the agricultural technology progress is the composite index method. This method is a pure statistical method. First of all, agricultural technology progress is theoretically decomposed into hierarchical components. For instance, the second hierarchy has three components: the directly used agricultural technology from natural science, the directly used agricultural technology from social science and the indirectly used agricultural technology. Then, for each second hierarchical components, a couple of indicators should be prepared. For instance, for directly used agricultural technology from natural science, the new crop varieties is a third component which can be approximated by the ratio of cultivated area of new and old crop varieties [11]. Then use the weight calculated by analytic hierarchy process and the fuzzy evaluation method to estimate the composite index. In addition, there also have some other ways of estimating the agricultural technology progress such as the application of the stochastic frontier analysis (SFA) and data envelopment analysis (DEA) methods on the estimation but the theoretical supports of them are relatively weak [12]. The three main approaches have some weaknesses. The total efficiency method has an unrealistic assumption but lots of evidences suggest that the effect of technology progress on total efficiency should be diminishing returns. The Solow residual method cannot estimate the specific technology levels neither for each period of time nor for each region. This method can only estimate a general growth rate of technology. The composite index method has no economic background. There is no way to check whether the derived composite has the ability to represent the technology level or not.
According to the data in the 2020 World Energy Statistical Yearbook, China’s carbon emission ranked first among the 72 countries being counted, and the per capita carbon emission ranked 26th. According to estimates, China’s agricultural carbon dioxide emissions account for about 16% to 17% of the total [13]. Therefore, China’s agricultural carbon emission is an issue that needs to be concentrated. A couple of points should be discussed. First, compared with other industries, agriculture not only emits carbon, but also neutralizes carbon [14]. In other words, if agricultural carbon emissions increase, it does not mean that agriculture will damage the environment as a whole, so it is necessary to study agricultural carbon emission and carbon sink simultaneously [15,16]. Second, according to the definition, the carbon generated by human activities such as the use of pesticides and fertilizers in the agricultural production process is defined as the agricultural carbon emission [17]. Third, there are two types of definitions for agriculture. Agriculture refers to the planting industry in a narrow sense; Agriculture in a broad sense mainly includes planting industry, animal husbandry, forestry and fishery. Because the carbon issues of the last three categories are hard to be measured, in this paper we will mainly focus on the planting industry. Fourth, the estimation methods of agricultural carbon emission are basically consistent with those of other industries, which are usually obtained through multiplying the amount of carbon source by the carbon emission coefficient [18,19,20,21]. Estimation methods and the carbon emission coefficients are also given by the IPCC where six related aspects are included: agricultural machinery power, cultivated area, agricultural film, fertilizer, pesticide and irrigation. Some argue that the first two aspects should be merged to be one source of agricultural carbon emission as the carbon emission from the use of the agricultural machineries [22,23]. The agricultural carbon sink coefficient of the Chinese agriculture is measured and analyzed by some Chinese scholars [13,21]. They provide a similar way to estimate the amount of agricultural carbon sink.
Although there are many studies on carbon sinks, the definition of carbon sink, especially agricultural carbon sink, is not clear. As far as we know, there is no consistent definition of agricultural carbon sink in textbooks and relevant academic papers. Inter-government Panel on Climate Change (IPCC) provided the definition of carbon sink as “any process, activity or mechanism which removes a greenhouse gas, an aerosol or a precursor of a greenhouse gas from the atmosphere (UNFCCC Article 1.8 (UNFCCC, 1992))” [24]. Thus, agricultural carbon sink usually refers to the carbon fixed by crops from the atmosphere in agricultural industry. So simply speaking, all processes of converting carbon-containing gases (such as carbon dioxide and methane) into solid form should be the carbon sink. It is noteworthy that many ecological scholars only refer to crop soil carbon sinks as crop carbon sinks. This is because, ecological scholars usually use the carbon footprint—a method for studying the flow traces of carbon—of crops to explain and solve the carbon issues [25]. For example, Fan et al. (2019) [26] explained and measured the carbon footprint of crops by the three main components: grains, straw and below-ground residue. For crops, only soil carbon sink is stable for a long time. This is why many relevant studies only focus on agricultural soil carbon sink [27] and only regard agricultural soil carbon sink as agricultural carbon sink. This view has not problems for forest land since the greenhouse gas absorbed by trees will exist in solid form for a long time. But for crops, with the use of grain, it will become greenhouse gas again in a very short time such as one or two years; the decay or burning of straw will also turn solid carbon into greenhouse gas. Only the carbon on the surface of soil will be as stable as the forest land for a long time [28]. There are two implications for clarifying the definition and connotation of agricultural carbon sink. First, we should not think that forest land and grassland can be replaced by farm land because of the considerable carbon sink in the process of crop production [29,30]. As mentioned above, a large proportion of carbon sinks in crop production has been circulating, and only soil carbon sinks are stable. Second, although only agricultural soil carbon sink is stable, we should not consider agricultural soil carbon sink as the only carbon sink and merely focus on this [31,32]. With the improvement of the economy and the quality of life, the proportion of grain in agricultural products relative to other crops (such as cotton and fruit trees) is slowly declining, which will increase the agricultural steady-state carbon sink; With the improvement of agricultural technology, straw burning gradually disappears and straw is gradually used to make organic fertilizer to achieve the goal of replacing chemical fertilizer to reduce carbon emissions [33]. We have reasons to believe that many external factors will directly and indirectly increase agricultural steady-state carbon sink. To sum up, it is appropriate to define agricultural carbon sink as the amount of gaseous carbon converted into solid carbon by crops through photosynthesis.
There are relatively few studies on the impact of agricultural technology progress on agricultural carbon emission or carbon sink, and their results are also inconsistent. Ismael et al. (2018) [34] found evidences that the agricultural carbon emission is significantly affected by agricultural technology progress in Jordanian. Some studies found significant effect of agricultural technology progress on agricultural carbon emission in China [35,36]. However, Tian and Yin (2022) [37] found that the effect of agricultural technology progress on carbon emission in China is statistically significant but practically tiny. So they suggest that government should strongly support the research of the agricultural technologies which have a great impact on reducing carbon emissions. Furthermore, some focused on the role of agricultural technology on the spatial effect of agricultural carbon emission [38]. For example, He et al. (2022) [39] found that the agricultural technology progress does not only reduce the local agricultural carbon emission but also reduce the agricultural carbon emissions of the surrounding regions.
Some gaps in this area still need to be focused further. First, most of the estimation methods can only measure the overall level of the agricultural technology progress but we hope to measure the data at each time points and regions. Second, in most of the studies on agricultural carbon emission, the issue of carbon sink is neglected. This research perspective is biased. Third, because the fundamental driving force of agricultural technology progress is to increase agricultural output, the roles of various agricultural technologies in agricultural carbon emissions and carbon sinks may be significantly different.
Therefore, this article is organized as follows. In Section 3, some theoretical concepts are discussed which include the definition of agricultural technology, the estimation method of agricultural technology progress and the estimation methods of agricultural carbon emission and carbon sink. Section 4 is the empirical section where the estimated values of agricultural technology progress, carbon emission and carbon sink are statistically analyzed first. Then the components of agricultural technology progress are checked. After that the effects of the agricultural technology progress as well as its components on agricultural carbon emission and carbon sink are explored through panel data regressions. At the end, conclusions, policy suggestions and limitations of this study is given in Section 5 and Section 6.

3. Theoretical Base

In this section, there are three subsections. In the first subsection, we will theoretically discuss the definition and compositions of the agricultural technology progress corresponding to previous studies. In the second subsection, the methods of estimating the agricultural technology progress will be introduced and discussed. In the third subsection, the methods of estimating the agricultural carbon emission (ACE) and carbon sink (ACS) will be introduced.

3.1. Definition of the Agricultural Technology Progress

Agricultural technology progress is one of the important factors to promote agricultural economic growth. The two important factors that cause the growth of agricultural economic output are: agricultural scale and agricultural production efficiency. For relatively underdeveloped regions, the former is the main way to expand agricultural output. When the agricultural scale expands to a certain extent, such as the land constraints, improving agricultural efficiency becomes the leading factor in improving agricultural output. Although the focus of our research is on the impact of agricultural technology progress on agricultural carbon emission and carbon sink, the fundamental reason for agricultural technology progress is to increase agricultural output. From this point of view, some components of agricultural technology progress may result in increased carbon emissions and reduced carbon sinks, or vice versa. Therefore, there may not be a stable and inevitable relationship between the overall agricultural technology progress and carbon emission and carbon sink [2]. However, it is possible that there are stable relations between some compositions of the agricultural technology progress and the agricultural carbon emission and carbon sink.
According to Zhao and Zhang (2005) [40], the agricultural technology progress should include three main secondary classifications, which are the agricultural production technology, the agricultural management technology and agricultural service technology, given by Figure 1. Agricultural production technology is easier to understand, and this classification can also be called as the technological progress in natural science. It refers to the technologies which developed from natural sciences such as physics, chemistry and biology that directly used in agricultural production. Agricultural management technology can also be called as the technological progress of social science. In other words, when relevant social science and technology can directly improve agricultural production, these technologies should be included in this classification. Agricultural service technology is relatively abstract. It refers to technologies that indirectly and possibly lead to increased agricultural production. In order to facilitate understanding, agricultural service technology can be regarded as the quality of information generated by the economic market and nature. For example, the former includes the price and demand of agricultural products and other economic market information; and the later refers to the temperature, humidity and wind speed and other natural environmental information. It is called “indirect” because, on the one hand, improving the quality of these information is not caused by the purpose of improving agricultural production, on the other hand, only part of the information is useful for agricultural production.
In Figure 1, we just list some of the main components in the third classifications of the agricultural technology progress of production, management and service. For the perspective of the macro economy, the improvement of these technologies will extend the agricultural product but their effects on agricultural carbon issues should be different.

3.2. Methods of Estimating the Agricultural Technology Level

As we have discussed, the Solow residual method is the fundamental model of measuring the agricultural technology level. However, the agricultural technology level in the standard Solow residual model is assumed to be fixed at that shown in Equation (3). Now, we change this assumption slightly that the agricultural technology level (A) varys across individual at different time as A i , t . So, for the region i at time t, the agricultural production function is described as Equation (4) where i = 1 , 2 , 3 , . . . , n refers to different individuals; t = 0 , 1 , 2 , . . . , T refers to different time periods; and j = 1 , 2 , 3 , . . . , K refers to different agricultural inputs. Equation (5) is the logarithm form of Equation (4) which provides a log-linear type function.
Y i , t = A i , t · Π j = 1 K X i , j , t α j
l n ( Y i , t ) = l n ( A i , t ) + j = 1 K α j l n ( X i , j , t )
It seems that Equation (5) is estimable by econometric models such as the panel data model. However, for example, given by the annually provincial panel data with n provinces and T periods, there are n × T observations, but we cannot estimate n × T numbers of the A i , t . One possible approach is to have more individuals such as using the city level panel data to estimate the provincial issue. Another possible approach is to have more time periods such as using the daily panel data to estimate the annual issue. In practice, for a couple of reasons such as the geographic differences and the seasonal effect, we believe that the annually provincial panel data is the best data set for Chinese agricultural issue. Perhaps this is the reason why most related studies would like to measure the national level or a few years agricultural technology progress.
For the purpose of estimating the annually provincial level agricultural technology progress, a relatively simple idea is to estimate the time fixed effect and the individual fixed effect by the least square dummy variable (LSDV) method, given by Equation (6). Instead of n × T number of the A i , t , here we can achieve T number of the time fixed effects and n 1 number of the individual fixed effects. Notice that, when we add dummy variables in the regression, only x 1 numbers of the dummies is allowed for x events in order to avoid the perfectly collinearity issue. For example, when we generation seasonal dummies, we usually add Q 2 , Q 3 , Q 4 in the regression and the Q 1 is the base. In light of this, we can select the initial period t = 0 as the base for time and first province i = 1 as the base for individual dimension. The advantage of this method is quite clear that less estimators are derived from the regression and thus the estimators are more consistent and efficient. The disadvantage of this method is also quite clear. Only the temporal and regional average levels rather than the specific levels of the agricultural technology progress are achieved.
l n ( Y i , t ) = t = 1 T l n ( A ¯ i ) + i = 2 n l n ( A ¯ t ) + j = 1 K α j l n ( X i , j , t ) + ϵ i , t
Since we suggest the view that different kinds of the agricultural technology progress have different effects on agricultural carbon emission and carbon sink, the approximations of the annually provincial level agricultural technology progress should be calculated through the estimated time fixed effects and individual fixed effects. Because we set the i = 1 and t = 0 as the base, l n ( A ¯ t = 0 ) = l n ( A ¯ i = 1 ) = 0 , the approximation of the agricultural technology progress can be calculated by Equation (7). For illustration, when the annual effect in 2000 is 0.333, the average of the individual effect is 0.200, and the individual effect of province numbered 7 is −0.100, the provincial effect should be −0.300 compared with the national average and then the total effect of the province 7 at year 2000 should be 0.033. For simplicity, when the estimators of the individual effects and the time fixed effects are generally donated by parameter c and θ , then l n ( A ¯ i ) = c i and l n ( A ¯ t ) = θ t . And the average individual effect can be written as c ¯ . Then the finally matrix of the agricultural technology progress is shown by Equation (8). Notice that it is not necessarily remove the average time effect in Equation (8) since the index of the agricultural technology progress at the initial period ( t = 0 ) can be definition as any value we like such as l n ( A i , t = 0 ) = 1 , 100 or other values. Thus, the average of each column of the matrix is equal to the time fixed effect we estimated but the average of each row of the matrix is not equal to the individual fixed effect we estimated.
l n ( A i , t ) = l n ( A ¯ i ) 1 n i = 1 n l n ( A ¯ i ) + l n ( A ¯ t )
l n ( A ) = c ¯ c ¯ + θ 1 c ¯ + θ T c 2 c ¯ c 2 c ¯ + θ 1 c 2 c ¯ + θ T c n c ¯ c n c ¯ + θ 1 c n c ¯ + θ T n × ( T + 1 )
Simulation method is employed to check whether this approximation is representative or not. For a 30 × 30 matrix, we randomly generate their values from −100 to 100 corresponding to the average distribution in which the probability of all values are equal. Then we calculate the individual averages, time averages and total average. Then pure individual effects and time effects can be computed. Given by above method, we generate a new 30 × 30 matrix and check the correlation between the two matrices. We replicate the process for 10 times and the mean and standard derivation of the 10 correlations respectively are 0.42 and 0.047. The approximation matrix of the agricultural technology progress has the ability to capture the characteristics of the practical agricultural technology progress.
Next, depend on this relatively representative matrix and the theoretical classifications of the agricultural technology progress shown in Figure 1, we can find and identify the determinants of the agricultural technology progress by panel data regressions.

3.3. Methods of Estimating the Agricultural Carbon Emission and Carbon Sink

Since agriculture is consisted of crop planting, forestry, livestock husbandry and fishery, both of the agricultural carbon emission and carbon sink are the sum of all the carbon emissions and carbon sink of these four categories [41]. In academic area, there is little works about the carbon emission and carbon sink issues about forestry and fishery. One of the main reasons is that we are not sure which trees are cropped and which fish are cultured. For instance, we cannot treat all trees in a newly demarcated forest area as the consequence of agriculture. These trees may have existed for many years. In light of this, the carbon emissions and carbon sinks caused by trees and fish should not be considered as the consequence of agricultural activities. In China, compared the carbon issues between corp planting and livestock husbandry, the majority of the agricultural carbon emission is determined by the crop planting and only corp planting industry has the ability to eliminate carbon [15]. So, we can simply regards the crop planting industry as the agricultural industry for carbon issues.
By components, there are five sources of agricultural carbon emission: the carbon emission of the agricultural machinery ( A C E A M ), the carbon emission from the production and use of agricultural plastic film ( A C E P F ), the carbon emission from the production and use of pesticide ( A C E P E ), the carbon emission from irrigation ( A C E I R ), and the carbon emission from the production and use of fertilizers ( A C E F E ). The total amount of agricultural carbon emission ( A C E ) is the sum of the amount of the carbon emissions of these five components, given by Equation (9). Notice that the scales of all of A C E and the five should be the same which is usually measured in kilograms (kg).
A C E = A C E A M + A C E P F + A C E P E + A C E I R + A C E F E
According to Duan et al. (2011) [13], the carbon emissions of all these five components are generally equal to the carbon emission coefficient multiplied by the amount of the component. Only for agricultural machinery is A C E A M = α A M 1 × A M + α A M 2 × S A where AM = total agricultural machinery power, SA = total sown area, α A M 1 and α A M 2 are the related carbon emission coefficients. For instance, if the carbon emission coefficient of irrigation is 200 kg/hectare and the irrigation size is 1000 hectares, then the carbon emission caused by irrigation is 200,000 kg. The related carbon emission coefficients are given in Table 1. The practical equations of calculating the A C E i as well as the A C E will be discussed in the empirical section.
As we know, crops, as a kind of plant, will produce and emit carbon dioxide through respiration, and also absorb carbon dioxide through photosynthesis. The respiration always works but the photosynthesis usually works at day time. It is very difficult to distinguish the carbon emission and carbon sink of the plants. Practically, since the net effect of crop is carbon sink [25,26], some scholars call this net effect as the carbon sink of agricultural production process and measure the carbon sink coefficient of China [13,21]. So the agricultural carbon sink ( A C S ) can be roughly measured by the carbon sink coefficient ( α A C S ) multiplied by the size of the cultivated area ( S A ) where the α A C S is also given in Table 1. Initially, we feel that the 5 ton/hectare is too large. We can roughly estimate the among as follows: 1 hectare of soil will produce approximately 15 tons of wheat every year; about 1/3 (= C 6 / C 6 H 12 O 6 = 72 / 180 = 0.4 ) of 15 tons of starch is carbon and thus it is reasonable to sink about 5 tons of carbon per hectare.

4. Empirical Result and Implication

In this section, we will firstly introduce the variables. Then, given by the theoretical guidance, the annually provincial level of the agricultural technology progress will be evaluated ( A T P ) and the determinants of it will also be empirically discussed. After that, the annually provincial level of the agricultural carbon emission ( A C E ) and agricultural carbon sink ( A C S ) will be calculated and statistically analyzed. Finally, corresponding with all necessary variables, the effects of the components of the evaluated agricultural technology progress ( A T P i ) on A C E and A C S will be analysed by panel data econometric models.

4.1. Data Description

Since the research object in this paper is Chinese issues, 15 variables are selected and obtained from China Statistical Yearbook provided by the China’s National Statistical Office. Based on the data quality, the annually provincial panel data with 31 provinces (expect Taiwan, Macao and Hong Kong) is decided. As the significant influence of the COVID-19, the end of the research period is selected to be 2019; also due to the trade-off between more observations and less missing values, the start of the research period is selected to be 2000. The variable names, meanings and the scales are provided in Table 2.
Table 3 provides the statistical description of the organized panel dataset. Since there are 31 provinces and 20 years from 2000 to 2019, the number of observations should be 31 × 20 = 620 if there is no missing values in the variables. Clearly, there are approximately one third of the values are missing in T E C B , A G W A and A G W B . When we check where the missing values come from, T E C B has no missing values from 2006 to 2019 ( 31 × 14 = 434 ), A G W A has no missing values from 2005 to 2019 ( 31 × 15 = 465 ), and there are some missing value in A G W B for the period from 2005 to 2019. In general, our panel data set is a strongly balanced panel for each research section.

4.2. Estimation and Determinants of the Agricultural Technology Progress

The theoretical equation of describing the agricultural production is Equation (6). According to the theoretical guidance, the empirical equation is given by Equation (10). Empirically, we generate individual dummy variables D i ( i = 2 , 3 , 4 , . . . , 31 ) for the 31 provinces and generate time dummy variables D t ( t = 2001 , 2002 , . . . , 2019 ) for the 20 years from 2000 to 2019. Thus, the corresponding estimators c i are the estimated individual fixed effects and estimators θ t are the estimated time effects of the agricultural technology progress. We initially use the number of employed peoples in agricultural industry as the labour force. However, the data quality is too weak. So, total population is used as a proxy of the agricultural labour force. The agricultural capital is tracked by four variables: the horsepower of agricultural machinery ( A M ), the size of sown area ( S A ), the size of irrigation ( I R ) and the consumption of agricultural chemical fertilizer ( F E ). Since the agricultural GDP ( A G D P ) is nominal, the consumer price index ( C P I ) is also considered as one of the explanatory variable. All these six control variables take logarithms in the regression.
l n ( A G D P ) i , t = β 0 + c i D i + θ t D t + β 1 l n ( P O P ) i , t + β 2 l n ( A M ) i , t + β 3 l n ( S A ) i , t + β 4 l n ( I R ) i , t + β 5 l n ( F E ) i , t + β 6 l n ( C P I ) i , t + ϵ i , t
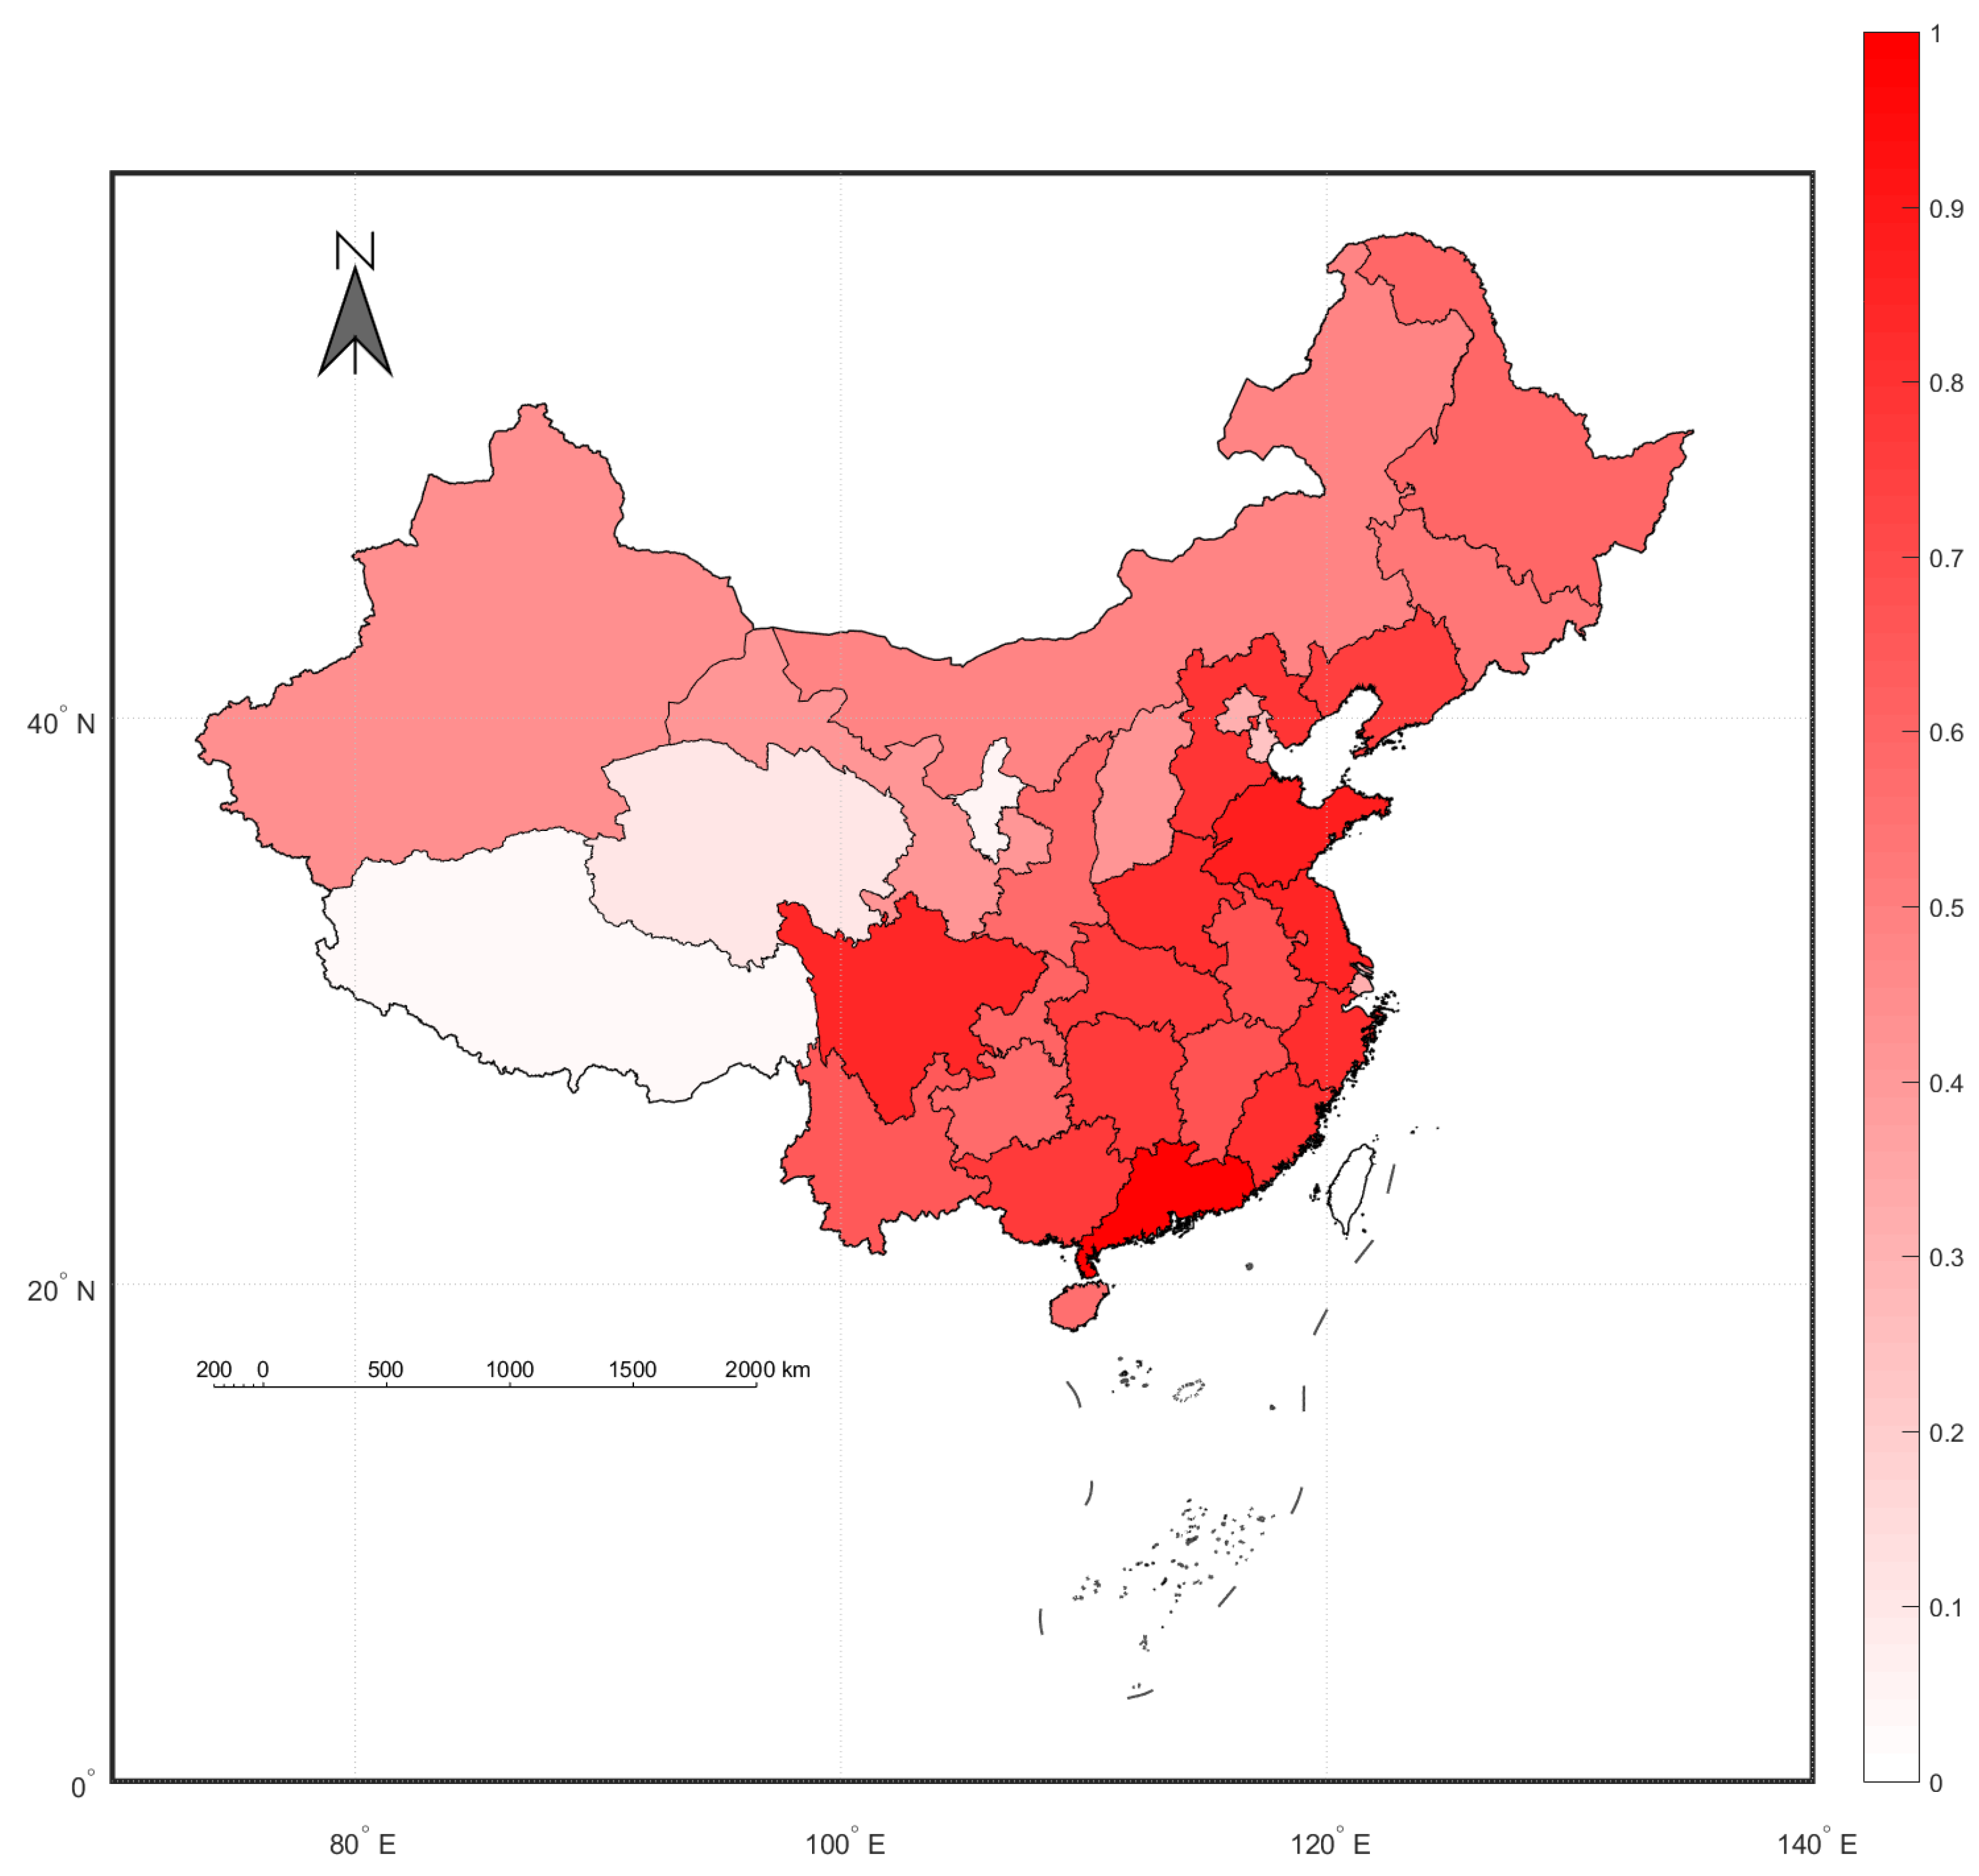
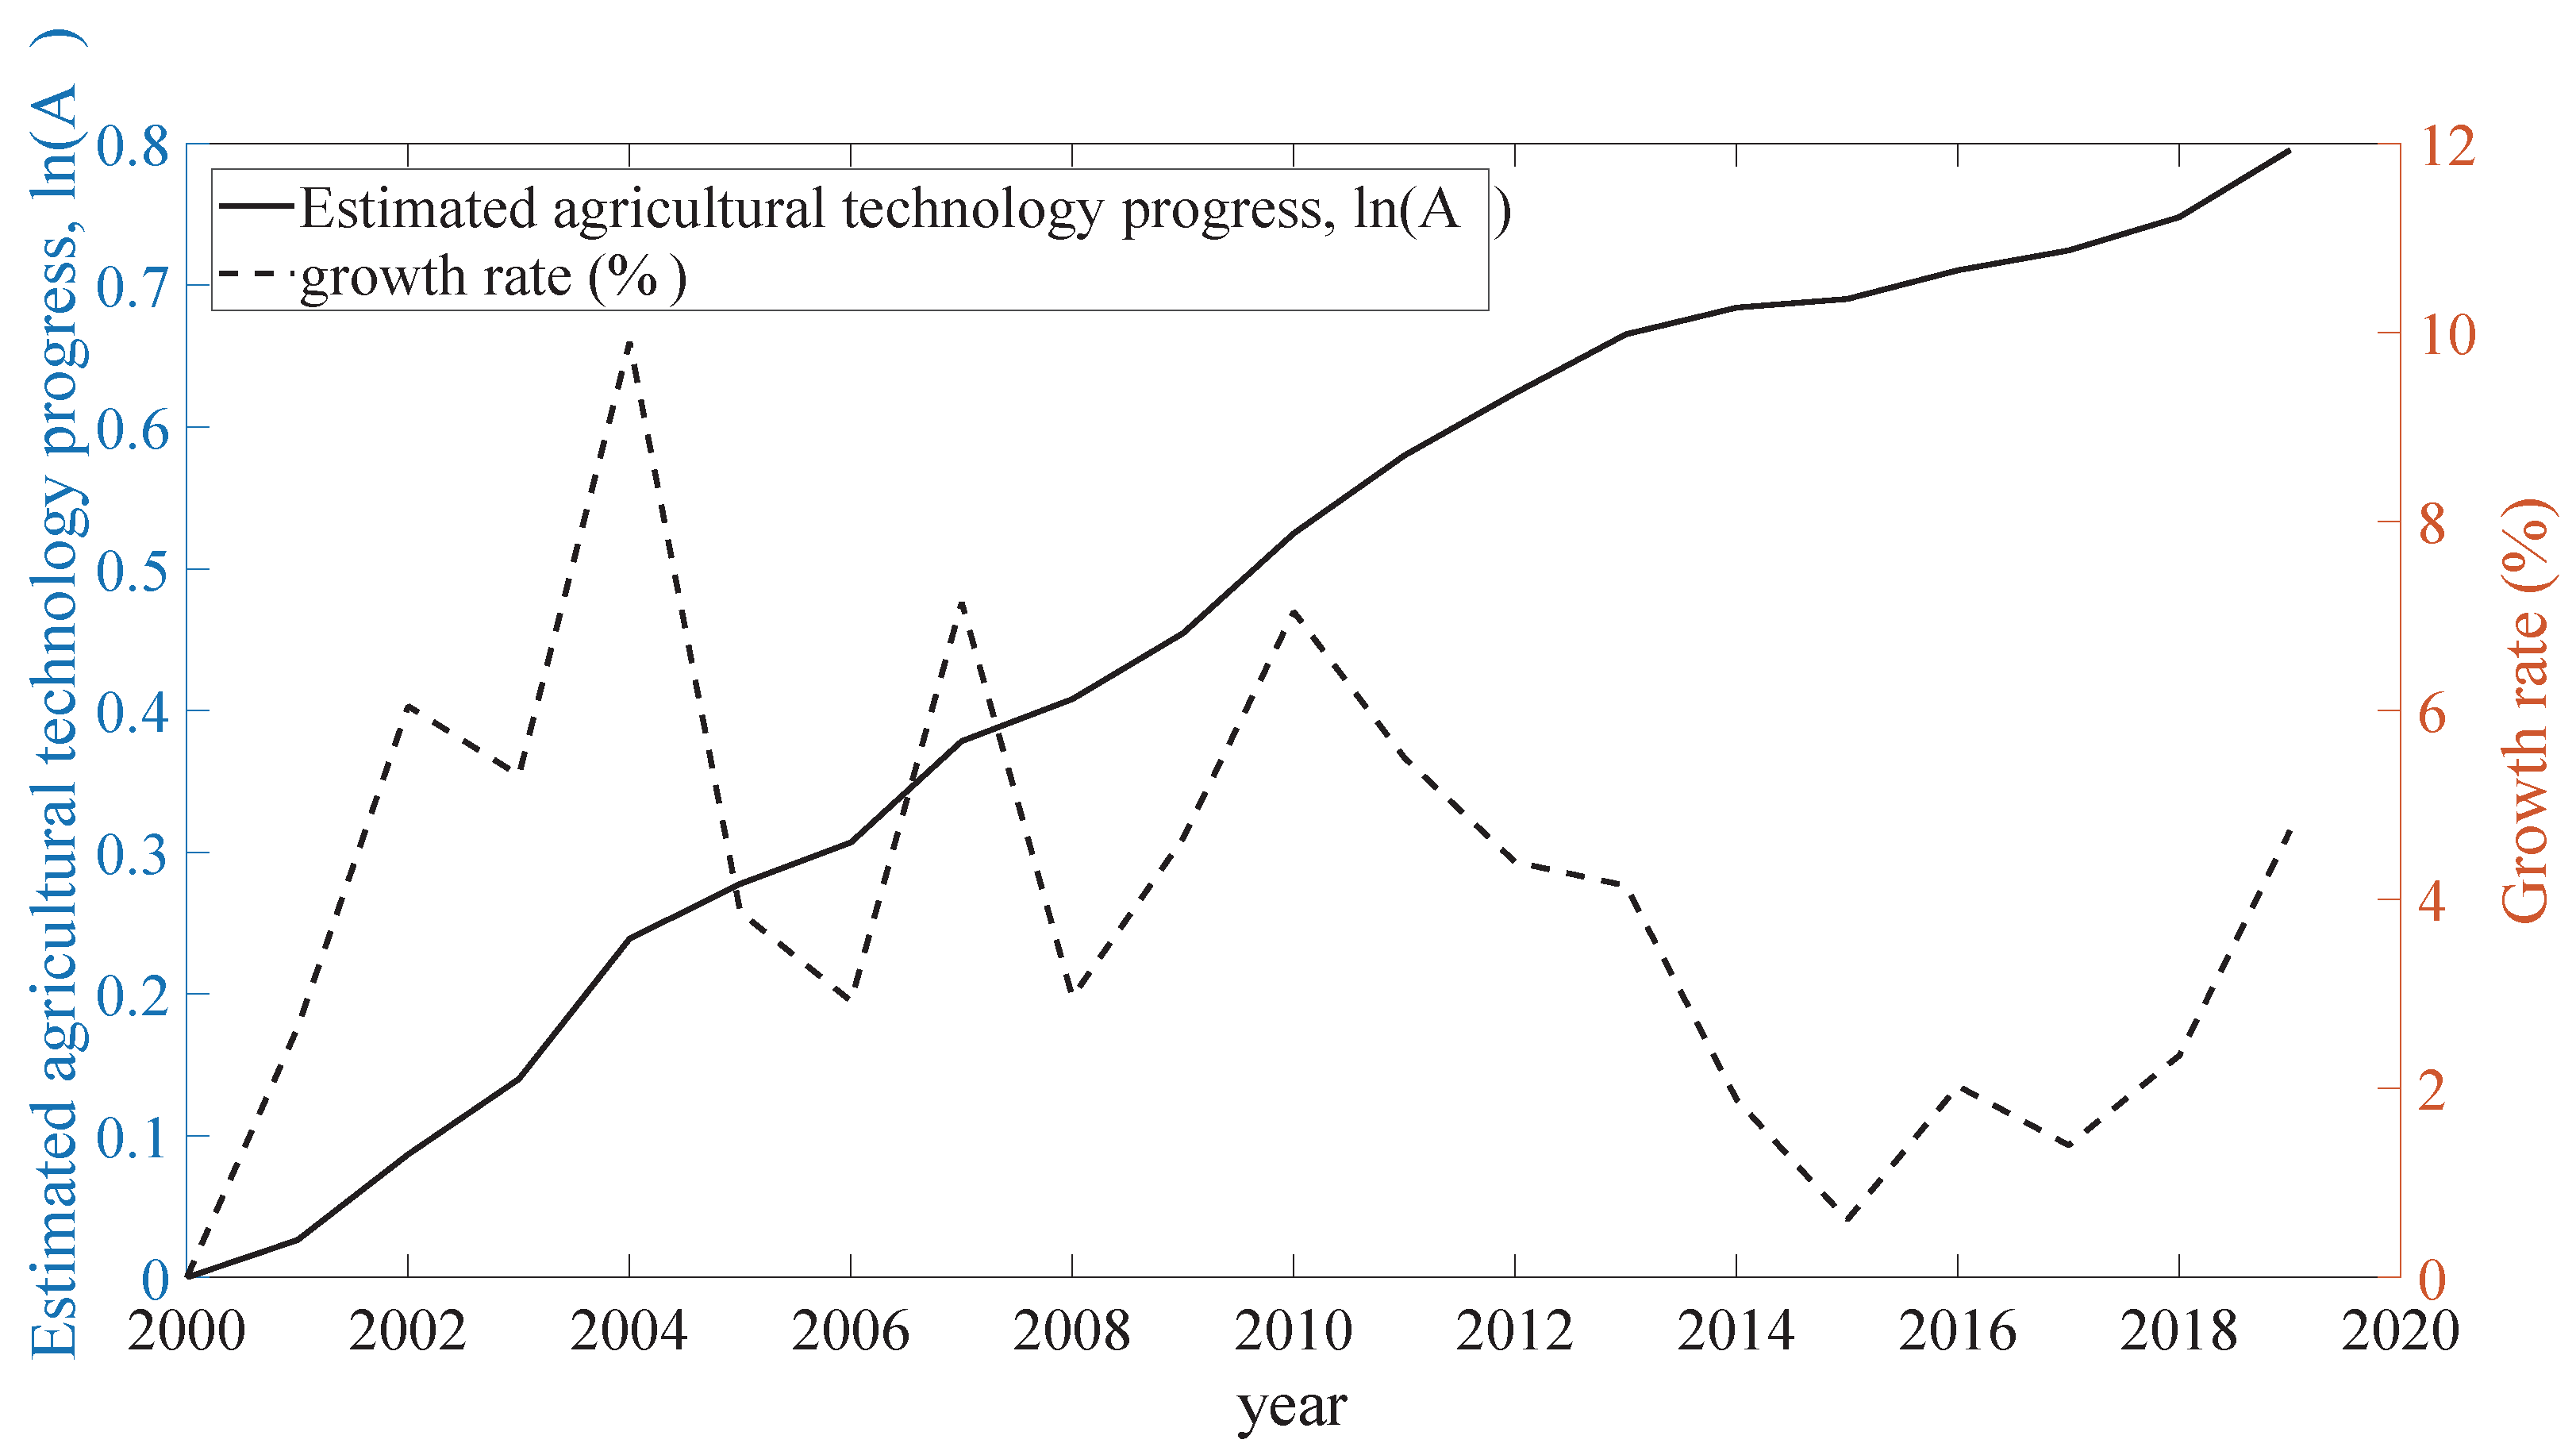
When this temporal-regional fixed effect model is regressed by least square method, all the individual fixed effects except Shanghai are significant under 0.05 significance level, all the time fixed effects except 2001 are significant under 0.01 significance level, and all the six control variables except l n ( A M ) are significant under 0.001 significance level. In general the adjusted R 2 is 0.9917 meaning that all the explanatory variables can explain the change in the dependent variable l n ( A G D P ) . It is not necessarily to show these estimators one by one. For a more vivid approach, the individual fixed effect (ATP, c i ) is shown in Figure 2 and the time fixed effect (ATP, θ t ) is shown in Figure 3.
Figure 2 shows the evaluated regional agricultural technology progress for the period from 2000 to 2019. Higher c i provinces have deeper red. Clearly, compared with the northern China, the agricultural technology progresses of the southern provinces are relatively high; meanwhile, compared with the western China, the agricultural technology progresses of the eastern provinces are relatively high. In general, this figure provides a obvious spatial distribution of the agricultural technology progress. This may be caused by temperature, economic development or even geographic factors.
Figure 3 shows the national level of the evaluated agricultural technology progress for the period from 2000 to 2019 ( θ t ), and its growth rate (%). Generally, the θ series has a growing trend. In contrast, the growth rate of it is relatively stable at approximately 6% before 2010. After that, the growth rate falls from 7% to 1% for the period from 2010 to 2015, and rise from 1% to 5% for the period from 2015 to 2019.
Now, we should try to find and judge what are the determinants of agricultural technology progress. According to the components of agricultural technology progress shown in Figure 1, we are going to find suitable variables for each of the three secondary classifications. For agricultural production technology, some previous studies [11] treat the proportion of sown area of the new varieties to total sown area (= S A n e w / S A ) as one of the main components of the agricultural production technology. However, the annually provincial level panel data of the sown area of the new varieties is not counted after 2015. So it is insufficient for us also to apply this data. Instead, the proportion of the sown area of the non-grain crops to total sown area ( T E C A = 1 S A g r a i n / S A ) is applied as the approximation of the agricultural production technology since growing vegetables, fruit trees, fungi and other kinds of the non-grain crops requires higher production technology. For agricultural management technology, the ratio between average income of agricultural practitioners and resident average income ( T E C B = A G A I / A I ) is used as the proxy of the agricultural management technology. On one hand, the income ratio can represent the relative human capital of the agricultural practitioners; on the other hand, the income ratio should also relate to the labour input of the agricultural practitioners. Simply speaking, relative high income implies more professional managers and more management time. For agricultural service technology, two suitable variables, A G W A and A G W B , are found as the components of agricultural service technology which are respectively the number of agricultural meteorological station and the number of eco-agricultural meteorological station. Simply speaking, the former mainly detect temperature, precipitation and wind speed and the later can also detect light intensity, humidity and soil temperature in a higher frequency (e.g., minute and hour data) which are particularly helpful for for example the greenhouse planting. Although whether the meteorological information is useful at the micro level depends on the quality of the individuals, it is definitely an important part of the agricultural service technology. Since the individual effect, the fixed effect panel model is applied to estimate the effects of these four variables on agricultural technology progress. Estimated results of the related regressions (1)–(5) are given by Table 4.
According to the results shown in regressions (1) and (2), both the production technology and management technology are significant determinants of the evaluated agricultural technology progress. The estimator of the interaction term is negative implying that the marginal effect of both the T E C A and T E C B are affected by the other. In other words, the level of the production technology and the level of the management technology has best shares. For illustration, when the production technology keeps constant, the increase in management technology will directly cause high overall technology level but, due to the mismatch between production and management technology, the positive effect will be reduced. Results of regressions (3) and (4) point out that both of the A G W A and A G W B are determinants of A T P . And, the insignificant interaction term means that they have neither substitution effect nor complement effect. Regression (5) is the final regression in this part where all significant components are considered. The R2 (within) is 0.508 which implies that these selected explanatory variables have the ability to capture the change in the evaluated agricultural technology progress ( A T P ).

4.3. Estimation of the Agricultural Carbon Emission and Carbon Sink

Corresponding with the theoretical interpretations, the empirical equations of calculating the agricultural carbon emission (ACE) of the five sources are respectively given by Equations (11)–(15). The empirical equation of calculating the agricultural carbon sink (ACS) is given by Equation (16). The related coefficients of ACE and ACS are shown in Table 1. Meanwhile, the scales of the coefficients and the variables are also shown in the brackets where the scales of the coefficients can be found in Table 1 and the scales of the variables can be found in Table 2.
A C E A M ( kg ) = 0.18 ( kg · kW 1 ) × A M ( 10000 kW ) × 10000 + 16.47 ( kg · hectare 1 ) × S A ( 1000 hectares ) × 1000
A C E P F ( kg ) = 5.18 ( kg · kg 1 ) × P F ( 1000 kg ) × 1000
A C E P E ( kg ) = 4.9341 ( kg · kg 1 ) × P E ( 10 7 kg ) × 10 7
A C E I R ( kg ) = 266.48 ( kg · hectare 1 ) × I R ( 1000 hectares ) × 1000
A C E F E ( kg ) = 0.8956 ( kg · kg 1 ) × F E ( 10 7 kg ) × 10 7
A C S ( kg ) = 5.0925 ( ton · hectare 1 ) × 1000 ( kg / ton ) × S A ( 1000 hectares ) × 1000
Figure 4 provides the average levels of the the ACS and ACE, and the five sources of the ACE in 2019. In general, the first pie graph shows that the ACS is approximately 10 time bigger than the ACE. It implies that the net effect of agricultural activities is carbon sink. Developing agricultural scale helps to reduce carbon emissions since the carbon in agricultural carbon sink can be the carbon which generated from agricultural activities. The second pie graph gives us the shares of each components of the ACE. The main source of the carbon emission is caused by the production and use of the chemical fertilizer.
We also calculate the national levels of the agricultural carbon emission and carbon sink which are the sum of the provincial values. For both of the two, the logarithm form is taken, shown in Figure 5. Compared between the two series, the ACS is always 10 times bigger than ACE ( l n ( A C S ) l n ( A C E ) l n ( 10 ) = 2.3 ). For ACS, it is relatively stable before 2008 and increases from 2008 to 2015, and is basically unchanged after 2015. For ACE, there is a steady upward trend before 2015 and a steady downward trend after 2015. Although it is not shown here, data shows that this upward and downward trend is caused by the upward and downward trend in the use of the chemical fertilizer.

4.4. The Effects of Agricultural Technology Progress on Agricultural Carbon Emission and Carbon Sink

Now we are going to estimate the effects of agricultural technology progress on agricultural carbon emission and agricultural carbon sink. Clearly, the logarithms of the ACE and ACS are the two dependent variables (ln( A C E ) and ln( A C S )); the explanatory variables are the evaluated agricultural technology progress ( A C E = e s t . l n ( A ) ) and its three components: the agricultural production technology approximated by T E C A , the agricultural management technology approximated by T E C B , and the agricultural service technology approximated by A G W A and A G W B .
The span of 20 years is not short and thus the stationarity of all these 7 variables—ln( A C E ), ln( A C S ), A T P , T E C A , T E C B , A G W A and A G W B —should be checked before regression analysis. Since all these 7 variables are panel set, the stationarity of them should be tested by panel data stationary tests. There are four commonly used tests: Levin-Lin-Chu (LLC) unit-root test, Im-Pesaran-Shin (IPS) unit-root test, ADF-Fisher type unit-root test, and Hadri LM stationary tests. Beyond the econometric technique, actually the null hypothesis of these four tests are different. Here the LLC unit-root test is applied. All these variables except A G W B are stationary (p < 0.001). The variable A G W B cannot be tested by the LLC test since this variable has some missing values. Due to the similarity between A G W A and A G W B , A G W B should also be a stationary panel variable.
Five regressions, regressions 6–10, are conducted to focus on agricultural carbon emission (dependent = ln( A C E )) and estimated results are shown in Table 5; another five regressions 11–15 are conducted to estimate the determinants of the agricultural carbon sink (dependent = ln( A C S )) and the estimated results are shown in Table 6. For both of the two dependents, we firstly check the effect of the evaluated agricultural technology progress ( A T P ) on the dependents and then check the effects of the components of the A T P on the dependents. Meanwhile, since the theoretical suggestions such as the inverted U shape relation described in the environmental Kuznets theory and the empirical evidences that the marginal effects on agricultural carbon indicators are declined, we are going to check these non-linear relations through the application of the squares of the variables. We also check the interactions among possible explanatory variables but none of them are significant. For each estimated relation, Hausman test is applied to check between the fixed effect or random effect panel models, and results (p < 0.01) show that the fixed effect model is more appropriate. The effects of lagged variables are also checked and almost all of them are insignificant.
For ACE, the R2 of regressions 6 and 7 are significantly higher than the R2 of regressions 8–10. This is acceptable since the explanatory power of the components of A T P should be lower than A T P . Otherwise, if the R2 of the components of A T P is higher, it implies other mechanisms from the components of A T P to the dependent variable ln( A C E ). Results of regressions 6 and 7 implies that there is a inverted U shape effect of A T P on ln( A C E ). The peak of this inverted U relation is at A T P = 6.7 (= 0.5 × 0.482 / 0.036 ). However, practically the minimum and maximum of A T P shown in Table 3 are −1.97 and 2.22. Hence, for recent situation, rise in agricultural technology progress leads to higher amount of agricultural carbon emission. In the future, when A T P can keep rising to about 6.6 times the current level ( 6.7 0.5 × ( 1.97 + 2.22 ) 6.6 ), the continued growth of A T P will cause the decline of ln( A C E ). Because A T P has a long-term upward trend, accelerating the development of agricultural technology level is an inevitable way to reduce ACE from the trade-off between short-term and long-term. As we have discussed in the theoretical part, different kinds of the technologies perhaps cause different effect on agricultural carbon emission. The estimated results of regressions 8–10 have some implications. First, the agricultural production technology is insignificant. One of the possible reasons is that agricultural production technology only developed for agricultural development rather than agricultural environmental protection. Second, the effect of agricultural management technology on ln( A C E ) is a significant U shape relation. At present, the development of agricultural management technology will help reduce agricultural carbon emissions. Third, both effects of A G W A and A G W B on ln( A C E ) are inverted U shape. The peak of A G W A is 71 and the practical interval is [1, 121]; the peak of A G W B is 32 and the practical interval is [1, 100]. One of the acceptable interpretations is that the agricultural production as well as the generate carbon is diminishing increased but the environmental protect effect is proportionally increased with the rise in agricultural service technology.
The mechanisms implied in Table 6 are obviously different compared with that shown in Table 5. First, given by the results of regressions 11 and 12, the effect of agricultural technology progress on agricultural carbon sink is not significant. For the components of the A T P , regression 14 is the most accurate regression among regressions 13–15 according to the trade-off between the explanatory power and the significance of the variables. Therefore, from now on, since the A T P in regressions 11 and 12 are generally insignificant, we are not sure whether the significant effects in regression 14 are true or are caused through other mechanisms. But if these are true, higher agricultural production technology means lower level of agricultural carbon sink; agricultural service technology has inverted U shape effect on ln( A C S ). The peaks of A G W A and A G W B are 70 and 39, and their practical intervals are [1, 121] and [1, 100]. These two peaks are quite closed to the peaks estimated in regression 10. This similarity implies that, although some of components of the agricultural technology progress have significant effect on agricultural carbon indicators, those are incidental consequences of agricultural technology progress.

5. Discussion

5.1. Decomposition of Agricultural Technology Level

First of all, because the empirical results of this paper show that the impact of agricultural technology level on agricultural carbon sinks is both economically and statistically insignificant, here we only discuss the impact of agricultural technology level on agricultural carbon emissions.
For the research of agricultural technology level, most of them regard agricultural technology level as a whole, which is mainly caused by two reasons. One is the lack of data on the components of agricultural technology level, and the other is the habitual assumption left by borrowing macroeconomic models. As for the research problem in this paper—the impact of agricultural technology level on agricultural carbon emissions—we cannot take agricultural technology level as a whole. Some agricultural technologies are developed to promote production, but some are aimed at food safety. The impact of these technologies on agricultural carbon emissions will vary greatly.
The research results of this paper show that although the current development of agricultural production technology will lead to an increase in carbon emissions, agricultural carbon emissions will be reduced when agricultural production technology develops to a certain extent. This suggests that unswerving development of agricultural production technology is the feasible way to reduce carbon emissions in the long term. At present, the development of agricultural management technology will significantly inhibit agricultural carbon emissions. Developing agricultural management technology is also one of the feasible ways to reduce agricultural carbon emissions. However, it should be noted that agricultural production technology and agricultural management technology interact with each other on the issue of agricultural carbon emissions. It is better for the two to develop in synergy.
One limitation of this paper is that the components of agricultural technology level involved are slightly less. We hope to find more numbers and more representative variables of agricultural technology level, and get more convincing results in the future.

5.2. Measurement Method and Empirical Model

In two aspects, this study also has some limitations. Despite the developed model can estimate the temporal and spatial levels of the agricultural technology level, the simulated results reflect that the approximations are generally not strongly representative. We decide to repeat this research by the city level panel data in the future. Another issue is that there is a very significant regional distribution shown in the map but the regional effect such as the neighbourhood effect has not been considered in the empirical analysis. Next, we decide to explore the reasons and the influences of spatial spillover in agricultural technology level. This is perhaps also helpful for the agricultural carbon issues.

6. Conclusions

This study aims to explore the effect of agricultural technology progress on agricultural carbon emission and carbon sink in China. According to the theoretical methods typically the Solow residual models, we firstly develop a method to estimate the temporal and spatial levels of the agricultural technology progress. The method of estimating the agricultural carbon emission and carbon sink are also introduced. Given on the China’s provincial panel data of the 31 provinces from 2000 to 2019, for each province and each year, all of the evaluated agricultural technology progress ( A T P ), the agricultural carbon emission ( A C E ) and carbon sink ( A C S ) are calculated. Basic statistical analysis points out that the A T P has a steady upward trend and the growth rate is approximately 4% per year; A T P is relatively high in the south-east of China; A C S is generally 10 time higher than A C E and the main component of the ACE is caused by chemical fertilizer. Since we believe that the agricultural technology is developed for the purpose of the agricultural economic growth, the effects of the three components of the agricultural technology—agricultural production technology, agricultural management technology and agricultural service technology—on agricultural carbon indicators are different. Empirical results imply that in general A T P as well as its three components have significant effect on ACE but no on ACS.
Corresponding with all the findings in this research, we suggest that: (1) Government should continue to vigorously promote the development of agricultural technology. When the level of agricultural technology crosses the inflection point, the progress of agricultural technology will reduce agricultural carbon emissions. So in the long run, agricultural technology progress is a feasible way to reduce carbon emissions. (2) Government should not ignore the ability of technological progress in agricultural management to solve the current carbon emission problem. Government can improve agricultural management technology through education and talent policy, but it should be noted that agricultural management technology needs to develop in coordination with agricultural production technology.

Author Contributions

Conceptualization, S.L. and Z.W.; methodology, S.L. and Z.W.; software, S.L.; validation, S.L. and Z.W.; resources, S.L.; data curation, S.L.; writing—original draft preparation, S.L.; writing—review and editing, S.L. and Z.W.; visualization, S.L.; supervision, Z.W.; project administration, S.L. and Z.W.; funding acquisition, S.L. and Z.W. All authors have read and agreed to the published version of the manuscript.

Funding

This research was funded by project “Research on the multi-path design and policy coordination for the follow-up support of relocation in western China” of the “Key Projects of the State Social Science Fund” (Grant No.: 21ASH005).

Institutional Review Board Statement

Not applicable.

Informed Consent Statement

Not applicable.

Data Availability Statement

The data presented in this study are available upon request from the corresponding author.

Conflicts of Interest

The authors declare no conflict of interest.

References

  1. Liang, J. Review on the contribution of agricultural technology progress. Anhui Agric. Sci. Bull. 2005, 11, 17–18, 21. [Google Scholar] [CrossRef]
  2. Xia, M.; Zeng, D.; Huang, Q.; Chen, X. Coupling Coordination and Spatiotemporal Dynamic Evolution between Agricultural Carbon Emissions and Agricultural Modernization in China 2010–2020. Agriculture 2022, 12, 1809. [Google Scholar] [CrossRef]
  3. Gong, B.; Zhang, S.; Wang, S.; Yuan, L. 70 Years of Technological Progress in China’s Agricultural Sector. Agric. Econ. Probl. 2020, 2020, 11–29. [Google Scholar] [CrossRef]
  4. Wu, F. The concept, measurement and problems of agricultural technology progress. Agric. Technol. Econ. 1996, 1996, 31–35. [Google Scholar] [CrossRef]
  5. Smith, A. An Inquiry into the Nature and Causes of the Wealth of Nations; Modern Library: New York, NY, USA, 1937. [Google Scholar]
  6. Dimand, R.W.; Spencer, B.J. Trevor Swan and the neoclassical growth model. Hist. Political Econ. 2009, 41, 107–126. [Google Scholar] [CrossRef]
  7. Solow, R.M. A contribution to the theory of economic growth. Q. J. Econ. 1956, 70, 65–94. [Google Scholar] [CrossRef]
  8. Romer, P.M. The origins of endogenous growth. J. Econ. Perspect. 1994, 8, 3–22. [Google Scholar] [CrossRef] [Green Version]
  9. Zhang, Y. Induced Invention Theory and the direction of Chinese Agriculture Technique Innovation. J. Zhengzhou Inst. Aeronaut. Ind. Manag. 2006, 24, 25–28. [Google Scholar] [CrossRef]
  10. Wei, J.; Qi, C. Coupling Coordination Degree Analysis of the Agricultural Technology Progress and Factor Endowment in China. China Popul. Resour. Environ. 2015, 25, 90–96. [Google Scholar] [CrossRef]
  11. Zhou, C.L.H. Relationship between agricultural technology progress and carbon emission intensity: An empirical analysis under different influence paths. J. China Agric. Univ. 2020, 25, 162–171. [Google Scholar] [CrossRef]
  12. Dong, Y.; Mu, Y. Agricultural Technological Progress, Rural Labor Transfer and the Effect on Regional Wage and Income Gap—Based on SFA-CGE Two-Stage Model. J. Beijing Inst. Technol. (Soc. Sci. Ed.) 2015, 17, 91–98. [Google Scholar] [CrossRef]
  13. Duan, H.; Zhang, Y.; Zhao, J.; Bian, X. Carbon Footprint Analysis of Farmland Ecosystem in China. J. Soil Water Conserv. 2011, 25, 6. [Google Scholar]
  14. Chen, S.; Duan, Y. Research on status, focus and developing trend of agricultural carbon effect in China. Adv. Earth Sci. 2022, 38, 86–98. [Google Scholar]
  15. Holka, M.; Kowalska, J.; Jakubowska, M. Reducing Carbon Footprint of Agriculture–Can Organic Farming Help to Mitigate Climate Change? Agriculture 2022, 12, 1383. [Google Scholar] [CrossRef]
  16. Li, S.; Zhu, Z.; Dai, Z.; Duan, J.; Wang, D.; Feng, Y. Temporal and Spatial Differentiation and Driving Factors of China’s Agricultural Eco-Efficiency Considering Agricultural Carbon Sinks. Agriculture 2022, 12, 1726. [Google Scholar] [CrossRef]
  17. Tian, Y.; Yin, M. Re-evalutation of China’s Agricultural Carbon Emissions: Basic Status, Dynamic Evolution and Spatial Spillover Effect. Chin. Rural. Econ. 2022, 3, 104–127. [Google Scholar]
  18. Johnson, J.; Franzluebbers, A.; Weyers, S.; Reicosky, D. Agricultural opportunities to mitigate greenhouse gas emissions. Environ. Pollut. 2007, 150, 107–124. [Google Scholar] [CrossRef]
  19. Mosier, A.; Halvorson, A.; Reule, C.; Liu, X. Net Global Warming Potential and Greenhouse Gas Intensity in Irrigated Cropping Systems in Northeastern Colorado. J. Environ. Qual. 2006, 35, 1584–1589. [Google Scholar] [CrossRef] [Green Version]
  20. West, T.; Marland, G. A synthesis of carbon sequestration, carbon emissions, and net carbon flux in agriculture: Comparing tillage practices in the United States. Agric. Ecosyst. Environ. 2002, 91, 217–232. [Google Scholar] [CrossRef]
  21. Xiong, C.; Yang, D.; Huo, J.; Wang, G. Agricultural Net Carbon Effect and Agricultural Carbon Sink Compensation Mechanism in Hotan Prefecture, China. Pol. J. Environ. Stud. 2017, 26, 365–373. [Google Scholar] [CrossRef]
  22. Ma, T. Assessment on the Current Situation of Carbon Sink of Agricultural Carbon Sources in Shanghai and Analysis on the Potential of Increasing Carbon Sink. Agro-Environ. Dev. 2011, 2011, 38–41. [Google Scholar]
  23. Sun, Y. Preliminary Analysis of the Relationship between Agricultural Carbon Emission and Agricultural Economy in Anhui. Environ. Sci. Surv. 2022, 41, 36–41. [Google Scholar] [CrossRef]
  24. Solomon, S.; Qin, D.; Manning, M.; Chen, Z.; Marquis, M.; Averyt, K.B.; Tignor, M.; Miller, H.L. (Eds.) The Physical Science Basis. Contribution of Working Group I to the Fourth Assessment Report of the Intergovernmental Panel on Climate Change; Cambridge University Press: Cambridge, UK; New York, NY, USA, 2007; Volume 996, pp. 113–119. [Google Scholar]
  25. She, W.; Wu, Y.; Huang, H.; Chen, Z.; Cui, G.; Zheng, H.; Guan, C.; Chen, F. Integrative analysis of carbon structure and carbon sink function for major crop production in China’s typical agriculture regions. J. Clean. Prod. 2017, 162, 702–708. [Google Scholar] [CrossRef]
  26. Fan, J.; McConkey, B.G.; Liang, B.C.; Angers, D.A.; Janzen, H.H.; Kröbel, R.; Cerkowniak, D.D.; Smith, W.N. Increasing crop yields and root input make Canadian farmland a large carbon sink. Geoderma 2019, 336, 49–58. [Google Scholar] [CrossRef]
  27. Smith, P.; Goulding, K.W.; Smith, K.A.; Powlson, D.S.; Smith, J.U.; Falloon, P.; Coleman, K. Enhancing the carbon sink in European agricultural soils: Including trace gas fluxes in estimates of carbon mitigation potential. Nutr. Cycl. Agroecosyst. 2001, 60, 237–252. [Google Scholar] [CrossRef]
  28. Wang, B.; Li, Y.; Cai, A.; Liu, S.; Ren, T.; Zhang, J. Global policies in agricultural greenhouse gas reduction and carbon sequestration and their enlightenment to China in the view of carbon neutrality. Clim. Chang. Res. 2022, 18, 110–118. [Google Scholar] [CrossRef]
  29. Tian, Y.; Zhang, J. Regional Differentiation Research on Net Carbon Effect of Agricultural Production in China. J. Nat. Resour. 2013, 28, 1298–1309. [Google Scholar] [CrossRef]
  30. Xie, Y.; Liu, Z. Study on the temporal and spatial differentiation and equity of carbon sink and carbon emission of China’s provincial planting industry. World Agric. 2022, 2022, 100–109. [Google Scholar] [CrossRef]
  31. Cai, Y.; Wang, L. Carbon sequestration and greenhouse gas mitigation paths and modes in a typical agroecosystem in northern China. Chin. J. Eco-Agric. 2022, 30, 641–650. [Google Scholar] [CrossRef]
  32. Naorem, A.; Jayaraman, S.; Dalal, R.; Patra, A.; Rao, C.; Lal, R. Soil Inorganic Carbon as a Potential Sink in Carbon Storage in Dryland Soils–A Review. Agriculture 2022, 12, 1256. [Google Scholar] [CrossRef]
  33. Balogh, J. The impacts of agricultural development and trade on CO2 emissions? Evidence from the Non-European Union countries. Environ. Sci. Policy 2022, 137, 99–108. [Google Scholar] [CrossRef]
  34. Ismael, M.; Srouji, F.; Boutabba, M. Agricultural technologies and carbon emissions: Evidence from Jordanian economy. Environ. Sci. Pollut. Res. 2018, 25, 10867–10877. [Google Scholar] [CrossRef]
  35. Yang, J. The Effects of Technological Advances on Agricultural Carbon Emission. Soft Sci. 2013, 27, 116–120. [Google Scholar]
  36. Hu, Z. Technical Progress, Technical Efficiency and Agricultural Carbon Emissions in China. East China Econ. Manag. 2018, 32, 100–105. [Google Scholar] [CrossRef]
  37. Tian, Y.; Yin, M. Does Technological Progress Promote Carbon Emission Reduction of Agricultural Energy? Test Based on Rebound Effect and Spatial Spillover Effect. Reform 2022, 12, 45–58. [Google Scholar]
  38. Yang, Y.; Tian, Y.; Peng, X.; Yin, M.; Wang, W.; Yang, H. Research on Environmental Governance, Local Government Competition, and Agricultural Carbon Emissions under the Goal of Carbon Peak. Agriculture 2022, 12, 1703. [Google Scholar] [CrossRef]
  39. He, Y.; Cheng, X.; Wang, F. Study on the Regional Spillover Effect of Agricultural Carbon Emission Based on the Perspective of Agricultural Technology Diffusion. J. Agrotech. Econ. 2022, 4, 132–144. [Google Scholar] [CrossRef]
  40. Zhao, Z.; Zhang, S. Factors of Agricultural Technical Imporvement and Its Quantitative Analysis. Issues Agric. Econ. 2005, s1, 70–75. [Google Scholar]
  41. Wen, S.; Hu, Y.; Liu, H. Measurement and Spatial–Temporal Characteristics of Agricultural Carbon Emission in China: An Internal Structural Perspective. Agriculture 2022, 12, 1749. [Google Scholar] [CrossRef]
  42. He, T.; Zhang, L. The Situation of Agricultural Carbon Release in Anhui Province and an Analysis of Approaches for Low-carbon Agricultural Development. J. Anhui Agric. Univ. (Soc. Sci. Ed.) 2012, 21, 30–34. [Google Scholar] [CrossRef]
  43. Wang, B.; Zhang, W. A research of agricultural eco-efficiency measure in China and space-time differences. China Popul. Resour. Environ. 2016, 26, 11–19. [Google Scholar] [CrossRef] [PubMed]
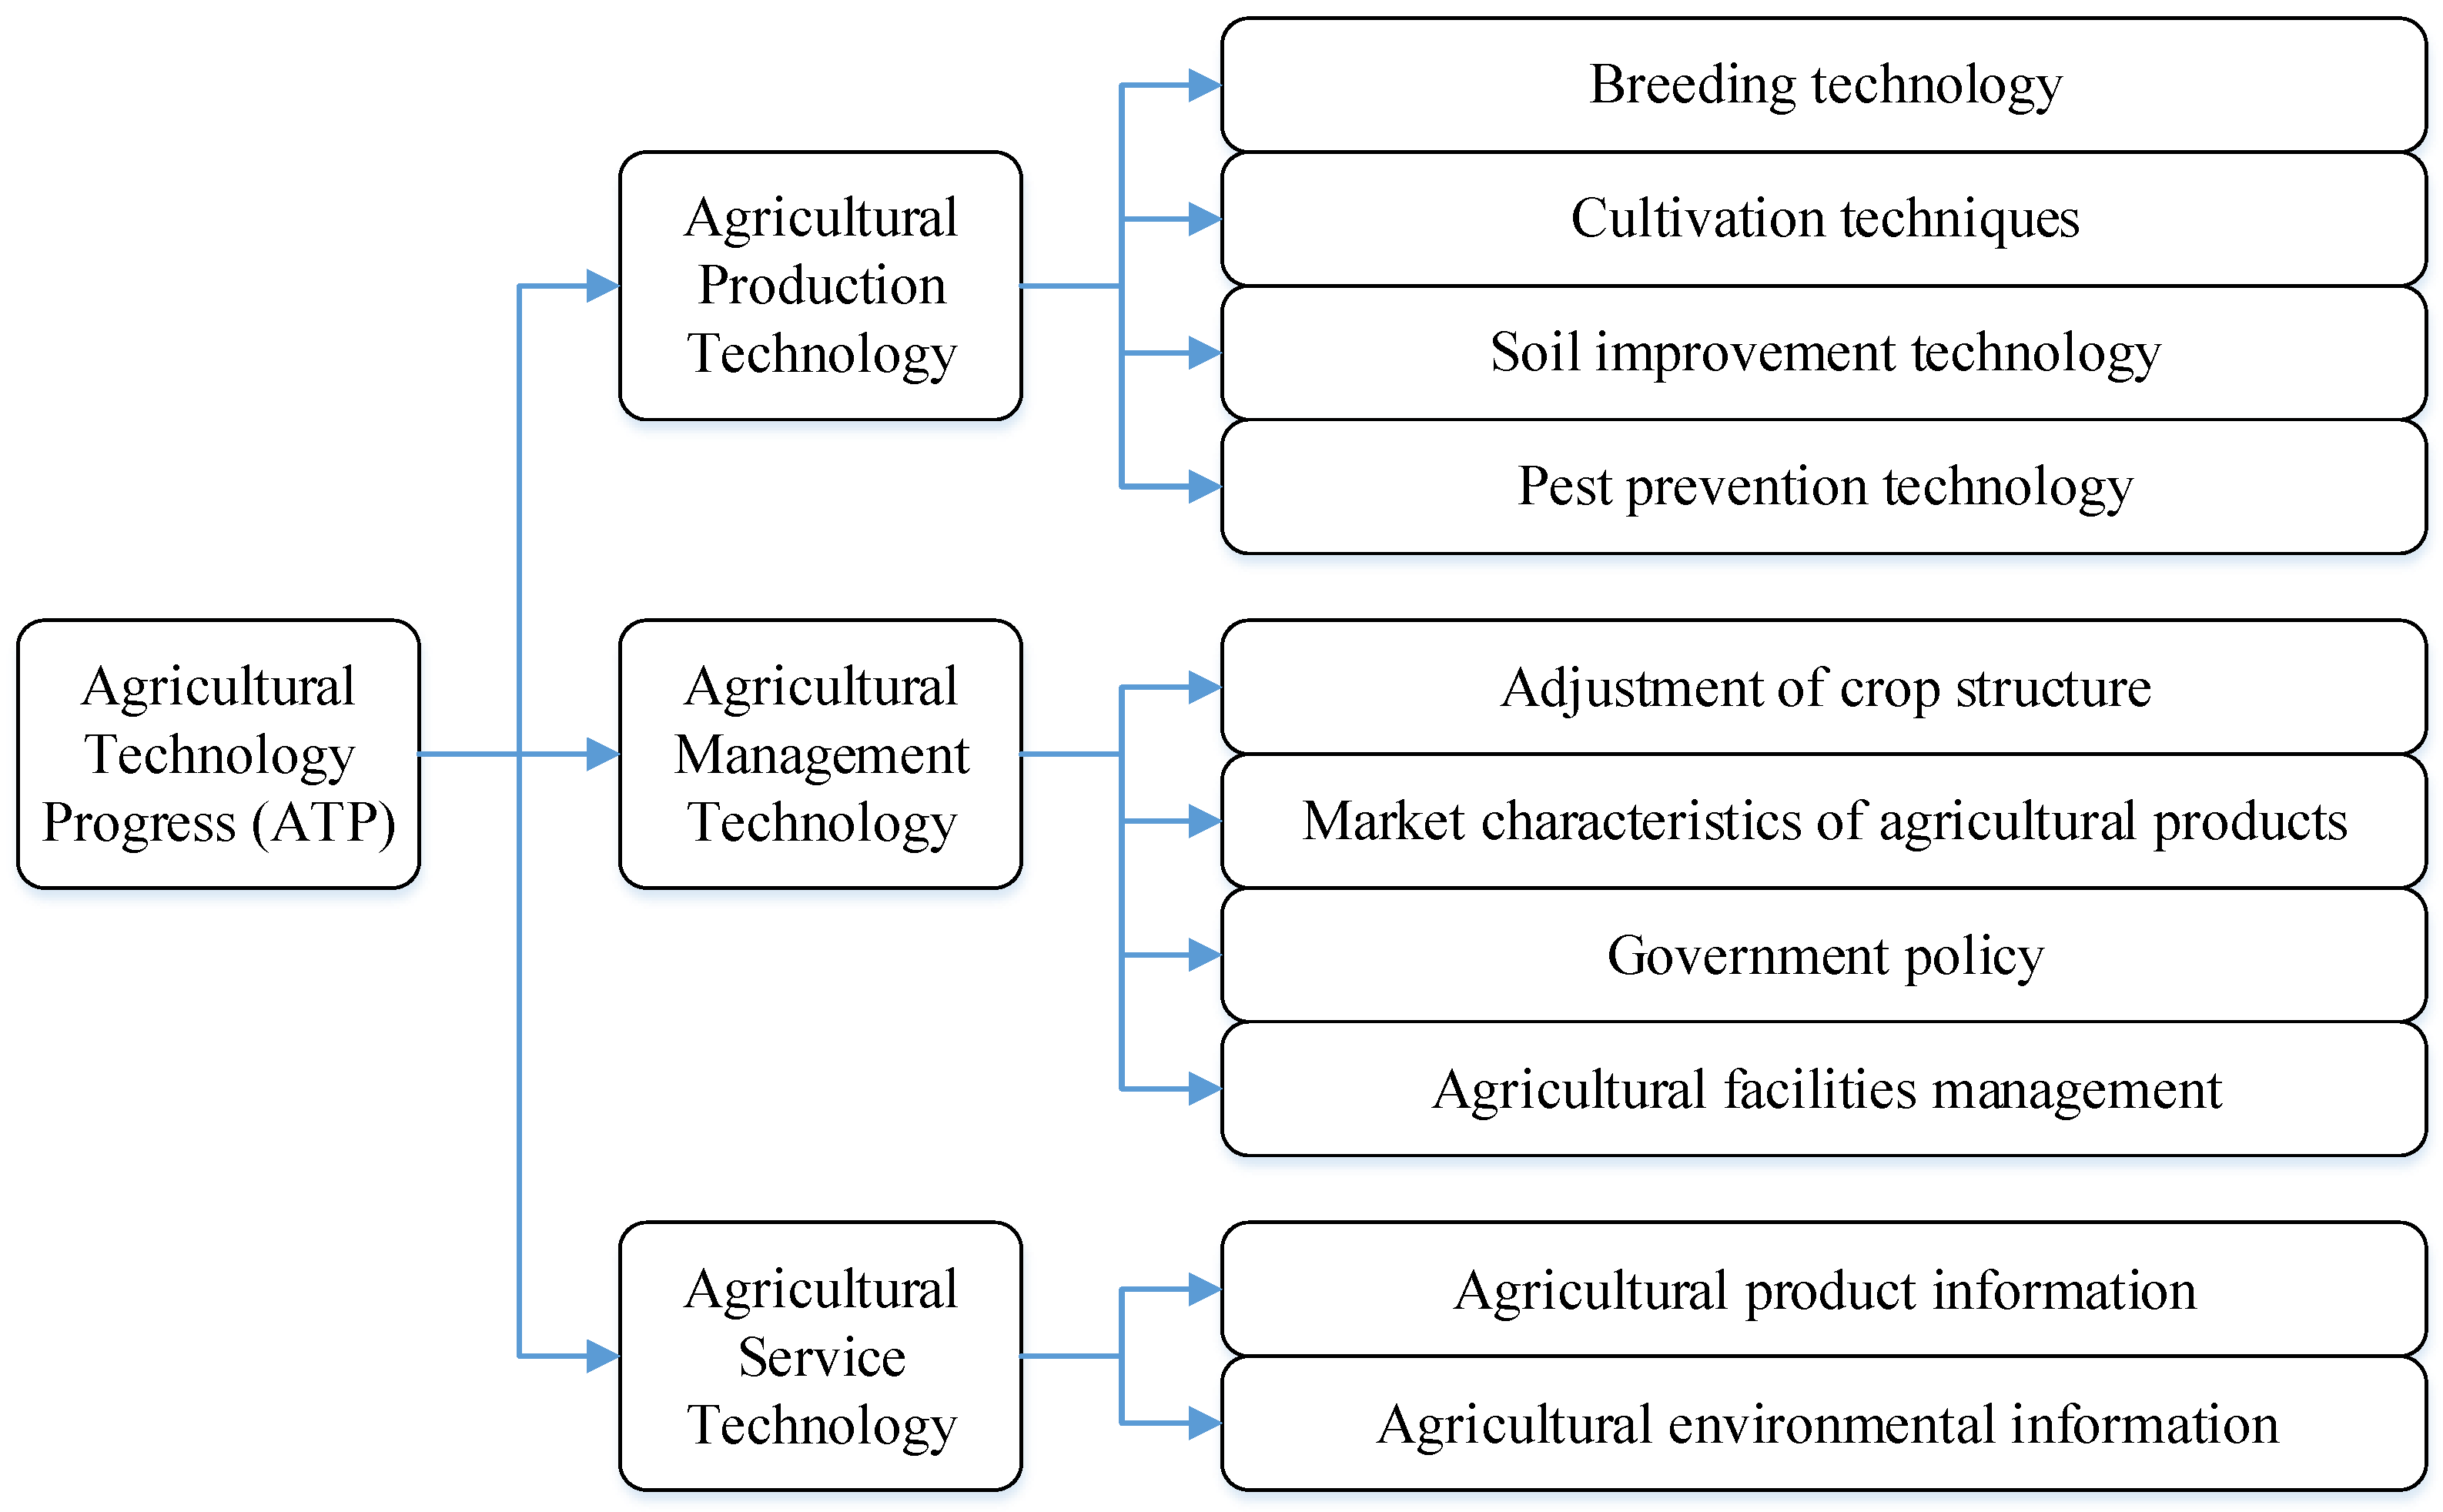
Figure 1. The composition of agricultural technology progress.
Agriculture 13 00793 g001
Figure 2. Map of the A T P in China (2000–2019).
Agriculture 13 00793 g002
Figure 3. Trend of the A T P in China (2000–2019).
Agriculture 13 00793 g003
Figure 4. Average levels of the ACS and ACE, and the five components of the ACE in China (2019).
Agriculture 13 00793 g004
Figure 5. Time trends of the national ln(ACS) and ln(ACE) in China (2000–2019).
Agriculture 13 00793 g005
Table 1. The carbon emission coefficient.
CoefficientValueScaleSource
AM10.18kg·kw 1 West and Marland (2002) [20]; He and Zhang (2012) [42]
AM216.47kg·hectare 1 West and Marland (2002) [20]; He and Zhang (2012) [42]
PF5.18kg·kg 1 Wang and Zhang (2016) [43]
PE4.9341kg·kg 1 West and Marland (2002) [20]
IR266.48kg·hectare 1 Duan et al. (2011) [13]
FE0.8956kg·kg 1 West and Marland (2002) [20]
ACS5.0925ton·hectare 1 Duan et al. (2011) [13]
Table 2. Data description.
VariableFull NameScale
A M Total Agricultural Machinery Power10,000 kW (kilowatt)
S A Total Sown Area1000 hectares; 10 7 m 2
P F Agricultural Plastic Filmton; 1000 kg
P E Pesticide10,000 tons; 10 7 kg
I R Irrigated Area of Cultivated Land1000 hectares; 10 7 m 2
F E Consumption of Chemical Fertilizers10,000 tons; 10 7 kg
A G D P Total Output of the Primary Industry100 million yuan; current price
P O P Total Population (year-end)10,000 persons
C P I Consumer Price Index (1995 = 100)
A G G S Sown Area of Grain Crops1000 hectares
A G S Total Sown Area1000 hectares
A G A I Average Wage of Employed People in Agricultural Industryyuan
A I Average Wage of Employed Peopleyuan
A G W A Number of Agricultural Meteorological Stationunit
A G W B Number of Eco-agricultural Meteorological Stationunit
A T P Evaluated Agricultural Technology Progresslogarithm, l n ( A i , t ) , measured in Equation (8)
T E C A Approximation of Agricultural Production Technologyratio; T E C A = 1 A G G S / A G S
T E C B Approximation of Agricultural Management Technologyratio; T E C B = A G A I / A I
Notes: Given by the definition provided by the National Statistical Office (GB/T 4754–2017), Agricultural GDP is the Total Output of the Primary Industry, which is the Gross Output Values of Agriculture, Forestry, Animal Husbandry and Fishery excluding the Gross Output Values of the Supporting activities of Agriculture, Forestry, Animal Husbandry and Fishery.
Table 3. Data description.
VariableObsMeanStd. Dev.MinMax
A M 6202730.9852675.10593.9713,353.02
S A 6205141.7673720.32988.5514,902.72
P F 62067,341.85963,435.875128.33343,524
P E 6205.0994.2550.0617.35
I R 6201946.4621523.878109.246177.59
F E 620169.627138.6812.5716.09
A G D P 6201297.0671178.46136.45477.1
P O P 6204298.6692762.57125812,489
C P I 620137.63822.48599.637216.553
A T P 6200.4530.917−1.9692.219
T E C A 6200.3370.1300.0290.646
T E C B 4340.5890.1380.1470.934
A G W A 46522.66713.4201121
A G W B 41914.45615.5031100
Notes: Obs = number of observations; Std. Dev. = standard deviation.
Table 4. Determinants of the A T P .
Regression:reg. (1)reg. (2)reg. (3)reg. (4)reg. (5)
Dependent:ln(A)ln(A)ln(A)ln(A)ln(A)
T E C A 0.550 **2.419 *** 1.444 ***
(0.232)(0.538) (0.415)
T E C B 0.650 ***1.604 *** 0.679 ***
(0.121)(0.276) (0.215)
T E C A × T E C B −3.082 *** −1.310 **
(0.804) (0.613)
A G W A 0.003 **0.003 **0.002 **
(0.001)(0.001)(0.001)
A G W B 0.008 ***0.008 ***0.007 ***
(0.001)(0.001)(0.001)
A G W A × A G W B 0.00013
(0.00051)
constant0.026−0.546 ***0.460 ***0.462 ***−0.123
(0.11)(0.184)(0.027)(0.028)(0.146)
Observations434434419419395
R20.0750.1080.4690.4690.508
Notes: | t | in parentheses; *, **, and *** are significant at the 10%, 5% and 1% levels.
Table 5. Effects of agricultural technology progress on ACE.
Regression:reg. (6)reg. (7)reg. (8)reg. (9)reg. (10)
Dependent:ln( ACE )ln( ACE )ln( ACE )ln( ACE )ln( ACE )
A T P 0.452 ***0.482 ***   
 (0.022)(0.024)   
A T P 2  −0.036 ***   
  (0.012)   
T E C A   −2.028 ***−0.7950.060
   (0.487)(0.585)(0.566)
T E C A 2   4.249 ***1.1150.085
   (0.660)(0.763)(0.716)
T E C B     −0.608 *
     (0.342)
T E C B 2     0.670 **
     (0.285)
A G W A     0.024 ***
     (0.004)
A G W A 2     −0.00017 ***
     (0.00035)
A G W B    0.0077 ***0.0046 ***
    (0.0009)(0.0009)
A G W B 2    −0.00010 ***−0.000071 ***
    (0.000014)(0.000013)
Constant21.087 ***21.112 ***21.385 ***21.494 ***21.051 ***
 (0.011)(0.014)(0.084)(0.110)(0.167)
Observations620620620419395
R20.4220.4310.1140.1780.265
Notes: | t | in parentheses; *, **, and *** are significant at the 10%, 5% and 1% levels.
Table 6. Effects of agricultural technology progress on ACS.
Regression:reg. (11)reg. (12)reg. (13)reg. (14)reg. (15)
Dependent:ln( ACS )ln( ACS )ln( ACS )ln( ACS )ln( ACS )
A T P −0.025−0.022   
 (0.020)(0.022)   
A T P 2  −0.004   
  (0.011)   
T E C A   −0.689 ***−0.321 *−0.033
   (0.167)(0.169)(0.522)
T E C A 2     −0.381
     (0.660)
T E C B   0.148 *0.075−0.211
   (0.087)(0.078)(0.315)
T E C B 2     0.248
     (0.263)
A G W A    0.0092 **0.0093 **
    (0.0037)(0.0037)
A G W A 2    −0.000066 **−0.000067 **
    (0.000032)(0.000033)
A G W B    0.0015 *0.0015 *
    (0.0008)(0.0008)
A G W B 2    −0.000019 *−0.000019 *
    (0.000012)(0.000012)
Constant23.545 ***23.548 ***23.672 ***23.504 ***23.531 ***
 (0.01)(0.013)(0.079)(0.097)(0.154)
Observations620620434395395
 R20.0030.0030.0510.0600.063
Notes: | t | in parentheses; *, **, and *** are significant at the 10%, 5% and 1% levels.
Disclaimer/Publisher’s Note: The statements, opinions and data contained in all publications are solely those of the individual author(s) and contributor(s) and not of MDPI and/or the editor(s). MDPI and/or the editor(s) disclaim responsibility for any injury to people or property resulting from any ideas, methods, instructions or products referred to in the content.