Article

Research on Winter Wheat Growth Stages Recognition Based on Mobile Edge Computing

1
College of Information and Management Science, Henan Agricultural University, Zhengzhou 450046, China
2
Henan Engineering Laboratory of Farmland Monitoring and Control, Zhengzhou 450046, China
*
Author to whom correspondence should be addressed.
Agriculture 2023, 13(3), 534; https://doi.org/10.3390/agriculture13030534
Submission received: 12 December 2022 / Revised: 16 February 2023 / Accepted: 17 February 2023 / Published: 23 February 2023

Abstract

:
The application of deep learning (DL) technology to the identification of crop growth processes will become the trend of smart agriculture. However, using DL to identify wheat growth stages on mobile devices requires high battery energy consumption, significantly reducing the device’s operating time. However, implementing a DL framework on a remote server may result in low-quality service and delays in the wireless network. Thus, the DL method should be suitable for detecting wheat growth stages and implementable on mobile devices. A lightweight DL-based wheat growth stage detection model with low computational complexity and a computing time delay is proposed; aiming at the shortcomings of high energy consumption and a long computing time, a wheat growth period recognition model and dynamic migration algorithm based on deep reinforcement learning is proposed. The experimental results show that the proposed dynamic migration algorithm has 128.4% lower energy consumption and 121.2% higher efficiency than the local implementation at a wireless network data transmission rate of 0–8 MB/s.

1. Introduction

Wheat is the second-largest food crop in the world and is crucial for food security and social stability [1]. Wheat growth monitoring refers to recording the morphological changes in wheat during different growth and development stages [2]. It is critical on smart farms to obtain high yields and is often performed using unmanned aerial vehicles (UAVs) and intelligent agricultural machinery [3]. Due to technological advances in smart agriculture, and intelligent agricultural machinery and mobile devices, deep learning (DL) models and algorithms have been increasingly used in this field [4]. However, mobile devices have relatively low computing power, low battery capacity, and high energy consumption. DL-based agricultural applications require mobile computing devices with high computing power, high battery capacity, and low energy consumption to provide longer working hours and better service quality. Thus, an imbalance exists between the high computing needs of smart agriculture and mobile devices with low computing power. Therefore, it is necessary to develop a lightweight DL model capable of running on intelligent mobile devices for wheat growth monitoring. As the use of artificial intelligence has increased, deep reinforcement learning (DRL) has attracted extensive attention from the academic community [5]. The data generated by users show exponential growth, promoting the rapid development of DRL. The deep Q-learning network (DQN) is an unsupervised learning algorithm based on reinforcement learning and a neural network [6]. It combines the learning ability of neural networks and the decision-making ability of reinforcement learning and can make decisions in a timely and intelligent manner according to changes in the environment [7].
Edge computing is an ideal solution for real-time applications to upload the core parameters or data of the DRL model to the network edge for processing [8,9]. Running a DQN on an intelligent mobile device causes high battery energy consumption, and the model’s identification efficiency depends on the quality of the network service when it runs on a remote server. Therefore, the server location, the power of the mobile device, and the quality of the network service must be carefully selected to enable the use of a DQN so that the unloading strategy of the edge nodes can be adapted to the environment. This approach enables the use of relatively few resources to obtain optimal results and reduces the communication and computing costs of edge computing [10,11]. Migration is used in mobile edge computing to migrate intensive computing tasks to the wireless network edge server for processing, alleviating the shortcomings of low computing power, poor real-time performance, and large power consumption of intelligent devices. This technology has attracted the attention of academia and industry [12,13,14,15], especially optimal migration decisions and the allocation of computing resources [16,17]. Chen et al. [18] proposed a task unloading and scheduling method based on DRL for unloading decisions with dependency in mobile edge computing. The goal was to minimize the application’s execution time. Experiments showed that the proposed algorithm has good convergence ability, verifying the effectiveness and reliability of the method. Tian et al. [19] deployed a cognition model to the edge and designed an intelligent recognition device based on computer vision and edge computing for crop pest image recognition. Agricultural crop images were collected in realtime, and image recognition was used to identify crop pests. Zhang et al. [20] proposed an improved algorithm called the natural deep Q-learning network (NDQN) for resource scheduling and decision-making in edge computing. The results showed that the improved NDQN algorithm performed better than the local unloading and random unloading algorithms. Gu et al. [21] designed an embedded monitoring system based on edge computing that considered different planting conditions of crops in different regions. They established neural networks and crop data processing algorithms and deployed them in embedded devices. UAVs were used for crop monitoring. However, most of the above studies designed migration algorithms for relatively large computing tasks and complex models [22,23,24,25,26], whereas few studies designed migration strategies or algorithms based on lightweight recognition models for intelligent agricultural production scenarios.
Wheat is an important grain crop and is grown extensively worldwide. Wheat growth monitoring algorithms have high computational complexity, many parameters, and long task execution times. They require extensive computing resources and sufficient battery power. General migration algorithms and intelligent equipment are inadequate. This paper proposes a lightweight wheat growth stage detection model for intelligent devices. The wheat growth stage detection model is migrated to the wireless network edge server for processing to reduce energy consumption and computing time and simulate the cost of intelligent devices to make decisions by calculating the weighted sum of the battery energy consumption and computing time delay. The DQN algorithm is used to obtain the optimal output model because it reduces energy consumption and computing time delay in the DL model. The proposed method enables complex computing tasks on intelligent mobile devices in smart agriculture, and its use for the accurate identification of wheat growth stages is demonstrated. The innovation points of this study are as follows:
1.
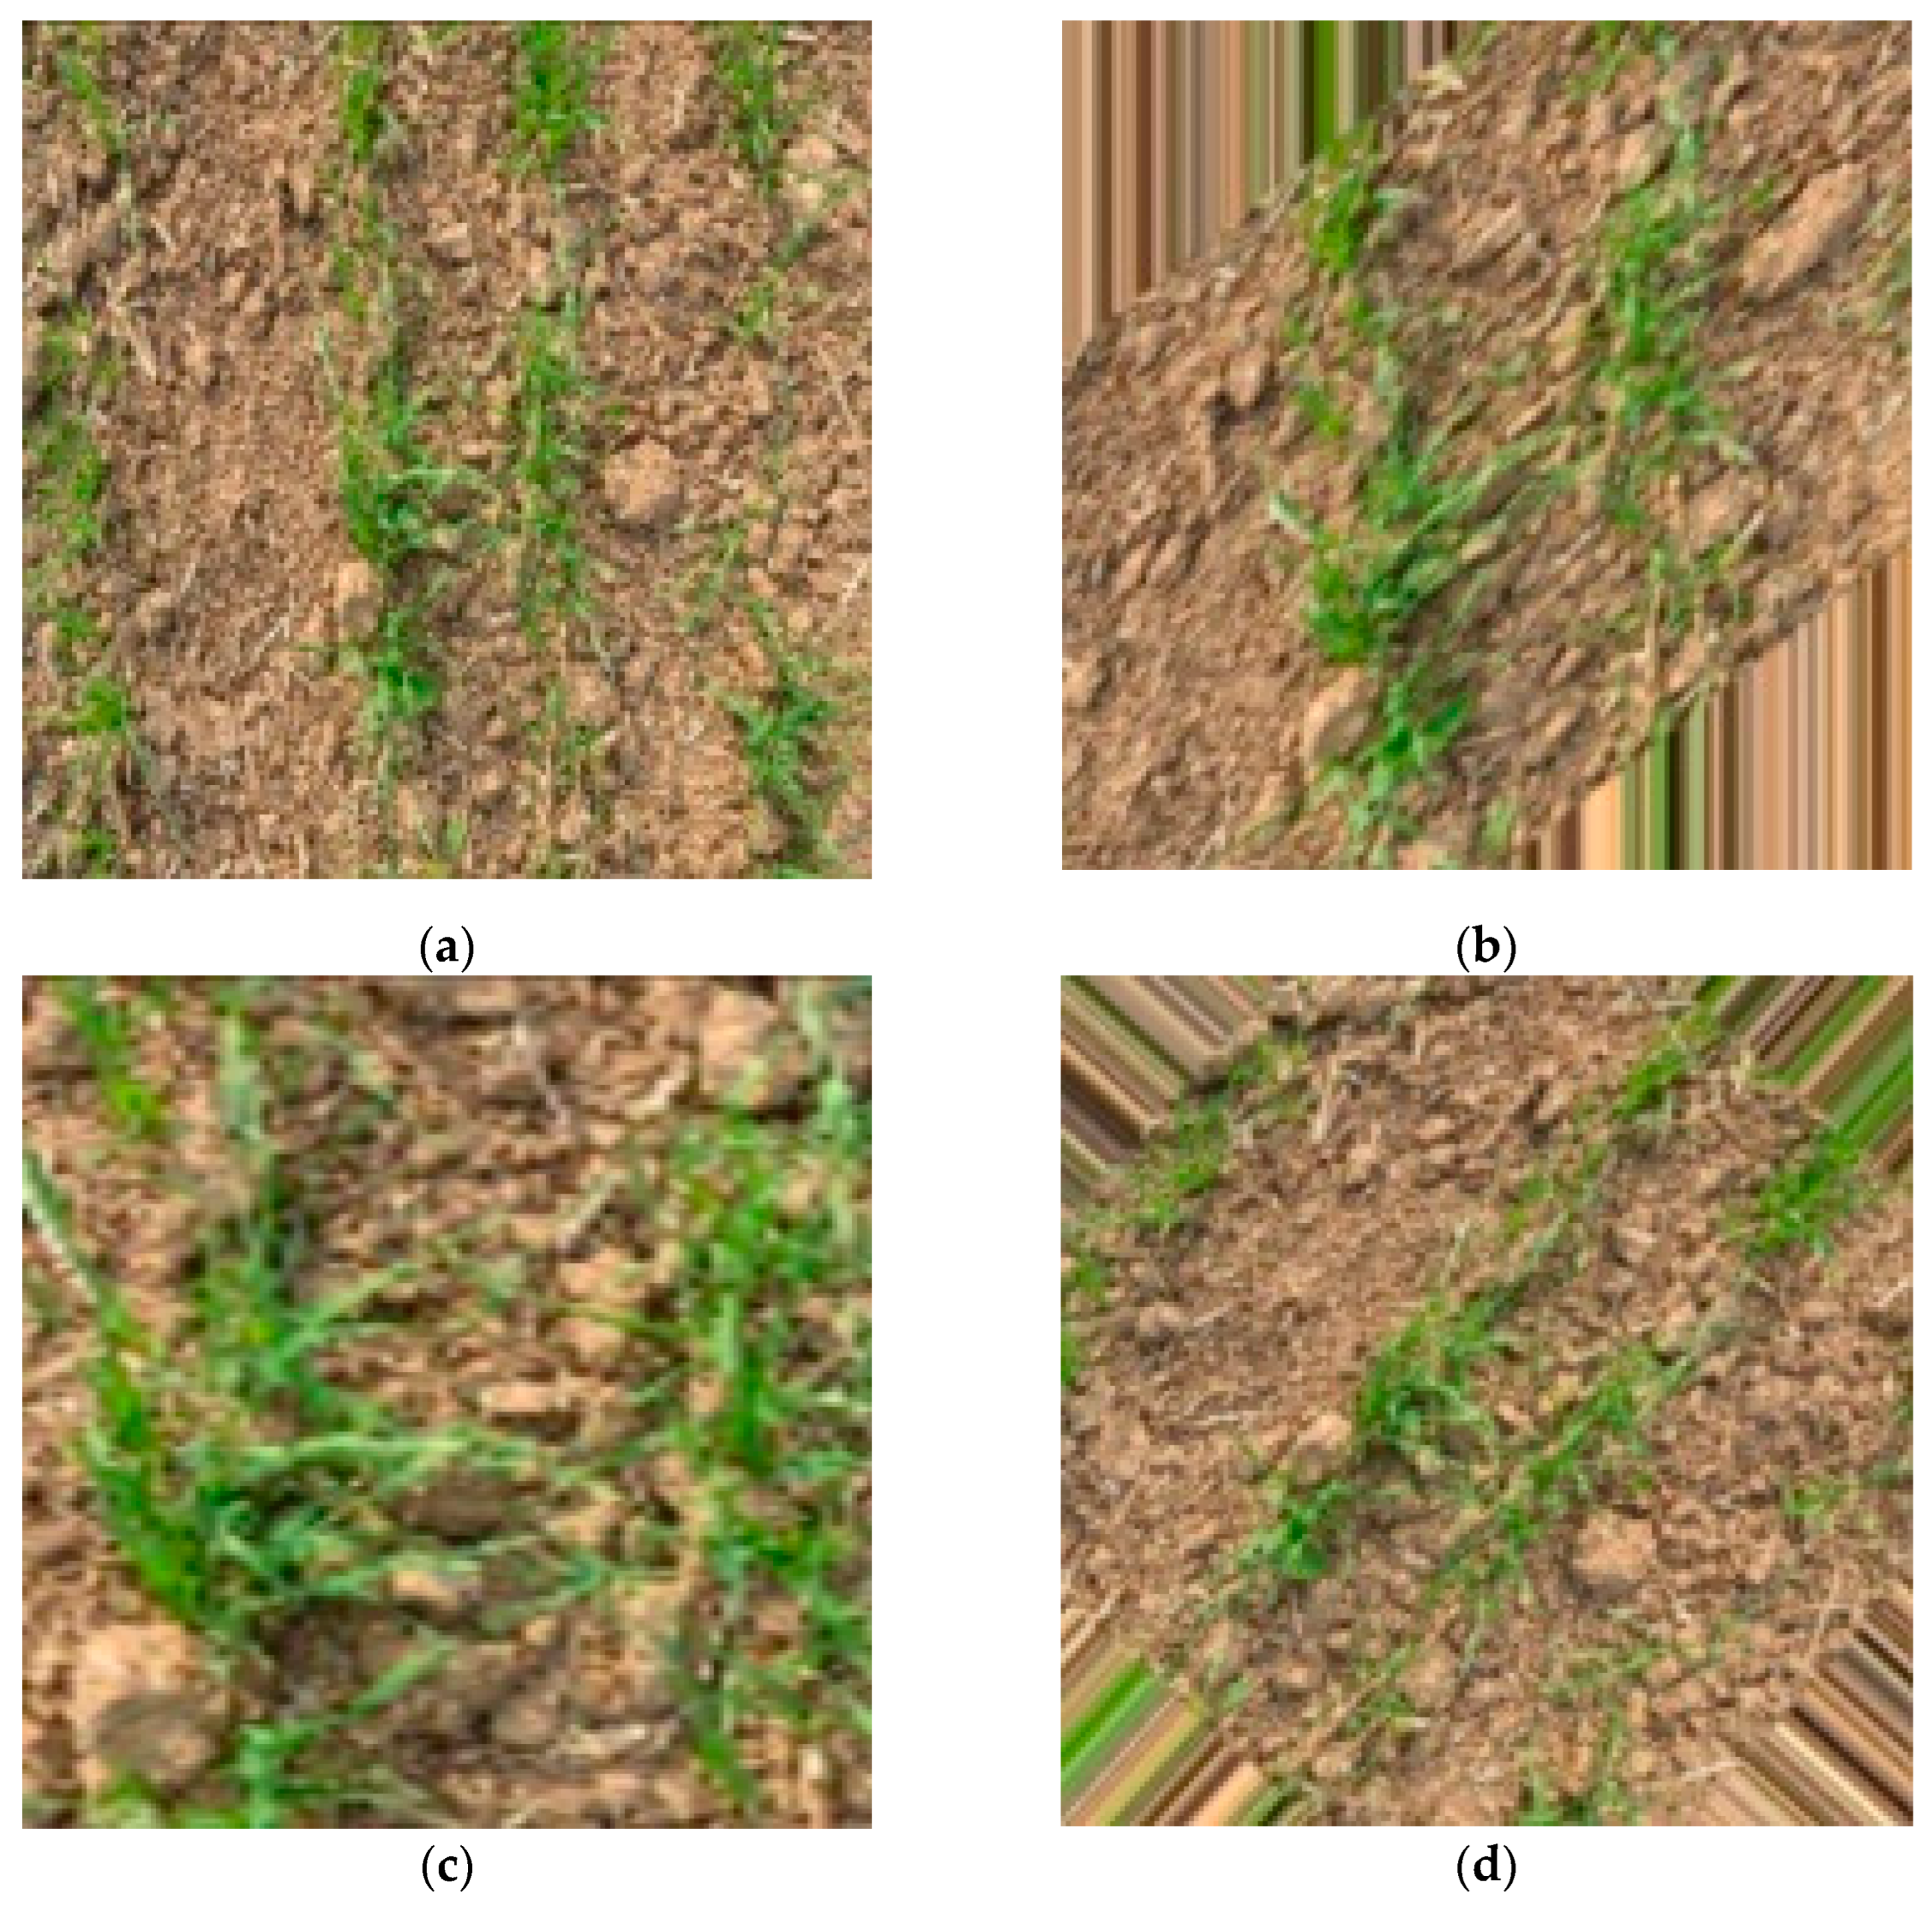
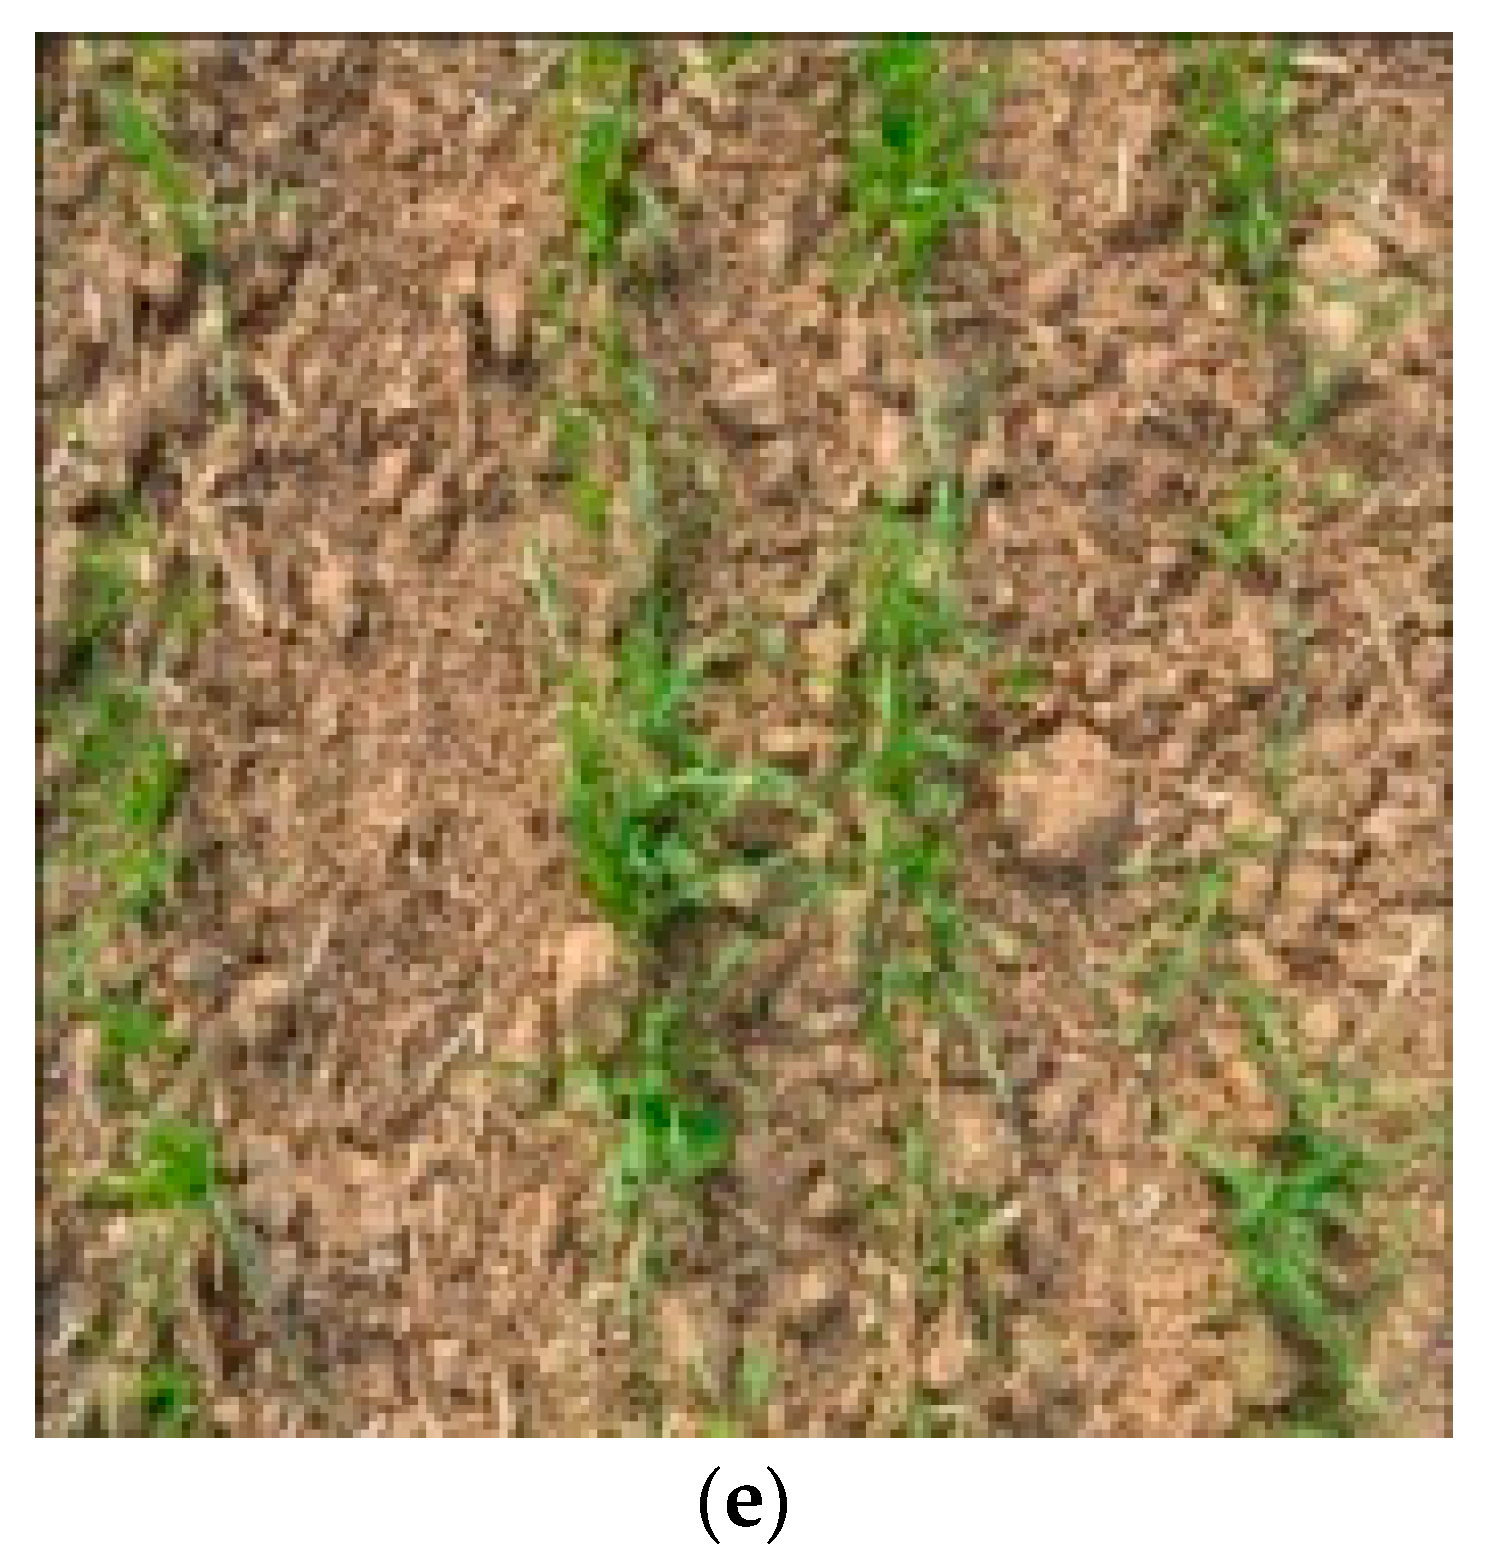
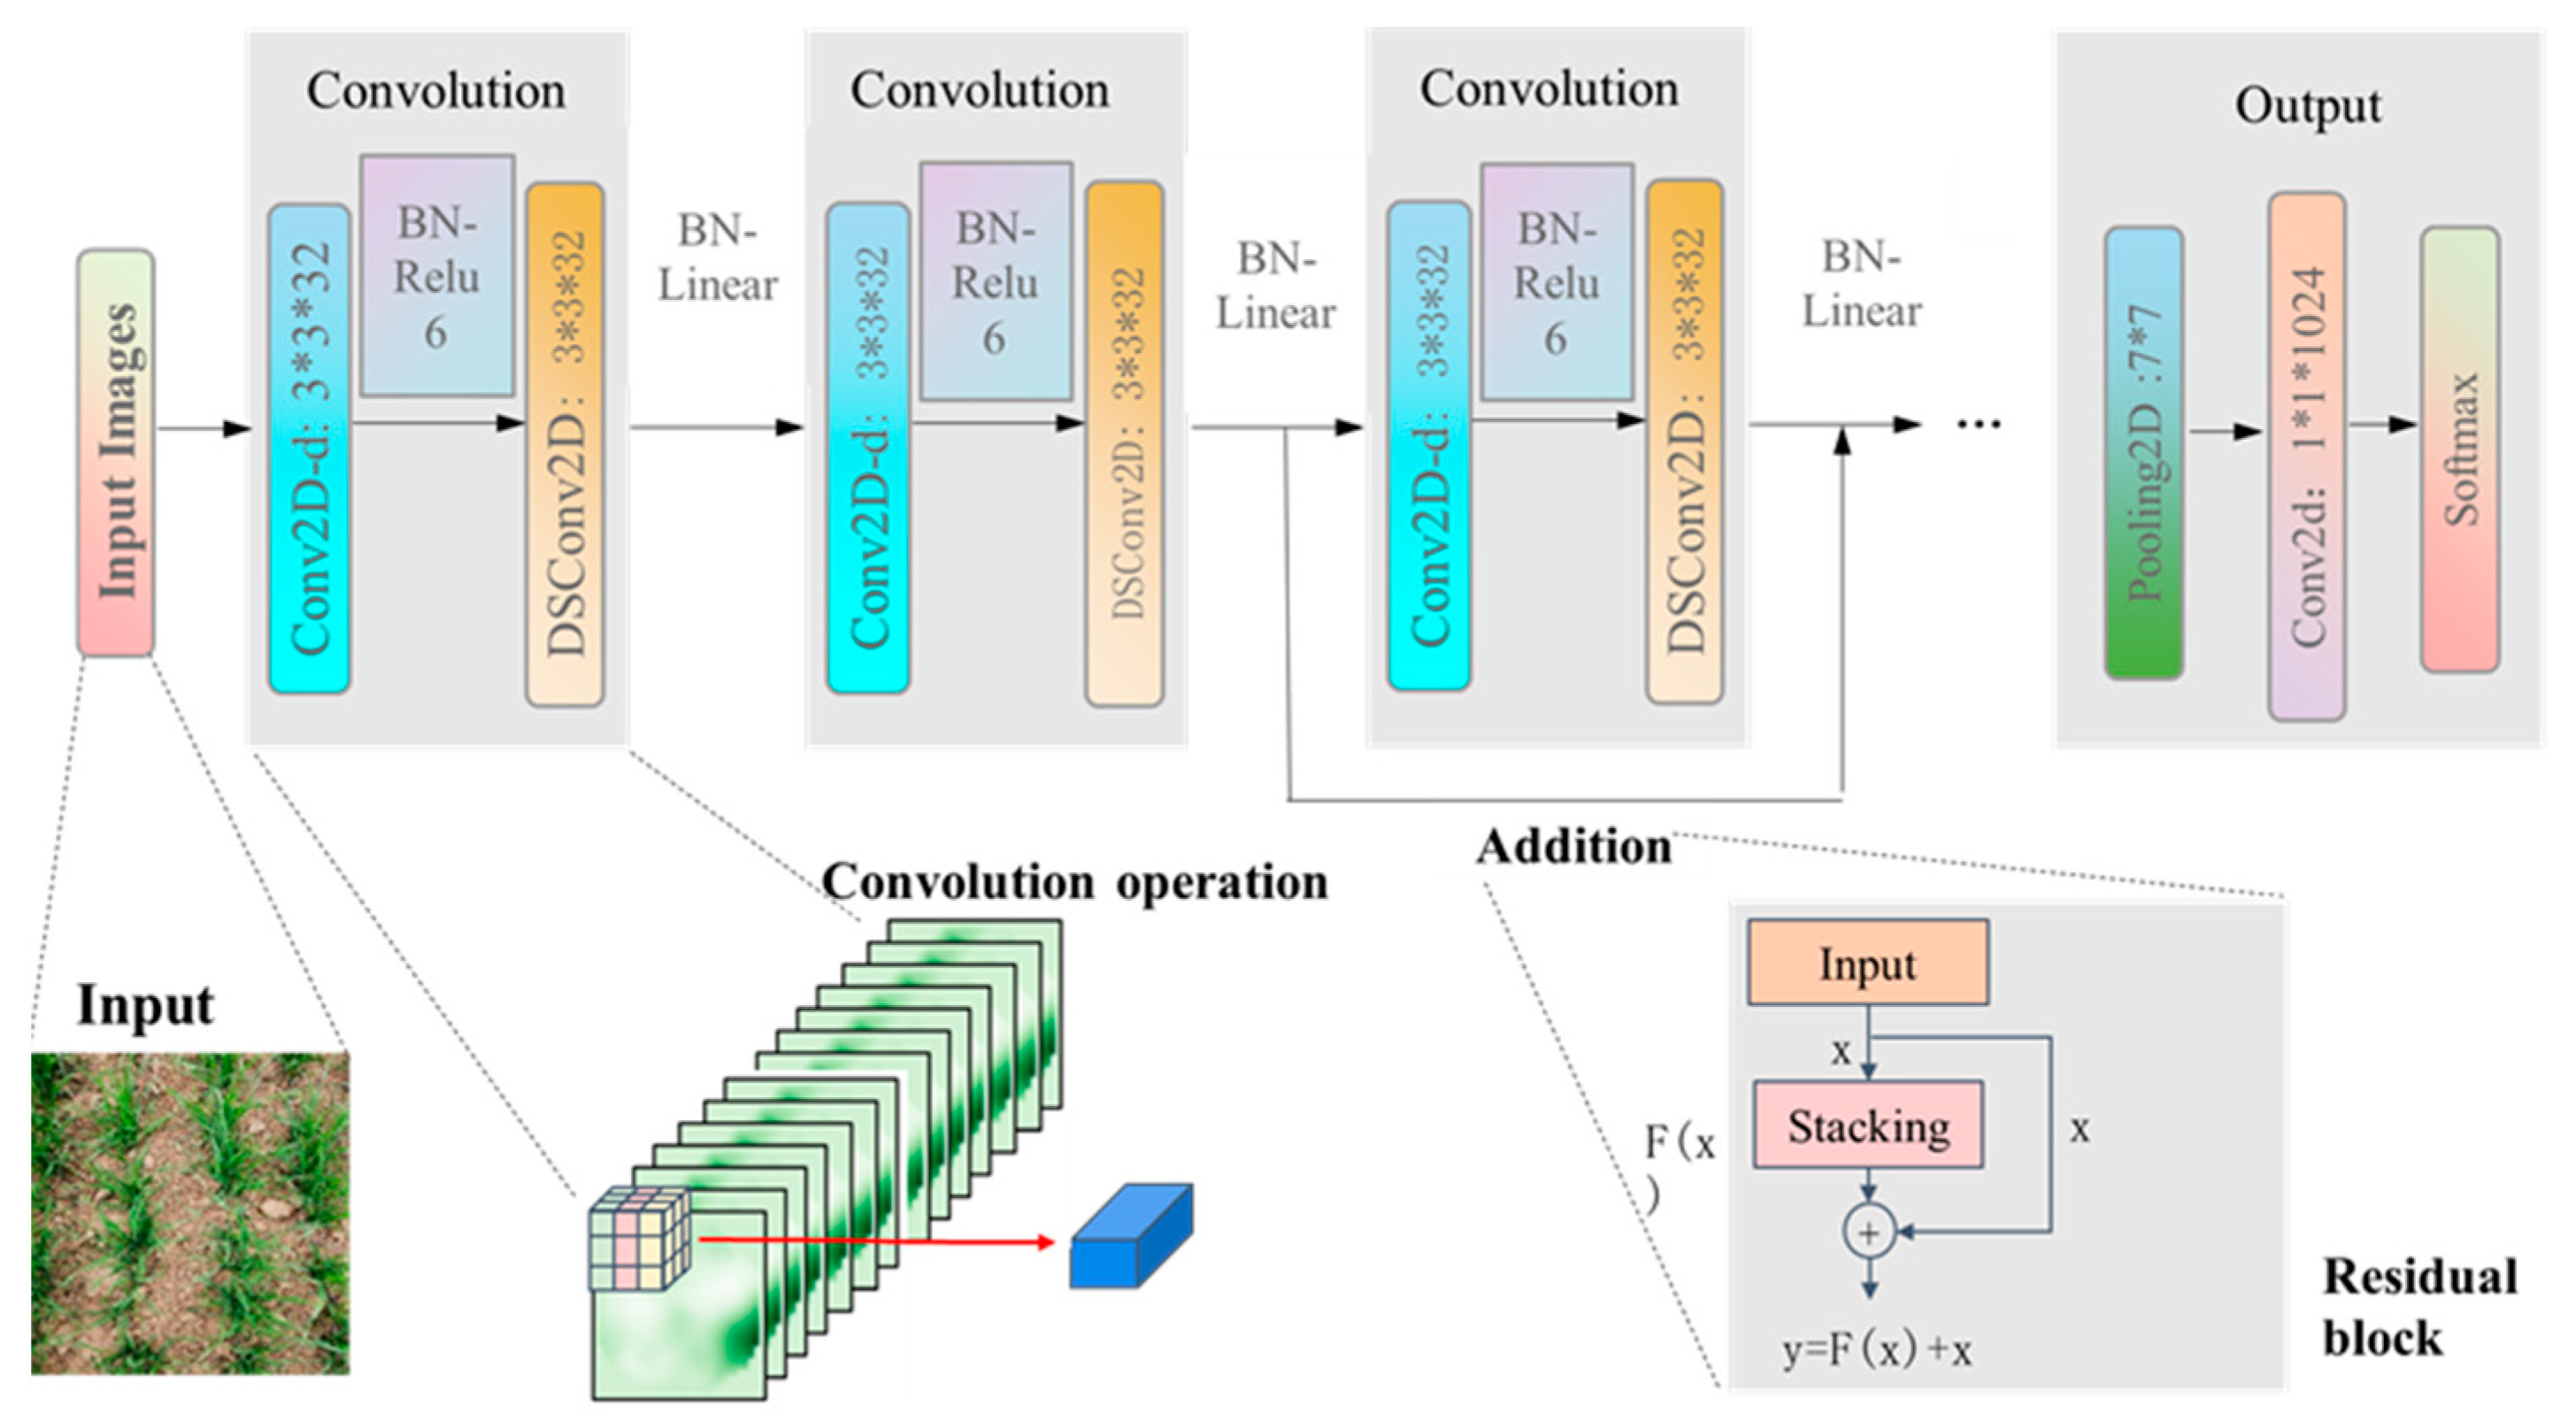
A wheat growth stage detection model that uses depth-wise separable convolutional layers and a residual network is designed. It has low energy consumption and computing delay and high accuracy in distinguishing the seedling stage (SS), tillering stage (TS), overwintering stage (OS), greening stage (GS), and jointing stage (JS). The average recognition accuracy of the five wheat growth stages is 98.6%, whereas the DenseNet model achieves an average accuracy of 99.2%.
2.
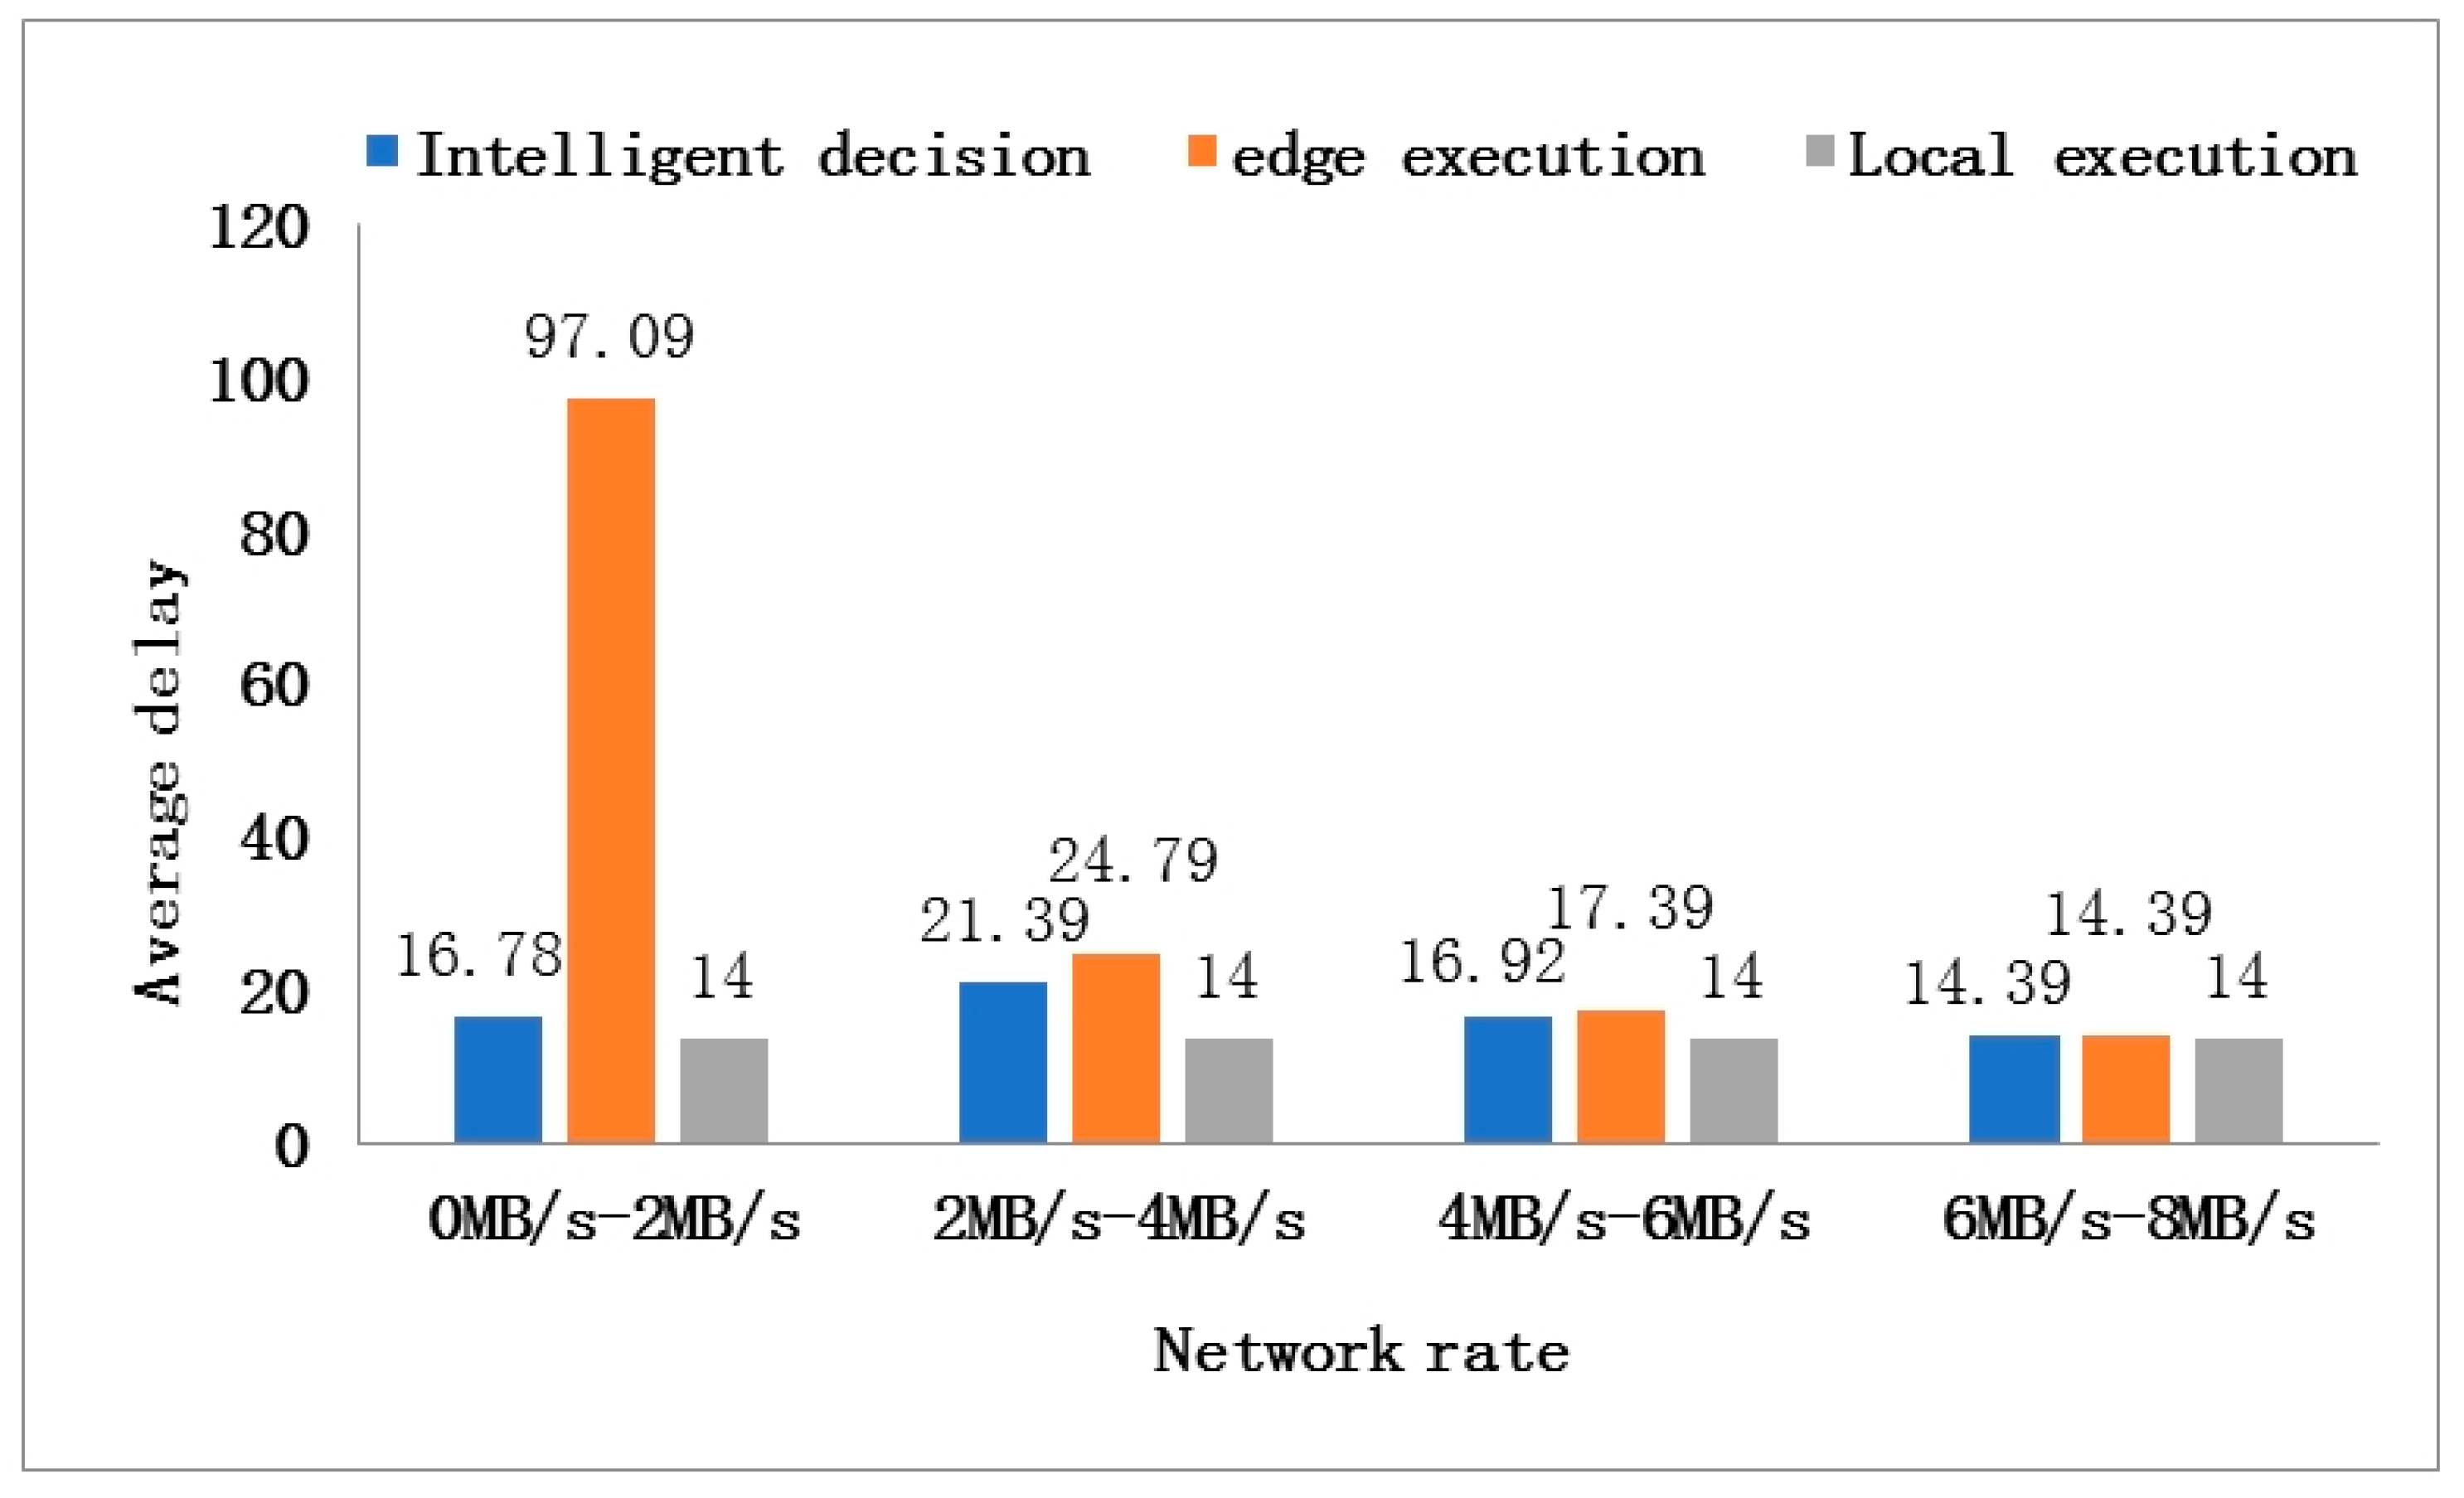
A dynamic migration algorithm for the wheat growth detection model is designed using the DQN. This algorithm makes optimal migration decisions by monitoring the power consumption and network service quality of the equipment in real-time, considering the energy consumption and delay cost caused by the migration/non-migration, respectively. At a wireless network transmission data rate of 0–8 MB/s, the overall energy consumption loss of the dynamic migration algorithm is 128.4% lower than that of the intelligent device.
In this paper, an artificial intelligence algorithm and experiment are used to identify wheat growth stages. A decision-making method for performing edge computing and migrating the wheat growth stage detection model to the wireless network edge server for processing is proposed. The dynamic migration strategy of the DQN-based identification model enables the execution of complex processes while minimizing energy consumption and processing time. This method is suitable for deploying application systems in agriculture. This paper is organized as follows: Section 1 presents the introduction. Section 2 describes the materials and methods. Section 3 provides the wheat growth stage detection model, and Section 4 presents the migration algorithm. The results are described in Section 5, and Section 6 provides the discussion.

2. Materials and Methods

2.1. Data Source

The study area for acquiring the wheat images was the Xuchang campus of Henan Agricultural University, Changge City, Henan Province, China (113°58′26″ E, 34°12′06″ N). The area has a northern temperate continental monsoon climate, with an average annual temperature of 14.3 °C. The average annual rainfall is 711.1 mm, and the frost-free period is 217 days. Due to the complex field environment, images of the wheat canopy at a fixed height using a tripod were acquired. The images of the wheat varieties “Yumai49”, “week 27”, and “Xinong 509” were acquired in five growth stages (October 2019 to June 2020). These varieties are grown in the eastern Henan Province.
In each stage, images were acquired of plots with two densities (300 and 350 plants per square meter) and two nitrogen contents (15 kg and 0 kg of pure nitrogen per 0.0667 hectare). Images were obtained every two days between 8 am and 15 pm using a Nikon D3100, 5/21 sensor CMOS camera with a maximum aperture of F/5.6, 14.2 megapixels, and a maximum resolution of 4608 × 3072. A tripod was used for fixed-height photography, and all images were collected under natural lighting conditions.
Data were obtained in the following wheat growth stages: SS (the day before the first day of emergence to the tillering stage), TS (the day before the first day of tillering to the overwintering stage), OS (the day before the first day of the overwintering stage to the greening stage), GS (from the first day of the greening stage to the day before the jointing stage), and JS (from the first day of jointing to the day before heading) (Figure 1). A total of 12,000 images were obtained in the five stages.

2.2. Data Processing

Large sample sizes result in a higher performance and generalization ability of DL models. However, the number and quality of samples sometimes do not meet the requirements of optimal model training in practical applications; thus, the enhancement of sample data is required [27]. Images are high-dimensional data. Image data are typically rotated and translated, or other operations are performed to improve the robustness of the model, prevent overfitting of the test set during training, and improve the model’s generalization ability. Data enhancement is a simple and effective method to improve the detection accuracy of convolutional neural network models. Different data sets require different data enhancement methods. Images are typically slightly modified, which does not affect the model’s training results and can increase the generalization ability of the model. The following data enhancement methods were used to improve the model’s robustness.
(1)
Normalization by dividing each pixel value by the standard deviation of the sample;
(2)
Dislocation transformation. The x-coordinate of the image remains unchanged, and the y-coordinate is shifted according to a specific proportion. The degree of displacement is proportional to the vertical distance to the x-axis;
(3)
Image scaling. Image scaling refers to resizing the image by the same amount in the length and width directions;
(4)
Random flipping. Random flipping refers to extracting image data and performing random flipping;
(5)
Standardization. Standardization refers to an enhancement operation that the model performs on all images before training. Each pixel value is divided by 255 to obtain a pixel value range from 0 to 1. This method speeds up the convergence of the model.
In the experiment, 80% of the images were randomly selected as the training set, and 20% were used as the test set. All comparative experiments in this study are conducted on this dataset. Figure 2 is an image of seedling emergence after the above image enhancement. Table 1 shows the number of images of the training set and test set in each growth stage of wheat.

3. Design of Wheat Growth Stage Detection Model

3.1. Framework of Wheat Growth Stage Detection Model

A lightweight recognition model based on depth-wise separable convolution [28] and a residual network [29] are proposed for use on intelligent mobile devices. The structure diagram of the convolutional neural network is shown in Figure 3. Conv2D, DSConv2D, and Conv2D-d represent the normal convolution, depth-wise separable convolution, and cavity convolution, respectively. A Relu6 activation function and a data standardization (batch normalization (BN)) operation are inserted after each convolution unit to ensure that the model can learn the sparse features of the wheat image and speed up its convergence. A linear activation function is used between the normal convolution and depth-wise separable convolution units to prevent gradient dispersion during model training. “Addition” in Figure 3 refers to the addition of the residual network. The residual network adds the outputs of the convolution units and uses them as the final output to achieve a greater model depth and prevent overfitting. The parameters of the network structure are listed in Table 2. The parameter input is the input of the current unit and the output of the upper unit. The parameters e and s1 represent the number and step size of the convolution kernels of the normal convolution, and the parameters O and s2 represent the number and step size of the convolution kernels of the depth-wise separable convolution. The parameter k is the size of the convolution kernel of the depth-wise separable convolution; it is 3 × 3 and 5 × 5. The parameter s indicates the presence of the residual network between the convolution units. A parameter value of d = 2 indicates that the normal convolution of the unit has been replaced by the void convolution. Softmax is the output function.

3.2. Parameter Settings

The learning rate represents the speed of updating the model parameters during training, and the optimizer is a gradient descent updating method implemented during iteration. Different data sets have different learning rates and optimizer settings. Optimizing the hyperparameters improves the model’s accuracy. The training batch represents the number of training images input into the model at each iteration. It is generally 32 and 64 batches in the image classification.
Canopy images of the five wheat growth stages were used: emergence, tillering, overwintering, greening, and jointing. There were 12,000 samples, including 2400 samples in each stage. The test set comprised 20% of the data, and the training set contained 80% of the data for model training and learning. Table 3 lists the results of the different learning rates, training batches, and optimizer training approaches. The optimization algorithms are the Adam optimizer and stochastic gradient descent (SGD) method, and 32 and 64 are used as the number of training batches. Adam-32 shows the training results of the Adam optimizer with a batch size of 32; 0.005, 0.001, 0.0005, and 0.0001 are the test values for the learning rate. The model achieves the highest accuracy when the learning rate is 0.001 and the Adam-32 optimizer is used. The accuracy is higher for 32 than for 64 training batches. Therefore, the Adam optimization algorithm with a learning rate of 0.001 and 32 batches was selected to train the wheat growth stage detection model.

4. Design of Migration Algorithm

The proposed wheat growth stage detection model has a low battery energy consumption and delay. However, there is a need for intensive computing to perform intelligent fault monitoring in smart agriculture. When there are many computing tasks, moving them to the edge server improves crop monitoring efficiency. However, the dynamic changes in the computing scenarios and the wireless network quality of the service may result in inadequate performance when tasks are executed at the edge. Therefore, intelligent mobile devices must dynamically decide whether to offload computing tasks to the edge of the network. When the wireless network transmission rate is high and the intelligent device has sufficient power, it is suitable to unload the task to the edge server, resulting in high performance. In contrast, when the wireless network transmission rate is low and the device power is insufficient, the task cannot be moved to the edge for processing. However, it is often impossible in real scenarios to determine whether task unloading is required due to the dynamic changes in the computing environment and the wireless network’s quality of service.

4.1. Design for Dynamic Migration Algorithm with a Mobile Terminal

The residual power of mobile devices is a valuable energy resource in the migration of computing services to the mobile edge. In addition to variable factors, such as the dynamic characteristics of the mobile device’s environment, especially the network conditions, many factors determine the migration decision of mobile devices. The strong perception of DRL can be used to learn the state information of the environment and modify the decision-making so that mobile users can complete the computing task at the lowest cost. The DQN is an unsupervised neural network learning algorithm based on reinforcement learning. It combines the learning ability of a neural network and the decision-making ability of reinforcement learning and makes intelligent decisions in a timely manner according to the changing environment [30]. The proposed dynamic migration algorithm makes the optimal decision by monitoring the power and wireless network speed of the device in real-time, considering the energy consumption and delay cost caused by the unloading/non-unloading decision, minimizing the calculation delay and power consumption.
φ ( S ) is used as the input of the DQN. The greedy method is used to make random selections of an action selection to prevent the network from falling into a local minimum. 
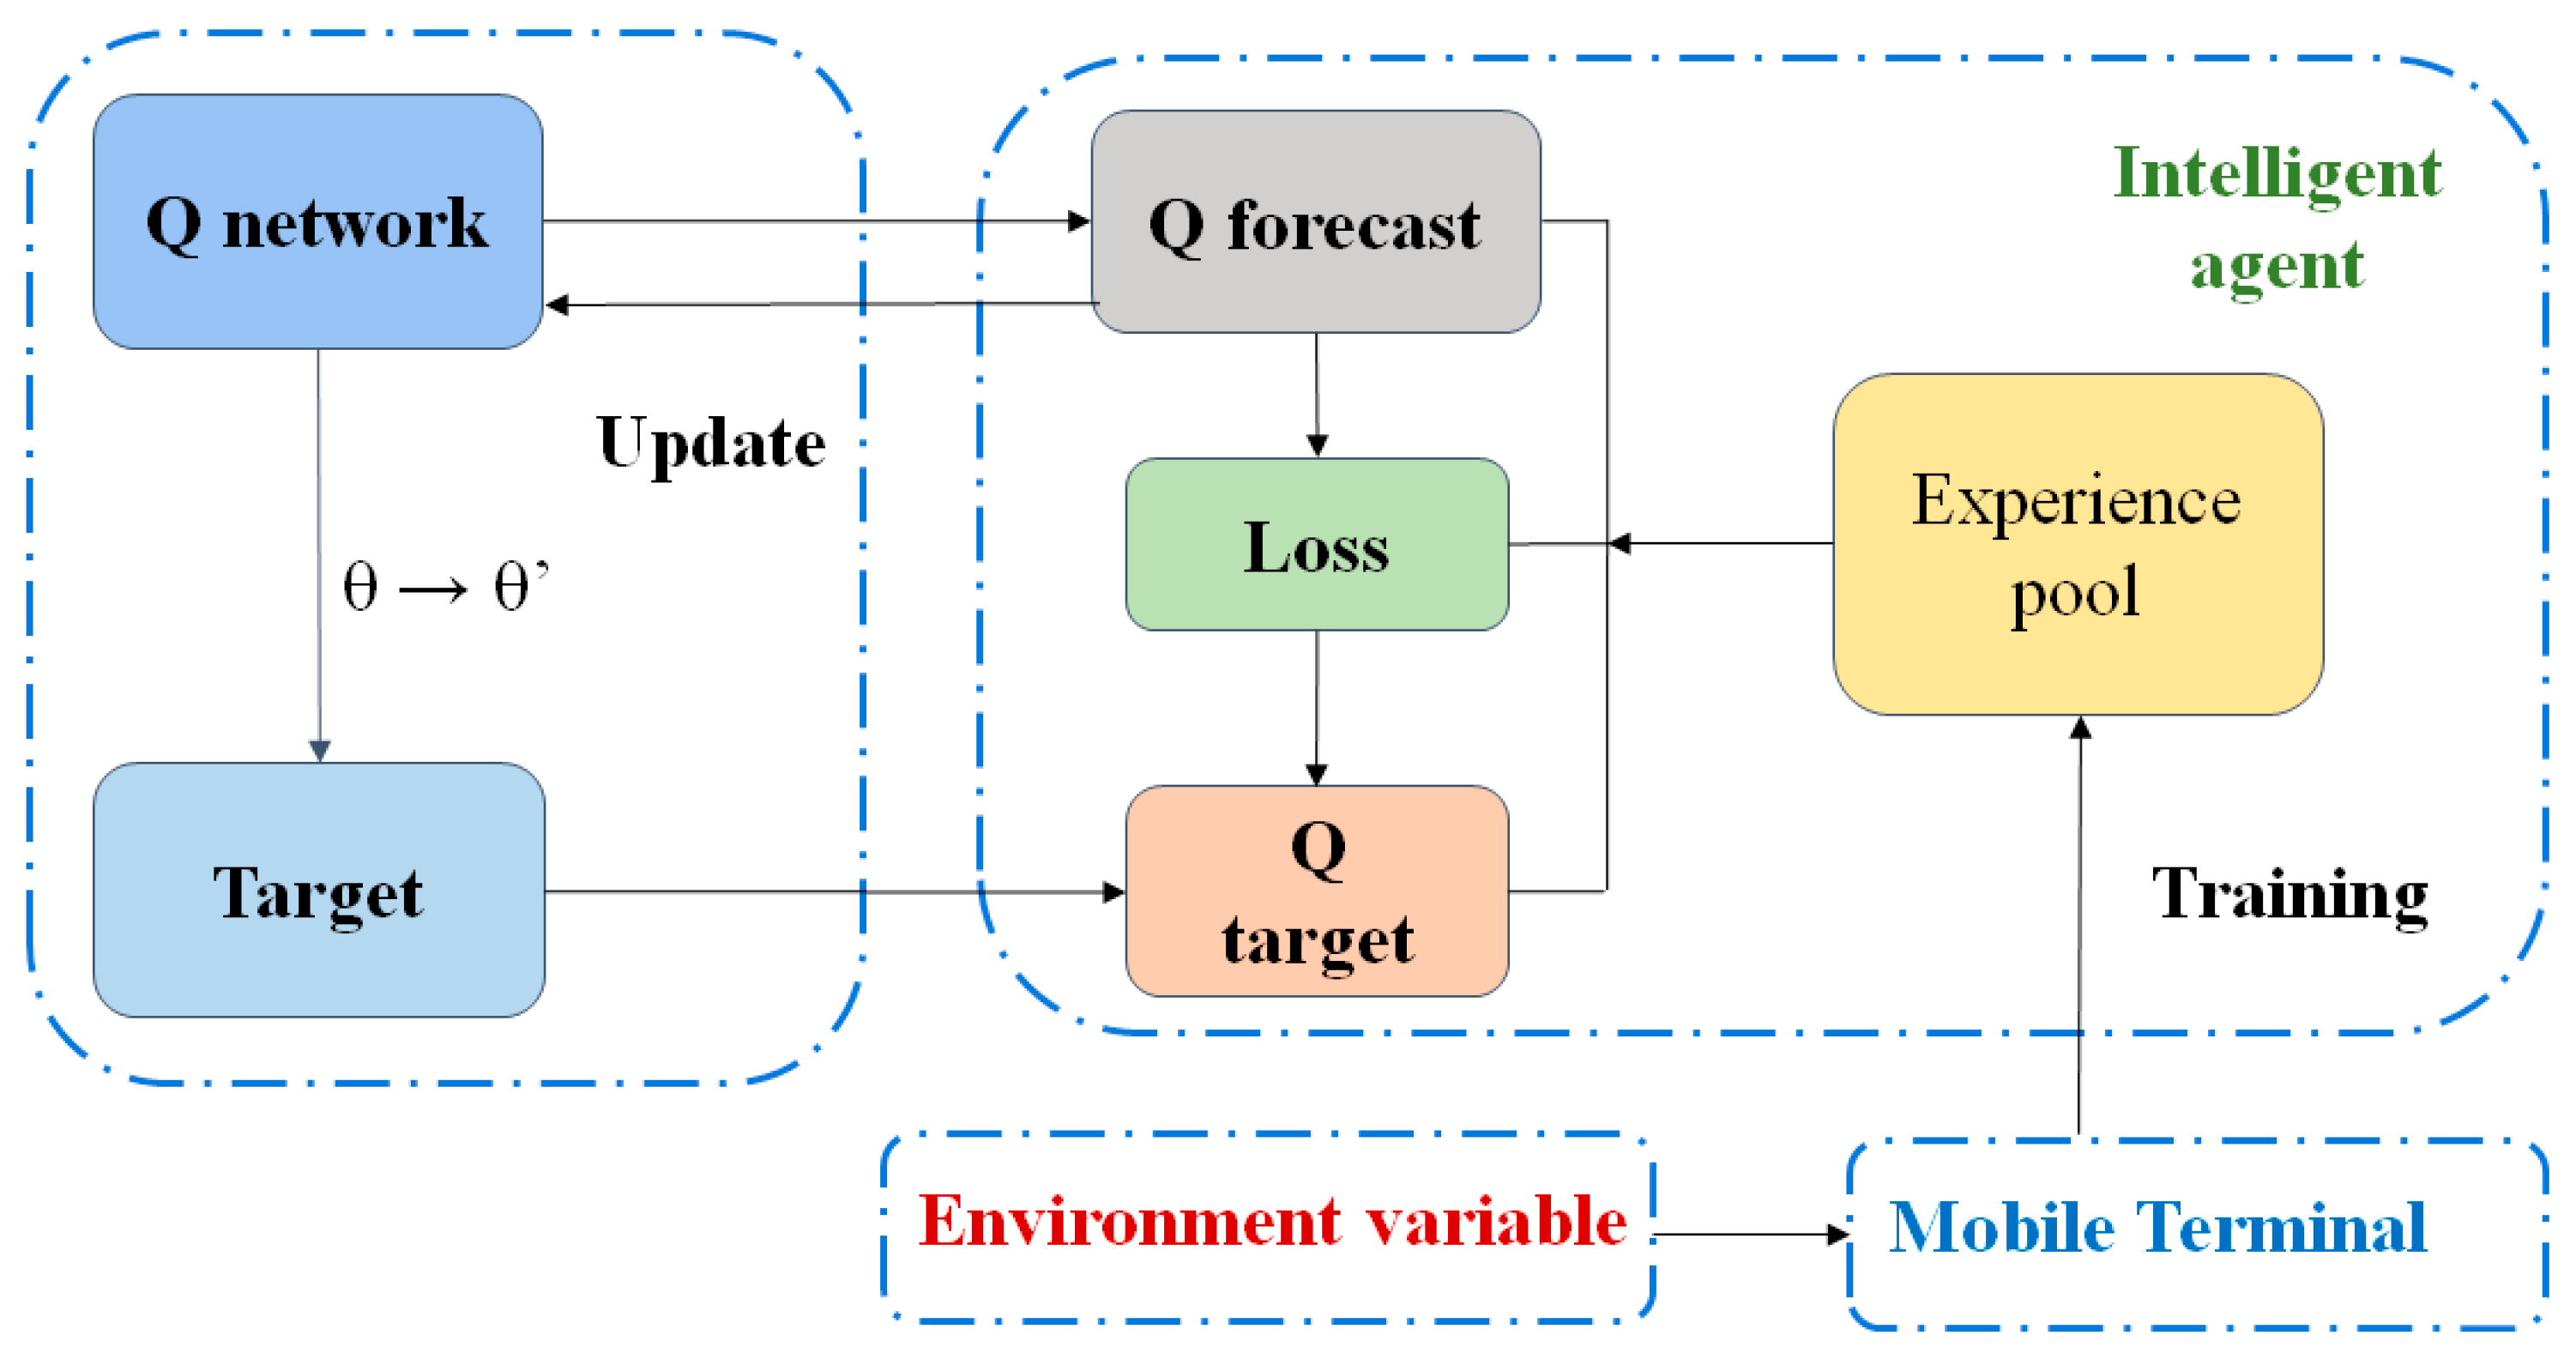
Figure 4 shows the flowchart of the algorithm. The DRL model considers five key factors [14]: the environment, agent, action, status, rewards, and penalties.
The following equation expresses the DRL model:
y j = { R j i s _ e n d =   t r u e R j + γ m a x a Q ( φ ( S j ) , A j , w ) i s _ e n d =   f a l s e
φ ( S ) is the input of the deep Q-learning network. A greedy method is used to obtain the Q value. It uses a random selection to prevent the network from falling into the local optimum. The current action, A , in the state, S , is executed to obtain the feature vector corresponding to the new state S’ with φ ( S ) and reward R to terminate the status, i s _ e n d . { φ ( S ) , A , R , φ ( S ) , i s _ e n d } is used as the parameters in the experience pool. The agent obtains the experience value to learn the current Q value for y j .

4.2. Energy Consumption and Calculation Delay of Wheat Growth Stage Detection Model

A mathematical equation was established to calculate the energy consumption and delay of the wheat growth stage detection model. The processing information of the mobile device is represented as a quaternion, Mi= (cw,uw,dw,fs), where cw is the CPU power of the mobile device, uw and dw are the power of the mobile device to upload and download data, respectively, and fs is the number of floating-point operations per second. The wireless network status is represented as a binary group, Si = ( u s , d s ), where u s represents the upload speed, and d s represents the download speed of the wireless network. The decision space is defined as xi = 0 and xi = 1, where “0” denotes the task is processed on the intelligent device, and “1” denotes the task is unloaded to the edge server for processing. The delay includes the calculation delay and communication delay, when xi = 0, T m represents the calculation delay of the mobile device, and when xi = 1, T m represents the calculation delay of the edge server. The communication delay is represented by T s , as shown in Equations (2) and (3):
T m = F l f s
T s = P s i z e u s + P r e s u l t d s
where F l represents the floating-point number required by the mobile device’s CPU to complete the computing tasks, and P s i z e and P r e s u l t represent the size of the uploaded and received data, respectively. The energy consumption consists of the computing energy consumption and communication energy consumption; only the energy consumption of the mobile device is considered. The computing energy consumption and communication energy consumption are calculated by Equations (4) and (5), respectively.
E m = c w × F l f s
E s = u w × P s i z e u s + d w × P r e s u l t d s

4.3. Design of Agent

After defining the energy consumption and time delay, it is necessary to determine the agent’s learning ability to evaluate the two parameters and decide whether to migrate the services. The DQN evaluates the energy consumption and time delay dynamically. The weight of the energy consumption is small if the mobile devices have more residual power and vice versa, regardless of whether the services are migrated or not. Similarly, time delay also has a weight parameter. 
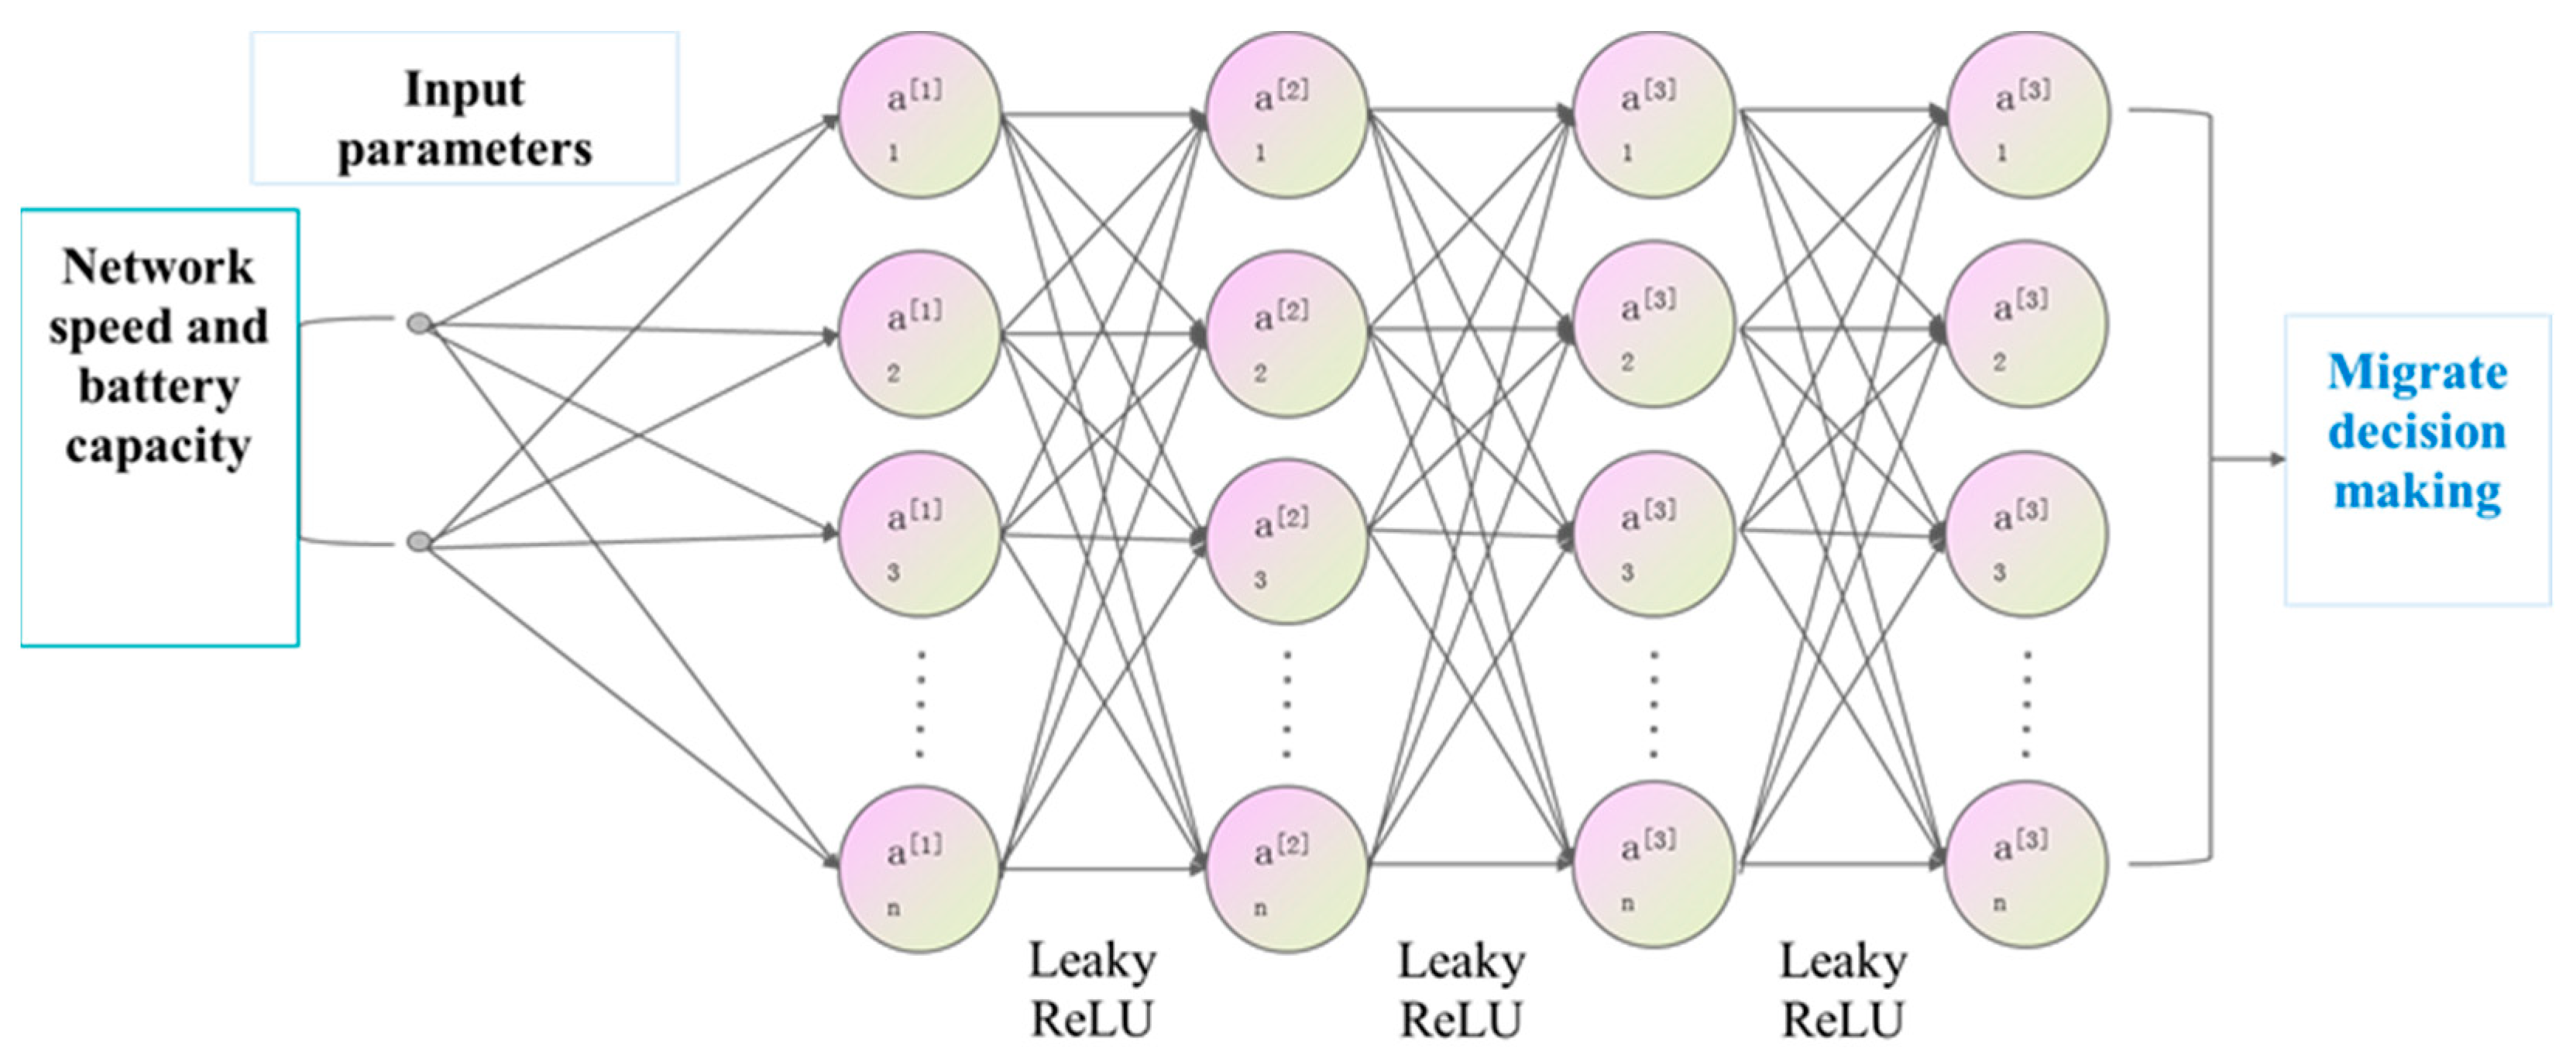
Figure 5 shows the structure of the agent. During the training of the DQN algorithm, the agent learns useful information as the environment changes. The agent is used to simulate the decision-making and calculation processes of intelligent devices. After the agent inputs the network and electricity status into the neural network, it calculates the energy consumption and time delay of the decision results and evaluates the decision quality to assess the rewards and penalties. Because the input consists of only two parameters (the network speed and power), the agent uses a small back propagation (BP) neural network to simulate the decision-making of intelligent devices. Figure 5 shows that the BP neural network for decision-making has four hidden layers, and the activation function is a leaky ReLU function. The decision-making results are obtained by inputting the network speed and power, and the agent learns using the reinforcement learning algorithm. The calculation of the energy consumption and time delay is expressed by Equations (6) and (7), which are combined into Equation (8) to optimize the time delay and energy consumption jointly.
A ( s i , a i ) = k t × T i + k e × E i
T i = min x i ( F l f s + x i ( P s i z e u s + P r e s u l t d s ) )
E i = min x i ( ( 1 x i ) × c w × F l f s + x i ( u w × P s i z e u s + d w × P r e s u l t d s ) )
where T i and I represent the delay and energy consumption costs after the agent has made a decision, and A ( s i , a i ) represents the weighted sum of the energy consumption and costs. k t and k e are the delay and energy consumption coefficients, indicating the importance of the delay and energy consumption. When the power is low, the energy consumption coefficient, k e , is high, and when the network speed is high, the delay coefficient, k t , is high.

5. Experimental Design and Results

5.1. Experimental Results of Lightweight Detection Model

The VGG16, ResNet50, InceptionV3, MobileNetV2, and DenseNet models were compared with the proposed lightweight wheat growth stage model. These classic models have achieved good results in many fields. The experimental environment and the hyperparameters were consistent for all of the models, and training was conducted locally using the Tensorflow framework [31]. The graphics card was a GTX1050 Ti. A 0.001 learning rate, and the Adam optimizer was used for training. The effect of the network structure on the detection performance was compared. The accuracy rate change in each epoch during training was recorded to compare the models’ learning abilities. Only the accuracy rate change of the first 30 epochs is shown because all the models have a high learning ability. The performances of the different models for detecting the wheat growth stages are listed in Table 4.
The results indicate that the proposed model has a higher accuracy rate than the other models in the GS. Because the GS is difficult to identify, the accuracy rate is slightly higher than in the other growth stages. The average recognition accuracy of the five growth stages is 98.6% for the proposed model and 99.2% for DenseNet, which achieved the highest average accuracy.

5.2. Experimental Results of Deep Reinforcement Learning Recognition Model and Dynamic Migration Algorithm

5.2.1. Comparison of the Models’ Operating Speeds

The model’s operating speed is critical because it runs on a mobile terminal. A speed test was conducted using 100 wheat growth stage images to evaluate the performances of the models. Table 5 lists the results. The results show that the detection speed of the models does not increase with a decrease in the parameter number but is related to the model’s structure. This effect is the most pronounced for the VGG because it has a relatively simple structure despite its many parameters; therefore, it has a fast detection speed. Although the DenseNet model has few parameters, its structure is complex, resulting in a large number of feature maps and low detection speed. The size of the proposed wheat growth stage detection model is only 1.3 MB. Thus, it has the highest detection speed due to the low parameter number. The parameter number of the proposed model is 58% lower, and its detection speed is 47% higher than that of MobileNetV2.

5.2.2. Impact of Learning Rate and Experience Pool on Loss

The mobile device uses a Core i5-10500 processor, 8G (DDR43000) of memory, and no GPU acceleration. The edge computing server uses the Tencent lightweight server, CentOS7 system, and 2G memory, and the maximum bandwidth is 5 Mbps. Different data transmission rates were selected according to the wireless network communication mode [32]. The TensorFlow service’s framework was used to deploy the model to the Linux server. The loss value was utilized to evaluate the error between the real and predicted values [33,34]. The change in the learning rate significantly affects the loss value of the DQN algorithm. Thus, the models with learning rates of 0.01, 0.001, and 0.0001 were assessed for 200 iterations. Figure 6 shows that when the experience pool is 500, the loss value fluctuates significantly with an increase in the epoch number when the experience pool is 500 and stabilizes at 2000. Therefore, a value of 2000 was used to store the decision data.

5.2.3. Energy Consumption and Delay

The gradient descent method is used to minimize the energy consumption and delay ( A ( s i , a i ) ). The values of k t and k e change with a change in the power and network speed. When the power is sufficient, the agent’s learning strategy ensures that the delay is minimized, and when the network’s speed is sufficient, the energy consumption is minimized. The time delay and energy consumption coefficients, k t and k e , at different network speeds are shown in Figure 7. When the coefficient, k t , of the network speed exceeds 75%, the energy consumption coefficient remains unchanged, the delay coefficient increases, and the delay is reduced.
Energy consumption and time delay are critical parameters of migration decisions when mobile devices are used. The reinforcement learning algorithm continuously learns from the energy consumption and time delay resulting from each decision to minimize these parameters. Table 6 shows the energy consumption and delay for the different models. The proposed model has fewer parameters, a faster running speed, and lower energy consumption than the other detection models. The speed of performing the detection on one image on an intelligent device is 0.43 s, and the energy consumption is 0.023 mWh. These values are 49% lower than that of MobileNetV2 (MT2).
The energy consumption and delay of the proposed method at the mobile terminal and edge server are listed in Table 7.
Experiments were conducted on performing and not performing decision-making to evaluate the effect of the DQN algorithm on the intelligent migration of the convolutional neural network model. Not performing decision-making was divided into execution on the device (local execution) and execution in the cloud (edge execution). The average operation times and average delay of the system were analyzed at the same power. Figure 8 shows the average running times of the model at different network speeds. The higher the average running time, the lower the energy consumption. At a network speed of 0–2 MB/s, the energy consumption is high, and the model decision is biased toward local execution because the network speed is low and the transmission time is long. However, as the network speed increases, the energy consumption is higher for local execution than for migration to the cloud; thus, cloud execution is preferable. The energy consumption of the intelligent migration algorithm is 128.4% lower than that of local execution at a network speed of 0–8 MB/s.
Figure 9 shows the average delay for the different network rates. The delay of edge execution is the highest at a network speed of 0–2 MB/s, and local execution is preferable. As the network speed increases, the network communication delay decreases, and edge execution becomes preferable. The average efficiency of the intelligent migration algorithm is 121.2% higher than the local execution at a network rate of 0–8 MB/s.

6. Discussion

Implementing a deep learning algorithm for wheat growth stage detection on mobile devices has high energy consumption and a large time delay. A lightweight detection model was proposed with low energy consumption and delay based on depth-wise separable convolution and a residual wireless network. A decision-making method was proposed for performing edge computing and migrating the wheat growth stage detection model to the wireless network edge server for processing. The dynamic migration strategy of the DQN-based identification model enabled the execution of complex processes while minimizing energy consumption and processing time. The proposed method is also applicable to other crops.
The experimental results show that the proposed model and algorithm have good performance and are suitable for practical applications. This approach can be used to develop a wheat growth period monitoring system. It can be implemented on mobile devices, and the calculations are performed on the server. The TensorFlowlite open-source framework can be used to implement this model on mobile devices. On the server side, Docker can be used to deploy the model server to execute requests and return the result to the mobile device.

Author Contributions

Formal analysis, X.M.; Investigation, J.W.; Methodology, Y.L.; Resources, G.Z.; Supervision, L.X.; Validation, H.L. All authors have read and agreed to the published version of the manuscript.

Funding

This research was funded by the National Natural Science Foundation of China, grant number 61871322, and the Henan Province Key Scientific and Technological Project, grant number 222102110234.

Institutional Review Board Statement

This study does not require ethical approval, and we choose to exclude this statement.

Data Availability Statement

We will consider analyzing the research data in some way in http://en.henau.edu.cn/.

Conflicts of Interest

The authors declare no conflict of interest.

References

  1. Hellegers, P. Food security vulnerability due to trade dependencies on Russia and Ukraine. Food Secur. 2022, 14, 1503–1510. [Google Scholar] [CrossRef]
  2. Han, S.; Zhao, Y.; Cheng, J.; Zhao, F.; Yang, H.; Feng, H.; Li, Z.; Ma, X.; Zhao, C.; Yang, G. Monitoring Key Wheat Growth Variables by Integrating Phenology and UAV Multispectral Imagery Data into Random Forest Model. Remote Sens. 2022, 14, 3723. [Google Scholar] [CrossRef]
  3. Ren, S.; Guo, B.; Wu, X.; Zhang, L.; Ji, M.; Wang, J. Winter wheat planted area monitoring and yield modeling using MODIS data in the Huang-Huai-Hai Plain, China. Comput. Electron. Agric. 2021, 182, 106049. [Google Scholar] [CrossRef]
  4. LeCun, Y.; Bengio, Y.; Hinton, G. Deep learning. Nature 2015, 521, 436–444. [Google Scholar] [CrossRef]
  5. Zhang, Y.; Wang, W.; Zhang, P.; Huang, P. Reinforcement-Learning-Based Task Planning for Self-Reconfiguration of Cellular Satellites. IEEE Aerosp. Electron. Syst. Mag. 2021, 37, 38–47. [Google Scholar] [CrossRef]
  6. Hassan, N.; Yau, K.L.A.; Wu, C. Edge computing in 5G: A review. IEEE Access 2019, 7, 127276–127289. [Google Scholar] [CrossRef]
  7. Clifton, J.; Laber, E. Q-learning: Theory and applications. Annu. Rev. Stat. Its Appl. 2020, 7, 279–301. [Google Scholar] [CrossRef] [Green Version]
  8. Li, Y.; Jiang, C. Distributed task offloading strategy to low load base stations in mobile edge computing environment. Comput. Commun. 2020, 164, 240–248. [Google Scholar] [CrossRef]
  9. Chen, C.; Chen, L.; Liu, L.; He, S.; Yuan, X.; Lan, D.; Chen, Z. Delay-optimized V2V-based computation offloading in urban vehicular edge computing and networks. IEEE Access 2020, 8, 18863–18873. [Google Scholar] [CrossRef]
  10. Xiao, Z.; Chen, Y.; Jiang, H.; Hu, Z.; Lui, J.C.; Min, G.; Dustdar, S. Resource management in UAV-assisted MEC: State-of-the-art and open challenges. Wirel. Netw. 2022, 28, 3305–3322. [Google Scholar] [CrossRef]
  11. Shen, H.; Jiang, Y.; Deng, F.; Shan, Y. Task Unloading Strategy of Multi UAV for Transmission Line Inspection Based on Deep Reinforcement Learning. Electronics 2022, 11, 2188. [Google Scholar] [CrossRef]
  12. Lv, Z.; Chen, D.; Wang, Q. Diversified technologies in internet of vehicles under intelligent edge computing. IEEE Trans. Intell. Transp. Syst. 2020, 22, 2048–2059. [Google Scholar] [CrossRef]
  13. Wang, K.; Wang, X.; Liu, X. A high reliable computing offloading strategy using deep reinforcement learning for iovs in edge computing. J. Grid Comput. 2021, 19, 15. [Google Scholar] [CrossRef]
  14. Ding, X.; Zhang, W. Computing unloading strategy of massive internet of things devices based on game theory in mobile edge computing. Math. Probl. Eng. 2021, 2021, 2163965. [Google Scholar] [CrossRef]
  15. Huang, J.; Gao, H.; Wan, S.; Chen, Y. AoI-aware energy control and computation offloading for industrial IoT. Future Gener. Comput. Syst. 2023, 139, 29–37. [Google Scholar] [CrossRef]
  16. Chen, X.; Jiao, L.; Li, W.; Fu, X. Efficient multi-user computation offloading for mobile-edge cloud computing. IEEE/ACM Trans. Netw. 2015, 24, 2795–2808. [Google Scholar] [CrossRef] [Green Version]
  17. Zhang, D.; Cao, L.; Zhu, H.; Zhang, T.; Du, J.; Jiang, K. Task offloading method of edge computing in internet of vehicles based on deep reinforcement learning. Cluster Comput. 2022, 25, 1175–1187. [Google Scholar] [CrossRef]
  18. Chen, C.; Zhang, Y.; Wang, Z.; Wan, S.; Pei, Q. Distributed computation offloading method based on deep reinforcement learning in ICV. Appl. Soft Comput. 2021, 103, 107108. [Google Scholar] [CrossRef]
  19. Tian, H.; Wang, T.; Liu, Y.; Qiao, X.; Li, Y. Computer vision technology in agricultural automation—A review. Inf. Process. Agric. 2020, 7, 1–19. [Google Scholar] [CrossRef]
  20. Zhang, Z.J.; Wu, T.; Li, Z.; Shen, B.; Chen, N.; Li, J. Research of offloading decision and resource scheduling in edge computing based on deep reinforcement learning. In Proceedings of the Smart Grid and Internet of Things: 4th EAI International Conference, SGIoT 2020, TaiChung, Taiwan, 5–6 December 2020. [Google Scholar]
  21. Gu, M.; Li, K.C.; Li, Z.; Han, Q.; Fan, W. Recognition of crop diseases based on depthwise separable convolution in edge computing. Sensors 2020, 20, 4091. [Google Scholar] [CrossRef]
  22. Sun, L.; Zhao, H.; Chen, J. Recognition method of crop diseases and insect pests based on multi-layer feature fusion. Basic Clin. Pharmacol. Toxicol. 2020, 2020, 127. [Google Scholar]
  23. Albanese, A.; Nardello, M.; Brunelli, D. Automated pest detection with DNN on the edge for precision agriculture. IEEE J. Emerg. Sel. Top. Circuits Syst. 2021, 11, 458–467. [Google Scholar] [CrossRef]
  24. Zhou, G.; Wen, R.; Tian, W.; Buyya, R. Deep reinforcement learning-based algorithms selectors for the resource scheduling in hierarchical Cloud computing. J. Netw. Comput. Appl. 2022, 208, 103520. [Google Scholar] [CrossRef]
  25. Weichman, P.B. Quantum-enhanced algorithms for classical target detection in complex environments. Phys. Rev. 2021, 103, 042424. [Google Scholar] [CrossRef]
  26. Ji, B.; Wang, Y.; Song, K.; Li, C.; Wen, H.; Menon, V.G.; Mumtaz, S. A survey of computational intelligence for 6G: Key technologies, applications and trends. IEEE Trans. Ind. Inform. 2021, 17, 7145–7154. [Google Scholar] [CrossRef]
  27. Peng, X.; Zhang, X.; Li, Y.; Liu, B. Research on image feature extraction and retrieval algorithms based on convolutional neural network. J. Vis. Commun. Image Represent. 2020, 69, 102705. [Google Scholar] [CrossRef]
  28. Yun, J.; Jiang, D.; Liu, Y.; Sun, Y.; Tao, B.; Kong, J.; Tian, J.; Tong, X.; Xu, M.; Fang, Z. Real-Time Target Detection Method Based on Lightweight Convolutional Neural Network. Front. Bioeng. Biotechnol. 2022, 10, 861286. [Google Scholar] [CrossRef]
  29. Lochbihler, A. A mechanized proof of the max-flow min-cut theorem for countable networks with applications to probability theory. J. Autom. Reason. 2022, 66, 585–610. [Google Scholar] [CrossRef]
  30. Yang, Y.; Juntao, L.; Lingling, P. Multi-robot path planning based on a deep reinforcement learning DQN algorithm. CAAI Trans. Intell. Technol. 2020, 5, 177–183. [Google Scholar] [CrossRef]
  31. Haghighat, E.; Juanes, R. SciANN: A Keras/TensorFlow wrapper for scientific computations and physics-informed deep learning using artificial neural networks. Comput. Methods Appl. Mech. Eng. 2021, 373, 113552. [Google Scholar] [CrossRef]
  32. Li, Y.; Li, B.; Yang, M.; Yan, Z. A spatial clustering group division-based OFDMA access protocol for the next generation WLAN. Wirel. Netw. 2019, 25, 5083–5097. [Google Scholar] [CrossRef]
  33. Yang, H.B.; Zhao, J.; Lan, Y.; Lu, L.; Li, Z. Fraction vegetation cover extraction of winter wheat based on spectral information and texture features obtained by UAV. Int. J. Precis. Agric. Aviat. 2019, 2, 54–61. [Google Scholar]
  34. Čirjak, D.; Aleksi, I.; Miklečić, I.; Antolković, A.M.; Vrtodušić, R.; Viduka, A.; Lemic, D.; Kos, T.; Pajač Živković, I. Monitoring System for Leucoptera malifoliella (O. Costa, 1836) and Its Damage Based on Artificial Neural Networks. Agriculture 2023, 13, 67. [Google Scholar] [CrossRef]
Figure 1. Wheat canopy images acquired in five stages: (a) seedling stage; (b) tillering stage; (c) overwintering stage; (d) greening stage; (e) jointing stage.
Agriculture 13 00534 g001
Figure 2. Data enhancement: (a) normalization; (b) dislocation transformation; (c) image scaling; (d) image flipping; (e) standardization.
Agriculture 13 00534 g002aAgriculture 13 00534 g002b
Figure 3. Structure of convolutional neural network.
Agriculture 13 00534 g003
Figure 4. Flowchart of the DQN algorithm.
Agriculture 13 00534 g004
Figure 5. Agent structure.
Agriculture 13 00534 g005
Figure 6. Impact of experience pool on loss value.
Agriculture 13 00534 g006
Figure 7. Time delay and energy consumption factors at different power values.
Agriculture 13 00534 g007
Figure 8. Average running times.
Agriculture 13 00534 g008
Figure 9. Average delay.
Agriculture 13 00534 g009
Table 1. Number of wheat canopy image samples.
Wheat Growth StagesTraining Set/PieceTest Sets/PieceTotal Sets/Piece
Seedling–tillering *19204802400
Tillering–overwintering19204802400
Overwintering–greening19204802400
Greening–jointing19204802400
Jointing–heading19204802400
* Seedling stage (SS) and tillering stage (TS).
Table 2. Network parameters of the wheat growth stage detection model.
Input Basic UniteeOS1S2kds
2242 × 3Convolution32321232false
1122 × 32Convolution64321231false
562 × 32Convolution128321131true
562 × 32Convolution128481121false
562 × 48Convolution196482131false
282 × 48Convolution196481132true
282 × 48Convolution256641151false
282 × 64Convolution256642151false
142 × 64Convolution400641151false
142 × 64Convolution400801151false
142 × 80Pooling2D (pool_size = 7, strides = 2)
42 × 1024 Conv2d 1 × 1(filters = 1024)
Softmax
Table 3. Comparison of hyperparameters.
Learning RateAdam-32(%)Adam-64(%)SGD-32(%)SGD-64(%)
0.00597.897.397.297.8
0.00198.697.998.097.5
0.000597.996.196.997.3
0.000197.897.597.897.2
Table 4. Performance of different models for detecting the wheat growth stages.
ModelJS (%) *ES (%) *GS (%) *TS (%) *OS (%) *Average (%)
VGG1699.210094.696.097.397.8
Inception99.499.693.110097.497.9
ResNet5099.699.294.299.898.298.2
Mobile Net99.610096.099.498.098.6
Dense Net99.610097.999.898.699.2
Proposed model99.498.698.099.297.898.6
* JS: jointing stage; ES: emergence stage; GS: greening stage; TS: tillering stage; OS: overwintering stage.
Table 5. Operating speeds of different models.
ModelVGG16IV3 *RT50 *MT2 *DT *Proposed Model
Time(s) 32.88163.09116.8184.88212.1645.07
Parameter (MB)134.321.827.93.17.01.3
* IV3: InceptionV3; RT50: Resnet50; MT2: MobileNetV2; DT: DenseNet.
Table 6. Comparison of energy consumption and delay for different models.
Model IV3RT50DTMT2Proposed Method
Data (MB) 21.8 *27.97.03.11.3
Delay (s) 1.631.162.120.840.43
Energy (mWh) 0.0910.0640.1180.0450.023
* IV3: InceptionV3; RT50: Resnet50; DT: DenseNet; MT2: MobileNetV2.
Table 7. Energy consumption and delay of the proposed method.
Proposed ModelDataLayersAccuracyDelayEnergy
Value1.3 MB2198.6%0.43 s0.077 mWh
Disclaimer/Publisher’s Note: The statements, opinions and data contained in all publications are solely those of the individual author(s) and contributor(s) and not of MDPI and/or the editor(s). MDPI and/or the editor(s) disclaim responsibility for any injury to people or property resulting from any ideas, methods, instructions or products referred to in the content.

