Article

Wastewater-Based Nutrient Supply for Lettuce Production in the Infulene Valley, Maputo, Mozambique

by
Celma Almerinda Niquice-Janeiro
1,2,*,
Andre Marques Arsénio
1 and
Jules Bernardus van Lier
1
1
Department of Water Management, Delft University of Technology, Stevinweg 1, 2628 CN Delft, The Netherlands
2
Department of Rural Engineering, Faculty of Agronomy and Forestry Engineering, Eduardo Mondlane University, Maputo P.O. Box 257, Mozambique
*
Author to whom correspondence should be addressed.
Agriculture 2023, 13(11), 2158; https://doi.org/10.3390/agriculture13112158
Submission received: 12 September 2023 / Revised: 13 November 2023 / Accepted: 14 November 2023 / Published: 16 November 2023

Abstract

:
This research investigated the contribution of wastewater-based nutrient supply, viz., nitrogen (N), phosphorous (P), and potassium (K), for lettuce production in the Infulene Valley, Mozambique, from July to September 2019. The research was conducted in groundwater- and wastewater-irrigated agricultural plots. Water samples were collected weekly, soil samples were collected before planting and after harvest, and lettuce samples were collected at harvest time. The nutrient content (N, P, and K) was measured, and a mass balance method was applied. Wastewater had distinctly higher nutrient contents than groundwater, which guaranteed crop nutrition during the growing stage. Wastewater contributed 88%, 96%, and 97% to the N, P, and K requirements, respectively. The crop yield in the wastewater-irrigated areas was 43,8 ± 16 tons/ha, which was higher than 35 ± 8 tons/ha observed for the groundwater-irrigated areas, but results showed no statistically significant differences. Conclusively, wastewater led to reduced soil-nutrient gap and can be a source of nutrients. Therefore, wastewater is regarded as an alternative nutrient source of interest, and if properly applied, it might reduce environmental health hazards, resulting from run-off or leaching of excess nutrients.

1. Introduction

Wastewater is an alternative source for agricultural irrigation to compensate for water shortages [1,2,3] or the lack of proper irrigation sources. In most low-income countries and arid regions, wastewater is widely used in (peri)urban agriculture, either (partially) treated or non-treated [4,5,6,7,8]. The use of wastewater results in the availability of reliable water sources and increased nutrient availability for agricultural fields, improving the farmers’ livelihood and crop development [8,9,10,11].
Nitrogen (N), phosphorous (P), and potassium (K) belong to macronutrients that are commonly present in (treated) wastewater at agriculturally relevant concentrations [12]. N is commonly present in ionized forms, such as N O 3 , N O 2 , and N H 4 + , while it might also be present in gaseous forms, such as N O x , N H 3 , N2O, and N2. N in its different forms can become available in the soil through processes such as biological fixation, ammonia deposition, nitrification, and denitrification [13]. Under aerobic conditions, N O 3 is considered a relatively stable and mobile ion and can be transported with soil water, while N H 4 + is more easily absorbed to the negatively charged soil clay particles. Soil also receives N in organic form through plant residues, which can be mineralized by saprotrophic organisms [14]. Plants uptake N mainly as N O 3 and N H 4 + [15]. P does not have gaseous forms [13] and exists as mineral in the ortho-phosphate form ( P O 4 3 ) with H+, Fe3+, Ca2+, or Al3+ as counter ions or as organic P bound in plant matter [15]. P has lower mobility and is mostly found in phosphate rocks, soil, and marine sediments [13]. Plants uptake P as PO43- [15]. K is readily absorbed by plants in the form of K+ and is highly soluble in soil and water. However, the concentration in soil is low, requiring frequent supplementation by manure, artificial fertilizers, and/or wastewater [12].
The organic matter in (treated) wastewater that is used for irrigation contributes to improved soil structure, water infiltration, prevention of surface sealing, and increased biological activity, resulting in better crop yields [16]. Organic fertilizers are used in agriculture for the same reason, in addition to meeting crop nutrient demands [15,17,18,19].
Nutrient supply through inorganic fertilizers contributes around 30 to 50% of the crop yield [18]. However, in many countries in sub-Saharan Africa (SSA), the use of fertilizers remains low [20,21,22,23]. The lack of fertilizer use is seen as the major cause of low agricultural production in countries like Mozambique [24]. The main reasons for this low fertilizer use include limited awareness regarding the benefits of using fertilizers and high purchase costs [24]. Only 5% of smallholder farmers use fertilizers, and they do so at very low application rates, such as 5.7 kg/ha from the regional target of 65 kg/ha [22]. The remaining farmers in the country produce crops without applying any type of fertilizers, while others apply organic fertilizers based on manure. In most SSA countries including Mozambique, manure application depends on smallholder’s economic resources, manure availability, and type of crops produced, i.e., fodder crops or cash crops, like high-value crops (e.g., Maize) and vegetables [25]. However, relatively little data are available on manure application coverage. For example, data from the Mozambican Integrated Agricultural Survey in the 2014/2015 season indicated that manure application in cereals rated 1.8% of a total of 4,000,000 smallholder farmers [25]. The variability in manure application may result in high differences in nutrient concentrations in soils among farmers [26,27].
The state of nutrient supply for crops in developing countries in irrigated agriculture is not well known, and there is a lack of detailed on-farm nutrient balances to quantify pathways of both nutrient input and loss over time, under the prevailing management practices [28,29]. Therefore, monitoring nutrients at the farm level is essential to estimating nutrient supply, which is rarely conducted for untreated or partially treated wastewater [10]. Boom et al. [12] described the fate of nutrients using a simplified nutrient balance in wastewater-irrigated plots in Jordan, finding a mismatch between the applied amount via the nutrients present in wastewater and the required amount of macronutrients for crop growth, resulting in nutrient over-dosages, which potentially have negative impacts on the environment and crops. Similar studies were conducted for the Chivero catchment area, in Zimbabwe, where Nhapi et al. [30] assessed the major water and nutrient flows using nutrient balances. The nutrient flows for Maputo at the Infulene valley are still unknown, due to the limited information in the area concerning the amount of nutrients that may be present in irrigation water in the area.
In our research, we investigated the potential contribution of wastewater-based nutrients for the supply of N, P, and K in lettuce production in the Infulene Valley, Maputo, Mozambique, which is located in a peri-urban area of Maputo [7]. In the area, agriculture is heavily practiced with diversified irrigation water sources such as groundwater, river water, and partially treated and untreated wastewater. In this area, a wastewater treatment plant (WWTP) is constructed, consisting of a pond system, comprising two anaerobic and two facultative ponds, which receive 5–10% of Maputo’s city wastewater for treatment [31]. However, the WWTP is not functioning well due to severe overloading and poor management, with the anaerobic ponds full of sludge and facultative ponds covered by hyacinths jeopardizing proper treatment [32], even though the final effluent is informally used to irrigate the crops including lettuce [31]. Despite its poor quality [31,32], the use of wastewater for irrigation might have the potential benefit of being a source of indispensable nutrients for crop cultivation with a positive impact on soil structure, biological activity, and crop yields.

2. Materials and Methods

2.1. Sampling and Experimental Design

The experiment was carried out in the Infulene Valley in Maputo (Figure 1), in a peri-urban agricultural site for lettuce production. The experimental area is in the farmer’s fields and simulated their own natural environment where they grow lettuce using their plant management practices. Two areas were selected with different irrigation water sources: one applied groundwater from shallow wells as an irrigation source and the other one applied secondary stage-treated wastewater effluent, collected from the facultative pond at Infulene WWTP. The WWTP is a lagoon system comprising two anaerobic and two facultative ponds that treat 5–10% of the effluent of Maputo’s city and discharge its effluent in the Infulene River [31,32]. The total experimental area was 22 m2 and 19.6 m2 for groundwater and wastewater areas, respectively. Each of them had four replicates, and the samples were collected from soil, water, and fresh lettuce heads. Each plot in the groundwater area had an average area of 5.5 ± 0.6 m2, while the plots in the wastewater area had an average area of 4.9 ± 0.2 m2, with average dimensions of 3.6 × 1.5 m and 3.1 × 1.6 m for groundwater and wastewater, respectively. Regular field visits were conducted in each irrigated area to ensure that the practices were consistent. The applied crop management practices were similar for the groundwater and wastewater irrigation areas, from initial crop growth to crop harvest. These practices included the type of crops produced (lettuce), the use of manure from a mixture of animal excreta such as cow or chicken, mixed with plant residues, the applied irrigation method, sample collection, and the harvest procedure. The use of watering cans is the commonly practiced irrigation method in the area. During the experiments, farmers initially irrigated the crops with four watering cans once after planting. As the crops grew, the irrigation frequency increased to twice per day, using six cans per plot, and continued in this manner until harvest. The volume of irrigating cans used was 10 L, at the pick of the irrigation period each plot received up to 12 cans equivalent to 120 L per plot (24 L/m2/day). Some advantages of using this irrigation method include portability, low cost, and no need for electricity or fuel to function. However, some disadvantages of this method are that it is labor-intensive, time-consuming, and inefficient for larger areas. Therefore, the amount of water applied was quantified by observing the number of watering cans applied in the producing area. Manure is the most common organic fertilizer, which is applied manually. The source of manure was the same as commonly used by the farmers. The estimated manure amounts applied in the experimental area were 40 kg for wastewater-irrigated soil and 30 kg for groundwater-irrigated soil. Soil preparation, weeding, and harvest are also carried out manually—a common practice among most small-scale farmers in Mozambique, due to the lack of capacity to invest in machinery and sometimes due to the geographical characteristics of the area.
Soil samples were collected before planting and after harvest per site. A total of 48 soil samples were collected using a hand-driven auger. The samples were collected in two irrigation sources (one groundwater, and one wastewater). For each location, four (4) replicate soil samples were collected at three (3) depths at two periods (corresponding before planting and after harvesting). The three different depths are further referred to as the top, medium, and bottom layers, i.e., 0–20 cm, 20–40 cm, and 40–60 cm, respectively. These depths were selected according to lettuce root depth, which is around 0 to 60 cm [33]. The applied sampling schedule helped to describe temporal variations in the concentrations of nutrients in different soil layers. Samples were air-dried for one week until they reached a constant weight. Hereafter, they were passed through a 2 mm sieve and mixed thoroughly.
Water samples were collected weekly during the entire experimental period, i.e., from the plantation until the harvest. The water sampling procedure was used to capture possible temporal variations in the water quality throughout the experiment. In each week, two duplicate irrigation water samples were collected per site using glass bottles of 250 mL volume, giving a total of 28 during the 7 weeks of sampling. The samples were placed in a container with ice packs, to maintain their integrity while being transported to the laboratory.
Manure was applied in solid form around the plant, two weeks after planting, and the amount of manure was registered in both irrigated areas. Manure samples were collected when it was applied to the soil, and the manure was analyzed to give approximate estimates of the amount of nutrients (N, P, and K) supplied by the manure during the experiment. Lettuce samples were selected randomly in the plot when ready to harvest. Each lettuce sample consisted of three lettuce heads. This standardized sampling method was used throughout the experiment. Therefore, a total of 8 lettuce samples were collected for analysis, corresponding to 24 lettuce heads resulting from the collection of 3 lettuce heads per plot, in 4 replicates at 2 sides with different irrigation water sources. The samples were stored in sterile plastic bags, then inserted in a container (one container for each source to avoid contamination), and transported directly to the laboratory. Lettuce samples after the harvest were dried at 60 °C for 7 days until they reached a constant weight. Hereafter, they were homogenized by grinding to reach small sizes for further analysis. To prevent contamination during transportation, each sample was appropriately labeled and separated from the other samples in a closed container.

2.2. Laboratory Analysis

Soil, water, manure, and lettuce samples were analyzed for nutrient content of N, P, and K, following the methods as described in Table 1.

2.2.1. Soil Chemical and Physical Analysis

Soil samples were analyzed for N, P, and K nutrient content as well as for texture, organic matter (OM), cation exchange capacity (CEC), pH, and electrical conductivity (EC). The nutrient content was analyzed by measuring the concentrations N O 3 , N H 4 + , total N, total P, P O 4 3 , total K, and available K.
The soil texture was determined using the pipette method by Robinson [34].
The organic matter (OM) content in soil is related to the nutrient storage capacity and was measured using the Walkley & Black method [34,39].
The cation exchange capacity (CEC) shows the soil fertility and nutrient retention capacity [40] and correlates positively with organic matter content [41]. The CEC was measured using the ammonium acetate method [34,42].
Soil pH influences soil physical properties, e.g., a low pH facilitates OM decomposition and increases the availability of soil nutrients [16]. The soil pH was determined potentiometrically in (1:2.5 p/v) soil: water suspension and KCl. The electrical conductivity was determined using an electrical conductivity meter [34].
The determination of the N content of soil was conducted by measuring the mineral concentrations of N O 3 and N H 4 + . The N H 4 + and N O 3 were extracted using potassium chloride and analyzed using steam distillation and titration. The total N, P, and K were extracted using sulfuric acid, selenium, salicylic acid, and hydrogen peroxide following the procedure described by Walinga et al. [43] and Okalebo [36]. The total N was analyzed using the Kjeldahl method [37].
P types analyzed in these experiments were available P O 4 3 and total P. Total P was determined using spectrophotometry by measuring P in the solution of a simple colorimetric method based on ascorbic acid reduction of the ammonium phosphomolybdate complex [35]. For the determination of P O 4 3 , the Olsen’s method was used [37].
K types analyzed in the experiment were available K+, and the total K was determined using a flame photometer [36]. The available K was determined using the ammonium acetate (NH4Ac) extraction method [36,38].

2.2.2. Water Analysis

The water samples were analyzed for N (total N, N O 2 , and N O 3 ), P O 4 3 , and K+ using test kits (Hach Lange GMBH, Düsseldorf, Germany) and analyzed using UV-VIS spectrophotometer Hach DR 3900 (Hach, Loveland, CO, USA). The concentrations of macronutrients were multiplied by the respective amount of water used for irrigation to quantify the nutrient input from irrigation water (wastewater and groundwater). The pH and electrical conductivity of the water were determined using a pH meter and an electrical conductivity meter (Orion STAR A215, Thermo Fischer Scientific Inc., Kota Administrasi Jakarta Selatan, Indonesia), respectively.

2.2.3. Lettuce and Manure Analysis

To compare the productivity of both areas, the lettuce yield was recorded after the harvest from the groundwater and wastewater sites. At each site, each lettuce sample was analyzed for total N, P, and K. The plant material was digested using a mixture of sulfuric acid, selenium, salicylic acid, and hydrogen peroxide [36]. The Kjeldahl technique was used for the measurement of total N. The total P was measured through the molybdenum blue method and determined colorimetrically using a 6705 UV/Vis spectrophotometer (JENWAY Bibbly Scientific Ltd., Stone, UK) [35,44]. The total K was measured using a flame photometer (Digimed, São Paulo, Brazil). The same procedure was applied to manure collected two weeks after planting. The nutrient uptake in lettuce was determined by multiplying the plant dry weight by the measured concentration.

2.2.4. Statistical Analysis

Changes in soil nutrient levels resulting from irrigation were assessed using a paired T-test with a significance level of 5%, using IBM SPSS statistical software version 26. Nutrient concentrations were compared between different irrigation types, applying an independent T-test at a significance level of 5%, using SPSS statistical software. For the analysis of yield data, a T-test was used, and means were compared using the least significant difference method at the 5% significance level, using SPSS statistical software.

2.3. Nutrient Balances

A nutrient balance was conducted to quantify the N, P, and K fluxes during a single cropping season in the peri-urban area of the Infulene Valley, Maputo. The focus of this balance in the agricultural system was on assessing the input and output of N, P, and K in the farmers’ plots irrigated with groundwater and wastewater. Inputs into the system included the addition of manure and the supply of irrigation water. The system’s outputs considered nutrient removal through crops. Other factors, such as leaching losses, runoff, wind erosion, and the volatilization of nitrogen (resulting from denitrification and NH3 volatilization), were not considered because the numerical value is small [12,45]. A nutrient balance was conducted using input (irrigation water and manure) and output (plant uptake) of nutrients for both groundwater (GW)-irrigated site and wastewater (WW)-irrigated site. The soil condition, both before planting and after harvest, was analyzed to investigate the influence of the irrigation source on nutrient supply. The used conceptual framework considers the soil as a nutrient storage that can accumulate or reduce nutrients because of the irrigation source. Accordingly, the soil irrigated with wastewater is referred to as SIW (Soil irrigated with wastewater), and the soil irrigated with groundwater as SIG (Soil irrigated with groundwater). This categorization allows us to distinguish and evaluate the impact of these two distinct irrigation sources on soil nutrient dynamics.

2.3.1. Soil Balances

To evaluate the nutrient supply to the crops, a nutrient balance was performed from sowing to harvest. A mass balance model (2) was used, adapted from Zhang and Shen (1).
Soil nutrient balance = Sfert + Smin + Sirri+ Sdep − Splant
where Sfert is the amount of chemical fertilizer applied in the site (kg/ha). This value was assumed to be zero since no fertilizers were used in the study sites. Smin is the nutrient input from the mineralization of manure (kg/ha). Sirri is calculated by multiplying the nutrient content of the irrigation water by the total amount of water supplied. Sdep is the nutrient input from atmospheric deposition (only N). Sdep for the analyzed period was calculated based on estimations for atmospheric N deposition of 4.8 kg/ha/year for South Africa [46]. In addition, for sparsely populated areas and non-industrial countries, the estimated N deposition is about 5 kg/ha/year [47]. The range of 20–50 kgN/ha/year is used for countries in western Europe and China and can reach 60 kg N/ha/year due to the proximity of cities, intensive cattle breeding, and the amount of precipitation [47]. Based on the estimation of 4.8 kg/ha/year, the N deposition of 0.7 kg/ha was calculated for the period (49 days) in Mozambique. Splant is the nutrient uptake by the aboveground biomass. The nutrient balance assumes that the nutrients in roots will accumulate as agricultural remains in the field. Therefore, the simplified equation used for the soil nutrient balance is as follows:
For N: Soil nutrient balance = Smin + Sirri + Sdep − Splant
For P and K: Soil nutrient balance = Smin + Sirri − Splant

2.3.2. Ratio Calculations

The ratio of nutrient input/output is a quantitative relation between the amount of nutrient input and nutrient output. The nutrient ratio was calculated using the amount of nutrients supplied by manure and irrigation divided by the nutrient uptake by the crop.
For N: Ratio (Input/Output) = (Smin + Sirri + Sdep/Splant)
For P and K: Ratio (Input/Output) = (Smin + Sirri/Splant)

3. Results

3.1. Nutrient Content in Water

The nutrient concentrations in groundwater and wastewater, which were used to irrigate lettuce during the production cycle, are shown in Table 2. The nutrient content in wastewater was distinctly higher compared to groundwater, except for the N O 3 concentration. Crops were irrigated with the wastewater from the facultative pond. However, the results clearly indicate that the wastewater was only subjected to anaerobic conditions in the treatment plant. Almost all N was present in the form of N H 4 + with negligible amounts oxidized to N O 2 or N O 3 . This suggests that the WWTP was lacking nitrification capacity, very likely because of overloading with septic tank content discharged to the anaerobic ponds by tanker trucks.
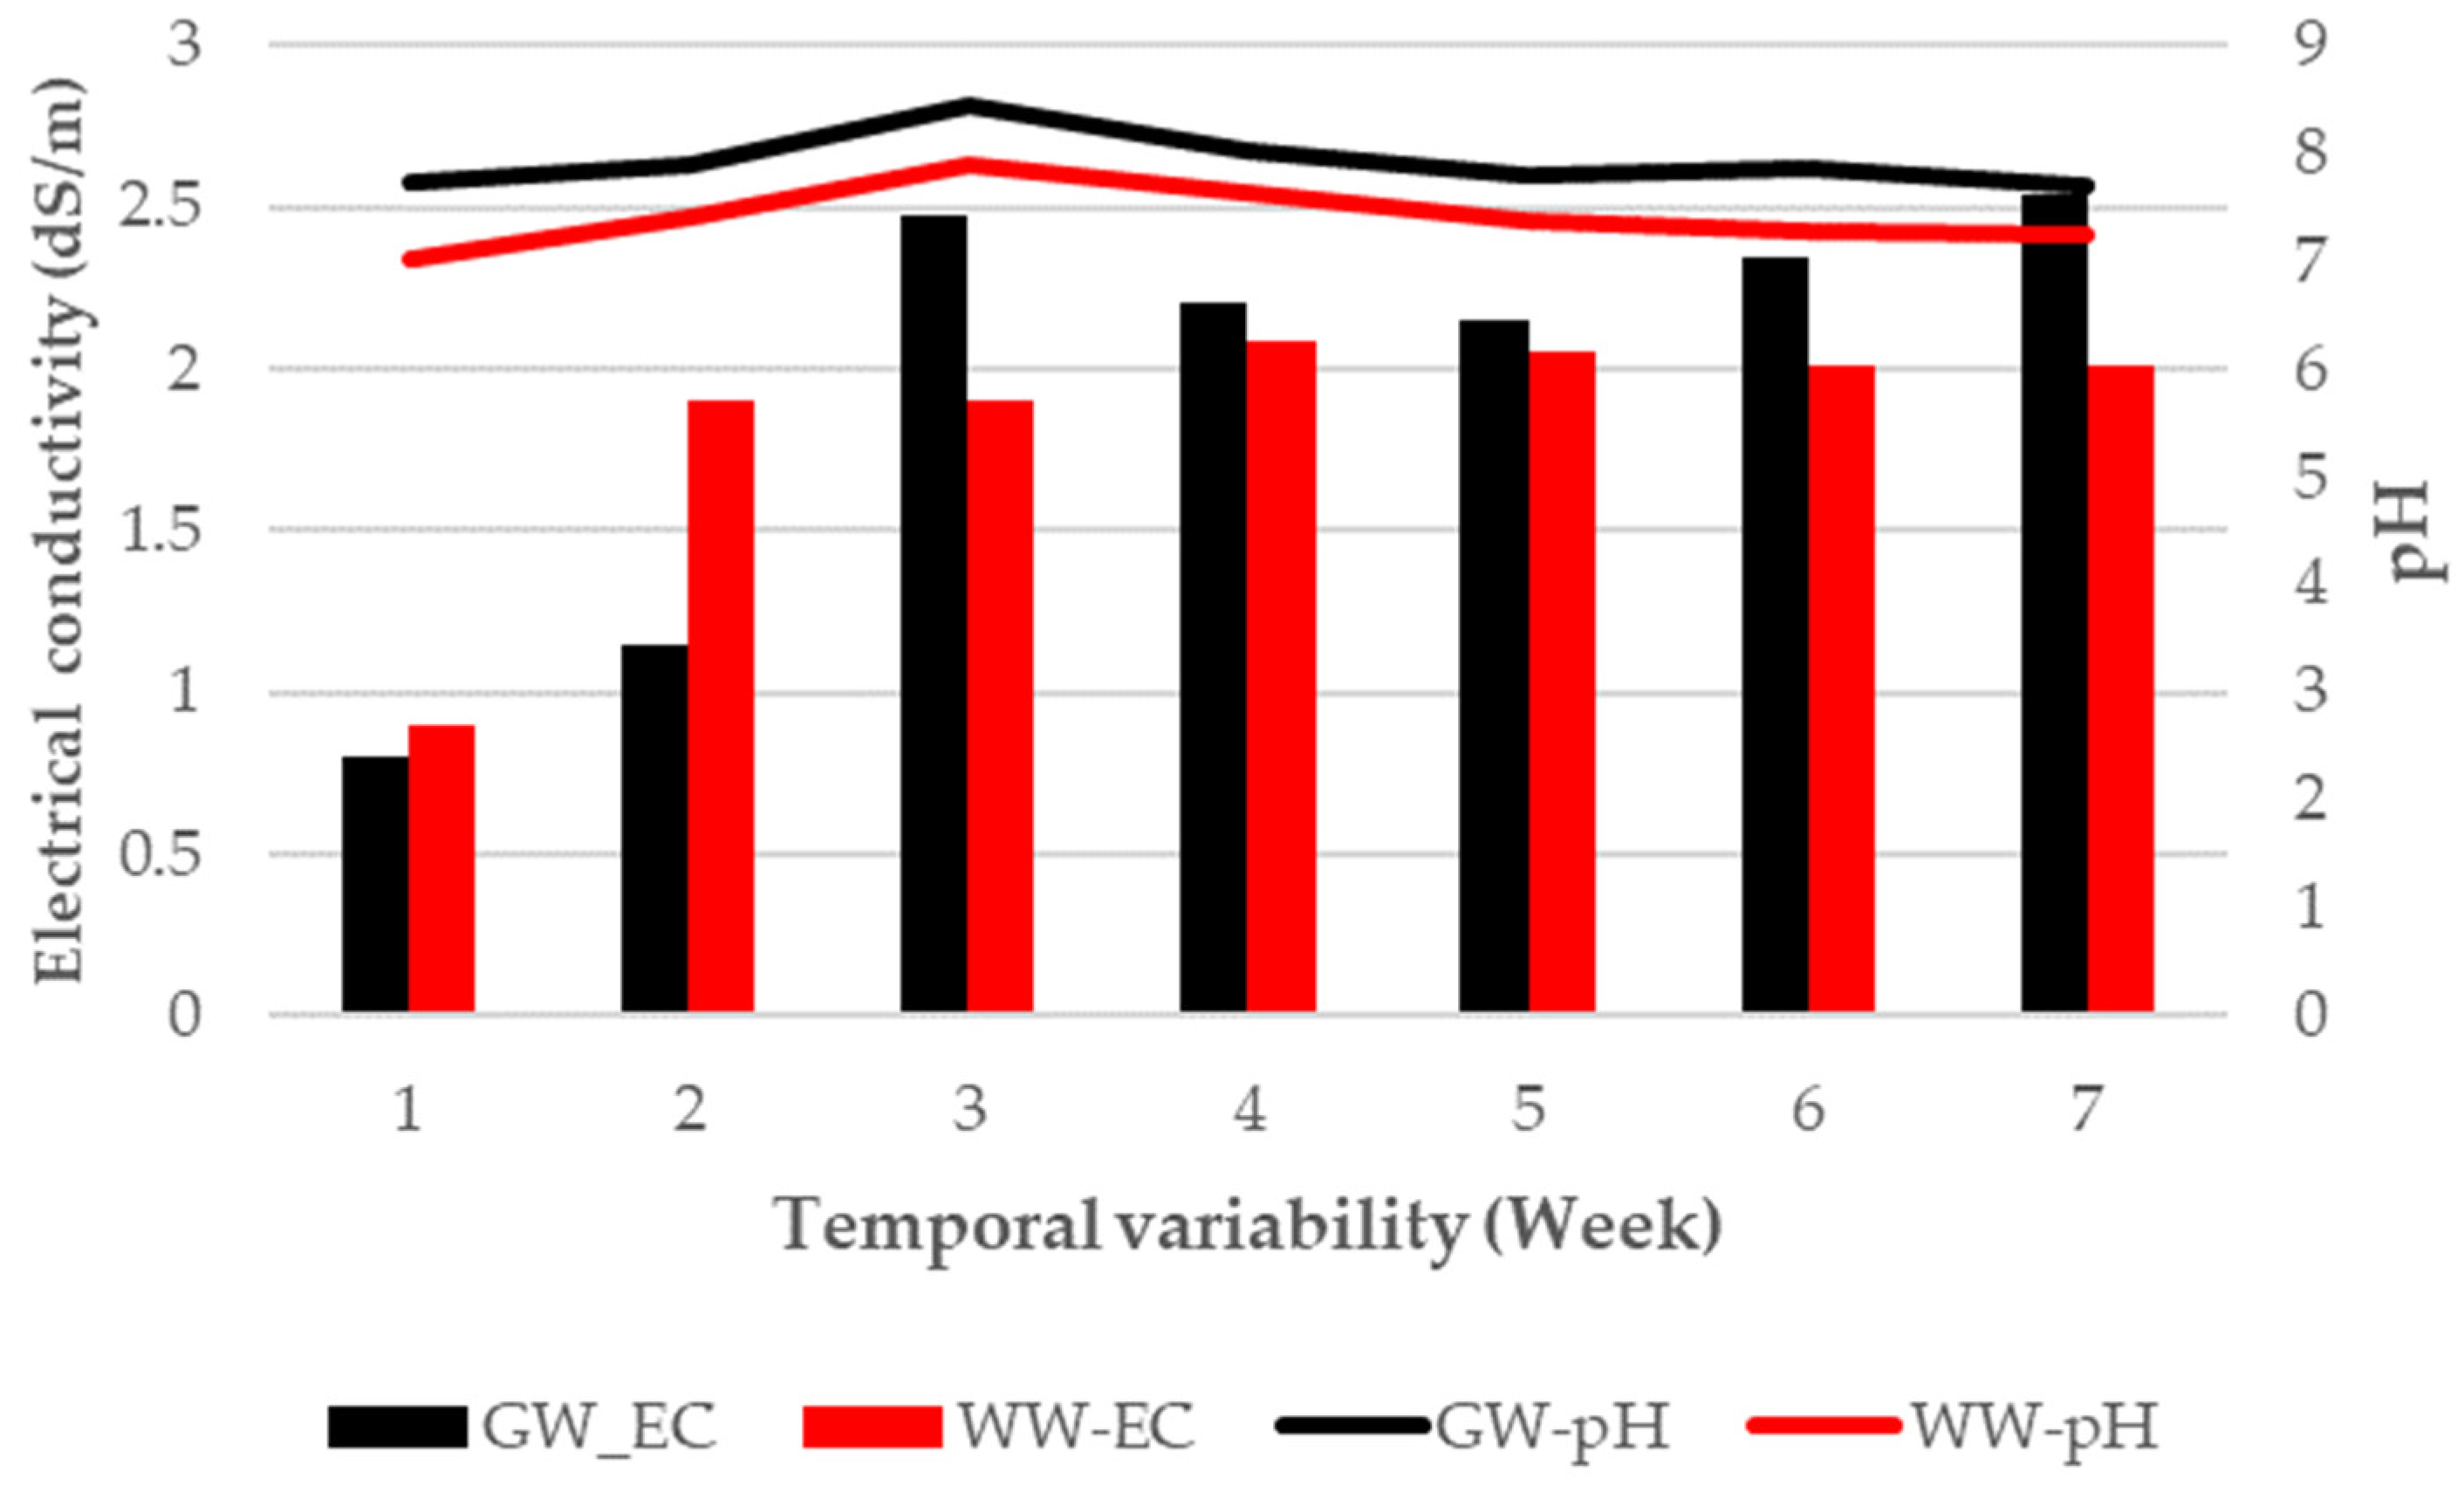
Wastewater showed slightly lower EC and pH values compared to groundwater (Figure 2). The pH at the wastewater site ranged from 7 to 8 indicating circumneutral conditions, while that of groundwater was slightly alkaline. The EC values of the wastewater were approximately 0.75 dS/m in week 1 and around 2 dS/m for the remaining irrigation period, while for groundwater, it reached 2.5 dS/m. The EC values in irrigation water indicated a moderate risk of salinity hazard, which could have potentially affected crop productivity. The relatively low EC levels found in week 1 could be attributed to the final days of precipitation of the wet season as most of the study was conducted in the dry season.

3.2. Physical Proprieties and Nutrient Dynamics in the Soil

For both groundwater- and wastewater-irrigated areas, the results showed that sand is the main soil constituent in all soil layers (Table 3).
The soil irrigated with wastewater (SIW) exhibited lower EC values in the top layer before planting compared to the soils irrigated with groundwater (SIG). In the medium and bottom layers, the EC values were similar between the two irrigation sources. After the harvest, the EC values in the top-to-bottom layers of the SIG were distinctly higher than those in the SIW (Figure 3). Before planting, the EC values of SIG ranged from 0.46 to 0.50 dS/m, and after harvest, it ranged from 0.65 to 0.81 dS/m. While for SIW, the EC values ranged from 0.32 to 0.45 dS/m before planting and increased to the range of 0.52 to 0.62 dS/m after harvest. The results indicate an increase in soil EC during the experimental period, which is likely attributable to the evaporation of irrigation water. The increase in EC in the SIG reached up to 76% and was more pronounced in the bottom layer compared to the top layer possibly influenced by factors such as the clay fraction in the bottom layer. In the case of SIW, the EC increased by up to 62% in the top layer. There was a change in EC pattern for SIG before planting and after harvest (Figure 3).
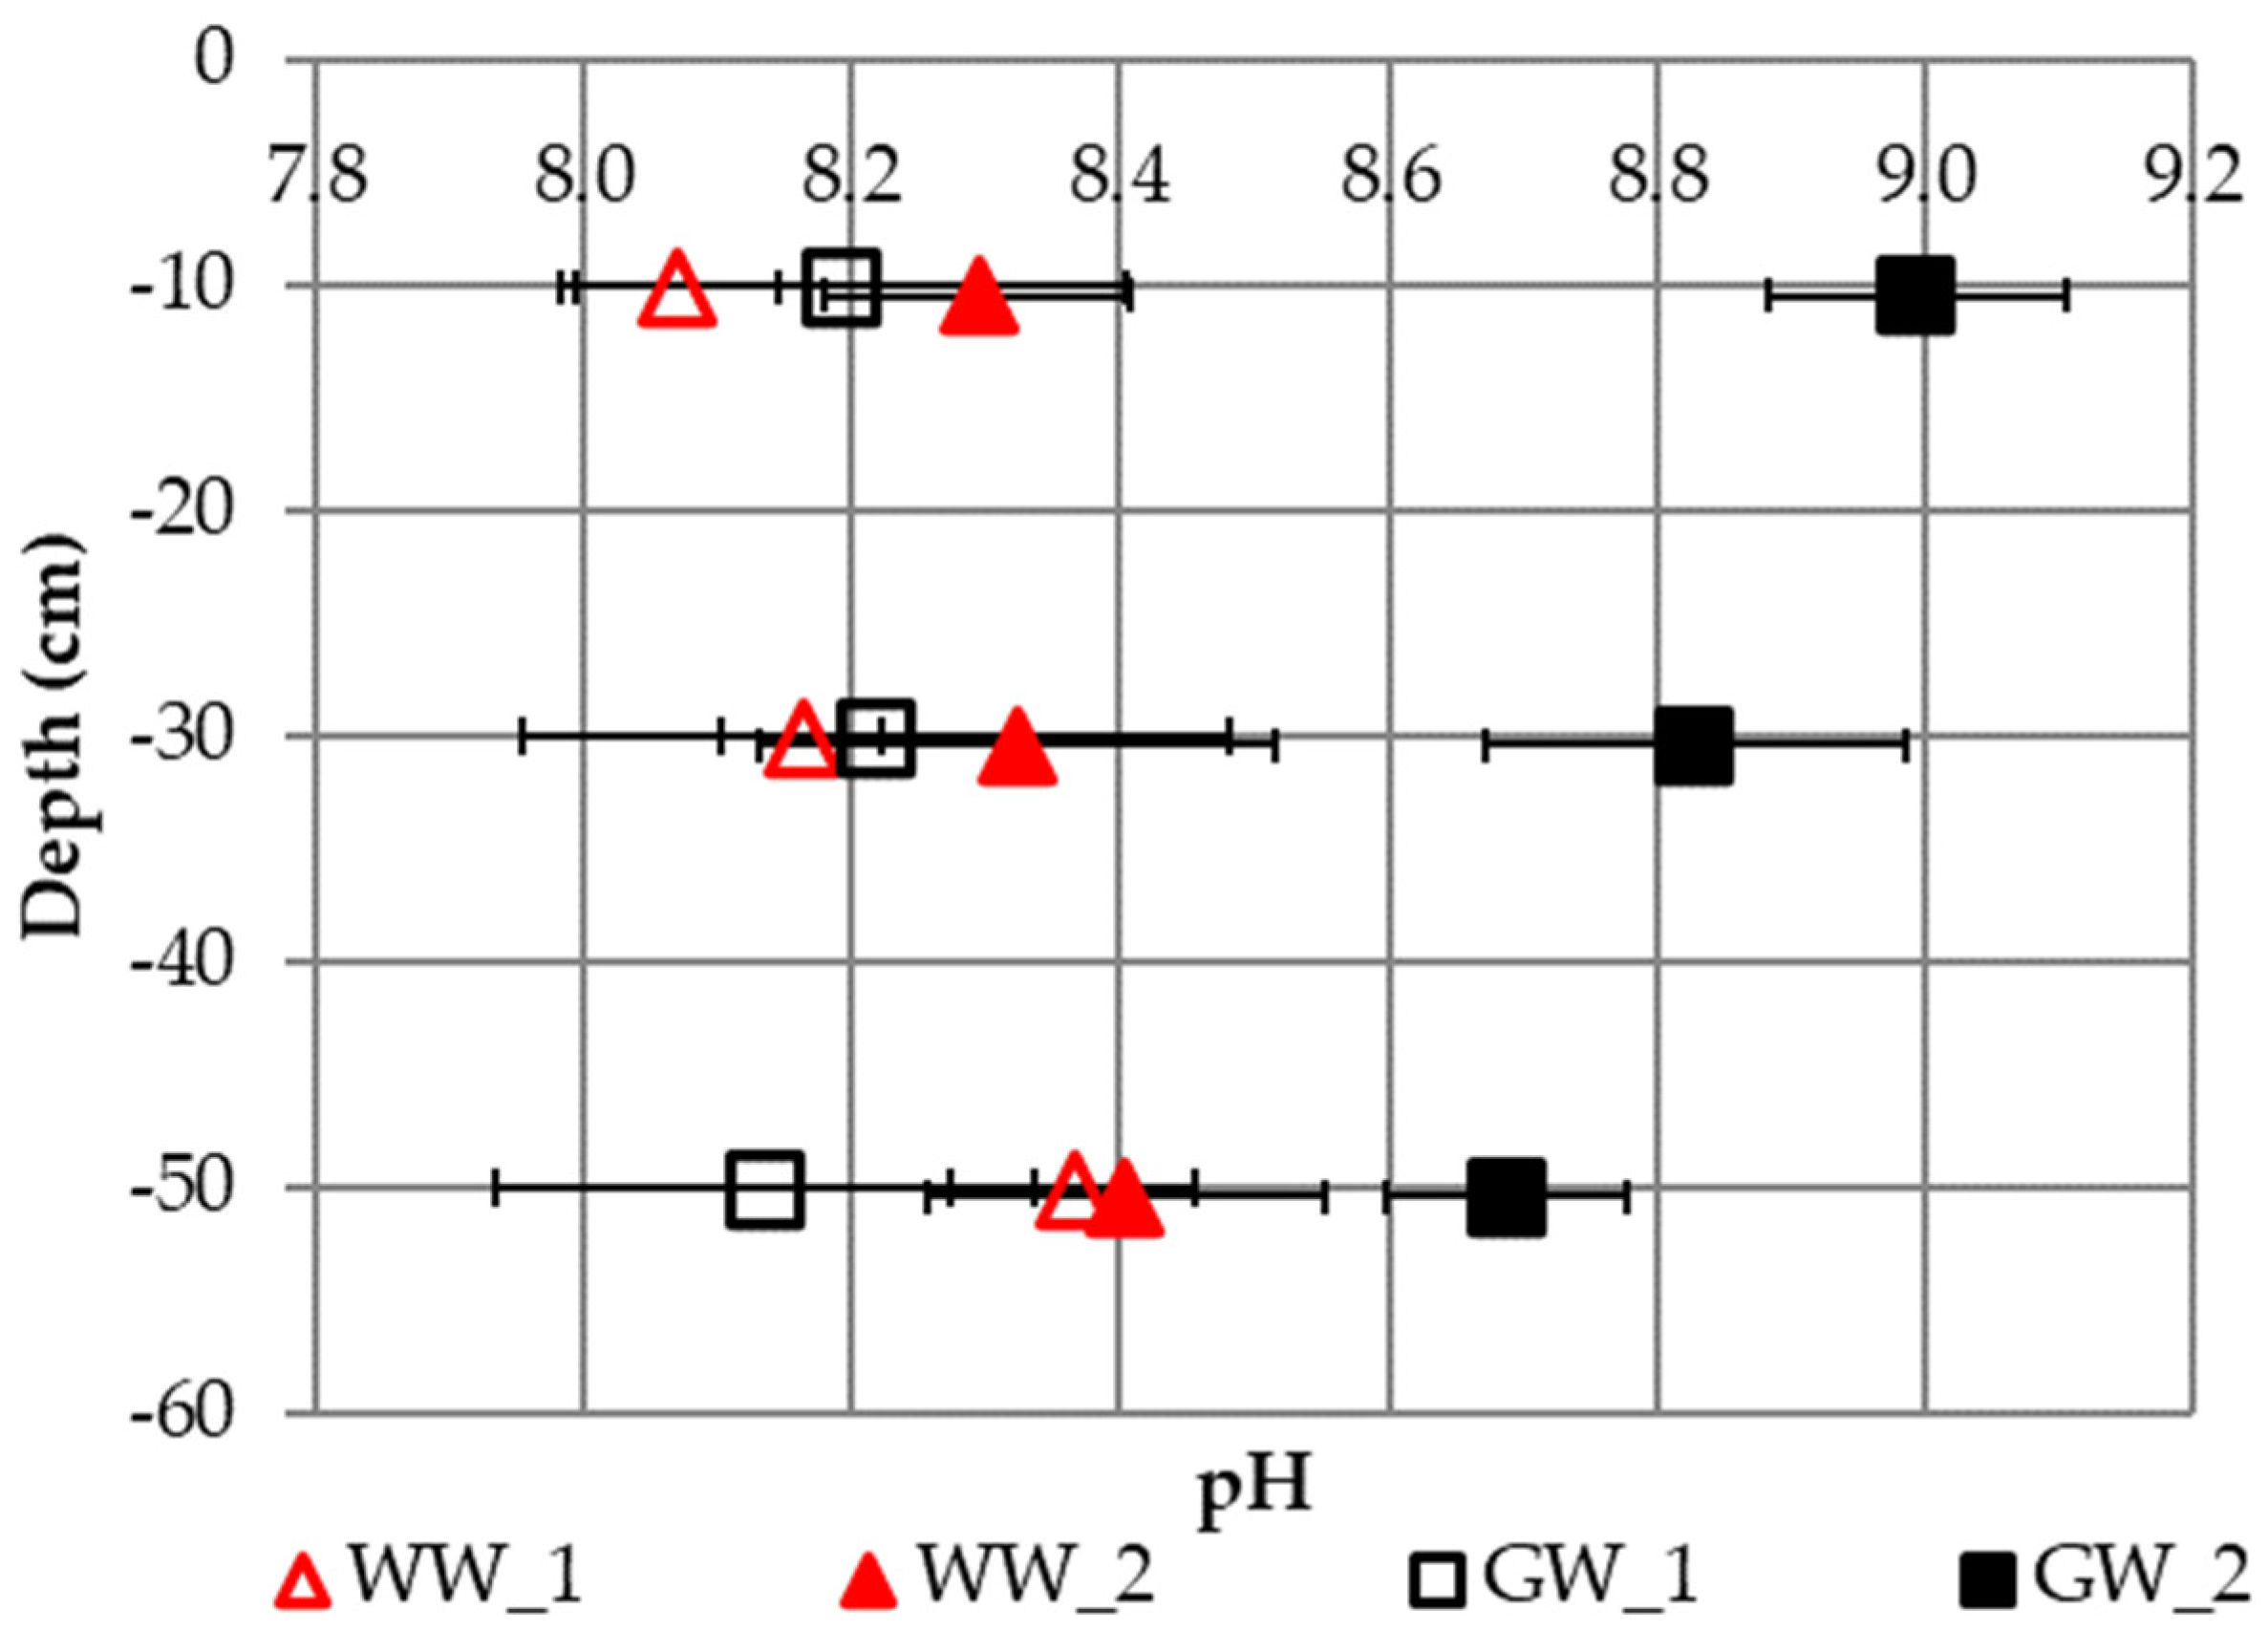
The average pH values in the soils ranged from eight to nine, indicating alkaline-classified soils (Figure 4). After harvest, the pH significantly increased in the SIG, while for SIW, an increase was only observed in the top layer (Figure 4). Before planting, the pH values in the top layer were similar for SIW and SIG, but after harvest, the pH values in the SIG were significantly higher than in the SIW.
In general, the organic matter content and the CEC in SIG were higher than in SIW (Table 4) both before planting and after harvest. The CEC values in SIG varied from 10.7 meq/100 g in the top layers to 20.7 meq/100 g in the bottom layer. In contrast, no clear pattern was found for SIW. After the harvest, the CEC values slightly decreased in SIW (Table 4).

3.2.1. N O 3 , N H 4 + , and Total N Content in Soil

The N concentration was measured in the forms of N O 3 , N H 4 + , and total N (Figure 5, Figure 6 and Figure 7). In general, the N O 3 concentration in soil was higher in SIG than in SIW before planting, while after harvest, this difference was observed only in the bottom layer (Figure 6). In both irrigation areas, the N O 3 concentration was generally higher in the topsoil layers compared to the bottom soil layers. The concentration of N O 3 increased after harvest in SIW, ranging from 14 to 33 mg/kg in the top layers.
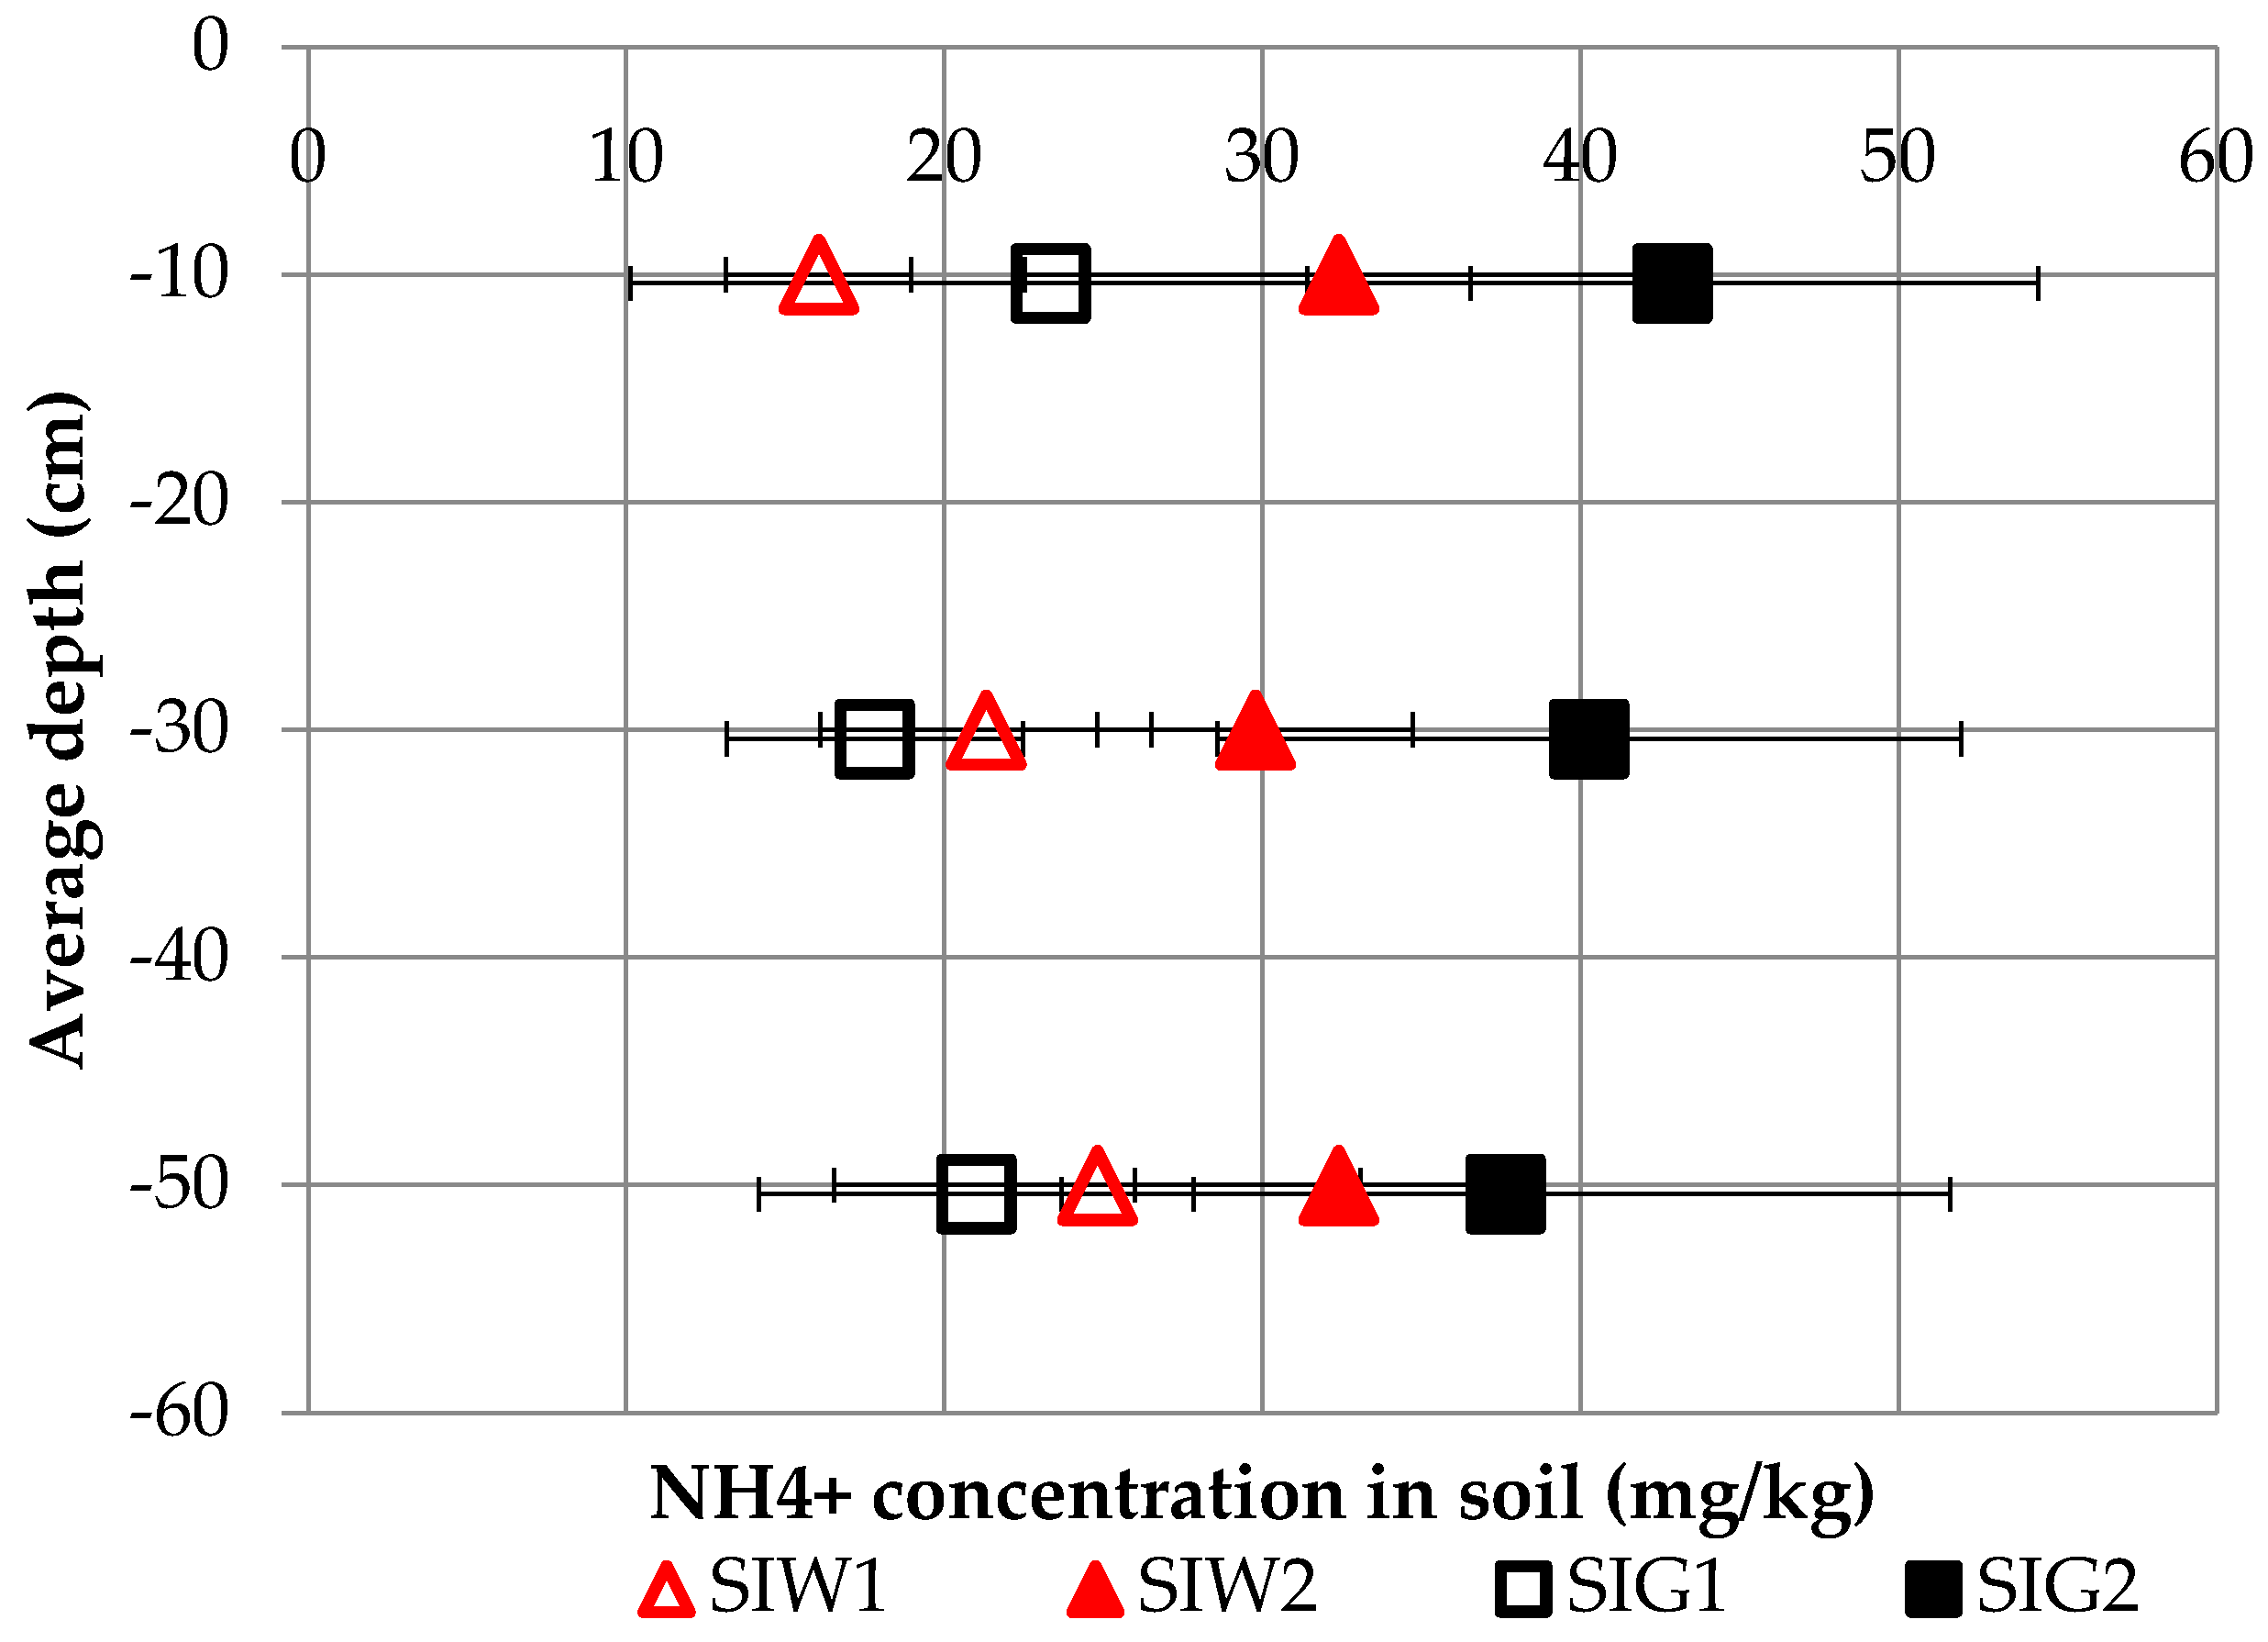
The N H 4 + concentration increased after harvest for both irrigation waters, with SIW ranging from 16 to 32 mg/kg and SIG ranging from 23 to 42 mg/kg. Similar N H 4 + concentrations were found in both SIG and SIW (Figure 6). Considering the amounts of N H 4 + present in wastewater, it was likely that the concentration in SIW would rise higher than the SIG. This observation indicates the likelihood of ammonium ( N H 4 + ) losses occurring within the system, primarily in the wastewater (WW) site. Given the high concentrations of N H 4 + in wastewater, it raises concerns about the fate of this nutrient in the context of irrigation and its potential environmental implications.
The total N increased in all soil layers for both SIW and SIG plots (Figure 7). In general, similar total N concentrations were found in both SIG and SIW.

3.2.2. Available P and Total P Content in Soil

The P concentration (mg/kg) was measured as P O 4 3 and total P (Figure 8 and Figure 9). In the soil profile, all forms of P showed the highest concentrations in the top layers and decreased with depth. In general, P O 4 3 in SIG was higher than in SIW before planting, and after harvest, the concentration of P O 4 3 decreased. After harvest, the P O 4 3 concentration in SIG showed a sharper drop (about 52%) in the first two layers, while in the bottom layer, the reduction was about 42%. In contrast, only a small P O 4 3 reduction after harvest was observed in the SIW soil layers where the drop was only up to 7% (Figure 8). The measured concentrations showed that wastewater contributed to conserve soil available P concentrations in SIW.
The total P concentration in SIG was higher than that in SIW. The levels did not change during the experimental period (Figure 9).

3.2.3. Available K + and Total K Content

K concentrations (mg/kg) were measured as K + and total K (Figure 10 and Figure 11). In general, SIG samples showed higher concentrations of available K than SIW (Figure 11). The amount of K + available in SIW increased, i.e., from 50 mg/kg in the top layer before planting to 116 mg/kg after harvest. The highest concentration of K + was found in the bottom layers (260 mg/kg). Similarly, for SIG, the K + available concentration increased after harvest to 627 mg/kg in the bottom layer.
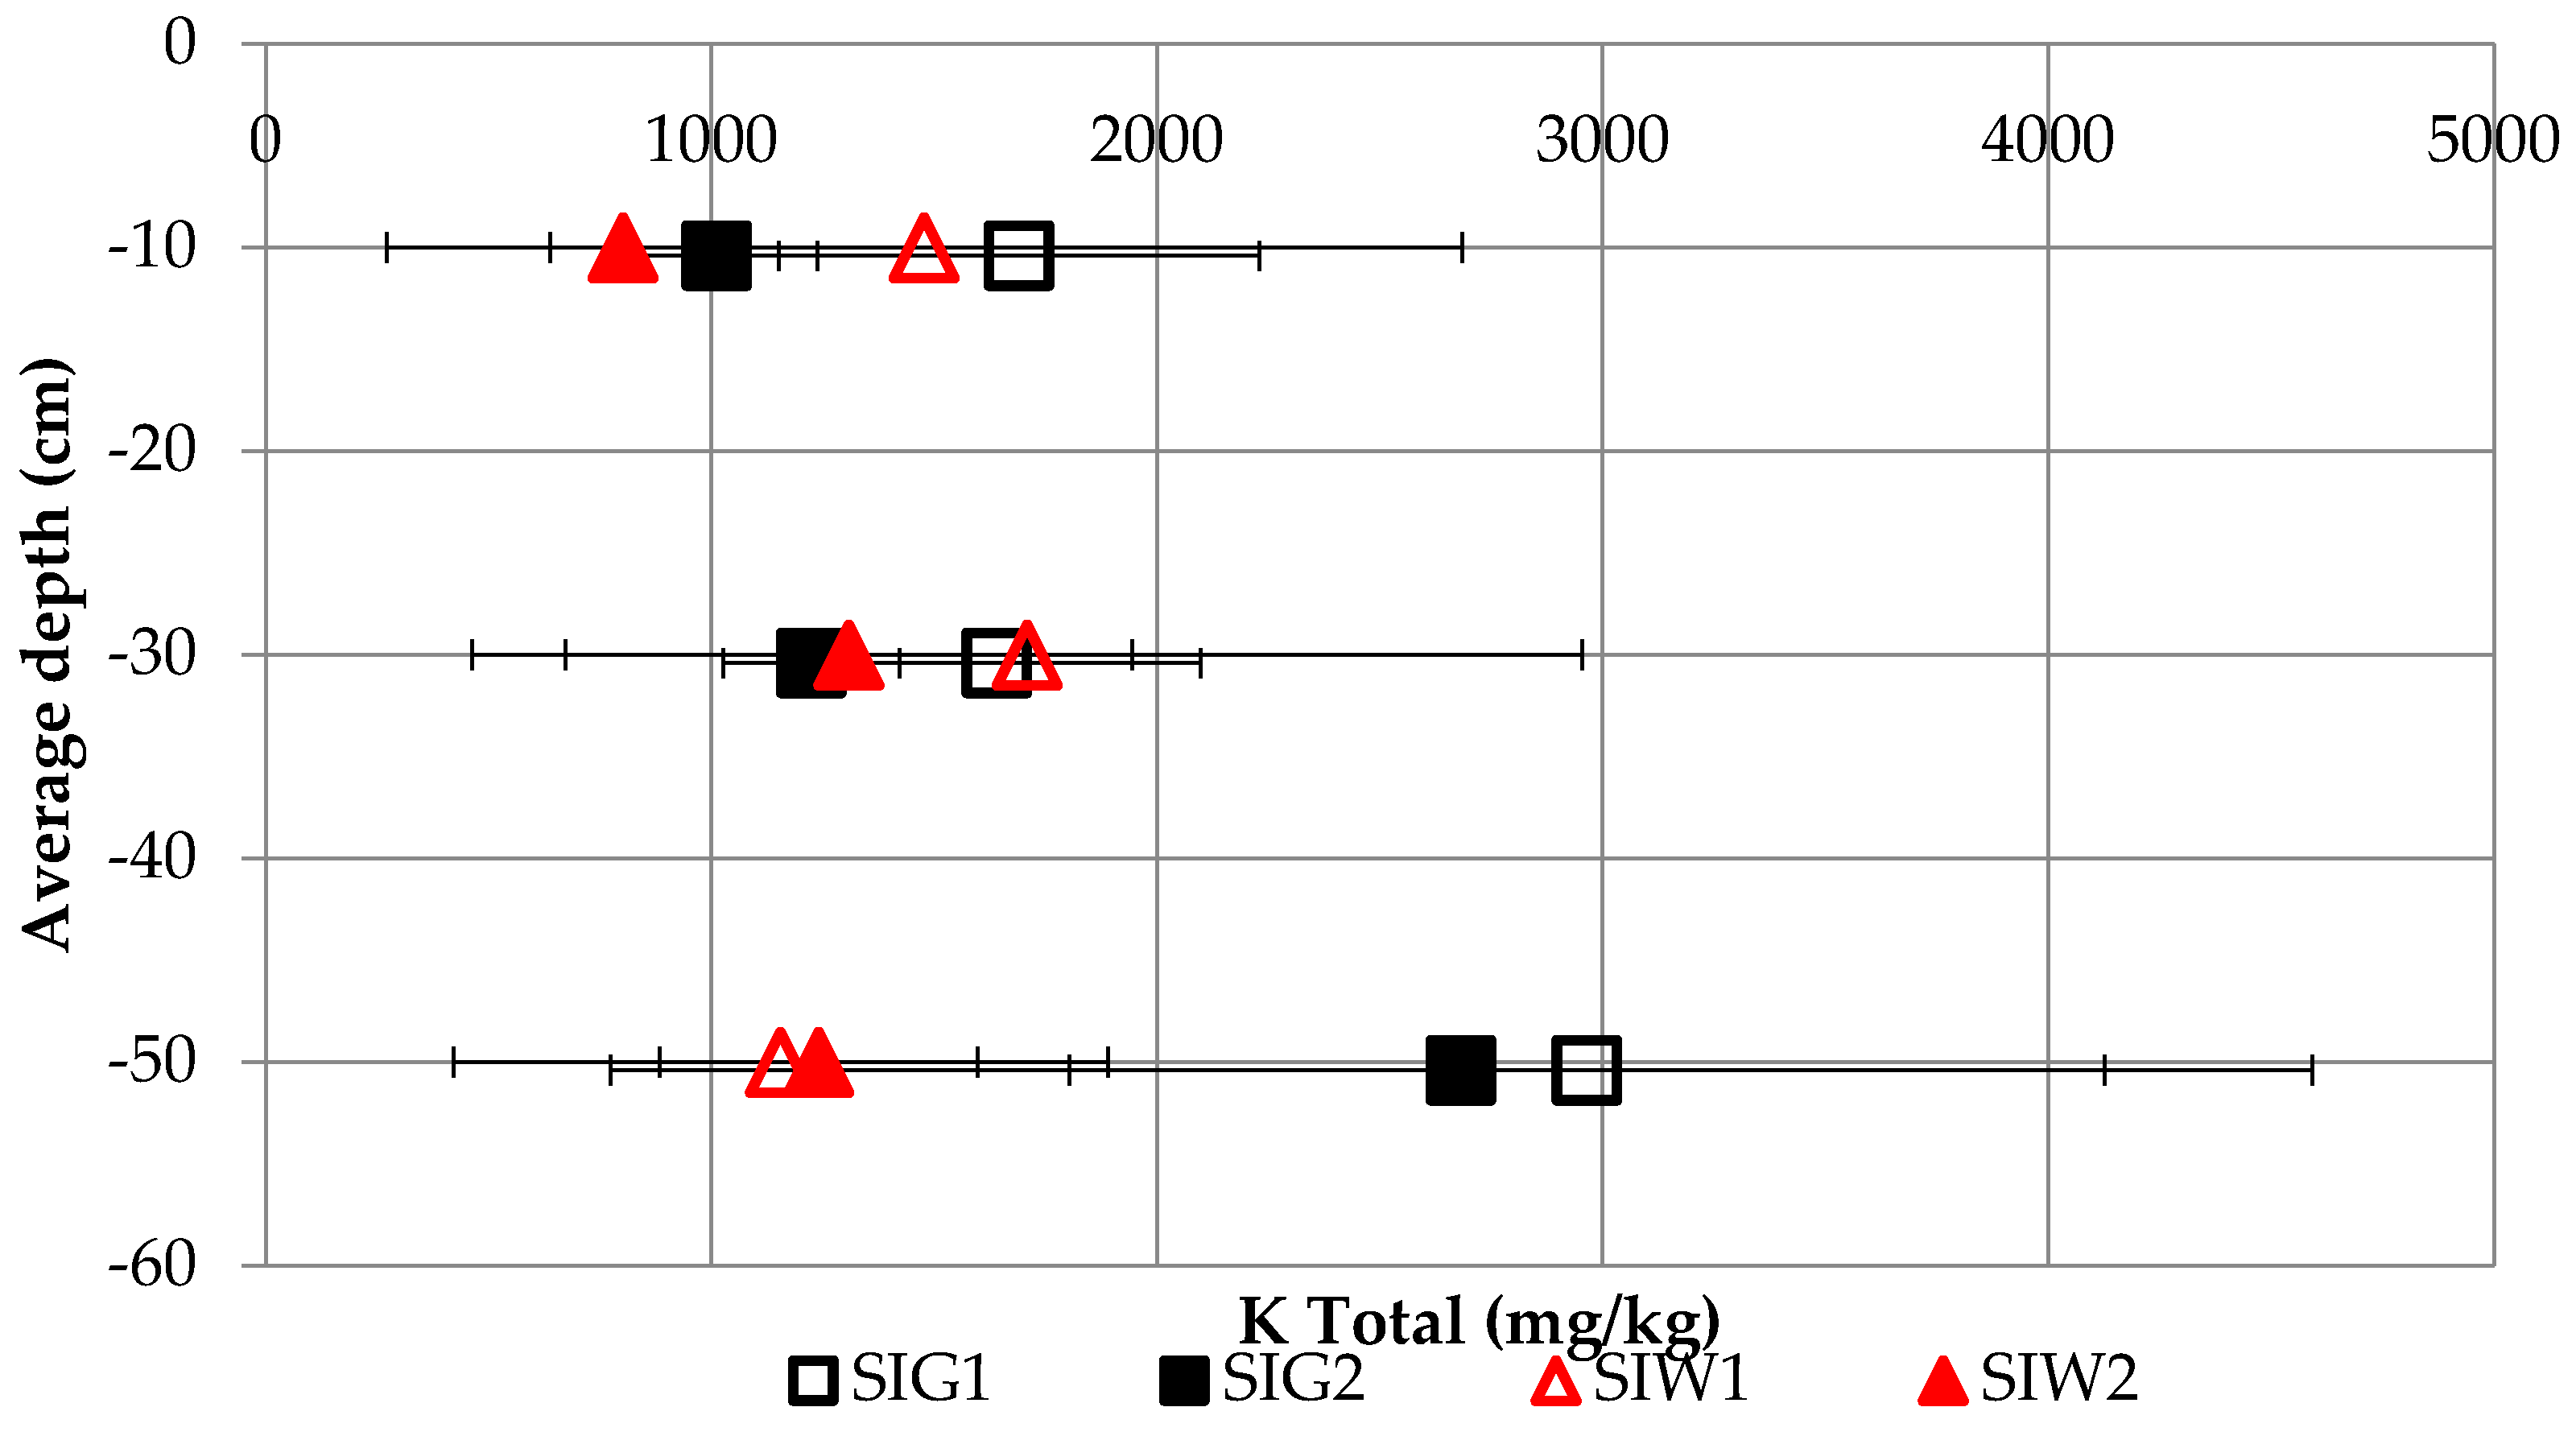
The concentrations of total K for SIG and SIW were at the same levels for the bottom layer before planting and after harvest, where the concentrations in SIG were higher than those in SIW. For both SIG and SIW, the total K concentrations in the bottom soil layer remained unchanged during the experimental period. A drop was observed in the top layer of both SIW and SIG (Figure 11).

3.3. Manure Composition, Lettuce Yield, and Nutrient Balances

The manure applied to the soils had a composition (g/kg) of N, P, and K in a ratio of 35.0:4.2:0.2 for wastewater-irrigated soils and 36.4:3.0:0.2 for groundwater-irrigated soils.
The lettuce yield (in tons/ha) in wastewater-irrigated areas was higher, i.e., 43.8 ± 16 tons/ha, compared to the groundwater-irrigated area, i.e., 35 ± 8 tons/ha. However, the variability in results was quite large, and an independent T-test showed that there were no significant differences in produce yield found between the areas irrigated with groundwater and wastewater (t(6) = 0.992, p > 0.05).
The nutrient balances assessed in wastewater- and groundwater-irrigated areas revealed that the nutrient contents in wastewater were distinctly higher than those in groundwater (Table 5). Wastewater served as an essential nutrient source due to its nutrient content contribution during the cropping season and contributed 88%, 96%, and 97% of N, P, and K to the total nutrient supply, respectively, while groundwater contributed 23%, 76%, and 75% of N, P and K supply, respectively. The remaining fraction of the nutrient supply was compensated by the farmers using manure as additional fertilizer (Table 5). Possibly, the supplied nutrients via irrigation water and manure might only be partly taken up by the plants, while the remainder leached to the underground. Nonetheless, the nutrient balances demonstrated that the soil nutrient content in the wastewater-irrigated areas, in most cases, was not depleted, in contrast to the groundwater-irrigated areas. The ratio of nutrient input in relation to the ‘required nutrient supply’ was 0.3 and 2.3 for N, 1.3 and 11.4 for P, and 0.5 and 4.9 for K, for groundwater and wastewater, respectively. Results presented in Table 5 showed that wastewater-irrigated areas had positive nutrient balances, which may have influenced reduced nutrient depletion in the soil. In contrast, the groundwater-irrigated areas exhibited an accentuated decline in nutrient contents, particularly for N O 3 , available P, total P, and available K (Figure 5, Figure 8, Figure 9 and Figure 10). Overall, negative balances were found for N, P, and K in groundwater-irrigated areas. These findings suggest that wastewater irrigation contributed to nutrient supply, while groundwater irrigation without the application of manure could lead to reduced nutrient content in the soil over time as this will lead to less pollution and flushing of nutrients underground. The amount of N uptake was higher than other nutrients, which was consistent with previous reports [48,49] on N, P, and K uptake, showing nutrient contents of 1.5%, 0.2%, and 1.0% in plant mass, respectively.

4. Discussion

These results from our research showed that the crop yield in WW-irrigated plots was somewhat higher than that with GW-irrigated plots. The observed differences between GW and WW were statistically insignificant. The average weight of lettuce in the wastewater site was consistently higher than that in the groundwater site, providing evidence that better yields may be attainable when wastewater is used for irrigation. Nevertheless, it is important to consider that various other factors could have influenced the outcomes observed. The observed crop yield may be related to the pH and CEC, which was verified in both WW- and GW-irrigated plots. It was found that both GW and WW irrigation increased the soil pH profile, particularly in the top layer, a result consistent with previous work [50]. This relatively high pH could have affected the negatively nutrient availability in both areas. Groundwater had a slightly higher pH than wastewater, with values ranging between 7.5–8.5 and 7–8, respectively. These values fall within the acceptable pH ranges of 6.5–8.5 for irrigation water [50]. In addition, the EC values in irrigation water indicated slight to moderate salinity levels of 0.7–3 dS/m, as classified by Sainju et al. [45]. These soil salinity levels imply the possibility of salt accumulation in the soil in the long term, which may limit crop productivity [51]. The relatively high pH may have affected the micronutrient availability, which was, however, not monitored in this study. It was also found that wastewater showed a higher nutrient content than groundwater, making wastewater a fertilizing agent of interest for these areas. The implication of higher nutrient content in WW than in GW is that soil stability in WW-irrigated crops will increase, making it more reliable for long-term crop cultivation, while positively influencing crop growth compared to GW-irrigated areas. With the agricultural use of wastewater being part of appropriate nutrient management in the Infulene Valley, fewer nutrients would be lost to the environment, reducing environmental pollution such as eutrophication in the rivers and coastal marine areas. The observed values for pH, average nitrate, and phosphate concentrations in wastewater were consistent with those found in previous studies in the same area [52]. However, for ammonia, the values differed, with higher averages in our study compared to previously reported [52].
In this study, the soils irrigated with wastewater had a lower nutrient content than those irrigated with groundwater. The reason for this is that farmers in the Infulene Valley use manure as a part of the nutrient supply, which also impacts crop nutrient availability (Table 5). Therefore, the nutrient supply in this study was not solely from the irrigation water but also from manure. The amount of nutrients, i.e., nitrogen and phosphorous, applied from manure and irrigation water during the period of study, in SIG was half the amount applied in SIW (Table 5), indicating variations in the nutrient supply in groundwater- and wastewater-irrigated plots. The manure composition used in these areas in the study was animal manure, which is often blended with other materials [19,53]. It can be argued that the long-term use of manure may increase the soil organic matter content and improve the soil quality, as observed in groundwater-irrigated soils.
Positive nutrient balances were found for wastewater-irrigated areas regarding all evaluated nutrients and negative balances were found in groundwater-irrigated areas for N, P, and K. These negative balances resulted from the difference between plant demand and the combined nutrient supply by irrigation water and manure. The balance revealed that the nutrient supply by water and manure might not satisfy the plant demand in groundwater-irrigated areas in the long term as demonstrated in Table 5. For SIW, there was a surplus of nutrients, which might have leached to the subsoil. The existing in-soil storage plays a role in explaining the changes after harvest for both areas. Before planting, the SIG samples had higher nutrient content than SIW. However, a nutrient reduction occurred after harvest in the soil layers irrigated with groundwater (SIG), i.e., N, available P and available K. After harvest, nutrient concentrations in SIW were lower than those in SIG in some layers, i.e., available P and total K for the bottom layer, available K for the top layer, and total P for all layers. Nonetheless, results showed an increase in nutrient content for N O 3 , N H 4 + , total N, available K, and total P in SIW. However, the nutrient content of available P remained unchanged, while the content of total K declined. The overall increase in nutrient content in the soil showed that the nutrient crop demand was not limited by nutrient supply in SIW. The positive nutrient balance in WW-irrigated sites is likely to have a significant impact on both the agricultural system productivity and the environment. In the long term, it may lead to a reduced need for supplementary nutrients through manure or fertilizers. For instance, the OM in WW is expected to improve soil structure and stability, thereby enhancing crop production, promoting better crop growth, and increasing yields over time. WW-irrigated areas require proper nutrient monitoring to reduce potential environmental pollution. The negative nutrient balance in GW-irrigated areas will likely be detrimental to the soil, leading to soil nutrient depletion, and negatively impacting crop production. Farmers will likely need the use of more supplementary nutrients, such as manure or fertilizers, resulting in increased expenses, and potentially higher market prices. In the long run, this could affect the sustainability of the production in GW areas of the Infulene Valley.
To the extent of this study, the soil condition in terms of N, P, and K concentration after harvest for SIW and SIG indicated the vital contribution of nutrients present in the wastewater in guaranteeing nutrient crop demand and soil nutrition in the area. In addition, it can be argued that the amount of nutrients present in manure contributed to the crop yield and soil condition after harvest for both groundwater- and wastewater-irrigated areas. However, the amounts of nutrients present in the wastewater, compared to crop demand, indicated that the use of manure in wastewater-irrigated areas might not be necessary. It was found that the N, P, and K content in the wastewater was 34, 15, and 14 times higher than in groundwater, respectively. These results clearly show that wastewater may be considered an additional source of crop nutrient supply, as previously suggested by other studies [50,53,54,55]. Therefore, using wastewater for irrigation purposes offers interesting perspectives for replenishing nutrients removed during crop production. Hence, wastewater might be considered of interest for ferti-irrigation to benefit crop growth and reduce fertilizer dependency [56]. Our findings corroborate with previous research [53,57], highlighting the potential role of wastewater in nutrient supply in peri-urban areas, where wastewater is frequently used for irrigation, which is the case for areas in the Infulene Valley. Moreover, in many parts of sub-Saharan Africa, lack of nutrient supply and fertilizers has been pointed as the cause for a low crop yield [28]. Therefore, wastewater can be considered a reliable source of nutrients for crop production. However, concerns about the use of wastewater for irrigation due to the presence of heavy metals and microbial contaminations must be considered. Precautions should be taken to ensure the safe use of this irrigation water in agriculture, such as adequate treatment, implementation of safe practices in the field and during the irrigation and selling. Consumers should also take advanced measures in the cleaning of products irrigated with wastewater.
This study highlights the advantages associated with the use of wastewater for irrigation, particularly in the context of lettuce cultivation. One notable advantage is the nutrient supply provided by wastewater, which significantly benefits plant growth. However, it is crucial to acknowledge the impact of initial soil conditions on crop yield. Since, in this study, the initial soil conditions in the wastewater site differed from those in the groundwater site, and this disparity likely played a role in achieving similar yields in both locations. Nevertheless, the wastewater site showed promising signs for better yields, as evidenced by the higher average weight of lettuce heads found there. To strengthen the validity of future studies and draw more conclusive results, we recommend standardizing soil conditions when comparing various irrigation methods. This practice will help researchers to better understand the true impact of nutrient-rich wastewater on crop production and ensure that their conclusions are based on more controlled and consistent variables.
In addition to the irrigation water, the application of manure as organic fertilizer may have also positively influenced the nutrient content in soil for both SIG and SIW. The balance calculations showed a potential disparity of nutrient supply and crop requirements when using wastewater for irrigation in the Infulene Valley, which was also found by Boom et al. [12] in Jordan. Nevertheless, the results clearly demonstrated that the nutrient content in wastewater is sufficient to supply the crop nutrients demand, likely leading to the observed better yields in WW-irrigated crops, as found, with the weight of lettuce heads varied 0.33–0.5 kg/head and 0.2–0.36 kg/ha in wastewater and groundwater irrigated areas, respectively.
It should be noted that manure also played a role in nutrient accumulation in both SIG and SIW while there is a surplus of nutrients supplied by wastewater, suggesting a possibility of nutrient accumulation in the soil. Results showed that initially (before planting), the analyzed soils (SIW) showed lower nutrient concentrations compared with the final soil condition (after harvest). Therefore, there is a need to properly manage the nutrient input from wastewater in the Infulene peri-urban area to prevent nutrient losses, affecting the environment and groundwater resources. Previous studies indicated the potential risk of nutrient losses, resulting from wastewater irrigation [29], albeit wastewater irrigation may be considered a viable option for nutrient supplementation in lettuce production in the Infulene Valley. Therefore, the implementation requires careful nutrient management to prevent environmental hazards resulting from excess nutrients dosing. A range of management options to prevent environmental problems and protect public health should be adopted. An example of such management option is combining source control with frequent water monitoring to aid decision making by managing the amount of nutrients supplied by irrigation water and manure [10,18]. Additionally, measures can be taken at wastewater treatment works, which are appropriate for the region, such as wetlands or decentralized treatment.

5. Conclusions

The findings of our study suggest that wastewater can be considered a viable alternative for nutrient supply in the Infulene Valley, Maputo. The analysis showed that wastewater contains higher amounts of essential nutrients (N, P, and K) compared to groundwater. Although soils irrigated with wastewater initially had lower nutrient content than those irrigated with groundwater, the wastewater-based nutrients compensated for the nutrient requirements for lettuce production and prevented nutrient depletion in the soils.
The relative contribution of groundwater and wastewater as nutrient sources varied significantly, and the research has demonstrated substantial disparities in nutrient contributions between wastewater and groundwater as irrigation sources for meeting crop requirements. Wastewater emerged as a potent supplier of essential nutrients, with relative values of nutrient input versus output, 2.3 for Nitrogen (N), 11.4 for Phosphorus (P), and 4.9 for Potassium (K). In contrast, groundwater exhibited significantly lower nutrient contributions, with relative values of nutrient input versus output 0.3 for N, 1.3 for P, and 0.5 for K. These findings underscore the critical role of wastewater in enhancing nutrient supply for agricultural purposes.
These results highlight the potential of wastewater as an effective source for re-plenishing nutrients in agricultural systems. Utilizing wastewater for irrigation purposes not only helps to meet crop nutrient demands but also reduces reliance on traditional fertilizers. However, careful nutrient management is crucial to avoid excessive nutrient dosing, which can lead to health and environmental hazards such as groundwater pollution, pollution of water ways, and soil degradation. Implementing strategies such as combined source control, frequent water monitoring, and appropriate treatment options can help for ferti-irrigation in peri-urban areas like the Infulene Valley.
Overall, this study provides valuable insights into the nutrient content of wastewater and impact on soil fertility and crop productivity. These findings have broader applications in various agricultural settings where wastewater is used for irrigation such as the importance of monitoring the amount of nutrient present in wastewater. To fully harness the benefits of wastewater irrigation while mitigating potential risks, further research on the long-term effects of wastewater irrigation and the implementation of appropriate nutrient management practices are essential. This research was conducted in real-world farmer field conditions to offer valuable insights into practical applications of water reclamation in the Infulene Valley. It is important to acknowledge that these field conditions often involve less control over variables, which can introduce increased variability into the results. Nevertheless, this approach allowed us to bridge the gap between controlled experiments and real-world scenarios, providing a more comprehensive perspective on the subject.

Author Contributions

Conceptualization: C.A.N.-J., A.M.A. and J.B.v.L.; Field and laboratorial work: C.A.N.-J.; Writing: C.A.N.-J.; Revisions: A.M.A. and J.B.v.L. All authors have read and agreed to the published version of the manuscript.

Funding

This research was funded by Netherlands Organisation for Scientific Research (NWO), grant number W 07.69.109.

Institutional Review Board Statement

Not applicable.

Data Availability Statement

The data that support the findings of this study are available from the corresponding authors upon reasonable request.

Acknowledgments

Authors acknowledge the Netherlands Organisation for Scientific Research (NWO) for funding this research.

Conflicts of Interest

The authors declare no conflict of interest.

References

  1. Zhang, Y.; Shen, Y. Wastewater irrigation: Past, present, and future. Wiley Interdiscip. Rev. Water 2019, 6, e1234. [Google Scholar] [CrossRef]
  2. Saidan, M.; Al-Addous, M.; Al-Weshah, R.; Obada, I.; Alkasrawi, M.; Barbana, N. Wastewater Reclamation in Major Jordanian Industries: A Viable Component of a Circular Economy. Water 2020, 12, 1276. [Google Scholar] [CrossRef]
  3. Ilahi, H.; Adnan, M.; ur Rehman, F.; Hidayat, K.; Amin, I.; Ullah, A.; Subhan, G.; Hussain, I.; Rehman, M.U.; Ullah, A. Waste Water Application: An Alternative Way to Reduce Water Scarcity Problem in Vegetables: A Review. Ind. J. Pure App. Biosci 2021, 9, 240–248. [Google Scholar] [CrossRef]
  4. Drechsel, P.; Keraita, B.; Amoah, P.; Abaidoo, R.C.; Raschid-Sally, L.; Bahri, A. Reducing health risks from wastewater use in urban and peri-urban sub-Saharan Africa: Applying the 2006 WHO guidelines. Water Sci. Technol. 2008, 57, 1461–1466. [Google Scholar] [CrossRef] [PubMed]
  5. Keraita, B.; Jimenez, B.; Drechsel, P. Extent and implications of agricultural reuse of untreated, partly treated and diluted wastewater in developing countries. CABI Rev. Perspect. Agric. Vet. Sci. Nutr. Nat. Resour. 2008, 3, 15. [Google Scholar] [CrossRef]
  6. Scheierling, S.M.; Bartone, C.R.; Mara, D.D.; Drechsel, P. Towards an agenda for improving wastewater use in agriculture. Water Int. 2011, 36, 420–440. [Google Scholar] [CrossRef]
  7. Niquice Janeiro, C.A.; Arsénio, A.M.; Brito, R.M.C.L.; van Lier, J.B. Use of (partially) treated municipal wastewater in irrigated agriculture; potentials and constraints for sub-Saharan Africa. Phys. Chem. Earth Parts A B C 2020, 119, 102906. [Google Scholar] [CrossRef]
  8. Poustie, A.; Yang, Y.; Verburg, P.; Pagilla, K.; Hanigan, D. Reclaimed wastewater as a viable water source for agricultural irrigation: A review of food crop growth inhibition and promotion in the context of environmental change. Sci. Total Environ. 2020, 739, 139756. [Google Scholar] [CrossRef] [PubMed]
  9. Adewumi, J.R.; Ilemobade, A.A.; Van Zyl, J.E. Treated wastewater reuse in South Africa: Overview, potential and challenges. Resour. Conserv. Recycl. 2010, 55, 221–231. [Google Scholar] [CrossRef]
  10. Qadir, M.; Wichelns, D.; Raschid-Sally, L.; McCornick, P.G.; Drechsel, P.; Bahri, A.; Minhas, P.S. The challenges of wastewater irrigation in developing countries. Agric. Water Manag. 2010, 97, 561–568. [Google Scholar] [CrossRef]
  11. Bedbabis, S.; Ben Rouina, B.; Boukhris, M.; Ferrara, G. Effect of irrigation with treated wastewater on soil chemical properties and infiltration rate. J. Environ. Manag. 2014, 133, 45–50. [Google Scholar] [CrossRef] [PubMed]
  12. Boom, S.; Huibers, F.P.; van Lier, J.B. Wastewater irrigation in Jordan: A mismatch in macro nutrient provision. Water Pract. Technol. 2008, 3, wpt2008042. [Google Scholar] [CrossRef]
  13. Chen, M.; Chen, J.; Sun, F. Estimating nutrient releases from agriculture in China: An extended substance flow analysis framework and a modeling tool. Sci. Total Environ. 2010, 408, 5123–5136. [Google Scholar] [CrossRef] [PubMed]
  14. Boberg, J.B.; Nasholm, T.; Finlay, R.D.; Stenlid, J.; Lindahl, B.D. Nitrogen availability affects saprotrophic basidiomycetes decomposing pine needles in a long term laboratory study. Fungal Ecol. 2011, 4, 408–416. [Google Scholar] [CrossRef]
  15. Woltersdorf, L.; Scheidegger, R.; Liehr, S.; Döll, P. Municipal water reuse for urban agriculture in Namibia: Modeling nutrient and salt flows as impacted by sanitation user behavior. J. Environ. Manag. 2016, 169, 272–284. [Google Scholar] [CrossRef]
  16. Khalil, A.H.P.S.; Hossain, M.S.; Rosamah, E.; Azli, N.A.; Saddon, N.; Davoudpoura, Y.; Islam, M.N.; Dungani, R. The role of soil properties and it’s interaction towards quality plant fiber: A review. Renew. Sustain. Energy Rev. 2015, 43, 1006–1015. [Google Scholar] [CrossRef]
  17. Mwangi, W.M. Low use of fertilizers and low productivity in sub-Saharan Africa. Nutr. Cycl. Agroecosyst. 1996, 47, 135–147. [Google Scholar] [CrossRef]
  18. Stewart, W.M.; Dibb, D.W.; Johnston, A.E.; Smyth, T.J. The contribution of commercial fertilizer nutrients to food production. Agron. J. 2005, 97, 1–6. [Google Scholar] [CrossRef]
  19. Joshi, H.C.; Joshi, B.; Guru, S.K.; Shankldhar, S.C.; Kumar, A.; Mahapatra, B.S.; Nautiyal, M.K.; Singh, P. Consequences of Integrated Use of Organic and Inorganic Fertilizers on Yield and Yield Elements of Rice. Int. J. Agric. Sci. Res. 2017, 7, 163–166. [Google Scholar]
  20. Waithaka, M.M.; Thornton, P.K.; Shepherd, K.D.; Ndiwa, N.N. Factors affecting the use of fertilizers and manure by smallholders: The case of Vihiga, western Kenya. Nutr. Cycl. Agroecosyst. 2007, 78, 211–224. [Google Scholar] [CrossRef]
  21. Mapila, M.A.T.J.; Njuki, J.; Delve, R.J.; Zingore, S.; Matibini, J. Determinants of fertiliser use by smallholder maize farmers in the Chinyanja Triangle in Malawi, Mozambique and Zambia. Agrekon 2012, 51, 21–41. [Google Scholar] [CrossRef]
  22. Benson, T.; Mogues, T. Constraints in the fertilizer supply chain: Evidence for fertilizer policy development from three African countries. Food Secur. 2018, 10, 1479–1500. [Google Scholar] [CrossRef]
  23. Cedrez, C.B.; Chamberlin, J.; Guo, Z.; Hijmans, R.J. Spatial variation in fertilizer prices in Sub-Saharan Africa. PLoS ONE 2020, 15, 1–20. [Google Scholar]
  24. Zavale, H.; Matchaya, G.; Vilissa, D.; Nhemachena, C.; Nhlengethwa, S.; Wilson, D. Dynamics of the fertilizer value chain in Mozambique. Sustainability 2020, 12, 4691. [Google Scholar] [CrossRef]
  25. Maria, R.; Americano, J.; Matusso, J.; Gundana, C. Optimizing Fertilizer Use within the Context of Integrated Soil Fertility Management in Mozambique. In Fertilizer Use Optimization in Sub-Saharan Africa; CABI GB: Wallingford, UK, 2017; pp. 125–135. [Google Scholar]
  26. Chikowo, R.; Zingore, S.; Snapp, S.; Johnston, A. Farm typologies, soil fertility variability and nutrient management in smallholder farming in Sub-Saharan Africa. Nutr. Cycl. Agroecosyst. 2014, 100, 1–18. [Google Scholar] [CrossRef]
  27. Vanlauwe, B.; Descheemaeker, K.; Giller, K.E.; Huising, J.; Merckx, R.; Nziguheba, G.; Wendt, J.; Zingore, S. Integrated soil fertility management in sub-Saharan Africa: Unravelling local adaptation. Soil 2015, 1, 491–508. [Google Scholar] [CrossRef]
  28. Vitousek, P.M.; Naylor, R.; Crews, T.; David, M.B.; Drinkwater, L.E.; Holland, E.; Johnes, P.J.; Katzenberger, J.; Martinelli, L.A.; Matson, P.A.; et al. Nutrient imbalances in agricultural development. Science 2009, 324, 1519–1520. [Google Scholar] [CrossRef]
  29. Werner, S.; Akoto-Danso, E.K.; Manka’abusi, D.; Steiner, C.; Haering, V.; Nyarko, G.; Buerkert, A.; Marschner, B. Nutrient balances with wastewater irrigation and biochar application in urban agriculture of Northern Ghana. Nutr. Cycl. Agroecosyst. 2019, 115, 249–262. [Google Scholar] [CrossRef]
  30. Nhapi, I.; Hoko, Z.; Siebel, M.A.; Gijzen, H.J. Assessment of the major water and nutrient flows in the Chivero catchment area, Zimbabwe. Phys. Chem. Earth 2002, 27, 783–792. [Google Scholar] [CrossRef]
  31. Rietveld, L.C.; Siri, J.G.; Chakravarty, I.; Arsénio, A.M.; Biswas, R.; Chatterjee, A. Improving health in cities through systems approaches for urban water management. Environ. Health A Glob. Access Sci. Source 2016, 15, 151–160. [Google Scholar] [CrossRef]
  32. Arsénio, A.M.; Salim, I.C.; Hu, M.; Matsinhe, N.P.; Scheidegger, R.; Rietveld, L. Mitigation potential of sanitation infrastructure on groundwater contamination by nitrate in Maputo. Sustainability 2018, 10, 858. [Google Scholar] [CrossRef]
  33. Sutton, B.G.; Merit, N. Maintenance of lettuce root zone at field capacity gives best yields with drip irrigation. Sci. Hortic. 1993, 56, 1–11. [Google Scholar] [CrossRef]
  34. Pansu, M.; Gautheyrou, J. Handbook of Soil Analysis: Mineralogical, Organic and Inorganic Methods; Springer: Berlin/Heidelberg, Germany; New York, NY, USA, 2006. [Google Scholar]
  35. Houba, V.; Van der Lee, J.; Novozamsky, I.; Walinga, I. Soil and Plant Analysis, a Series of Syllabi, Part 5, Soil Analysis Procedure; Wageningen Agricultural University: Wageningen, The Netherlands, 1989. [Google Scholar]
  36. Okalebo, J.R.; Gathua, K.W.; Woomer, P.L. Laboratory methods of soil and plant analysis: A working manual second edition. Sacred Afr. Nairobi 2002, 21, 25–26. [Google Scholar]
  37. Olsen, S.R.; Cole, C.V.; Watandbe, F.S.; Dean, L.A. Estimation of Available Phosphorus in Soil by Extraction with sodium Bicarbonate. J. Chem. Inf. Model. 1954, 53, 1689–1699. [Google Scholar]
  38. Zhou, B.; Chen, Y.; Zeng, L.; Cui, Y.; Li, J.; Tang, H.; Liu, J.; Tang, J. Soil nutrient deficiency decreases the postharvest quality-related metabolite contents of tea (Camellia sinensis (L.) Kuntze) leaves. Food Chem. 2022, 377, 132003. [Google Scholar] [CrossRef]
  39. Ramamoorthi, V.; Meena, S. Quantification of soil organic carbon-Comparison of wet oxidation and dry combustion methods. Int. J. Curr. Microbiol. Appl. Sci. 2018, 7, 146–154. [Google Scholar] [CrossRef]
  40. Razzaghi, F.; Arthur, E.; Moosavi, A.A. Evaluating models to estimate cation exchange capacity of calcareous soils. Geoderma 2021, 400, 115221. [Google Scholar] [CrossRef]
  41. Ramos, F.T.; Dores, E.F.G.d.C.; Weber, O.L.d.S.; Beber, D.C.; Campelo, J.H., Jr.; Maia, J.C.D.S. Soil organic matter doubles the cation exchange capacity of tropical soil under no-till farming in Brazil. J. Sci. Food Agric. 2018, 98, 3595–3602. [Google Scholar] [CrossRef]
  42. Schollenberger, C.J.; Dreibelbis, F.R. Analytical methods in base exchange investigations on soils. Soil Sci. 1930, 30, 161–174. [Google Scholar] [CrossRef]
  43. Walinga, I.; Van Der Lee, J.J.; Houba, V.J.G.; Van Vark, W.; Novozamsky, I. Digestion in Tubes with H2SO4-Salicylic Acid-H2O2 and Selenium and Determination of Ca, K., Mg, N., Na, P., Zn. In Plant Analysis Manual; Springer: Berlin/Heidelberg, Germany, 1995; pp. 7–45. [Google Scholar]
  44. Wieczorek, D.; Żyszka-Haberecht, B.; Kafka, A.; Lipok, J. Determination of phosphorus compounds in plant tissues: From colourimetry to advanced instrumental analytical chemistry. Plant Methods 2022, 18, 22. [Google Scholar] [CrossRef]
  45. Sainju, U.M. MethodsX Determination of nitrogen balance in agroecosystems. MethodsX 2017, 4, 199–208. [Google Scholar] [CrossRef] [PubMed]
  46. Nyaga, J.M.; Cramer, M.D.; Neff, J.C. Atmospheric nutrient deposition to the west coast of South Africa. Atmos. Environ. 2013, 81, 625–632. [Google Scholar] [CrossRef]
  47. Haileslassie, A.; Priess, J.; Veldkamp, E.; Teketay, D.; Lesschen, J.P. Assessment of soil nutrient depletion and its spatial variability on smallholders’ mixed farming systems in Ethiopia using partial versus full nutrient balances. Agric. Ecosyst. Environ. 2005, 108, 1–16. [Google Scholar] [CrossRef]
  48. Hawkesford, M.; Horst, W.; Kichey, T.; Lambers, H.; Schjoerring, J.; Møller, I.S.; White, P. Functions of Macronutrients; Elsevier Ltd.: Amsterdam, The Netherlands, 2011; pp. 135–189. [Google Scholar]
  49. Jiaying, M.; Tingting, C.; Jie, L.; Weimeng, F.; Baohua, F.; Guangyan, L.; Hubo, L.; Juncai, L.; Zhihai, W.; Longxing, T.; et al. Functions of Nitrogen, Phosphorus and Potassium in Energy Status and Their Influences on Rice Growth and Development. Rice Sci. 2022, 29, 166–178. [Google Scholar] [CrossRef]
  50. Elmeddahi, Y.; Mahmoudi, H.; Issaadi, A.; Goosen, M.F.A. Analysis of treated wastewater and feasibility for reuse in irrigation: A case study from Chlef, Algeria. Desalination Water Treat. 2016, 57, 5222–5231. [Google Scholar] [CrossRef]
  51. Ayers, R.S.; Westcot, D.W. Water Quality for Agriculture; Food and Agriculture Organization of the United Nations Rome: Rome, Italy, 1985; Volume 29, p. 9251022631. [Google Scholar]
  52. Gulamussen, N.J.; Arsénio, A.M.; Matsinhe, N.P.; Manjate, R.S.; Rietveld, L.C. Use of reclaimed water for unreinforced concrete block production for the self-construction of houses. J. Water Reuse Desalination 2021, 11, 690–704. [Google Scholar] [CrossRef]
  53. Khai, N.M.; Ha, P.Q.; Öborn, I. Nutrient flows in small-scale peri-urban vegetable farming systems in Southeast Asia-A case study in Hanoi. Agric. Ecosyst. Environ. 2007, 122, 192–202. [Google Scholar] [CrossRef]
  54. Brito, L.M.; Monteiro, J.M.; Mourão, I.; Coutinho, J.; Miguel, L.; Monteiro, J.M.; Mourão, I.; Coutinho, J.; Monteiro, M.; Mour, I.; et al. Organic Lettuce Growth And Nutrient Uptake Response To Lime, Compost And Rock Phosphate to lime, compost and rock phosphate. J. Plant Nutr. 2014, 37, 4167. [Google Scholar] [CrossRef]
  55. Rezapour, S.; Nouri, A.; Jalil, H.M.; Hawkins, S.A.; Lukas, S.B. Influence of Treated Wastewater Irrigation on Soil Nutritional-Chemical Attributes Using Soil Quality Index. Sustainability 2021, 13, 1952. [Google Scholar] [CrossRef]
  56. Chauhan, J.S.; Kumar, S. Wastewater ferti-irrigation: An eco-technology for sustainable agriculture. Sustain. Water Resour. Manag. 2020, 6, 31. [Google Scholar] [CrossRef]
  57. Qadir, M.; Drechsel, P.; Jiménez Cisneros, B.; Kim, Y.; Pramanik, A.; Mehta, P.; Olaniyan, O. Global and regional potential of wastewater as a water, nutrient and energy source. Nat. Resour. Forum 2020, 44, 40–51. [Google Scholar] [CrossRef]
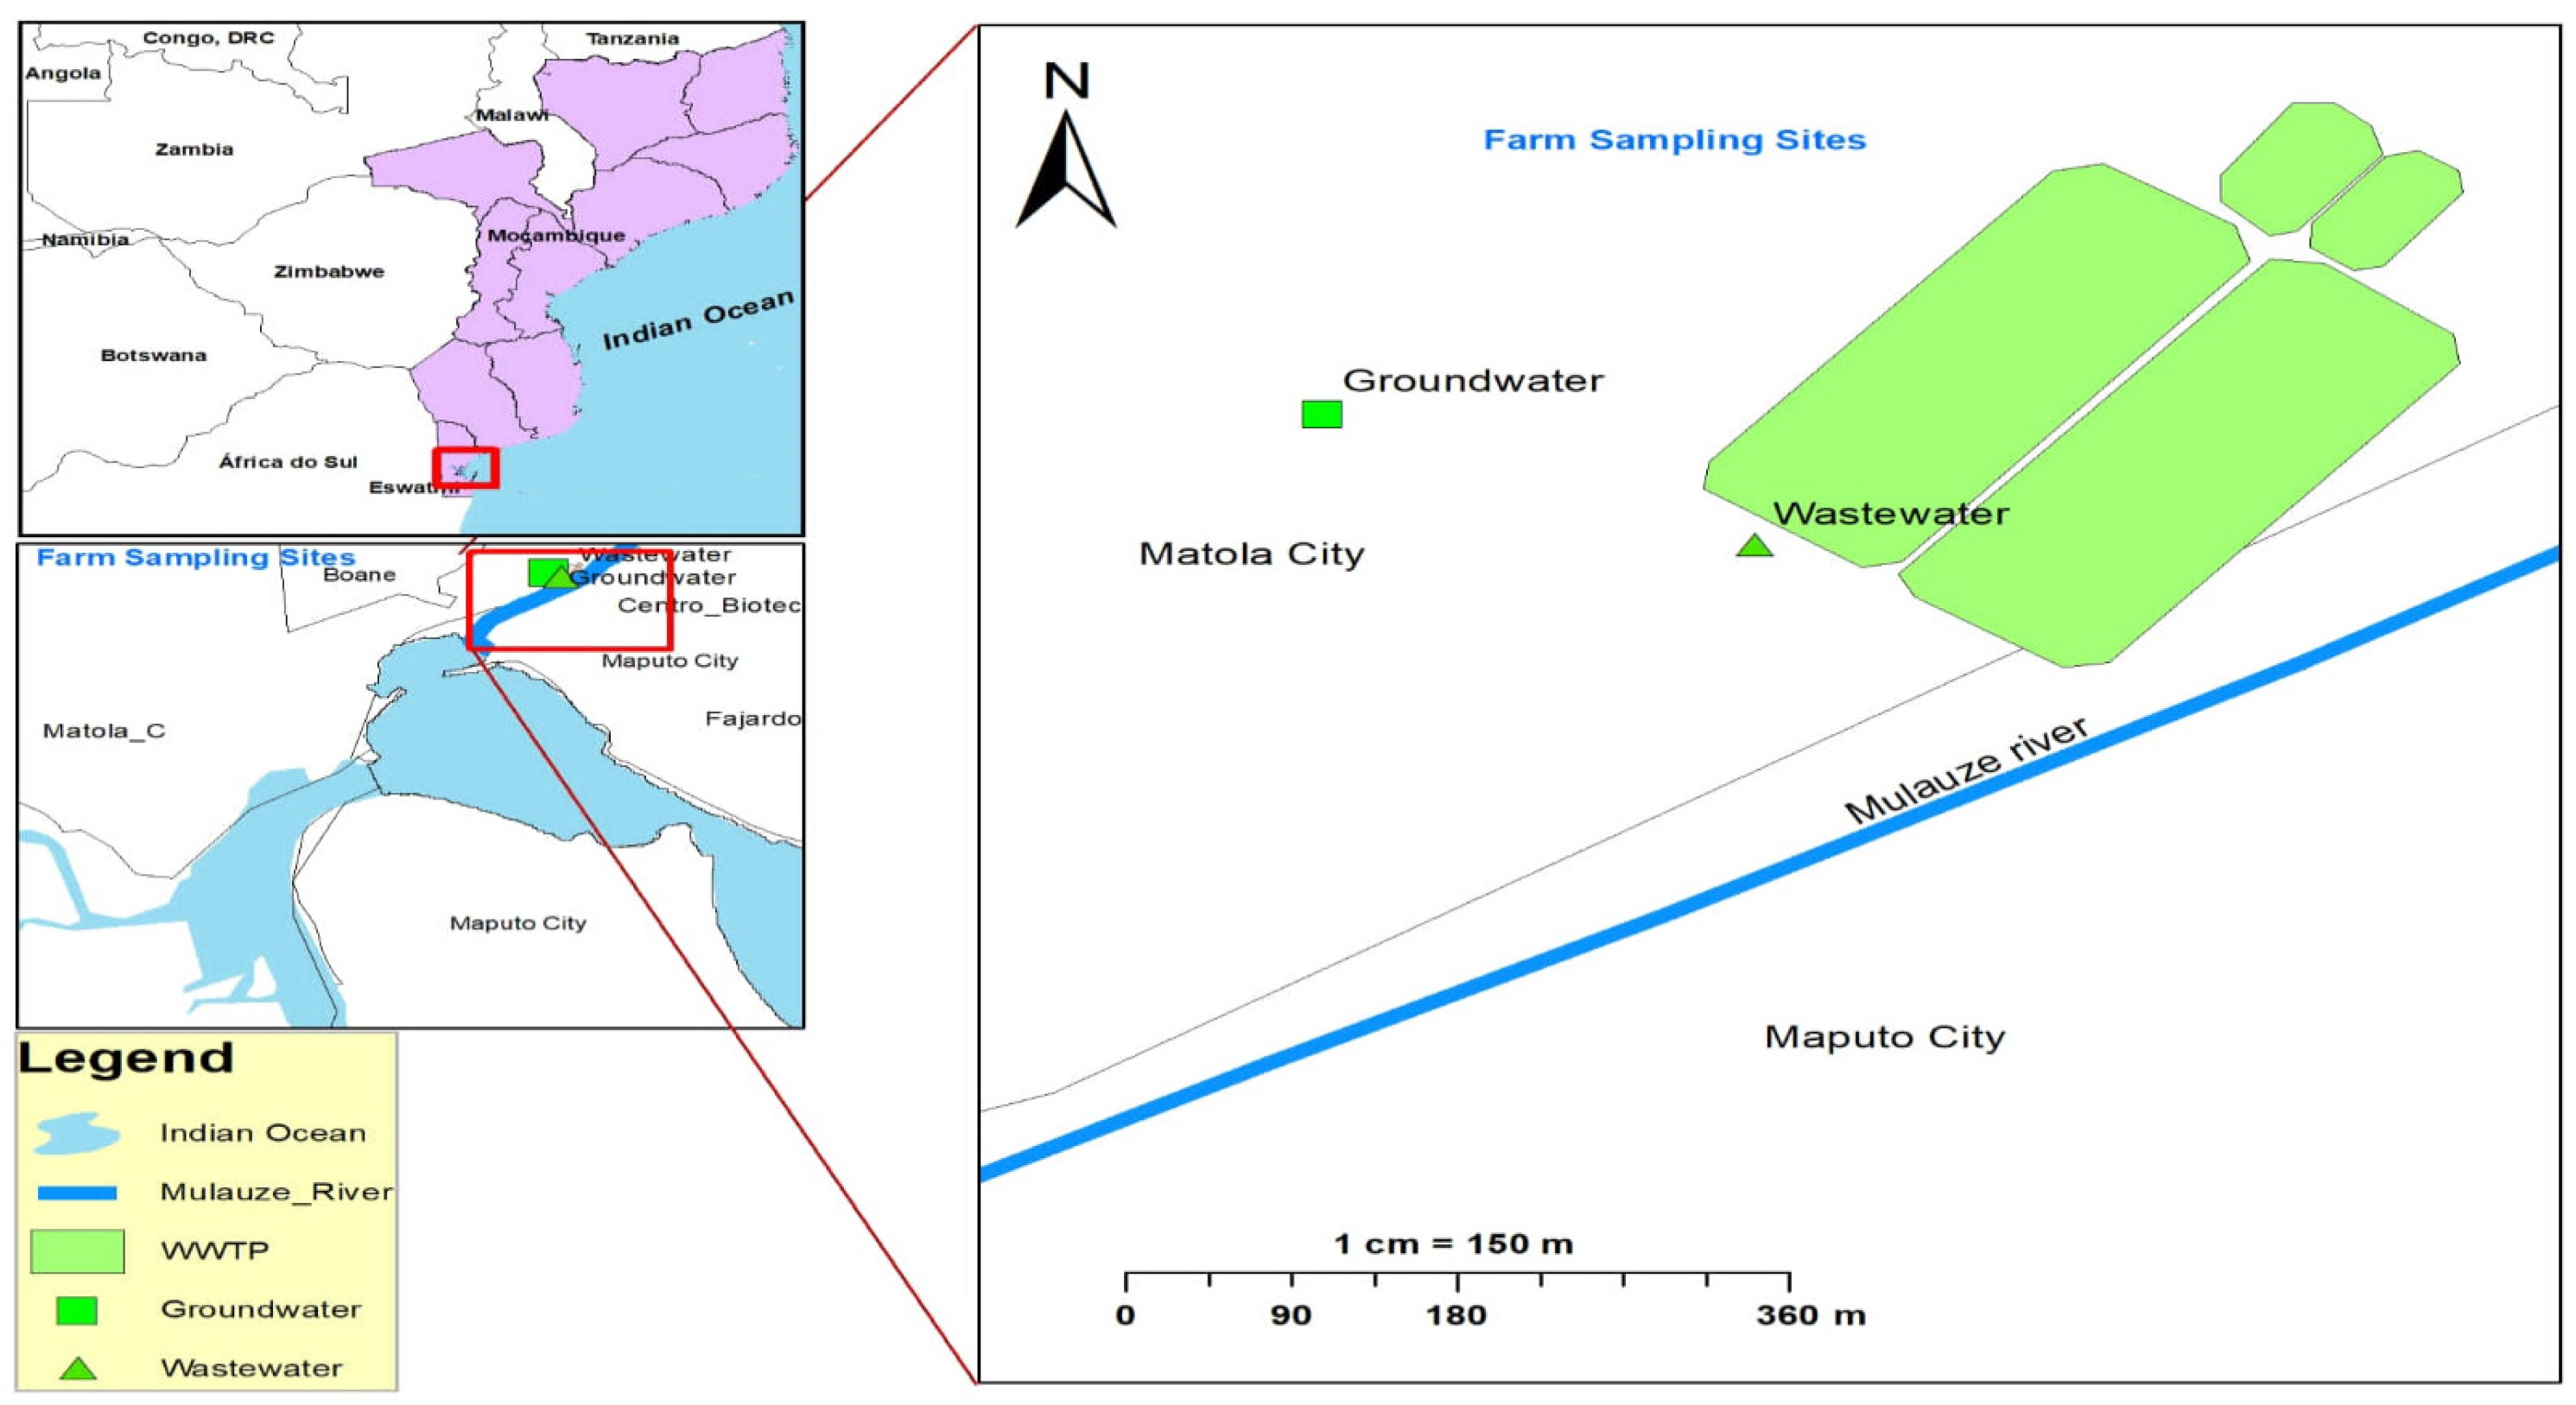
Figure 1. The experimental location for groundwater- and wastewater-irrigated areas in the Infulene Valley.
Agriculture 13 02158 g001
Figure 2. The electrical conductivity (EC) and pH value in groundwater (GW) and wastewater (WW) during the experimental period.
Agriculture 13 02158 g002
Figure 3. The electrical conductivity (dS/m) at different soil depths irrigated with groundwater (SIG) and wastewater (SIW) before planting (1) and after harvest (2).
Agriculture 13 02158 g003
Figure 4. pH values at different soil depths irrigated with groundwater (SIG) and wastewater (SIW) before planting (1) and after harvest (2).
Agriculture 13 02158 g004
Figure 5. The N O 3 concentration (mg/kg) in soils irrigated with wastewater (SIW) and groundwater (SIG) before planting (1) and after harvest (2).
Agriculture 13 02158 g005
Figure 6. The N H 4 + concentration (mg/kg) in soils irrigated with wastewater (SIW)- and groundwater (SIG)-irrigated soil before planting (1) and after harvest (2).
Agriculture 13 02158 g006
Figure 7. The total N concentration (g/kg) in soil irrigated with wastewater (SIW) and groundwater (SIG) before planting (1) and after harvest (2).
Agriculture 13 02158 g007
Figure 8. Available P O 4 3 concentration (mg/kg) in soil irrigated with wastewater (SIW) and groundwater (SIG), soil before planting (1) and after harvest (2).
Agriculture 13 02158 g008
Figure 9. The total P (mg/kg) in soil irrigated with wastewater (SIW) and groundwater (SIG), before planting (1) and after harvest (2).
Agriculture 13 02158 g009
Figure 10. Available K concentration (mg/kg) in soil irrigated with wastewater (SIW) and groundwater (SIG) before planting (1) and after harvest (2).
Agriculture 13 02158 g010
Figure 11. The total K concentration (mg/kg) in soil irrigated with wastewater (SIW) and groundwater (SIG) before planting (1) and after harvest (2).
Agriculture 13 02158 g011
Table 1. Nutrient estimation methods used in soil, water, manure, and lettuce analysis.
Nutrient FormsSoilPlants and ManureWater
Total NKjeldahl method [34,35,36]Kjeldahl method [34,35,36]Hach test kits (TNT 828) detection limit detection 20–100 mg/L( HACH LANGE GMBH, Düsseldorf, Germany)
N O 3 Extraction KCl (Minema Chemicals, Johanesburg, South Africa)and distillation and titration [36] Hach LCK 339 (0.23–13.5 mg/L NO3-N/1–60 mg/L NO3) ( HACH LANGE GMBH, Düsseldorf, Germany)
N H 4 + Extraction KCl (Minema Chemicals, Johanesburg, South Africa )and distillation and titration [36] Hach LCK 303 (2–47 mg/L NH4-N or 2.5–60 mg/L NH4) ( HACH LANGE GMBH, Düsseldorf, Germany)
Total PSpectrophotometer (digested with H2SO4 and salicylic acid, selenium, and hydrogen peroxide) supplied by Minema Chemicals, Johannesburg, South Africa) [34,35,36] Spectrophotometer (digested with H2SO4 and salicylic acid, selenium, and hydrogen peroxide) supplied by Minema Chemicals, Johannesburg, South Africa [34,35,36]
Available   P O 4 3 Olsen [37]-Hach TNT 845 (2–20 mg/L PO4-P or 6–60 mg/L PO4) (HACH LANGE GMBH, Düsseldorf, Germany)
Total KFlame photometric method (digested with H2SO4 and salicylic acid, selenium, and hydrogen peroxide) supplied by Minema Chemicals, Johanesburg, South Africa [34,35,36]Flame photometric method (digested with H2SO4 and salicylic acid, selenium, and hydrogen peroxide supplied by Minema Chemicals, Johannesburg, South Africa) [34,35,36]
Available K+Flame photometric method (Extraction method using ammonium acetate (Minema Chemicals, Johanesburg, South Africa) [36,38] Hach LCK 328 (8–50 mg/L K+) ( HACH LANGE GMBH, Düsseldorf, Germany)
Table 2. Concentration (mg/L) of nutrients present in groundwater and wastewater (partially treated wastewater at secondary stage) used for irrigation in Infulene.
Parameter Water Source
GroundwaterWastewater
N O 3 (mg/L)3.5 ± 5.3 *0.9 ± 0.2
N O 2 (mg/L)0.1 ± 0.10.4 ± 0.4
N H 4 + (mg/L)0.1 ± 0.2231.8 ± 150
Total N (mg/L)16.4 ± 19.1461.6 ± 279.5
K+ (mg/L)31.8 ± 5405.9 ± 130
P O 4 3 (mg/L)6.0 ± 2.981.1 ± 46.5
pH7.92 ± 0.257.40 ± 0.29
EC (dS/m)1.95 ± 0.691.84 ± 0.42
* N O 3 highly variable along the sampling weeks in groundwater.
Table 3. Texture in soils irrigated with wastewater (SIW) and groundwater (SIG).
Depth (cm)Soil Irrigated Wastewater (SIW)Soil Irrigated Groundwater (SIG)
Clay (%)Silt (%)Sand (%)Clay (%)Silt (%)Sand (%)
0–2016.3 ± 4.34.8 ± 3.078.9 ± 3.813.9 ± 4.36.3 ± 2.679.7 ± 4.7
20–4021.8 ± 10.26.7 ± 3.171.5 ± 9.415.1 ± 2.16.5 ± 2.878.4 ± 2.8
40–6017.5 ± 3.211.7 ± 3.270.9 ± 9.729.8 ± 17.912.2 ± 8.957.9 ± 23.3
Table 4. Organic matter (OM) content and cation exchange capacity (CEC) in soil irrigated with wastewater (SIW) and groundwater (SIG) before planting (BP) and after harvest (AH).
Irrigation SourceDepth (cm)% of OM ContentCEC (meq/100 g)
Before Planting After Harvestp Values (BP × AH)Before Planting After Harvestp Values (BP × AH)
WW0–200.8 ± 0.40.7 ± 0.20.827.5 ± 1.66.2 ± 1.30.01
20–400.6 ± 0.30.8 ± 0.80.459.7 ± 37.6 ± 2.60.01
40–600.8 ± 0.30.9 ± 0.90.688.6 ± 3.37.4 ± 1.70.22
GW0–201.9 ± 0.32.3 ± 0.30.0810.9 ± 1.210.7 ± 3.50.88
20–401.5 ± 0.42.1 ± 0.40.0212.1 ± 1.712.4 ± 1.50.47
40–602.1 ± 0.92.0 ± 0.50.6619.0 ± 11.420.7 ± 11.70.28
p values (SIW × SIG)
0–20<0.00<0.00 <0.000.00
20–40<0.00<0.00 0.07<0.00
40–60<0.000.01 0.370.02
Table 5. Nutrient balances in wastewater (WW)- and groundwater (GW)-irrigated areas for lettuce production.
Irrigation Source N_Inflow (kg/ha)N_Uptake (kg/ha)RatioBalance (kg/ha)
Water Manure
GW151.54971973.60.3−1324.4
WW5086.0714.12571.22.33229.6
P_Inflow (kg/ha)P_Uptake (kg/ha)RatioBalance (kg/ha)
WaterManure
GW64.920.766.21.319.4
WW981.64390.011.4934.6
K_Inflow (kg/ha)K_Uptake (kg/ha)RatioBalance (kg/ha)
WaterManure
GW342.6113.2970.90.5−515.1
WW4910.6163.21038.74.94035.1
Disclaimer/Publisher’s Note: The statements, opinions and data contained in all publications are solely those of the individual author(s) and contributor(s) and not of MDPI and/or the editor(s). MDPI and/or the editor(s) disclaim responsibility for any injury to people or property resulting from any ideas, methods, instructions or products referred to in the content.