Article

Intelligent Hog Farming Adoption Choices Using the Unified Theory of Acceptance and Use of Technology Model: Perspectives from China’s New Agricultural Managers

1
College of Economics and Management, South China Agricultural University, Guangzhou 510642, China
2
School of Insurance, Guangdong University of Finance, Guangzhou 510521, China
*
Author to whom correspondence should be addressed.
Agriculture 2023, 13(11), 2067; https://doi.org/10.3390/agriculture13112067
Submission received: 30 August 2023 / Revised: 22 October 2023 / Accepted: 25 October 2023 / Published: 27 October 2023
(This article belongs to the Special Issue Farm Entrepreneurship and Agribusiness Management)

Abstract

:
This research delves into the intricacies of decision-making processes underpinning the willingness to upgrade technology within the burgeoning domain of intelligent pig farming in China, employing the UTAUT model to scrutinize how various determinants sway upgrade willingness and the ensuing behavioral modification. By applying the UTAUT model to intelligent pig farming, the inquiry evaluates the impact of performance expectations, effort expectations, social influence, and contributory factors on upgrade willingness and behavior, with data amassed from assorted novel agricultural management entities in China. The findings unveil that performance and effort expectations, social influence, and contributory factors have a favorable influence on upgrade willingness, while contributory factors, alongside the augmentation of upgrade willingness, positively affect upgraded behavior. This inquiry underscores the multifaceted interaction of factors guiding technological upgrade verdicts in intelligent pig farming, furnishing invaluable insights for comprehending technology adoption in agriculture. It lays a groundwork for devising strategies to spur technological advancements, harboring potential for wider applications across varied agricultural vistas.

1. Introduction

After more than a decade of robust growth, China’s hog farming industry has solidified a commanding position on the global stage [1]. However, the sector faces numerous challenges, including inconsistent standards, low automation, and pressing environmental concerns such as waste management [2,3,4]. Smart farming represents a shift in agricultural practice, where traditional methods are augmented or replaced by advanced technologies, such as the Internet of Things (IoT), Big Data analytics, and Artificial Intelligence (AI) [5,6,7]. These technologies enable real-time monitoring, data-driven decision making, and automated operations, thereby increasing efficiency, reducing costs, and minimizing environmental impact [8,9,10]. The adoption of smart farming technologies has the potential to address various challenges.
Smart farming represents a modern approach to agriculture, melding technology with traditional farming practices to optimize productivity and sustainability [11,12]. At its core, smart farming leverages a suite of advanced technologies encompassing the IoT, drones, robotics, machinery, and AI [13,14]. These technologies are instrumental in managing farms, plantations, and all associated farming activities with the overarching aim of achieving predictable farm output [15]. 
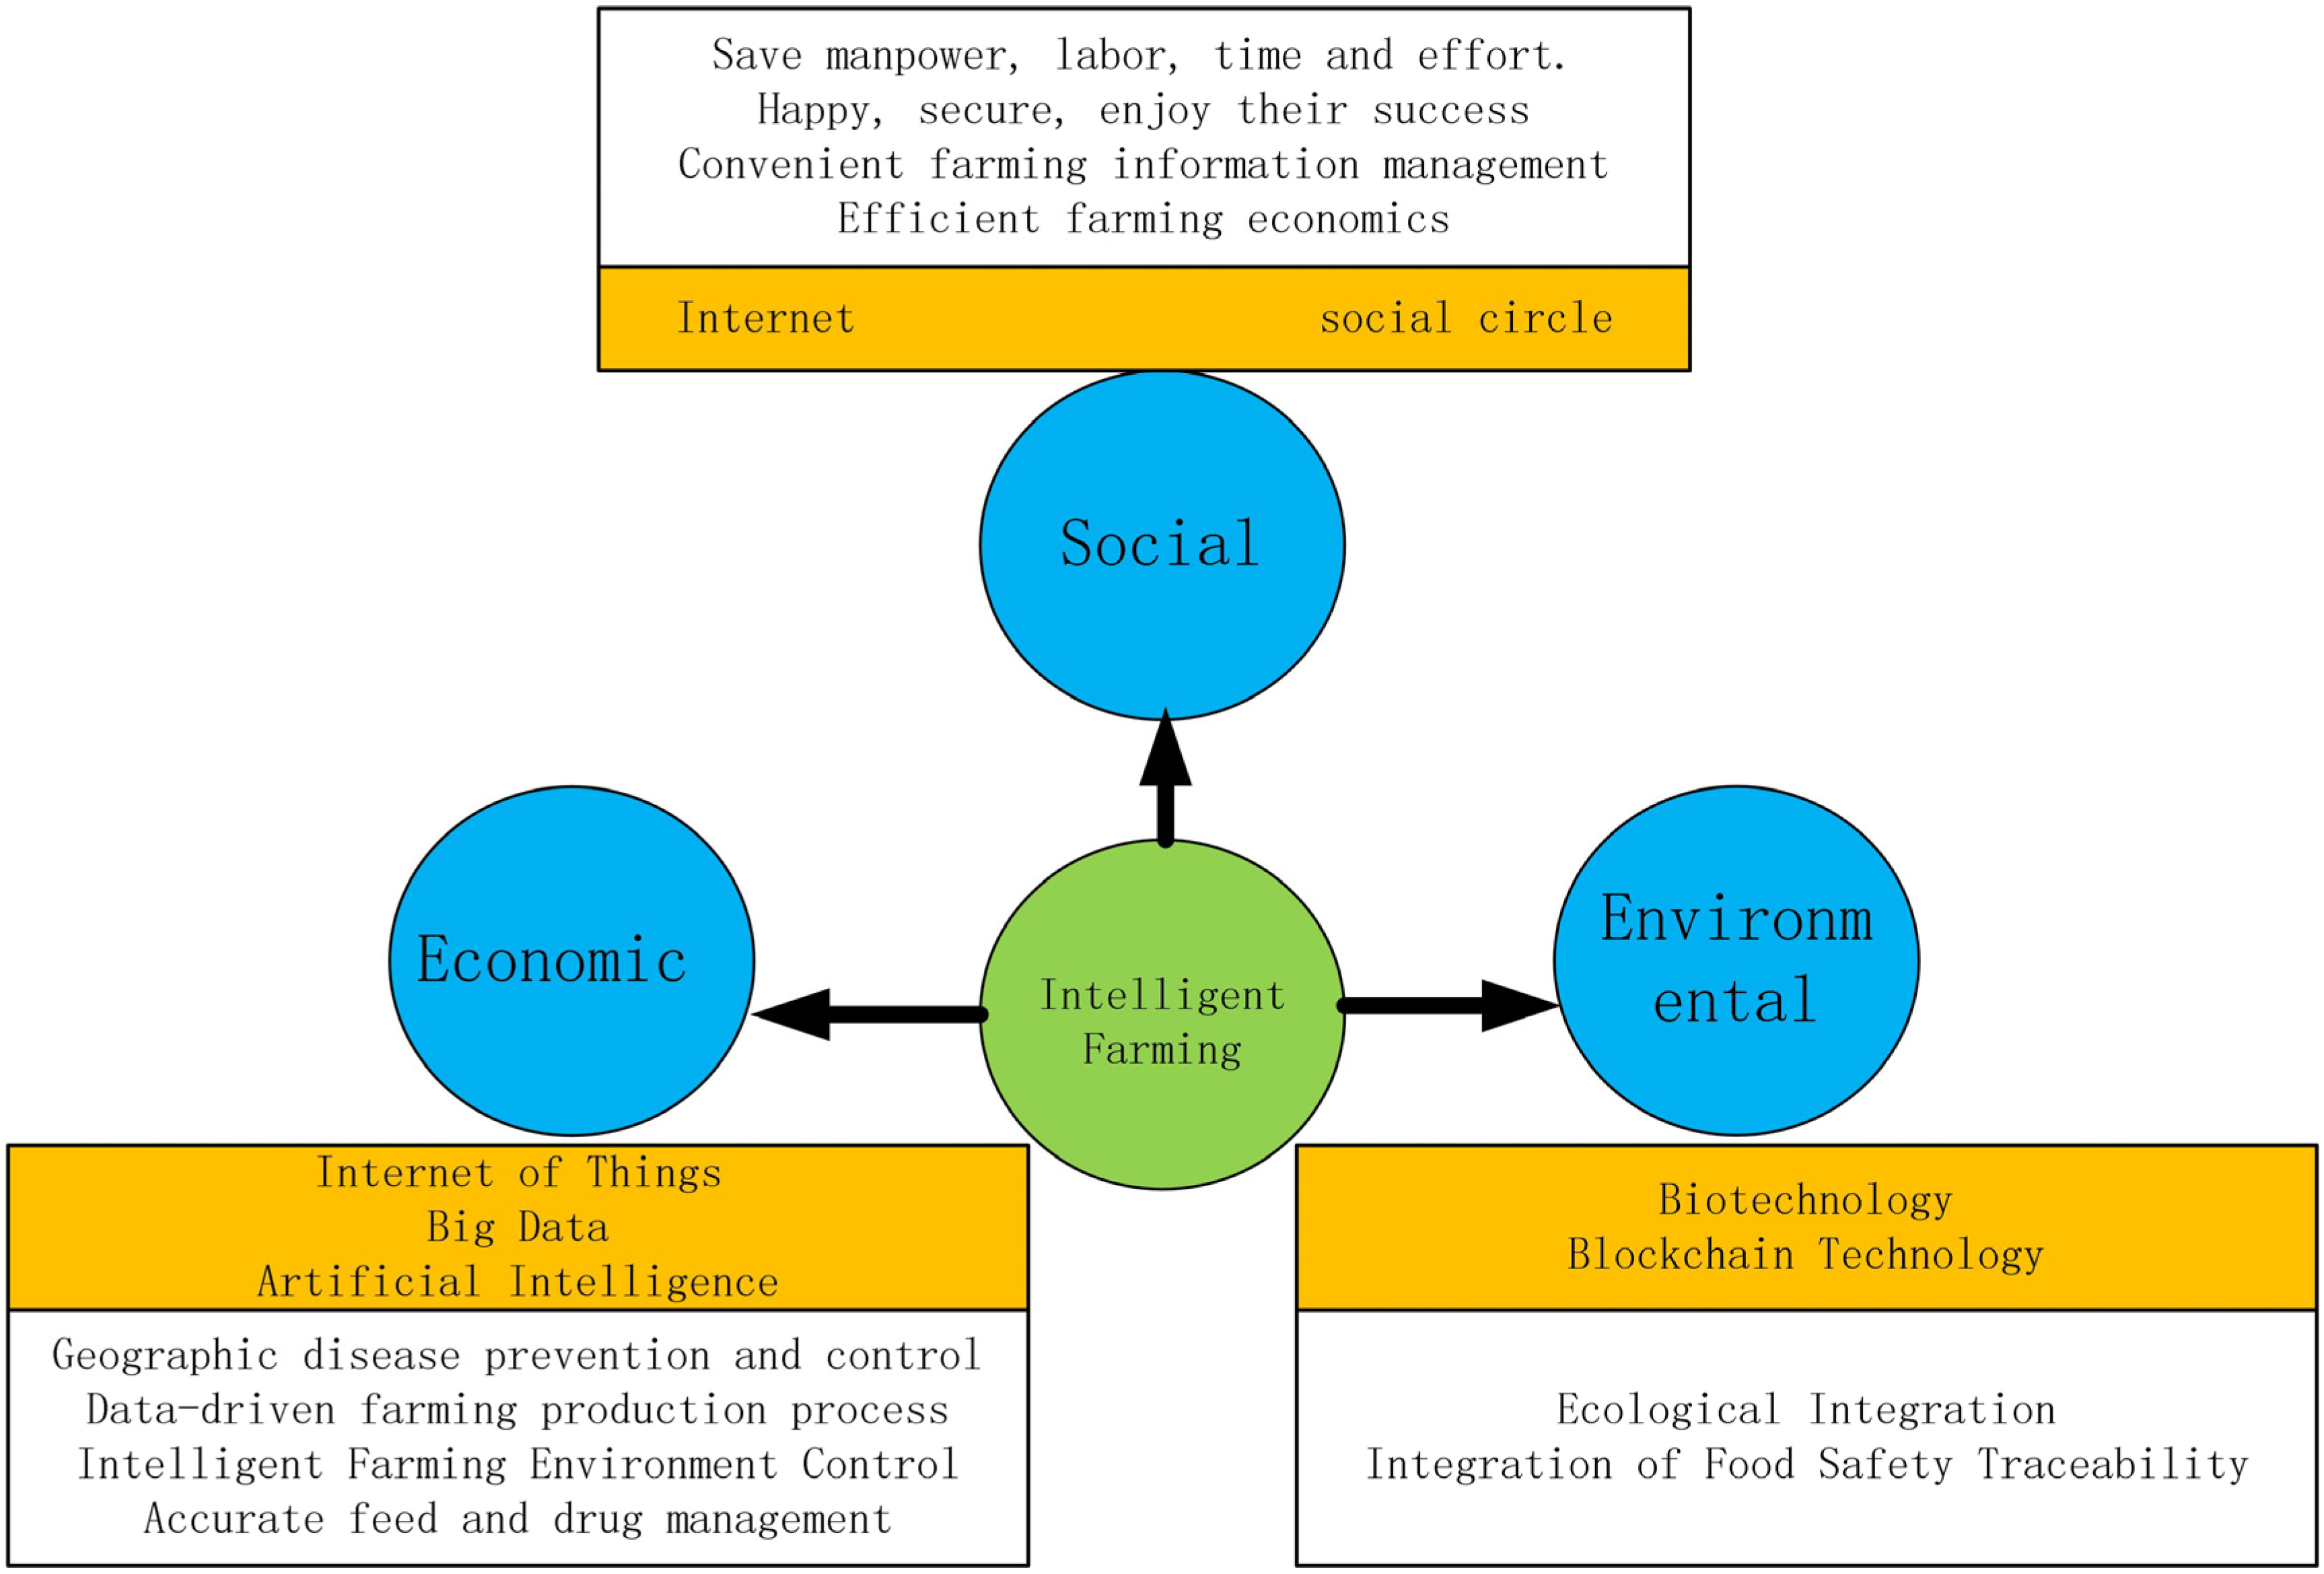
Figure 1 shows the integration of the Three Pillars of Sustainability—Economic, Social, and Environmental—with smart farming technologies. Economic aspects focus on productivity and efficiency through IoT, Big Data, and AI [16,17]. Social aspects aim to improve quality of life via labor-saving tech and community-building platforms [18,19]. Environmental aspects prioritize planet-friendly practices using Biotechnology, Blockchain, and Ecological Integration [20,21]. Overall, smart farming technologies enhance sustainability in agriculture.
Our research specifically aims to provide actionable policy recommendations to foster sustainable development and technological upgrades. These changes will enhance both the economic efficiency and environmental sustainability of the hog farming industry in China. The Unified Theory of Acceptance and Use of Technology (UTAUT) serves as a valuable theoretical framework for exploring technology adoption in the industry, guiding enterprises towards efficiency and quality in large-scale operations [22,23]. It advocates for the adoption of user-friendly, intuitive technologies that align with the skill sets of professional farmers, thus facilitating large-scale adoption and market competitiveness [24,25,26]. Intelligent hog farming incorporates advanced technologies to improve various aspects of the industry. These include environmental monitoring, nutrition and feeding management, disease prevention, and full-chain traceability [27,28,29]. Such technologies contribute to enhanced productivity, cost reduction, and ecological balance [30,31]. In addition, they resonate with broader sustainable development goals [32,33].
In the evolving context of China’s hog farming industry, the UTAUT model serves as a critical framework for understanding the multifaceted dynamics of technology adoption and operational efficiency. This model is aligned with broader objectives, such as rural development and the modernization of agriculture [34]. Adapted for diverse business configurations—encompassing large professional households, family farms, and professional farmers’ cooperatives—the UTAUT model offers a comprehensive approach [35,36,37]. 
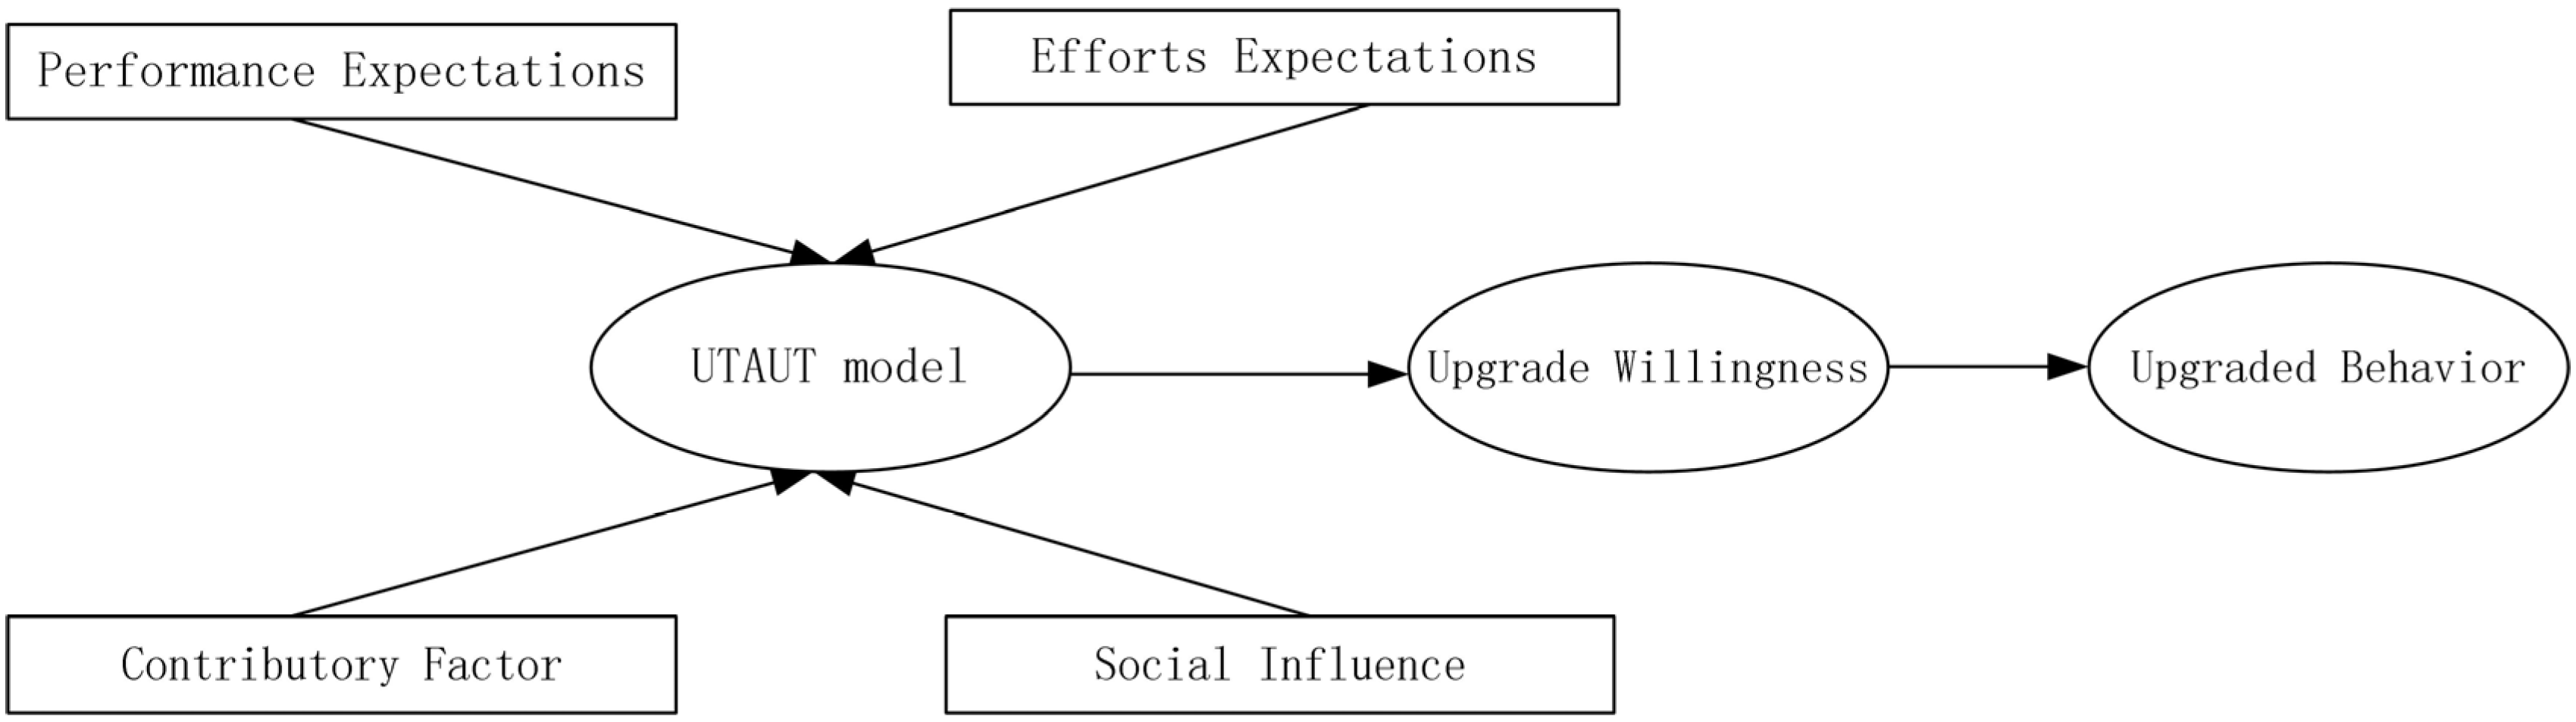
Figure 2 encapsulates the research concept of utilizing the UTAUT model to refine the strategic approach to intelligent hog farming. It focuses on three core constructs: performance expectations, effort expectations, and social influence [38,39,40]. Performance expectations guide enterprises toward achieving operational efficiency and quality and are synergistic with industry trends toward scaling and competitiveness [41,42,43]. Effort expectations advocate for the integration of intuitive, user-friendly technologies, thus facilitating greater adoption rates among professional farmers [44,45,46]. Social influence incorporates community networking and peer-driven success as catalysts for technology uptake across the industry [47,48,49].
Given the pressing challenges faced by China’s hog farming industry, the insights gained from applying the UTAUT model to understand the adoption of these smart farming technologies could prove invaluable. Not only could they lead to more consistent standards and increased automation, but they may also address critical environmental concerns [50,51]. Thus, the adoption of smart farming, guided by the UTAUT model, presents an opportunity to modernize and sustainably grow this vital sector.

2. Data and Methods

2.1. Data

The insights and characteristics described in this report were obtained through a comprehensive research approach. A total of 200 questionnaires were distributed to managers and key personnel of New Agricultural Entities involved in pig farming in China. Out of these, 184 were returned, marking a high return rate of 92%. New Agricultural Entities in China’s pig farming typically operate on a large scale. With economies of scale, these entities lower average costs, thereby enhancing profitability. Managers in these entities are responsible for daily operations, strategic planning, and long-term objectives. They generally have strong backgrounds in agricultural sciences, business management, and technology. They handle a broad spectrum of responsibilities, including financial planning, human resources, technological adoption, and market strategy, aligning with the multifaceted objectives of the New Agricultural Entities they manage.
These questionnaires were complemented by offline research methods that included face-to-face interviews. This research was funded by the General Project of Social Science Planning Fund of Guangdong Province and the Special Fund Project of Guangdong Provincial Finance, adding to the credibility and scope of the data collected. The samples selected were drawn from random samples taken in the course of conducting research with the Fund. Table 1 provides the features of the sample. “Technologically Savvy” features a mean score of 2.994 with a standard deviation of 0.714. The majority of the sample lies in the “Moderate tech integration” category, making up 29.89% of respondents. The data shows a moderate degree of dispersion, indicated by the standard deviation, suggesting varied levels of technological understanding among managers. In the “Business-Oriented” category, the mean score is 3.217, and the standard deviation is 0.685. A significant 30.43% of respondents fall under “Good but not optimized”. The data show moderate variability in business orientation among the sample, as indicated by the standard deviation. For “Environmentally Conscious”, the mean score stands at 3.065 with a standard deviation of 0.612. The most populated category is “Moderate sustainability”, capturing 36.96% of respondents. The lower standard deviation indicates a tighter clustering of responses, suggesting that the sample generally leans towards being environmentally conscious. The “Adaptive & Flexible” category exhibits the highest mean score of 3.331 and the lowest standard deviation of 0.558. A majority, 41.85%, are categorized as “Generally adaptable”. The low standard deviation indicates a higher level of agreement or consensus among respondents in this feature, suggesting that adaptability is a strong characteristic among the sample.
A 92% questionnaire return rate enhances data validity, likely reflecting the broader manager population in China’s New Agricultural Entities. The mixed-method approach, combining questionnaires with interviews, strengthens data reliability and yields nuanced insights. Funding from reputable organizations adds credibility. Random sampling mitigates selection bias, enhancing generalizability. Variability in key features like technological savvy and business orientation, as indicated by standard deviations in Table 1, ensures sample representativeness. Low standard deviation in traits like adaptability suggests consensus, further corroborating the study’s reliability. Overall, the sample is both robust and directly aligned with the research objectives, affirming its suitability.

2.2. Variable

In this study, the research variables were measured using a 5-point Likert scale, a quantitative survey instrument commonly found in social science research. This scale is used to gauge respondents’ attitudes or feelings toward a specific issue or statement by assigning values to abstract concepts and transforming them into concrete numerical expressions. Within the context of this research, the scale is defined with 1 meaning “strongly disagree” and 5 representing “strongly agree”. By quantifying these subjective responses, the Likert scale enables further analysis and interpretation using structural equation modeling (SEM), thereby providing a robust mechanism to translate complex human emotions and opinions into actionable data, supporting the study’s broader analytical goals.

2.2.1. Outcome Variables

Upgraded Behavior. Outcome variables encompass escalation behavior, and Table 2 elucidates the questions specifically designed to explore this aspect. The focus of these questions lies in unraveling the actual behavior and experiences of new agricultural business entities engaged in the upgrading of smart hog farming technology. Respondents were interrogated regarding their adoption of smart technology within the past year and were then prompted to provide insights into the specific impacts of this upgrade. This includes aspects such as the complexity of day-to-day operations, pig health, and growth improvement, as well as potential new challenges or problems that may have arisen as a result of the technological upgrade. The queries also probed whether respondents had plans to further invest in or enhance smart farming technology. By delving into the real-world effects and challenges of upgrading from a multifaceted viewpoint, this questionnaire not only offers a comprehensive panorama of actual upgrading experiences but also sheds light on the genuine status of implementation. It serves as an indispensable tool in identifying potential directions for optimization, thereby forming a crucial component in understanding the dynamics of smart farming technology in the context of new agricultural enterprises.

2.2.2. Conditional Variables

Table 3 focuses on willingness to upgrade intelligent pig farming technology, assessed using a five-point Likert scale. This questionnaire examines factors like upgrade timelines, anticipated benefits, market demands, potential barriers, and collaboration readiness. Specific questions target perceptions on market trends (UW1), concerns about technical support and training (UW2), and openness to collaboration with governmental or private institutions (UW3). The dataset provides valuable insights into the complex motivations and constraints affecting technology upgrading decisions among new agricultural business entities. The collected information serves as both an analytical tool and a strategic guide for implementation, enriching the decision-making context in intelligent agriculture.
The questionnaire outlined in Table 4 employs a five-point Likert scale to assess new agricultural operators’ performance expectations for smart farming upgrades. Each question offers respondents five options to indicate their level of agreement or disagreement, typically ranging from “Strongly Disagree” to “Strongly Agree”. This scale allows for a nuanced evaluation of various dimensions, such as efficiency, quality, cost, competitiveness, and sustainability. Respondents’ choices across the scale provide insights into their anticipations and concerns, thereby facilitating a comprehensive analysis of their needs and objectives.
The questionnaire in Table 5 utilizes a five-point Likert scale to assess respondents’ effort expectations associated with transitioning to smart farming. Each item on the scale provides a range of responses from “Strongly Disagree” to “Strongly Agree”, enabling a granular evaluation of anticipated effort, challenges, and complexities. Topics include perceived difficulty and barriers in technology adoption, expectations for skill mastery, concerns about operational complexity, and the need for technical support. This structure allows for a thorough analysis of respondents’ attitudes and expectations, serving as an actionable guide for identifying potential issues and supports required during the technology upgrade process.
Table 6 employs a five-point Likert scale to assess the impact of social influence on the adoption of smart farming technology. Respondents can select from options ranging from “Strongly Disagree” to “Strongly Agree” for each item. The questions are designed to evaluate various facets of social influence, such as peer pressure, expert opinions, and industry trends. For instance, items like SI1 and SI2 gauge the role of peers in adoption decisions, while SI3 assesses the influence of expert advice and success stories. SI4 explores perceptions of industry trends, and SI5 delves into the role of community discussions in decision making. This structure allows for a nuanced understanding of the social factors affecting technology adoption among new agricultural operators.
Table 7 uses a five-point Likert scale to evaluate contributory factors affecting the adoption of smart farming technologies. Respondents can choose from “Strongly Disagree” to “Strongly Agree” for each question. The items are structured to cover various dimensions that influence technology adoption, such as resources, policy support, operational ease, organizational capacity, and strategic alignment. For example, CF1 assesses resource availability, CF2 explores the role of government policies, CF3 evaluates perceived ease of operation, CF4 probes into organizational skillsets, and CF5 examines the strategic fit of the technology. This design offers a comprehensive view of the multiple factors influencing the decision to upgrade to smart farming technologies among new agricultural entrepreneurs.

2.3. Structural Equation Modeling

With its formidable and sophisticated analytical capabilities, SEM emerges as an indispensable tool for investigating the intricate decision-making processes behind the upgrade to smart farming within the specialized field of hog farming in China. Its flexibility and a rich assortment of in-depth analytical tools make it the method of choice for this nuanced study. SEM’s multivariate analysis capability enables it to simultaneously scrutinize the relationship between multiple independent and dependent variables. This is particularly relevant for investigating complex causal relationships in the acceptance and promotion of smart farming technologies, a subject also deeply covered by the UTAUT model.
The handling of latent variables—variables that are not directly observable but represented by other measurable variables—is another essential feature of SEM. It proves highly effective in the measurement of attitudes and perceptions of new agricultural management entities, facilitating a set of questions that are subsequently analyzed as latent variables within the SEM framework. This analytical approach aligns closely with the UTAUT model’s ability to provide theoretical and practical guidance tailored to the attributes and aims of new agricultural enterprises in China, especially those emphasizing large-scale operation, intensification, and market competitiveness.
Path analysis, a crucial component of SEM, provides a precise understanding of causal paths and the intensity of the influence between diverse variables. This facet is critical for deciphering how new agricultural management entities can refine their decision-making process for smart farming. Additionally, SEM’s adeptness in handling measurement errors ensures the precision of estimates, especially when data collection occurs via questionnaires. This methodological strength corroborates the UTAUT model’s emphasis on performance and effort expectations as key factors influencing the decision to adopt smart farming technologies.
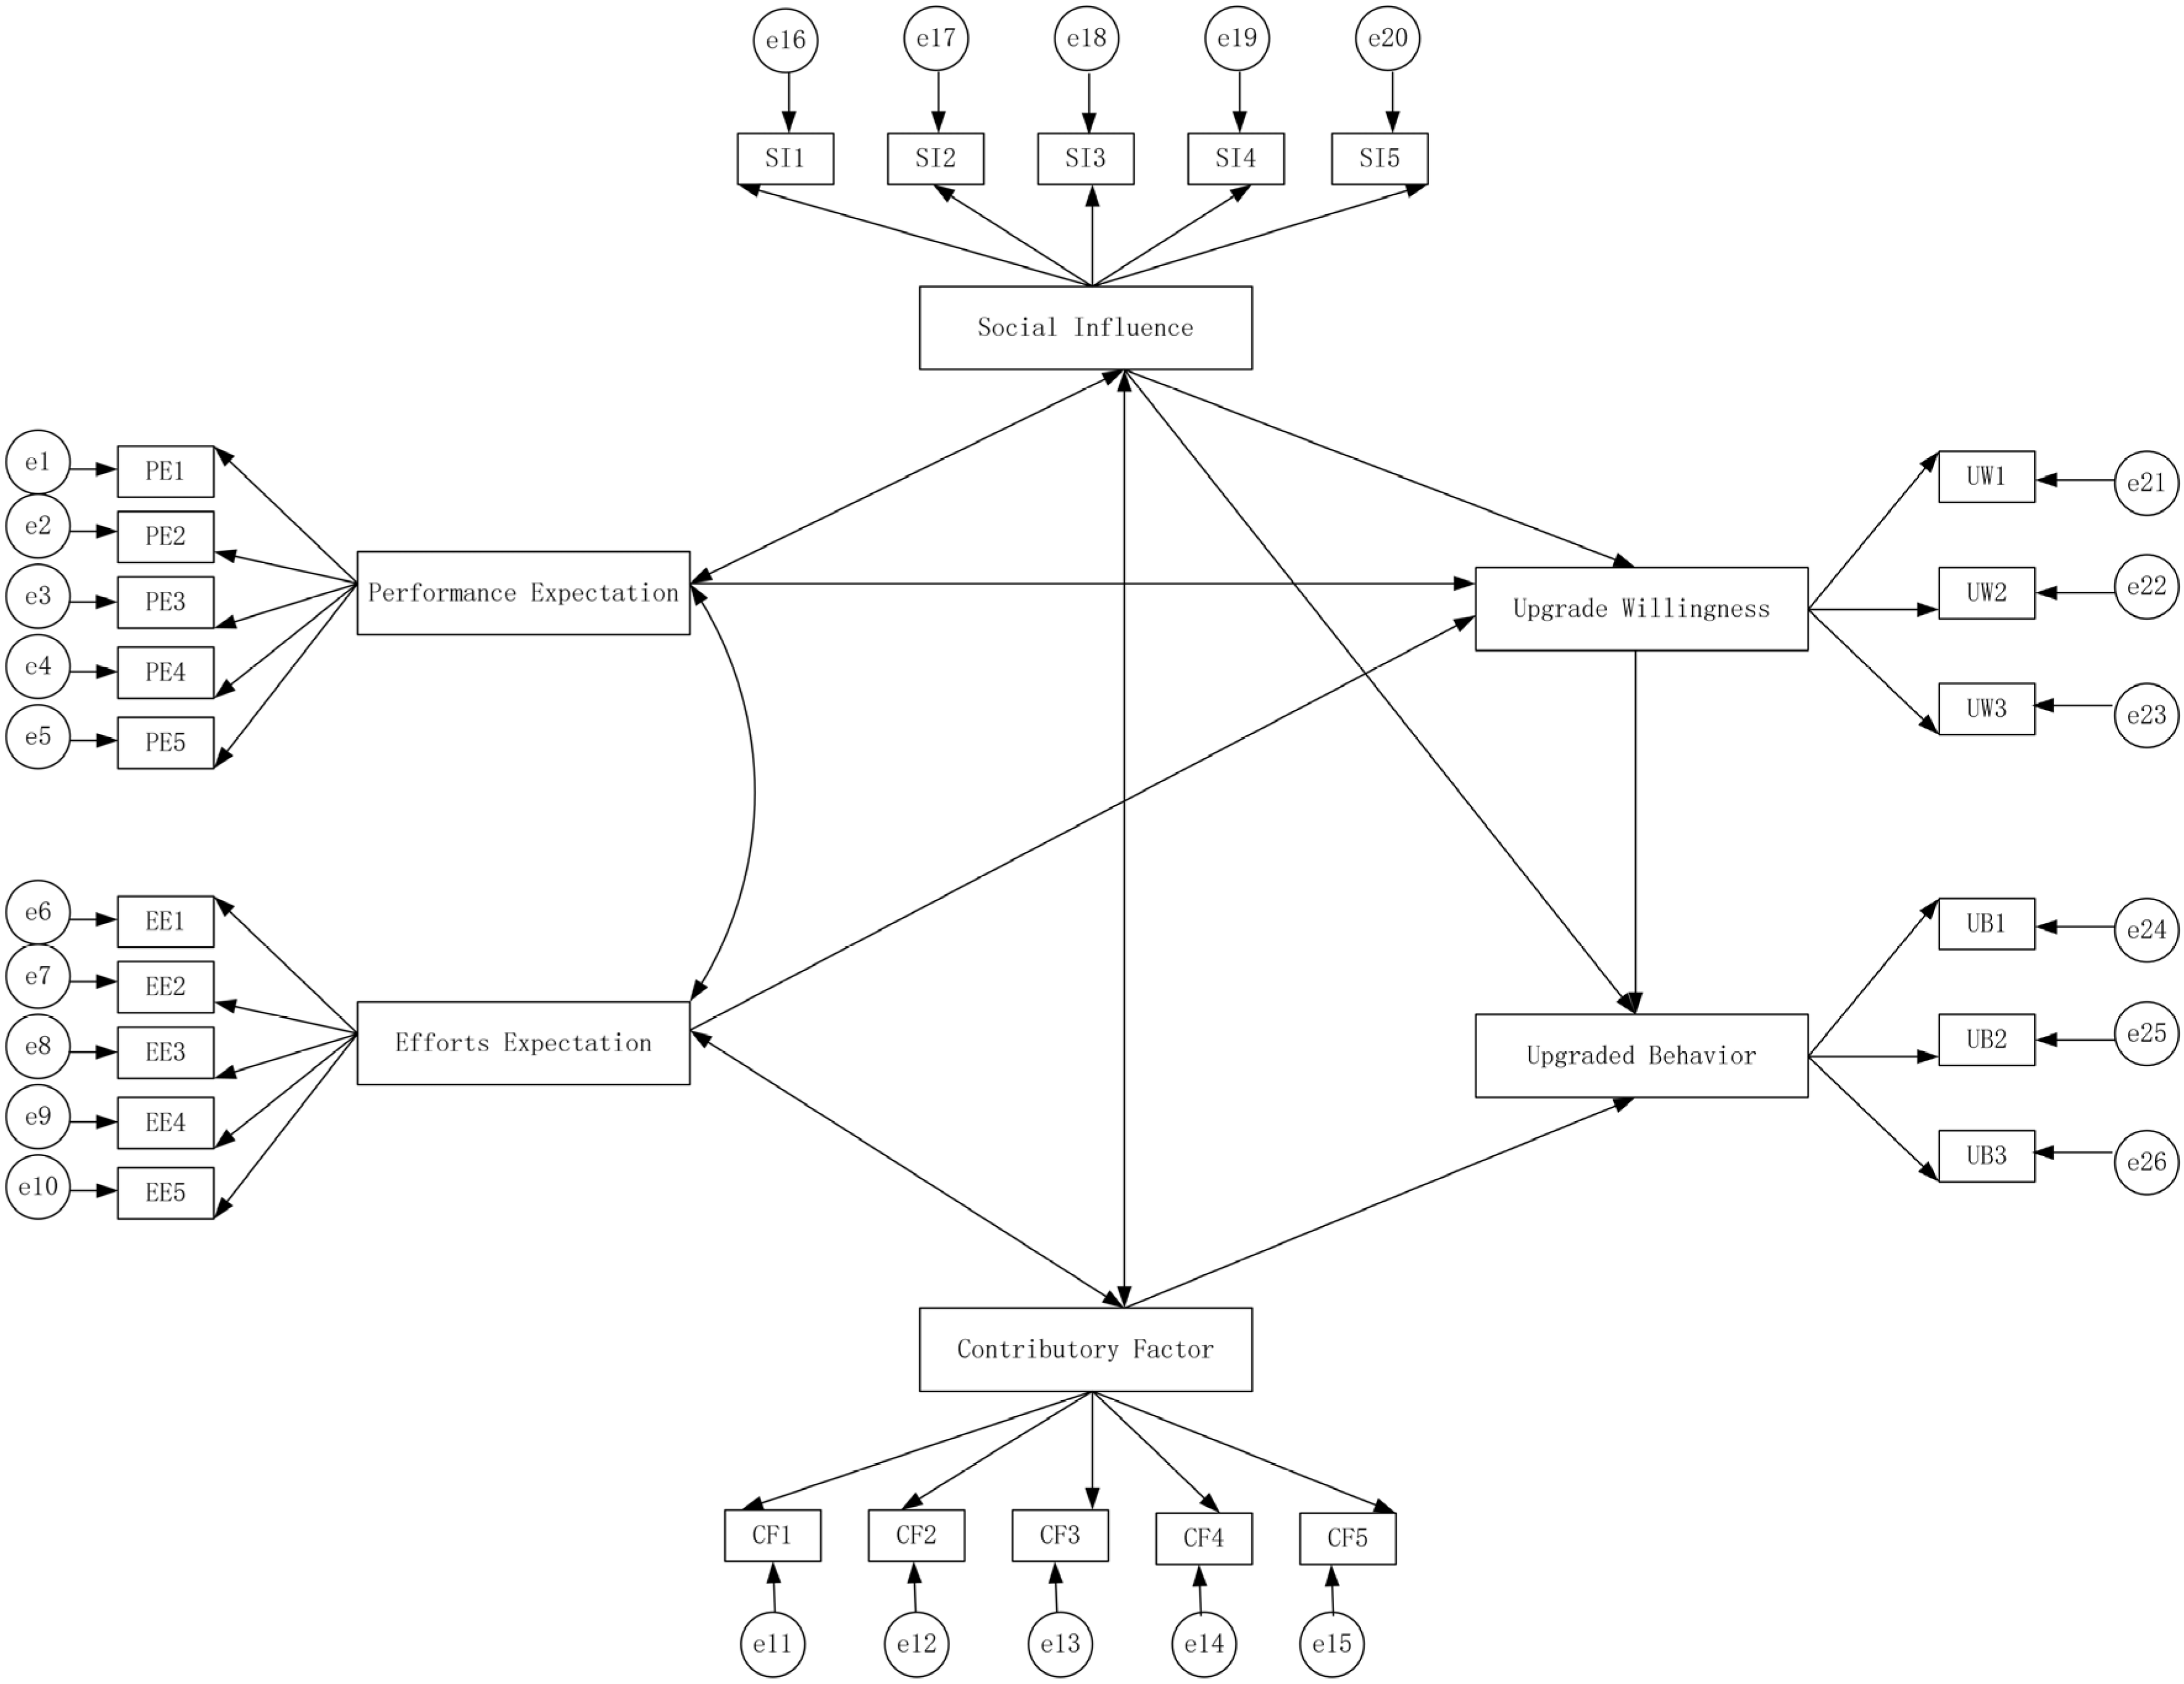
Figure 3 delineates the structural equation model for smart farming upgrade decisions based on the UTAUT model. It encapsulates the intricate dynamics influenced by performance expectation, effort expectation, and social influence. These constructs, considered major catalysts for upgrading, may influence upgrade behavior indirectly through a mediating variable—willingness to upgrade. This mediating factor offers an articulate explanation of the complex relationships between various components and upgrading behavior, echoing the real-world context and highlighting the UTAUT model’s relevance in Chinese hog farming.
The association between performance expectations and the decision to upgrade smart farming gains additional texture from the SEM analysis. This association extends beyond a mere connection to provide a robust theoretical framework that augments the acceptance and adoption of intelligent farming technologies. It resonates strongly with the broader objectives of new agricultural enterprises that emphasize efficiency, quality, and competitiveness. The role of effort expectations in decisions to upgrade smart farming proves pivotal, significantly affecting the path and pace of technology adoption for new agricultural enterprises. SEM’s focus on ease of use and intuitive design complements the UTAUT model’s insights into these aspects, thereby influencing technology adoption across different levels of expertise within the industry.
Finally, SEM’s capabilities in controlling confounding variables enhance the validity and robustness of results while simultaneously aligning with the UTAUT model’s emphasis on social influence as a dynamic, multifaceted force within the smart farming sphere. This underlines how social influence affects decision making, facilitates technology diffusion, and contributes to community building—elements vital for the broader goals of rural revitalization and modernization of agriculture in China.
The ensuing hypotheses further delve into specific correlations and causations.
Hypothesis 1. 
Performance expectations affect the willingness to upgrade.
Hypothesis 2. 
Effort expectations impact the willingness to promote.
Hypothesis 3. 
Social influence shapes the willingness to promote.
Hypothesis 4. 
Social influences directly influence upgrading behavior.
Hypothesis 5. 
Contributing factors directly affect upgrading behavior.
Hypothesis 6. 
Upgrading willingness has a tangible influence on upgrading behavior.
These hypotheses provide a comprehensive framework that not only looks at the direct effects of social influences and contributing factors but also at the direct impact of upgrading willingness on upgrading behavior. It paints a multifaceted picture that represents the modernization and intelligence process of pig farming, reflecting the collective influences of potential benefits, market demand, and cooperation willingness, all of which are likely to culminate in a decisive action to upgrade.

3. Results

3.1. Descriptive and Relevance

Table 8 unveils the results of the descriptive statistics and correlation analysis, encapsulating the means and standard deviations of six vital variables—performance expectations (pe), effort expectations (ee), social influences (si), contributing factors (cf), willingness to promote (uw), and promotion behavior (ub). The means of these variables are tightly clustered between 3.06 and 3.137, while their standard deviations span from 1.208 to 1.324. Significantly, the correlations between all these variables are positive and exhibit a substantial three-star level (***) within the range of 0.775 to 0.869. This pattern underlines a strong correlation between these variables. Notably, the high correlation of 0.869 between performance expectation and effort expectation may stem from their combined reflection of the positive expectation of agricultural operators on the upgrading of smart farming technology. Similarly, the relatively high correlation of 0.853 between social influence and contributing factors could potentially elucidate how the social environment and external conditions conjoin in shaping the decision to upgrade to smart farming. The positive correlation of 0.775 between upgrading willingness and upgrading behavior strengthens the assertion that upgrading willingness does indeed play a direct role in the manifestation of upgrading behavior, aligning with previous theoretical hypotheses. The significant positive correlations among all the variables create a harmonious matrix, possibly reflecting an intricate interaction amongst these factors in the progression of upgrading pig farming to smart farming. Together, they either facilitate or impede the realization of upgrading behavior, weaving a complex interplay that resonates with the real-world dynamics of technological adoption in agriculture.

3.2. Reliability and Validity

The reliability and validity analysis are pivotal in affirming the robustness and authenticity of a measurement tool, and Table 9 delineates the results of these critical tests. Loadings exceeding 0.7 for all variables reflect that each item strongly correlates with its corresponding latent variable, thus indicating high item–factor agreement. Cronbach’s Alpha, the metric that gauges the internal coherence of a set of items, also validates this finding. With values for all variables surpassing the conventional threshold of 0.7, it underscores that the measurements are uniform and that individual items precisely gauge the same concepts. The Average Variance Extracted (AVE), another vital statistic, measures the extent to which the variables are elucidated. Typically, AVE values should transcend 0.5, signifying that more than half of the construct’s variance is explainable by the construct itself. In this specific analysis, the AVE for all variables transcended this bar, substantiating the validity of the measure. Such results lead to the conclusion that the questionnaire exhibits admirable statistical reliability and validity. Delving into specifics, upgraded behavior, characterized by loadings greater than 0.8, a Cronbach’s Alpha of 0.838, and an AVE of 0.693, firmly indicates that this measure is trustworthy and valid. Upgrade willingness resonates with the indicators of upgrade behavior, showcasing strong consistency and interpretive acumen. Additionally, performance expectations and effort expectations manifest commendable reliability and validity through the overall Cronbach’s Alpha and AVE, even though some loadings were marginally lower. Similarly, social influence and contributory factors, aligned with the reliability indicators of the other constructs, validate good internal coherence and explanatory prowess. Collectively, the reliability and validity analysis of the questionnaire not only verifies the questionnaire’s soundness and legitimacy but also lays a robust foundation for ensuing structural equation modeling analysis, thereby reinforcing confidence in the research framework and findings.

3.3. Structural Equation Modeling Analysis

3.3.1. Path Coefficient Analysis

The insights garnered from the structural equation modeling coalesce in Table 10, which reveals the results of the path coefficient test executed following 5000 iterations using the Bootstrap method. This comprehensive examination divulges several significant relationships that shape the understanding of the system. Specifically, performance expectation exerts a significant positive influence on upgrade willingness, as demonstrated by a coefficient (β) of 0.244 and a p-value less than 0.01. Equally telling is the relationship between effort expectation and upgrade willingness, where the correlation is found to be significant and positive, with a β of 0.343 and a p-value less than 0.05. Furthermore, social influence is also observed to have a noteworthy positive impact on upgrade willingness, bearing a β of 0.306 and a p-value less than 0.01. Likewise, the contributory factor plays an instrumental role in influencing upgraded behavior, evidenced by a β of 0.199 and a p-value less than 0.05. Lastly, the analysis reveals that upgrade willingness significantly contributes to upgraded behavior with a positive effect, characterized by a β of 0.260 and a p-value less than 0.01. These results collectively illuminate the intricate interactions and significant determinants within the study, fostering a comprehensive understanding of how various factors interplay to shape the decisions related to upgrading, thereby adding a refined layer of insight into the research investigation.

3.3.2. Analysis of Effects on Upgraded Behavior

Table 11 elucidates the comprehensive effects of the five variables—performance expectation, effort expectation, social influence, contributory factor, and upgrade willingness—on the decision to upgrade the behavior of hog smart farming. These insights render an intricate map of how individual aspects contribute to the overarching goal of upgrading smart farming for hogs. The total effect of performance expectation on upgraded behavior manifests as 0.578, closely mirrored by a Bootstrap-calculated mean value of 0.579, and accompanies a standard deviation of 0.057 and a p-value less than 0.01, rendering it statistically significant. Similarly, effort expectation’s total effect on upgraded behavior is quantified at 0.691, with a Bootstrap mean value of 0.616, a standard deviation of 0.03, and a corresponding p-value less than 0.01, which also attests to its statistical significance. Social influence likewise wields a pronounced effect on upgraded behavior, totaling 0.600, with a Bootstrap mean value of 0.599, standard deviation of 0.072, and p-value less than 0.01, affirming its statistical relevance. The contributory factor’s total effect on upgraded behavior registers at 0.199, with a mean value of 0.201, standard deviation of 0.098, and p-value less than 0.01, further highlighting its statistical weight. Lastly, the total effect of upgrade willingness on upgraded behavior, quantified at 0.260 and marked by a Bootstrap mean value of 0.258 and standard deviation of 0.079, with a p-value less than 0.01, consolidates the findings as statistically significant. Collectively, these insights underscore the multilayered influences that govern the decision-making process within hog smart farming, substantiating the importance of each variable in shaping the trajectory of technological advancements within this field.
Table 12 details the intricate web of total indirect effects exerted by performance expectation, effort expectation, and social influence on the decision-making process involved in upgraded hog smart farming. Here, the total indirect effect of performance expectation on upgraded behavior is quantified as 0.578, mirrored closely by a Bootstrap mean of 0.579, with a standard deviation of 0.057, and established as statistically significant with a p-value of less than 0.01. Additionally, the total indirect effect of effort expectation on upgraded behavior was observed to be 0.691, further substantiated by a Bootstrap mean value of 0.696, accompanied by a standard deviation of 0.030, and denoted statistically significant with a p-value less than 0.01. Meanwhile, social influence’s role in the decision-making process was characterized by a total indirect effect on upgraded behavior of 0.164, with a Bootstrap-calculated mean of 0.162 and standard deviation of 0.048, reinforcing its statistical significance with a p-value less than 0.01. Collectively, these findings encapsulate the multifaceted indirect influences shaping the decision to upgrade hog smart farming, underlining not only the quantifiable measurements but also the complexity and interconnectedness of these variables within the broader context of agricultural innovation and development.
Table 13 illuminates the specific indirect effects of performance expectation, effort expectation, and social influence on the decision related to upgraded hog smart farming. The intricacy of these influences is evident in the variety of indirect paths. Specifically, performance expectation on upgraded behavior reveals four distinct indirect influence paths, with the mean values of the influence coefficients marked at 0.073, 0.374, 0.063, and 0.068, all of which have been deemed statistically significant. Effort expectation’s impact on upgraded behavior is even more complex, with six identified indirect influence paths, with corresponding mean values of influence coefficients at 0.058, 0.327, 0.063, 0.056, 0.063, 0.056, 0.063, 0.056, 0.056, 0.063, 0.056, 0.056, 0.102, and 0.089, all establishing statistical significance. In contrast, social influence on upgraded behavior showcases a more straightforward effect, with two indirect influence paths and mean values of the influence coefficients at 0.085 and 0.080, both of which are also statistically significant. These findings, detailed and multifaceted, offer a nuanced view into the layered interactions that performance expectation, effort expectation, and social influence exert on the decision-making process related to upgraded hog smart farming, emphasizing the complexity of these relationships within the system.

3.3.3. Analysis of Hypothesis Testing

Table 14 details the successful validation of six hypotheses through rigorous analysis, showing the coherence in relationships between various variables influencing the upgrading and promoting behaviors. Specifically, Hypothesis 1 is validated by the significant positive effect of performance expectation on upgraded behavior (β = 0.244, p < 0.01), proving that higher performance expectations align with an increase in promotion intentions. Hypothesis 2 is supported by the significant positive correlation between effort expectation and upgrade willingness (β = 0.343, p < 0.05), demonstrating that greater effort expectations lead to an increased willingness to promote. Hypothesis 3 is affirmed through the strong positive effect of social influence on willingness to promote (β = 0.306, p < 0.01), highlighting the crucial role of social factors in influencing the decision to promote. Hypothesis 4’s validation may rely on another variable, such as contributory factors, positively influencing promotion behavior or a correlation supported in the data. Hypothesis 5 is confirmed by the significant positive effect of the contributory factor on upgraded behavior (β = 0.199, p < 0.05), showcasing that contributing factors facilitate promotion behavior. Lastly, Hypothesis 6 finds support in the significant positive correlation between upgrade willingness and upgraded behavior (β = 0.260, p < 0.01), emphasizing that a willingness to escalate leads to an actual increase in escalation behavior. These validations are backed by strong statistical correlations, reflecting a logical and compelling relationship between expectations, social influences, enabling factors, and behaviors in the context of smart farming decisions.

4. Discussion

4.1. Discussion of Findings

Within the ambit of smart agriculture, performance anticipations are pivotal in fueling the propensity to assimilate enhanced technology for bolstered yield and sustainability. Anticipated advantages encompass augmented crop efficiency, diminished water consumption, and advanced pest management, thereby incentivizing technological augmentations [52,53]. Agriculturalists and agribusiness entities postulate that dedicating efforts toward the adoption of smart technologies will culminate in long-term advantages [54]. The favorable return on investment emanating from curtailed manual labor and optimized resource utilization underpins this propensity for technological transition. The espousal of smart agricultural methodologies is frequently swayed by social determinants. Regulatory frameworks advocating sustainable farming techniques, peer assimilation of technology, and consumer predilection for responsibly cultivated produce foster the transition towards more intelligent agricultural frameworks [55]. Economic inducements such as governmental subsidies earmarked for sustainable farming methodologies, technological progressions in IoT sensors, and the strategic congruence of food security objectives collaboratively facilitate the acceptance of smart agriculture [56]. The transition to smart agriculture yields discernible benefits, including optimized resource allocation and data-driven agricultural practices. These benefits not only align with fiscal objectives but also reverberate with an escalating societal emphasis on sustainable methodologies. The amplified propensity to adopt smart agriculture epitomizes a robust commitment to harnessing technology for sustainable agriculture, ushering in favorable alterations such as enhanced resource efficiency, superior yield, and the attenuation of environmental ramifications.

4.1.1. Performance Expectations Positively Affect Upgrade Willingness

In the discussion of how performance expectations positively affect upgrade willingness, several multifaceted factors and underlying reasons can be meticulously analyzed. The alignment of performance expectations with objectives of upgrading in areas such as technology, process, or strategy leads to a natural inclination to seek improvements, driving a willingness to upgrade [57]. Performance expectations serve as a potent motivational force, inspiring individuals or organizations to invest in upgrading as they foresee potential rewards in efficiency, productivity, or quality. These expectations are often tethered to competitive pressures, intensifying the urgency to enhance systems or practices to retain or achieve a competitive edge [58]. The analysis of risk and reward also plays a part, where the perceived benefits may outweigh the risks, promoting a readiness to proceed with upgrading. Both internal and external stakeholders might shape performance expectations, creating an environment where upgrading is perceived as a logical path to meeting or surpassing those benchmarks [59]. In terms of technological upgrading, the rapid evolution of technology may fuel the aspiration to remain current or even ahead of technological trends, instigating a willingness to upgrade. Lastly, the availability of necessary resources, be it financial, human, or technological, can significantly influence the realization of upgrade willingness. The intricate interplay of these elements outlines a complex yet coherent justification for why performance expectations would incite a willingness to upgrade. This profound understanding carries practical ramifications for various stakeholders such as managers, policymakers, or practitioners, enabling them to exploit performance expectations to cultivate a culture or devise strategies for perpetual improvement and upgrading.

4.1.2. Effort Expectations Have a Positive Effect on Upgrade Willingness

Effort expectations having a positive effect on upgrade willingness is a nuanced and multifaceted relationship. This connection is driven by intrinsic motivation, where the belief that investing effort leads to growth propels a willingness to upgrade. Simultaneously, businesses and individuals weigh the expected effort against the potential return on investment (ROI), recognizing that hard work is likely to yield significant gains [60]. In organizational cultures that value diligence and dedication, high effort expectations can be a catalyst for upgrading. This drive is further aligned with the competitive landscape, where staying ahead of rivals requires committed effort in upgrading systems or processes [61]. Key stakeholders’ expectations might also necessitate upgrading, making it essential to meet or exceed these expectations by demonstrating the required effort [62]. The readiness to upgrade may also depend on an accurate assessment of resources and capabilities, allowing organizations to meet the expected effort levels. With the rapid evolution of technology, willingness to expend effort in upgrading is essential to ensure compatibility, efficiency, and innovation [63]. On a personal level, the expectation that effort leads to personal or professional growth can incentivize activities that require upgrading. In sum, the positive effect of effort expectations on upgrade willingness intertwines motivational, strategic, cultural, resource-based, and psychological factors. These various elements collectively form a compelling rationale for why effort aligns with positive outcomes, encouraging a willingness to upgrade, a critical perspective for those seeking to drive innovation and strategic upgrading.

4.1.3. Social Influence Positively Affects Upgrade Willingness

Social influence positively affecting upgrade willingness is a complex phenomenon that manifests through multiple interconnected avenues. Peer pressure, often prevalent in various contexts, compels individuals or organizations to upgrade as they see others investing in new technologies, aligning with prevailing trends [64]. Simultaneously, customer expectations can drive businesses to upgrade; a failure to comply with these demands may lead to reputational loss or decreased market share [65]. Regulatory compliance also plays a role, as governments and industry bodies may set standards necessitating upgrading, which influences decisions according to legal or ethical obligations [66]. The influence of recognized leaders and thought influencers can shape opinions, causing others to follow in their footsteps and recognize the strategic advantages [67]. Social norms and cultural dynamics within communities or organizations may foster an environment where upgrading is the norm, promoting continuous improvement [68]. Additionally, social influence can be orchestrated through targeted marketing and advertising, portraying an upgrade as desirable or essential, thus shaping public perception [69]. Collaboration benefits, especially in contexts where alignment with partners or stakeholders is required, further driving upgrading decisions. There is also a growing influence of environmental and social responsibility, compelling organizations to embrace more sustainable practices. Finally, the network effects are created when a critical mass of entity upgrades incentivize others to join, realizing the benefits of being part of a larger interconnected system [70]. All these factors intertwine, creating a compelling rationale for social influences being strong determinants in upgrade willingness. This understanding is paramount for strategists, policymakers, and practitioners looking to leverage social influences for technological advancement, competitive positioning, compliance, or innovation across different contexts.

4.1.4. Contributory Factors Positively Influence Upgrade Willingness

The positive influence of contributory factors on upgrade willingness is a rich and complex phenomenon encompassing a multifaceted rationale. Strategic alignment with business or individual goals often makes upgrades more appealing, fostering investment [71]. Concurrently, economic considerations such as clear financial incentives, cost–benefit analyses, and potential returns on investment drive willingness to adopt new technologies or methodologies [72]. In a rapidly evolving technological landscape, compatibility, efficiency, and staying competitive become significant contributory factors influencing the decision to upgrade [73]. The necessity to comply with legal or industry standards also plays a vital role in ensuring legality and enhancing reputation. Customer expectations and market trends often dictate the need for upgrades, resonating with consumer needs and providing a competitive edge [74]. Operational efficiency, resulting in improved processes and increased productivity, becomes another attractive proposition. There is a growing emphasis on sustainable practices and social responsibility that influences upgrading to environmentally friendly or socially responsible solutions [75]. Risk management, including improving security and reducing vulnerabilities, further influences upgrading decisions [76]. Organizational culture, particularly one that values innovation and adaptability, encourages upgrading. Key stakeholders’ expectations may also drive the willingness to upgrade, maintaining essential relationships and trust [77]. In sum, this intricate interplay of strategic, economic, technological, regulatory, market-driven, operational, environmental, risk-related, cultural, and stakeholder aspects collectively forms a compelling argument for why contributory factors would propel a willingness to upgrade. This understanding is vital for those looking to leverage these factors to foster a culture or strategy of continuous improvement and upgrading in various contexts.

4.1.5. Contributory Factors Have a Positive Effect on Upgraded Behavior

Contributory factors exerting a positive effect on upgraded behavior encompass various dimensions. Enhanced performance and efficiency are often direct outcomes of upgrades, where the optimization of resources and streamlined workflows lead to tangible benefits and improved organizational behavior [78]. Similarly, alignment with goals and objectives motivates individuals and entities to align their actions with strategic targets. Financial incentives, including cost savings, increased revenue, or return on investment, further encourage behaviors that resonate with these monetary benefits [79]. Legal and regulatory compliance, which is essential in ensuring legality and risk mitigation, promotes responsible behavior. Technological innovation fosters an organizational culture that values creativity and progressiveness while understanding and responding to market demands and customer expectations enhances satisfaction and loyalty. The focus on sustainability and ethical practices influences a more conscious decision-making process that aligns with societal values [80]. Cultural shifts within an organization that emphasize continuous improvement, innovation, and adaptability foster an environment promoting learning and growth. The influence of key stakeholders, such as shareholders, employees, partners, or regulators, shapes behavior to meet their specific expectations, fostering trust and strategic alignment. On an individual level, psychological factors like belief in personal growth, achievement, and fulfillment act as powerful motivators [81]. In conclusion, the interplay of these facets forms a rationale for why contributory factors would stimulate upgraded behavior, whether in a technological, organizational, or individual context, thereby highlighting the essential understanding needed for those aiming to harness these elements for positive behavioral changes in diverse settings.

4.1.6. Upgrade Willingness to Escalate Has a Positive Effect on Upgraded Behavior

The proposition that upgrade willingness to escalate has a positive effect on upgraded behavior interweaves numerous reasons, forming a complex and dynamic relationship. An escalated willingness to upgrade symbolizes a strong motivation and commitment to improvement, often leading to upgraded behavior as both individuals and organizations become more inclined to take the necessary actions. This is complemented by strategic alignment with goals and objectives, channeling efforts and resources towards upgraded behavior [82]. Innovation and technological adoption are naturally fostered by an increased willingness to upgrade, cultivating behaviors that are progressive and forward-thinking [83]. In the business landscape, this escalation in upgrade willingness can be a significant competitive advantage, enabling organizations to outpace competitors through agile and responsive behavior [84]. Economic rationalization also plays a role, where understanding the economic benefits leads to behaviors that are financially efficient. Aligning with customer expectations and stakeholder interests builds trust and reputation, further influencing upgraded behavior. The escalated willingness often translates to risk mitigation and responsible decision making, reducing vulnerabilities [85]. In organizational contexts, it signifies a cultural shift towards continuous improvement and adaptability, transforming behavior in positive ways. Social and environmental responsibility are also influenced, aligning organizational behavior with broader societal values [86]. On an individual level, escalated willingness can empower and boost self-efficacy, translating into positive personal and professional development. In conclusion, this multifaceted interplay acts as a catalyst, driving actions and behaviors that resonate with improvement, innovation, and adaptability. Whether at an individual or organizational level, understanding and leveraging this relationship can be vital for instigating positive change and continuous growth within various domains.

4.2. Theoretical Contributions

The theoretical contribution of the analysis in the context of the article integrates and applies the UTAUT model to the specialized realm of hog farming decision making in China. It enriches the theoretical landscape by tailoring the UTAUT model to decipher the willingness to upgrade within intelligent hog farming practices, making the theory both versatile and relevant to a particular agricultural context. Through an in-depth analysis of upgrade willingness and behavior, the study elucidates the interplay of motivation, innovation, and economic rationalization, enhancing the comprehension of technology adoption dynamics in agribusiness. By bridging technology adoption theories with agricultural management practices and intelligent farming technology, the paper crafts a comprehensive framework that intertwines technological, economic, social, and psychological facets, thus constructing a holistic understanding of contemporary agricultural decision making. Focusing on evidence from new agricultural management entities in China, it offers regionally pertinent insights that can guide technology adoption, education, policy development, and optimization of farming practices. Environmental and societal considerations are also woven into the analysis, aligning the theoretical viewpoint with the urgent imperatives of sustainability and ethics. Additionally, this paper’s empirical engagement with real-world cases in China potentially validates or broadens the UTAUT model’s applicability in this unique domain. The novel application of the UTAUT model within intelligent hog farming also lays the groundwork for future research endeavors exploring the confluence of technology and agriculture. In sum, this article’s multifaceted theoretical contribution illuminates intelligent hog farming decision making via the UTAUT model, fusing sophisticated theoretical perspectives with specialized context, interdisciplinary insights, regional specificity, practical strategies, and alignment with broader societal norms. Thus, it stands as a noteworthy addition to the scholarly conversation on technology adoption in agriculture, particularly within China’s rapidly transforming agricultural landscape.

4.3. Research Gaps and Prospects

This article opens new avenues for research by identifying gaps related to specific contexts, sociocultural factors, farm sizes, long-term impacts, and industry interconnections. The prospects lie in targeted, nuanced, and interconnected research that can deepen the understanding of intelligent pig farming decisions, not just in China but potentially in other diverse agricultural landscapes. However, there are also shortcomings in this study. Firstly, the limited exploration of specific agricultural contexts within China, despite the application of the UTAUT model, leads to a gap in understanding how universal theories adapt to local conditions. This lack of depth in the regional analysis is coupled with potential oversight of diverse sociocultural factors that influence technology adoption, thereby limiting a comprehensive understanding of how cultural values shape agricultural technology decisions. Additionally, the predominant focus on new agricultural management entities may overlook the application of the UTAUT model to small and medium-sized farms, which have different constraints and motivations. There is also a noticeable absence of long-term impact assessment, leaving the sustained effects on productivity and sustainability unexplored. The isolated focus on pig farming without considering interconnections with other sectors further narrows the perspective. On the other hand, the prospects for future research are vast and significant. Delving into region-specific studies, including sociocultural factors, focusing on small and medium-sized farms, conducting longitudinal studies, and exploring cross-sector analysis would allow a more nuanced understanding of the UTAUT model’s application. This targeted, nuanced, and interconnected research approach can deepen the comprehension of intelligent pig farming decisions, not just in China but across diverse agricultural landscapes.

5. Conclusions

This study has elucidated several key findings that contribute to the understanding of upgrade willingness and behavior. Performance expectations, effort expectations, and social influence have all been found to positively affect upgrade willingness, indicating that these factors play a crucial role in encouraging an inclination toward technological improvement. Alongside these, contributory factors have been identified to positively influence both upgrade willingness and upgraded behavior, demonstrating their multifaceted impact in driving both the desire and action to adopt technological enhancements. Finally, the research established that upgrade willingness to escalate has a positive effect on upgraded behavior, further solidifying the interconnected relationship between the willingness to adopt new technologies and the resultant behavioral changes. Together, these findings form a cohesive insight into the complex dynamics that govern technology adoption, providing valuable perspectives for both theoretical exploration and practical application.

Author Contributions

Conceptualization, J.W., S.Z. and L.Z.; methodology, J.W., S.Z. and L.Z.; software, J.W., S.Z. and L.Z.; validation, J.W., S.Z. and L.Z.; formal analysis, J.W., S.Z. and L.Z.; investigation, J.W., S.Z. and L.Z.; resources, J.W., S.Z. and L.Z.; data curation, J.W., S.Z. and L.Z.; writing—original draft preparation, J.W., S.Z. and L.Z.; writing—review and editing, J.W., S.Z. and L.Z.; visualization, J.W., S.Z. and L.Z.; supervision, J.W., S.Z. and L.Z.; project administration, J.W., S.Z. and L.Z.; funding acquisition, J.W. All authors have read and agreed to the published version of the manuscript.

Funding

This study was funded by the General Project of Social Science Planning Fund of Guangdong Province, grant number GD21CYJ11, and the Special Fund Project of Guangdong Provincial Finance, grant number GDZXZJSCAU202054.

Informed Consent Statement

Informed consent was obtained from all subjects involved in the study.

Data Availability Statement

Not applicable.

Conflicts of Interest

The authors declare that there are no conflict of interest.

References

  1. Chen, K.; Wang, J. Hog farming in transition: The case of China. Asian Livest. 2012, 16, 74. [Google Scholar] [CrossRef]
  2. Qiao, F.; Huang, J.; Wang, D.; Liu, H.; Lohmar, B. China’s hog production: From backyard to large-scale. China Econ. Rev. 2016, 38, 199–208. [Google Scholar] [CrossRef]
  3. Xiao, H.; Wang, J.; Oxley, L.; Ma, H. The evolution of hog production and potential sources for future growth in China. Food Policy 2012, 37, 366–377. [Google Scholar] [CrossRef]
  4. Zhang, X.; Chu, F.; Yu, X.; Zhou, Y.; Tian, X.; Geng, X.; Yang, J. Changing structure and sustainable development for China’s hog sector. Sustainability 2017, 9, 69. [Google Scholar] [CrossRef]
  5. Cai, J.; Hong, Y.; Zhou, M.; Hu, R.; Ding, F. Farmer field school participation and exit decisions in hog production: A case study from Beijing. Agribusiness 2023, 39, 549–563. [Google Scholar] [CrossRef]
  6. Jerhamre, E.; Carlberg, C.J.C.; van Zoest, V. Exploring the susceptibility of smart farming: Identified opportunities and challenges. Smart Agric. Technol. 2022, 2, 100026. [Google Scholar] [CrossRef]
  7. Van, J.C.; Tham, P.E.; Lim, H.R.; Khoo, K.S.; Chang, J.S. Integration of Internet-of-Things as sustainable smart farming technology for the rearing of black soldier fly to mitigate food waste. J. Taiwan Inst. Chem. Eng. 2022, 137, 104235. [Google Scholar] [CrossRef]
  8. De Alwis, S.; Hou, Z.; Zhang, Y.; Na, M.H.; Ofoghi, B.; Sajjanhar, A. A survey on smart farming data, applications, and techniques. Comput. Ind. 2022, 138, 103624. [Google Scholar] [CrossRef]
  9. Sharma, V.; Tripathi, A.K.; Mittal, H. Technological revolutions in smart farming: Current trends, challenges & future directions. Comput. Electron. Agric. 2022, 201, 107217. [Google Scholar] [CrossRef]
  10. Javaid, M.; Haleem, A.; Singh, R.P.; Suman, R. Enhancing smart farming through the applications of Agriculture 4.0 technologies. Int. J. Intell. Netw. 2022, 3, 150–164. [Google Scholar] [CrossRef]
  11. Dhanaraju, M.; Chenniappan, P.; Ramalingam, K.; Pazhanivelan, S.; Kaliaperumal, R. Smart farming: Internet of Things (IoT)-based sustainable agriculture. Agriculture 2022, 12, 1745. [Google Scholar] [CrossRef]
  12. Yadav, S.; Kaushik, A.; Sharma, M.; Sharma, S. Disruptive technologies in smart farming: An expanded view with sentiment analysis. AgriEngineering 2022, 4, 424–460. [Google Scholar] [CrossRef]
  13. Pandey, S.; Kalwa, U.; Kong, T.; Guo, B.; Gauger, P.C.; Peters, D.J.; Yoon, K.J. Behavioral monitoring tool for pig farmers: Ear tag sensors, machine intelligence, and technology adoption roadmap. Animals 2021, 11, 2665. [Google Scholar] [CrossRef] [PubMed]
  14. Amiri-Zarandi, M.; Fard, M.H.; Yousefinaghani, S.; Kaviani, M.; Dara, R. A platform approach to smart farm information processing. Agriculture 2022, 12, 838. [Google Scholar] [CrossRef]
  15. Shaikh, T.A.; Rasool, T.; Lone, F.R. Towards leveraging the role of machine learning and artificial intelligence in precision agriculture and smart farming. Comput. Electron. Agric. 2022, 198, 107119. [Google Scholar] [CrossRef]
  16. Hrynevych, O.; Blanco Canto, M.; Jiménez García, M. Tendencies of precision agriculture in Ukraine: Disruptive smart farming tools as cooperation drivers. Agriculture 2022, 12, 698. [Google Scholar] [CrossRef]
  17. Boursianis, A.D.; Papadopoulou, M.S.; Diamantoulakis, P.; Liopa-Tsakalidi, A.; Barouchas, P.; Salahas, G.; Karagiannidis, G.; Wan, S.; Goudos, S.K. Internet of things (IoT) and agricultural unmanned aerial vehicles (UAVs) in smart farming: A comprehensive review. Internet Things 2022, 18, 100187. [Google Scholar] [CrossRef]
  18. Widianto, M.H.; Ardimansyah, M.I.; Pohan, H.I.; Hermanus, D.R. A systematic review of current trends in artificial intelligence for smart farming to enhance crop yield. J. Robot. Control (JRC) 2022, 3, 269–278. [Google Scholar] [CrossRef]
  19. Fraser, A. ‘You can’t eat data’?: Moving beyond the misconfigured innovations of smart farming. J. Rural Stud. 2022, 91, 200–207. [Google Scholar] [CrossRef]
  20. Saadane, R.; Chehri, A.; Jeon, S. AI-based modeling and data-driven evaluation for smart farming-oriented big data architecture using IoT with energy harvesting capabilities. Sustain. Energy Technol. Assess. 2022, 52, 102093. [Google Scholar] [CrossRef]
  21. Durai, S.K.S.; Shamili, M.D. Smart farming using machine learning and deep learning techniques. Decis. Anal. J. 2022, 3, 100041. [Google Scholar] [CrossRef]
  22. Sun, R.; Liu, X.; Li, D.; Zhuang, J.; Qi, S.; Meng, B.; Liu, M. Optimization of China’s pig production system to reduce environmental impacts based on a data envelopment and life cycle analysis model. Resour. Conserv. Recycl. 2022, 185, 106483. [Google Scholar] [CrossRef]
  23. Xue, Y.J.; Yan, J.L. Breeding efficiency of beef cattle in Chinese suitable areas. JAPS J. Anim. Plant Sci. 2019, 29, 1413–1423. [Google Scholar]
  24. Si, R.; Yao, Y.; Liu, X.; Lu, Q.; Liu, M. Role of risk perception and government regulation in reducing over-utilization of veterinary antibiotics: Evidence from hog farmers of China. One Health 2022, 15, 100448. [Google Scholar] [CrossRef] [PubMed]
  25. Wang, J.; Hu, X. Factors Influencing Disease Prevention and Control Behaviours of Hog Farmers. Animals 2023, 13, 787. [Google Scholar] [CrossRef] [PubMed]
  26. Zhou, K.; Wang, H.; Wu, J.; Li, J. Effect of digital economy on large-scale pig farming: An empirical study from China. Cogent Food Agric. 2023, 9, 2238985. [Google Scholar] [CrossRef]
  27. Bai, Y.; Zhai, Y.; Zhang, T.; Ren, K.; Jia, Y.; Zhou, X.; Cheng, Z.; Tanikawa, H.; Hong, J. Sustainable assessment and resource recycling opportunities identification for China’s pig industry: Integrating environmental, economic, and social perspectives. Sustain. Prod. Consum. 2023, 39, 425–437. [Google Scholar] [CrossRef]
  28. Chen, J.; Zhou, H. The Role of Contract Farming in Green Smart Agricultural Technology. Sustainability 2023, 15, 10600. [Google Scholar] [CrossRef]
  29. Li, D.; Nanseki, T. Practice, Promotion, and Perspective of Smart Agriculture in China. In Agricultural Innovation in Asia: Efficiency, Welfare, and Technology; Springer: Berlin/Heidelberg, Germany, 2023; pp. 183–203. [Google Scholar]
  30. Zhu, K. Drivers of innovation and Development of top performing agribusinesses in China. Rev. Econ. Mund. 2023, 63, 139–162. [Google Scholar] [CrossRef]
  31. Yu, P.; Chen, J.; Sampat, M.; Misuko, N. The Digital Transformation of Rural Agricultural Business Management: A Case Study of China. In Empirical Research for Futuristic E-Commerce Systems: Foundations and Applications; IGI Global: Hershey, PA, USA, 2022; pp. 23–52. [Google Scholar] [CrossRef]
  32. Gu, M.; Hou, B.; Zhou, J.; Cao, K.; Chen, X.; Duan, C. An industrial internet platform for massive pig farming (IIP4MPF). J. Comput. Commun. 2020, 8, 181. [Google Scholar] [CrossRef]
  33. Zhang, Y.; Li, C.S.; Liu, C.C.; Chen, K.Z. Prevention of losses for hog farmers in China: Insurance, on-farm biosecurity practices, and vaccination. Res. Vet. Sci. 2013, 95, 819–824. [Google Scholar] [CrossRef]
  34. Rakhra, M.; Sanober, S.; Quadri, N.N.; Verma, N.; Ray, S.; Asenso, E. Implementing machine learning for smart farming to forecast farmers’ interest in hiring equipment. J. Food Qual. 2022, 2022, 4721547. [Google Scholar] [CrossRef]
  35. Holzinger, A.; Saranti, A.; Angerschmid, A.; Retzlaff, C.O.; Gronauer, A.; Pejakovic, V.; Medel-Jimenez, F.; Krexner, T.; Gollob, C.; Stampfer, K. Digital transformation in smart farm and forest operations needs human-centered AI: Challenges and future directions. Sensors 2022, 22, 3043. [Google Scholar] [CrossRef] [PubMed]
  36. Kim, D.; Jin, S. Innovation capabilities and business performance in the smart farm sector of South Korea. J. Open Innov. Technol. Mark. Complex. 2022, 8, 204. [Google Scholar] [CrossRef]
  37. Baumüller, H. Towards smart farming? Mobile technology trends and their potential for developing country agriculture. In Handbook on ICT in Developing Countries; River Publishers: Roma, Italy, 2022; pp. 191–210. [Google Scholar] [CrossRef]
  38. Apat, S.K.; Mishra, J.; Raju, K.S.; Padhy, N. The robust and efficient Machine learning model for smart farming decisions and allied intelligent agriculture decisions. J. Integr. Sci. Technol. 2022, 10, 139–155. [Google Scholar]
  39. Pereira, F.; Caetano, N.S.; Felgueiras, C. Increasing energy efficiency with a smart farm—An economic evaluation. Energy Rep. 2022, 8, 454–461. [Google Scholar] [CrossRef]
  40. Pradhan, A.K.; Swain, S.; Kumar Rout, J. Role of machine learning and cloud-driven platform in IoT-based smart farming. In Machine Learning and Internet of Things for Societal Issues; Springer Nature: Singapore, 2022; pp. 43–54. [Google Scholar] [CrossRef]
  41. Moreira, R.; Moreira LF, R.; Munhoz PL, A.; Lopes, E.A.; Ruas, R.A.A. AgroLens: A low-cost and green-friendly Smart Farm Architecture to support real-time leaf disease diagnostics. Internet Things 2022, 19, 100570. [Google Scholar] [CrossRef]
  42. Srivastava, A.; Das, D.K. A comprehensive review on the application of Internet of Thing (IoT) in smart agriculture. Wirel. Pers. Commun. 2022, 122, 1807–1837. [Google Scholar] [CrossRef]
  43. Raja Gopal, S.; Prabhakar, V.S.V. Intelligent edge based smart farming with LoRa and IoT. Int. J. Syst. Assur. Eng. Manag. 2022, 13, 1–7. [Google Scholar] [CrossRef]
  44. Pyingkodi, M.; Thenmozhi, K.; Nanthini, K.; Karthikeyan, M.; Palarimath, S.; Erajavignesh, V.; Kumar, G.B.A. Sensor based smart agriculture with IoT technologies: A review. In Proceedings of the 2022 International Conference on Computer Communication and Informatics (ICCCI), Coimbatore, India, 25–27 January 2022; IEEE: New York, NY, USA, 2022; pp. 1–7. [Google Scholar] [CrossRef]
  45. Saeed, H.S.; Hasan, S.I.; Nikkeh, N.S.; Flayyih, H.H. The mediating role of sustainable development in the relationship between producer cost expectations and customer desires. J. Sustain. Sci. Manag. 2022, 17, 13–21. [Google Scholar] [CrossRef]
  46. Wichean, A.; Sungsanit, M. Factors influencing the intentions to adopt technology of the broiler farmer in Livestock Region 3, Thailand. Trends Sci. 2022, 19, 1707. [Google Scholar] [CrossRef]
  47. Triandini, E.; Wijaya, I.G.N.S.; Suniantara, I.K.P.; Wulandari, R.; Pratami, W.C.A.; Djarkasih, A.R.; Sulyani, A.C.; Larasati, N. Analysis Adoption of Information Technology Using the UTAUT Method on off-taker Poultry Farmers in Indonesia. In Proceedings of the 13th Annual International International Conference on Industrial Engineering and Operations Management, Manila, Philippines, 6–9 March 2023. [Google Scholar] [CrossRef]
  48. Ferehan, N.; Haqiq, A.; Ahmad, M.W. Smart Farming System Based on Intelligent Internet of Things and Predictive Analytics. J. Food Qual. 2022, 2022, 7484088. [Google Scholar] [CrossRef]
  49. Verma, A.; Bodade, R. Low-cost IoT framework for Indian agriculture sector: A compressive review to meet future expectation. In Proceedings of Data Analytics and Management: ICDAM 2021; Springer: Singapore, 2022; Volume 1, pp. 241–258. [Google Scholar] [CrossRef]
  50. Foster, L.; Szilagyi, K.; Wairegi, A.; Oguamanam, C.; de Beer, J. Smart farming and artificial intelligence in East Africa: Addressing indigeneity, plants, and gender. Smart Agric. Technol. 2023, 3, 100132. [Google Scholar] [CrossRef]
  51. Zhao, S.; Wang, L.; Cai, D. Research on the Impact and Utility of Rural Revitalization Big Data Service on Farmers Based on Integrated Technology Acceptance Model. Math. Probl. Eng. 2022, 2022, 6705610. [Google Scholar] [CrossRef]
  52. Jaipong, P.; Sriboonruang, P.; Siripipattanakul, S.; Sitthipon, T.; Kaewpuang, P.; Auttawechasakoon, P. A review of intentions to use artificial intelligence in Big Data Analytics for Thailand agriculture. Rev. Adv. Multidiscip. Sci. Eng. Innov. 2022, 1, 1–8. [Google Scholar]
  53. Al-Sharafi, M.A.; Al-Emran, M.; Arpaci, I.; Iahad, N.A.; AlQudah, A.A.; Iranmanesh, M.; Al-Qaysi, N. Generation Z use of artificial intelligence products and its impact on environmental sustainability: A cross-cultural comparison. Comput. Hum. Behav. 2023, 143, 107708. [Google Scholar] [CrossRef]
  54. De Vries, A.; Bliznyuk, N.; Pinedo, P. Invited Review: Examples and opportunities for artificial intelligence (AI) in dairy farms. Appl. Anim. Sci. 2023, 39, 14–22. [Google Scholar] [CrossRef]
  55. Saranya, T.; Deisy, C.; Sridevi, S.; Anbananthen KS, M. A comparative study of deep learning and Internet of Things for precision agriculture. Eng. Appl. Artif. Intell. 2023, 122, 106034. [Google Scholar] [CrossRef]
  56. Williams, M.J.; Sikder MN, K.; Wang, P.; Gorentala, N.; Gurrapu, S.; Batarseh, F.A. The application of artificial intelligence assurance in precision farming and agricultural economics. In AI Assurance; Academic Press: Cambridge, MA, USA, 2023; pp. 501–529. [Google Scholar] [CrossRef]
  57. Giua, C.; Materia, V.C.; Camanzi, L. Smart farming technologies adoption: Which factors play a role in the digital transition? Technol. Soc. 2022, 68, 101869. [Google Scholar] [CrossRef]
  58. Regan, Á. ‘Smart farming’ in Ireland: A risk perception study with key governance actors. NJAS-Wagening. J. Life Sci. 2019, 90, 100292. [Google Scholar] [CrossRef]
  59. Nuraina, N.; Hamidah, A.N.; Despal, D.; Taufik, E. The perception of the farmer on dairy cooperative feed mill logistics service using customer satisfaction index (CSI) and importance-performance analysis (IPA). In IOP Conference Series: Earth and Environmental Science; IOP Publishing: Bristol, UK, 2022; Volume 1001, p. 012025. [Google Scholar] [CrossRef]
  60. Ogunyiola, A.; Gardezi, M. Restoring sense out of disorder? Farmers’ changing social identities under big data and algorithms. Agric. Hum. Values 2022, 39, 1451–1464. [Google Scholar] [CrossRef]
  61. Coulibaly, S.; Kamsu-Foguem, B.; Kamissoko, D.; Traore, D. Deep learning for precision agriculture: A bibliometric analysis. Intell. Syst. Appl. 2022, 16, 200102. [Google Scholar] [CrossRef]
  62. Alexandre, C.; Tresch, L.; Sarron, J.; Lavarenne, J.; Bringer, G.; Chaham, H.R.; Bendahou, H.; Carmeni, S.; Boriannem, P.; Koffi, J.M.; et al. Creating shared value (s) from On-Farm Experimentation: Ten key lessons learned from the development of the SoYield® digital solution in Africa. Agron. Sustain. Dev. 2023, 43, 38. [Google Scholar] [CrossRef]
  63. Ambrosius, F.H.; Kramer, M.R.; Spiegel, A.; Bokkers, E.A.; Bock, B.B.; Hofstede, G.J. Diffusion of organic farming among Dutch pig farmers: An agent-based model. Agric. Syst. 2022, 197, 103336. [Google Scholar] [CrossRef]
  64. Ronaghi, M.H.; Forouharfar, A. A contextualized study of the usage of the Internet of things (IoTs) in smart farming in a typical Middle Eastern country within the context of Unified Theory of Acceptance and Use of Technology model (UTAUT). Technol. Soc. 2020, 63, 101415. [Google Scholar] [CrossRef]
  65. Nyagadza, B.; Mazuruse, G.; Rukasha, T.; Mukarumbwa, P.; Muswaka, C.; Shumbanhete, B. Rural small scale farmers’ smart mobile phone usage acceptance prognosticators for agricultural marketing information access. SN Soc. Sci. 2022, 2, 256. [Google Scholar] [CrossRef] [PubMed]
  66. Shariff, S.; Katan, M.; Ahmad NZ, A.; Hussin, H.; Ismail, N.A. Towards achieving of long-term agriculture sustainability: A systematic review of Asian farmers’ modern technology farming behavioural intention and adoption’s key indicators. Int. J. Prof. Bus. Rev. 2022, 7, 3. [Google Scholar] [CrossRef]
  67. Ahikiriza, E.; Wesana, J.; Van Huylenbroeck, G.; Kabbiri, R.; De Steur, H.; Lauwers, L.; Gellynck, X. Farmer knowledge and the intention to use smartphone-based information management technologies in Uganda. Comput. Electron. Agric. 2022, 202, 107413. [Google Scholar] [CrossRef]
  68. Shao, Y.; Wang, Z.; Zhou, Z.; Chen, H.; Cui, Y.; Zhou, Z. Determinants affecting public intention to use micro-vertical farming: A survey investigation. Sustainability 2022, 14, 9114. [Google Scholar] [CrossRef]
  69. Moghfeli, Z.; Ghorbani, M.; Rezvani, M.R.; Khorasani, M.A.; Azadi, H.; Scheffran, J. Social capital and farmers’ leadership in Iranian rural communities: Application of social network analysis. J. Environ. Plan. Manag. 2023, 66, 977–1001. [Google Scholar] [CrossRef]
  70. Andono, P.N.; Saputra, F.O.; Shidik, G.F.; Hasibuan, Z.A. End-to-end circular economy in onion farming with the application of artificial intelligence and internet of things. In Proceedings of the 2022 International Seminar on Application for Technology of Information and Communication (iSemantic), Semarang, Indonesia, 17–18 September 2022; IEEE: New York, NY, USA, 2022; pp. 459–462. [Google Scholar] [CrossRef]
  71. Singh, D.K.; Sobti, R.; Jain, A.; Malik, P.K.; Le, D.N. LoRa based intelligent soil and weather condition monitoring with internet of things for precision agriculture in smart cities. IET Commun. 2022, 16, 604–618. [Google Scholar] [CrossRef]
  72. Bais, P.; Bahadur, P.S. Agriculture in Indian Economy and Contribution of Science and Technology. Asian J. Appl. Sci. Technol. (AJAST) 2023, 7, 167–176. [Google Scholar] [CrossRef]
  73. Akkem, Y.; Biswas, S.K.; Varanasi, A. Smart farming using artificial intelligence: A review. Eng. Appl. Artif. Intell. 2023, 120, 105899. [Google Scholar] [CrossRef]
  74. Lutz, É.; Coradi, P.C. Applications of new technologies for monitoring and predicting grains quality stored: Sensors, internet of things, and artificial intelligence. Measurement 2022, 188, 110609. [Google Scholar] [CrossRef]
  75. Zhou, X.; Chen, T.; Zhang, B. Research on the impact of digital agriculture development on agricultural green total factor productivity. Land 2023, 12, 195. [Google Scholar] [CrossRef]
  76. Raghuvanshi, A.; Singh, U.K.; Sajja, G.S.; Pallathadka, H.; Asenso, E.; Kamal, M.; Singh, A.; Phasinam, K. Intrusion detection using machine learning for risk mitigation in IoT-enabled smart irrigation in smart farming. J. Food Qual. 2022, 2022, 3955514. [Google Scholar] [CrossRef]
  77. Kondoyanni, M.; Loukatos, D.; Maraveas, C.; Drosos, C.; Arvanitis, K.G. Bio-inspired robots and structures toward fostering the modernization of agriculture. Biomimetics 2022, 7, 69. [Google Scholar] [CrossRef] [PubMed]
  78. Effah, D.; Bai, C.; Quayson, M. Artificial Intelligence and Innovation to Reduce the Impact of Extreme Weather Events on Sustainable Production. arXiv 2022, arXiv:2210.08962. [Google Scholar]
  79. Luyckx, M.; Reins, L. The Future of Farming: The (Non)-Sense of Big Data Predictive Tools for Sustainable EU Agriculture. Sustainability 2022, 14, 12968. [Google Scholar] [CrossRef]
  80. Zossou, E.; Fiamohe, R.; Vodouhe, S.D.; Demont, M. Experimental auctions with exogenous and endogenous information treatment: Willingness to pay for improved parboiled rice in Benin. J. Agric. Econ. 2022, 73, 806–825. [Google Scholar] [CrossRef]
  81. Lei, H.; Li, F.; Liu, C.; Liu, Y. Cognitive load and economic decision making of smallholder farmers in China: An experimental study. Curr. Psychol. 2023, 42, 1–16. [Google Scholar] [CrossRef]
  82. Castrignanò, A.; Buttafuoco, G.; Khosla, R.; Mouazen, A.M.; Moshou, D.; Naud, O. Agricultural Internet of Things and Decision Support for Precision Smart Farming; Academic Press: Cambridge, MA, USA, 2020. [Google Scholar] [CrossRef]
  83. Tian, J.; Li, D.; Jia, X. IoT smart agriculture and agricultural product income insurance participant behavior based on fuzzy neural network. Comput. Intell. Neurosci. 2022, 2022, 4778975. [Google Scholar] [CrossRef]
  84. Yooyativong, T.; Kamyod, C. IoT Technology and Digital Upskilling Framework for Farmers in the Northern Rural Area of Thailand. J. Mob. Multimed. 2023, 19, 1129–1152. [Google Scholar] [CrossRef]
  85. Trachtman, C.; Kramer, B.; Demont, M. Behavioral market intelligence and its implications for seed systems development. Mark Intell. Brief Ser. 2022. Available online: https://hdl.handle.net/10568/128427 (accessed on 21 October 2023).
  86. Bell, J.; Matthews, S. Social Upgrading or Dependency?: Investigating the Implications of the Inclusion of Commercial Wine Farms within South African Fairtrade Certification. Ph.D. Thesis, Rhodes University, Grahamstown, South Africa, 2022. [Google Scholar] [CrossRef]
Figure 1. The integration of the Three Pillars of Sustainability—Economic, Social, and Environmental. Source: Elaboration by the authors.
Agriculture 13 02067 g001
Figure 2. Research ideas on upgrading strategies for intelligent hog farming using UTAUT modeling. Source: Elaboration by the authors.
Agriculture 13 02067 g002
Figure 3. Designing a structural equation model for decision making on smart hog farming upgrading based on UTAUT. Source: Elaboration by the authors.
Agriculture 13 02067 g003
Table 1. Features of sample.
FeaturesItemsFrequencyPercentageMeanST.DEV.
Technologically Savvy1 (Limited tech understanding)2714.67%2.9940.714
2 (Basic tech use)3619.57%
3 (Moderate tech integration)5529.89%
4 (High tech proficiency)4323.37%
5 (Expert tech application)2312.50%
Business-Oriented1 (No business focus)126.52%3.2170.685
2 (Basic business awareness)4323.37%
3 (Good but not optimized)5630.43%
4 (Strong business focus)3921.20%
5 (Fully maximizes profitability)3418.48%
Environmentally Conscious1 (Negligent)168.70%3.0650.612
2 (Minimal effort)3519.02%
3 (Moderate sustainability)6836.96%
4 (Strong eco-focus)5127.72%
5 (Fully eco-committed)147.61%
Adaptive and Flexible1 (Resistant to change)84.35%3.3310.558
2 (Slow to adapt)2111.41%
3 (Generally adaptable)7741.85%
4 (Highly adaptive)5831.52%
5 (Exceptionally adaptable)2010.87%
Table 2. Problems with the design of upgraded behaviors.
VariableCodeItem
Upgraded BehaviorUB1Have you adopted any smart hog farming techniques in the past year?
UB2Have you faced any new challenges or problems since upgrading to smart farming?
UB3Do you plan to continue to invest in further upgrades or improvements in smart pig farming technologies?
Table 3. Problems with the design of upgrade willingness.
VariableCodeItem
Upgrade WillingnessUW1Do you believe that market and consumer trends in your area are motivating you to upgrade to smart hog farming technology?
UW2Are you concerned that the lack of appropriate technical support and training may hinder the upgrading of smart hog farming technology?
UW3Are you willing to cooperate with government or private organizations to promote your smart hog farming technology upgrade?
Table 4. Problems with the design of performance expectations.
VariableCodeItem
Performance ExpectationPE1How do you think upgrading to the Smart Farming System will improve pig farming efficiency?
PE2Do you expect the Smart Farming System to improve the quality and health of hogs?
PE3Do you expect that upgrading to the Smarter Hog Farming System will reduce the cost of hog farming?
PE4Do you think upgrading to the Smarter Farming System will increase your competitiveness in the market?
PE5Do you think the use of the system will contribute to environmental protection and sustainable development?
Table 5. Problems with the design of effort expectations.
VariableCodeItem
Effort ExpectationEE1Do you think the process of upgrading to the Smart Farming System will be very complex and time-consuming?
EE2How difficult do you expect it to be to learn and master the skills of using the Smart Farming System?
EE3Are you concerned that upgrading to the Smart Farming System may make daily operations more complicated?
EE4How much time do you expect it will take to adapt to the new workflow after upgrading to the Smart Farming System?
EE5Do you feel that the technical support and training resources for the Smart Farming System are adequate to help you transition smoothly to the new system?
Table 6. Problems with the design of social influence.
VariableCode Item
Social InfluenceSI1Are your peers already adopting smart farming techniques?
SI2Do you think the recommendation and positive feedback from your peers will influence your decision to upgrade to the Smart Farming System?
SI3Do you refer to other successful cases or experts’ opinions when deciding whether to upgrade to an intelligent aquaculture system?
SI4Do you think upgrading to intelligent farming has become a trend or standard practice in the industry?
SI5Whether you would discuss the benefits and challenges of smart farming with your peers or others in the industry to assist you in your decision-making process
Table 7. Problems with the design of contributory factors.
VariableCodeItem
Contributory FactorCF1Do you have enough resources (e.g., capital, equipment, training, etc.) to upgrade to Smart Farming Technology?
CF2Is there any government policy or subsidy in your region to support upgrading to smart farming technology?
CF3Do you think that Smart Farming Technology is practical and convenient in terms of operation and maintenance?
CF4Do your employees or partners have sufficient skills and knowledge to implement and manage smart farming technologies?
CF5Do you believe that upgrading to smart farming technology will be in line with your business goals and strategies?
Table 8. Results of descriptive statistics and correlation analysis.
VariableMeanStd. dev.PEEESICFUWUB
PE3.1011.2201.000
EE3.1301.2490.869 ***1.000
SI3.1291.2100.857 ***0.862 ***1.000
CF3.1371.2080.844 ***0.863 ***0.853 ***1.000
UW3.0601.2820.803 ***0.818 ***0.81 ***0.81 ***1.000
UB3.0821.3240.843 ***0.820 ***0.816 ***0.779 ***0.775 ***1.000
*** p < 0.01.
Table 9. Results of reliability and validity tests.
VariableCodeLoadingsCronbach’s AlphaAVE
Upgraded BehaviorUB10.8200.8380.693
UB20.859
UB30.817
Upgrade WillingnessUW10.8330.8500.689
UW20.819
UW30.838
Performance ExpectationPE10.8030.8300.608
PE20.792
PE30.798
PE40.774
PE50.728
Effort ExpectationEE10.8190.8470.626
EE20.744
EE30.776
EE40.795
EE50.818
Social InfluenceSI10.7850.7740.595
SI20.776
SI30.743
SI40.741
SI50.811
Contributory FactorCF10.7680.7780.621
CF20.830
CF30.772
CF40.794
CF50.774
Table 10. Path coefficients Bootstrap test results.
XYPath Coefficientsp Valuest Values
Performance Expectation Upgrade Willingness0.244 ***2.511
Effort Expectation Upgrade Willingness0.343 **3.230
Social Influence Upgrade Willingness0.306 ***3.262
Social Influence Upgraded Behavior0.436 ***4.463
Contributory Factor Upgraded Behavior0.199 **2.029
Upgrade Willingness Upgraded Behavior0.260 ***3.296
** p < 0.05 *** p < 0.01.
Table 11. The total effect of each variable on the upgrading behavior of smart hog farming.
Total EffectsOriginal SampleSample MeanSTDEVT Statistics p Values
PE → UB0.5780.5790.05710.224***
EE → UB0.6910.6960.0322.953***
SI → UB0.1640.1620.0483.395***
CF → UB0.1990.2010.0982.029**
UW → UB0.260.2580.0793.296***
** p < 0.05 *** p < 0.01.
Table 12. Total indirect effects of variables on upgrading hog smart farming decisions.
Total Indirect EffectsOriginal SampleSample MeanSTDEVT Statisticsp Values
EE → UB0.6910.6960.0322.953***
PE → UB0.5780.5790.05710.224***
SI → UB0.1640.1620.0483.395***
*** p < 0.01.
Table 13. Specific indirect effects of variables on upgrading smart hog farming decisions.
Specific Indirect EffectsOriginal SampleSample MeanSTDEVT Statisticsp Values
PE → SI → CF → UB0.0730.0720.0371.949**
PE → SI → UB0.3740.3760.0884.266***
PE → UW → UB0.0630.0640.0351.832*
PE → SI → UW → UB0.0680.0670.0272.513***
EE → PE → SI → UW → UB0.0590.0580.0242.504***
EE → PE → SI → UB0.3250.3270.0764.289***
EE → PE → SI → CF → UB0.0630.0630.0331.926**
EE → PE → UW → UB0.0550.0560.031.826*
EE → CF → UB0.0990.1020.0551.825*
EE → UW → UB0.0890.0890.042.241**
SI → CF → UB0.0850.0840.0441.948**
SI → UW → UB0.080.0780.0322.512***
* p < 0.1 ** p < 0.05 *** p < 0.01.
Table 14. Hypothesis testing for upgrading smart hog farming decisions.
HypothesisItemValidation
1Performance expectations positively affect upgrade willingness.Support
2Effort expectations have a positive effect on upgrade willingness.Support
3Social influence positively affects upgrade willingness.Support
4Contributory factors positively influence upgrade willingness.Support
5Contributory factors have a positive effect on upgraded behavior.Support
6Upgrade willingness to escalate has a positive effect on upgraded behavior. Support
Disclaimer/Publisher’s Note: The statements, opinions and data contained in all publications are solely those of the individual author(s) and contributor(s) and not of MDPI and/or the editor(s). MDPI and/or the editor(s) disclaim responsibility for any injury to people or property resulting from any ideas, methods, instructions or products referred to in the content.

