Article

Performance Evaluation of a Virtual Test Model of the Frame-Type ROPS for Agricultural Tractors Using FEA

1
Department of Smart Agriculture, Korea Agriculture Technology Promotion Agency, Iksan 54667, Republic of Korea
2
Department of Bio-Industrial Machinery Engineering, Kyungpook National University, Daegu 41566, Republic of Korea
3
Upland Field Machinery Research Center, Kyungpook National University, Daegu 41566, Republic of Korea
4
Department of Agricultural Machinery Engineering, Chungnam National University, Daejeon 34134, Republic of Korea
5
Department of Biosystems Machinery Engineering, Chungnam National University, Daejeon 34134, Republic of Korea
6
Department of Smart Agriculture Systems, Chungnam National University, Daejeon 34134, Republic of Korea
*
Author to whom correspondence should be addressed.
Agriculture 2023, 13(10), 2004; https://doi.org/10.3390/agriculture13102004
Submission received: 14 September 2023 / Revised: 12 October 2023 / Accepted: 13 October 2023 / Published: 15 October 2023
(This article belongs to the Special Issue Soil Mechanical Systems and Related Farming Machinery)

Abstract

:
In this study, a model of the frame-type ROPS (rollover protective structure) for an agricultural tractor was developed using FEA (finite-element analysis). Various boundary conditions were applied as input variables to replace the actual test of the ROPS with a virtual test. An optimization study was carried out based on the boundary conditions of the bolt, considering the ROPS part directly mounted on the tractor and the folding connection to the ROPS. The results of the virtual test were compared with those of the actual test, and the error was determined. The maximum error of the evaluation model was 7.0% for the force applied on the load and 9.6% for the corresponding ROPS deformation. All mounting bolts of the ROPS required modeling. In particular, we had to establish free boundary conditions for axial rotation to implement the folding connection. In addition, a simulation of the frame-type ROPS was conducted according to the mesh size. A convenient simulation time was obtained for a mesh size of 8~10 mm. Compared with the actual test, the accuracy was the highest with a mesh size of 6~8 mm.

1. Introduction

According to a survey on agricultural machinery accidents in Korea, tractor accidents due to a lack of safety measures account for 16.1% of all farming accidents, and overturning and fall accidents account for 43.3% of all tractor accidents [1]. According to a fatal accident investigation by the Ministry of Agriculture, Forestry and Fisheries of Japan conducted in 2005, about 70% of tractor fatal accidents were caused by tractor tipping or falls. This may be related to the fact that, in Japan, the installation rate of rollover protection structure (ROPS) is 69%, and only 48% of these frames are certified ROPSs, ensuring the required performance [2]. In 2002, approximately 52% of fatal accidents during tractor operation in the United States were caused by tipping, and the ROPS installation rate was 38% [3]. In Portugal, over the past 10 years, tractor accidents accounted for 79% of all deaths caused by farming accidents, and 38.6% of these accidents were caused by the overturning; the application rate of the ROPS for tractors was only 4.1% [4]. In Korea, the installation rate of the ROPS is 80.1%, but 15.6% of the ROPSs are then removed due to the conditions of the working environment [5]. It thus appears that, in most countries, tractor accidents are often fatal, which makes crucial the installation of the tractor ROPS with certified safety performance [6,7,8].
When a tractor overturns, the ROPS, which is intended to protect the driver, is subjected to external forces inducing crushing and deformation [9]. The tests performed to evaluate ROPS crushing and deformation resistance involve applying static loads to the tractor-installed ROPS to assess its efficiency in protecting the driver’s safety zone. However, when changes are introduced in ROPS, even minor design changes such as thickness variations to improve its strength or changes in the location of bolt holes, the ROPS must be tested again and obtain a safety certification, which is time-consuming and expensive. For this reason, during the 2018 OECD (Organization for Economic Cooperation and Development) Tractor Technical Meeting, the OECD Tractor Division proposed to replace actual tests with virtual tests when assessing ROPS performance. Accordingly, the OECD Tractor Division is developing a virtual test for the ROPS. In technologically advanced countries, the importance of tractor ROPS virtual test technology is recognized through various studies.
Karakulak and Yetkin [10] argued that virtual testing can prevent wasting time and money in test repetitions whenever a minor change is introduced in a tractor ROPS design, and Blanco and Martin [11] confirmed that simulation tests required before ROPS certification tests are convenient in these respects [11]. Fabbri and Wards (2002) successfully simulated the test conditions defined in the OECD code to verify the effectiveness of FEA in reverse engineering of the tractor ROPS [12]. In Korea, Ha et al. [13] used finite-element analysis to design the ROPS that met the certification conditions and compared their results with those of an actual test, confirming that their method allowed satisfying the OECD code. Kim et al. [14] used the finite-element method to achieve the OECD certification of agricultural tractor cabin structures [14]. Additionally, Jang and Lee [15] obtained an optimal ROPS design using finite-element analysis, reducing the manufacturing time and cost and satisfying the performance requirements.
In this way, finite-element analysis can be applied in various conditions, allowing the optimization of various aspects such as object performance and reverse engineering [16,17,18]. It also has the great advantage of being able to repeatedly check load test results that cannot be repeated in reality. As mentioned earlier, the importance of ROPS performance certification is increasing, and at the same time, a simplification of the existing test methods is continuously required. One way to simplify the test methods is to introduce virtual testing, which has the advantages of being less expensive and time-consuming as well as more suitable for complex structure installations. However, a specific method for virtual testing has not been established yet, and most previous studies used empirical methods. In addition, as ROPS behavior is nonlinear, performance testing has to be conducted in conditions very similar to the real ones to increase accuracy; therefore, setting boundary conditions and constraints for the examined finite elements is very important.
The aim of this study was to develop a model for virtual testing as efficient as the performance test method recommended by the OECD tractor code and reflecting the structural characteristics of the ROPS. We propose a simplified model to validate the data obtained by virtual tests based on real-vehicle tests. We verified our model with data collected through repeated tests using a simplified ROPS model in previous research [19].

2. Materials and Methods

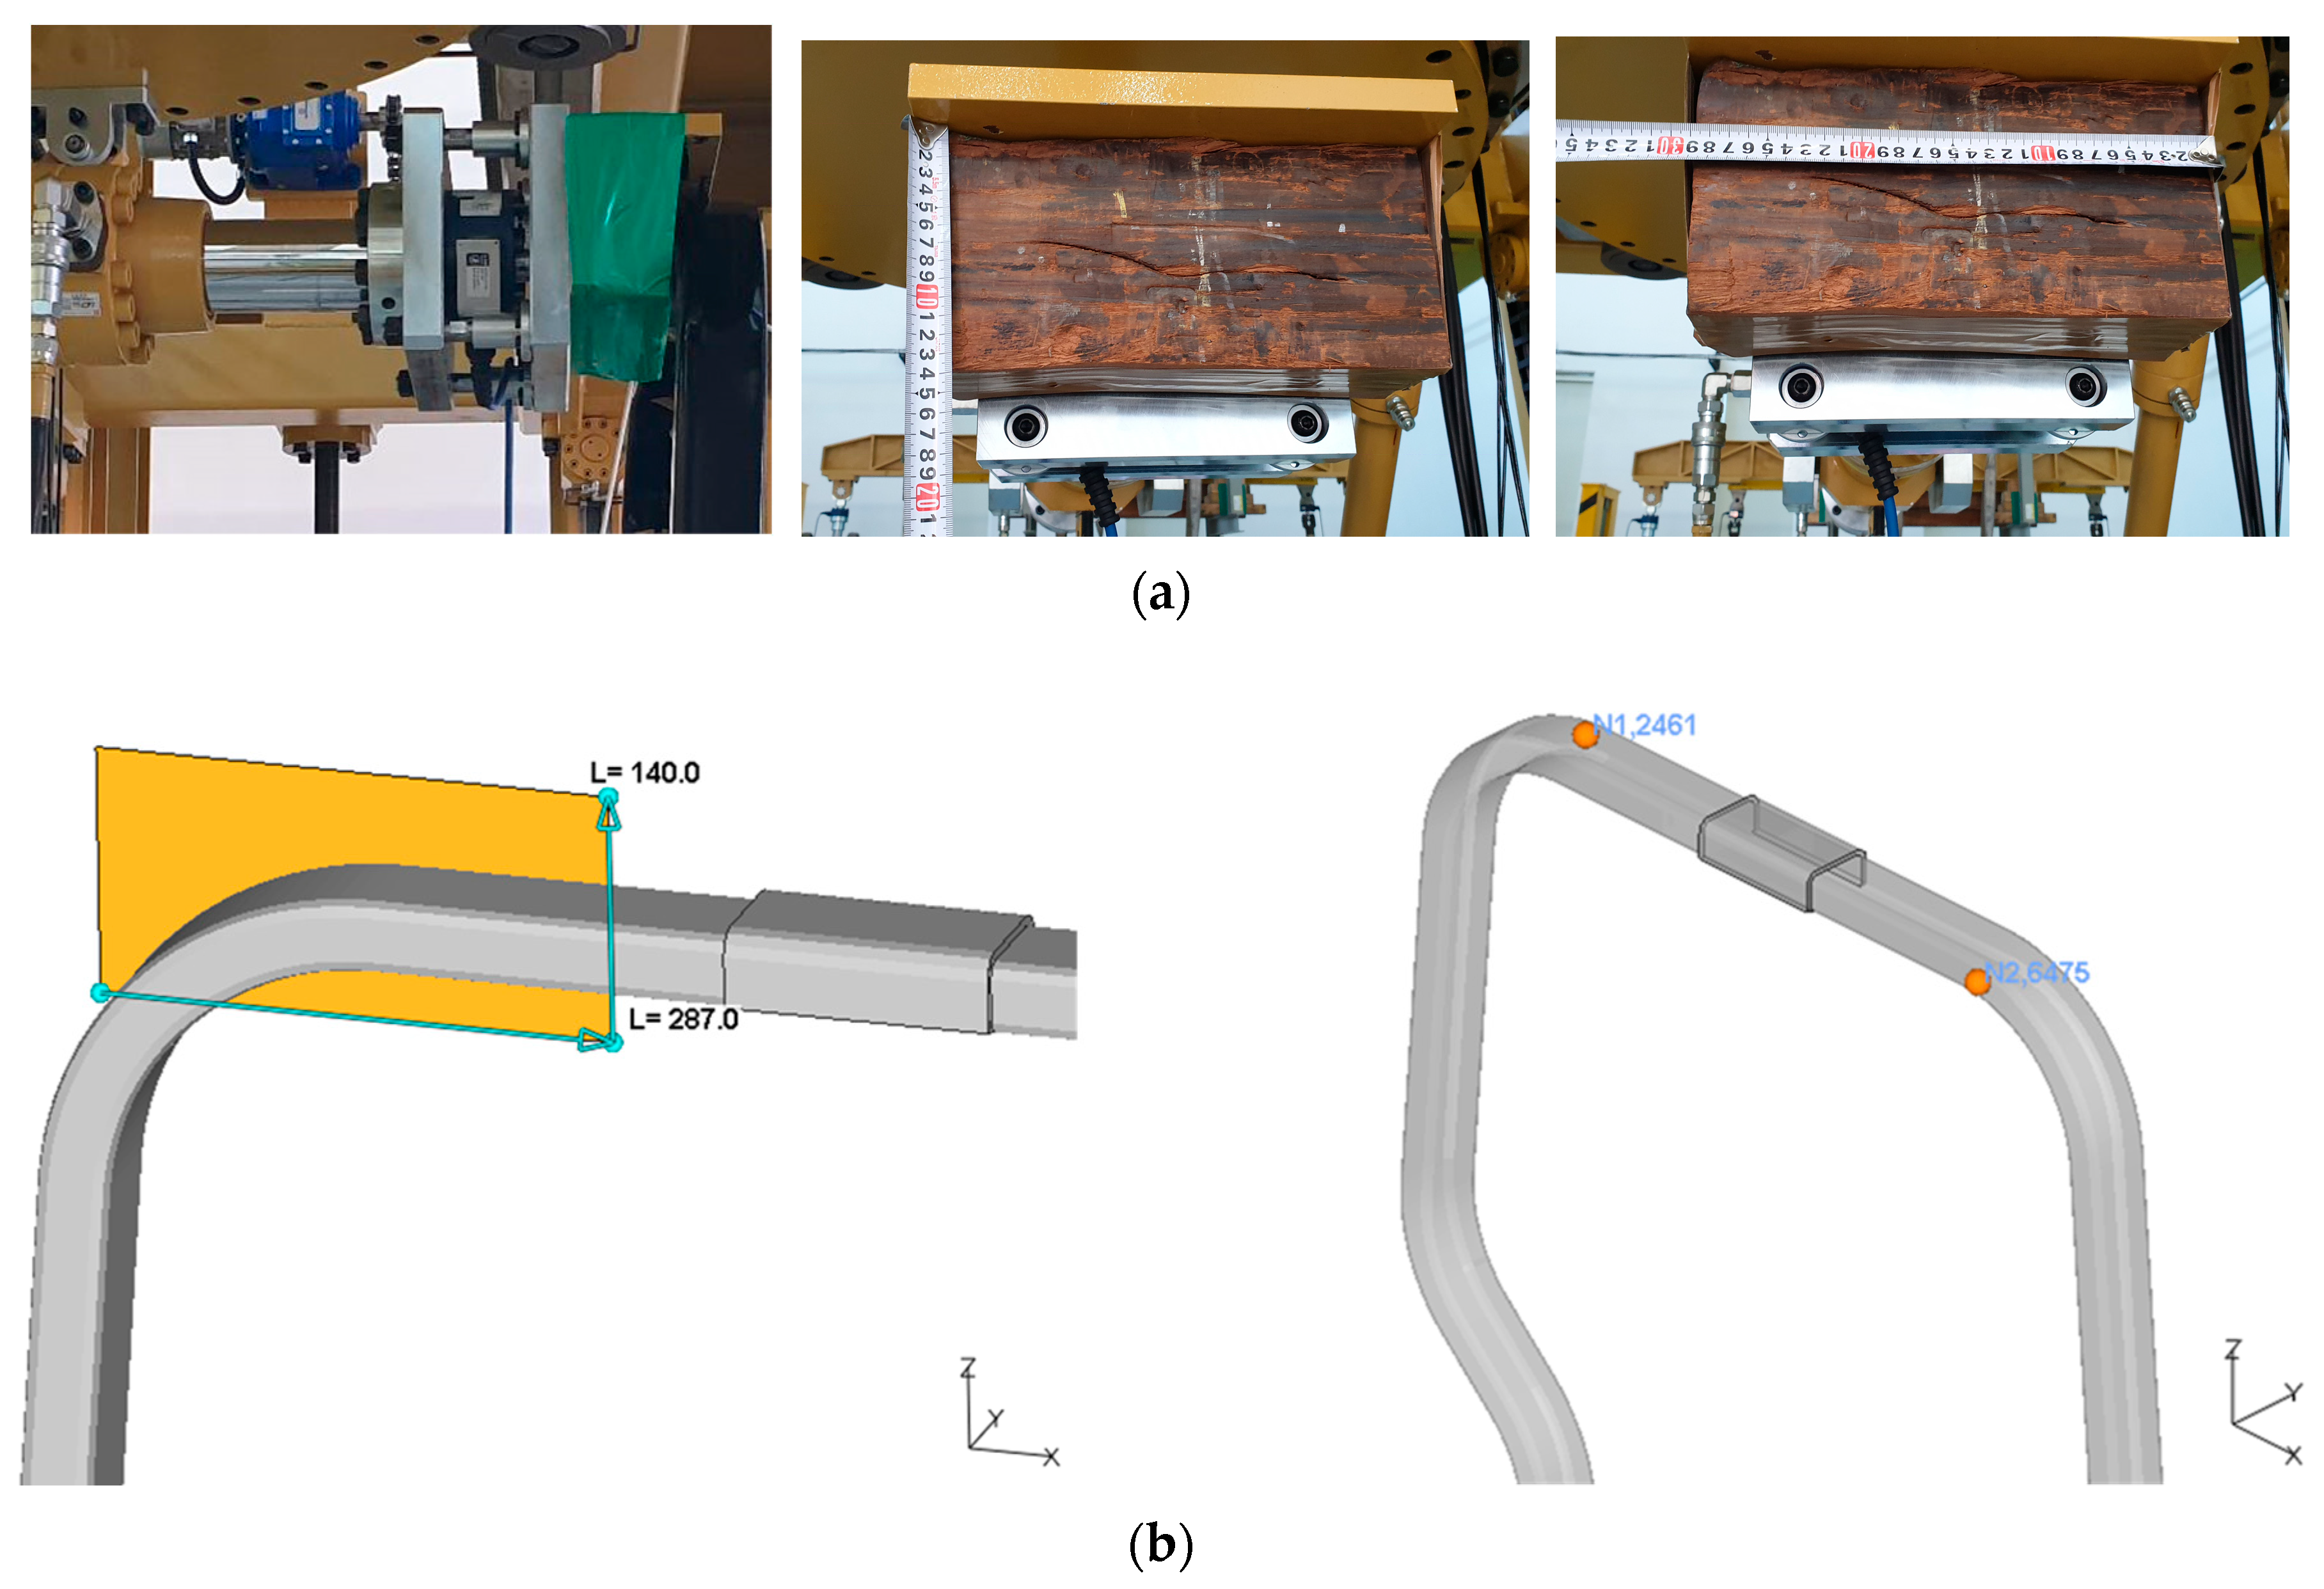
2.1. Experimental Design

In order to improve accuracy when performing finite-element analysis of the ROPS, it is important to select the most appropriate hardening model for the ROPS material. The stiffness of the model can be reduced by including soft deformable elements [20]. Since the shape of the joint portion of bolts is complex, it is difficult to establish it according to the joint conditions. That is why, depending on the purpose of the analysis, it is necessary to select a precise, practical, and simple model. The FE models can be developed for various conditions and can yield results similar to those obtained with actual tests only when suitable elements and constraints are set. Therefore, in this study, a virtual test was conducted by developing an FE model considering the characteristics of the tractor ROPS. Rather than developing a new virtual test software, we verified it with an actual test using a dynamic commercial tool so that users can easily access it. The possibility of virtual testing was confirmed by modeling boundary conditions suitable for the frame-type ROPS and load plates considering actual tests. The procedure for developing the model is shown in Figure 1.
The required energy and forces for the ROPS performance test were calculated using the reference mass of an agricultural tractor of 1650 kg based on OECD code 4. The required energy and force were calculated as 2.310 kJ rear, 2.888 kJ side, and 0.578 kJ front and 33.0 kN crush, respectively. The loading sequence should be as follows: rear, primary crush, lateral, secondary crush, front. The crushing test was performed in both real and virtual tests. However, the crushing test was not analyzed in this study because it is a vertical load, not a concept of force direction and energy absorption.

2.2. Software

In general, various software packages are used for structural analysis. In this study, Marc ver. 2020 (MSC software Corp., Newport Beach, CA, USA), which is widely used for the structural analysis of the tractor ROPS in Korea, was chosen [21]. This is a general-purpose, commercial analysis software package that is compatible with various FE model files and has auto-remeshing and refinement functions useful for the analysis of the nonlinear behavior of the ROPS in load tests. Marc has the advantage of being able to model the behavior according to nonlinear physical properties and environmental characteristics, considering the passage of time, by simply defining a contact model and providing a re-mesh function.

2.3. Simulation Conditions

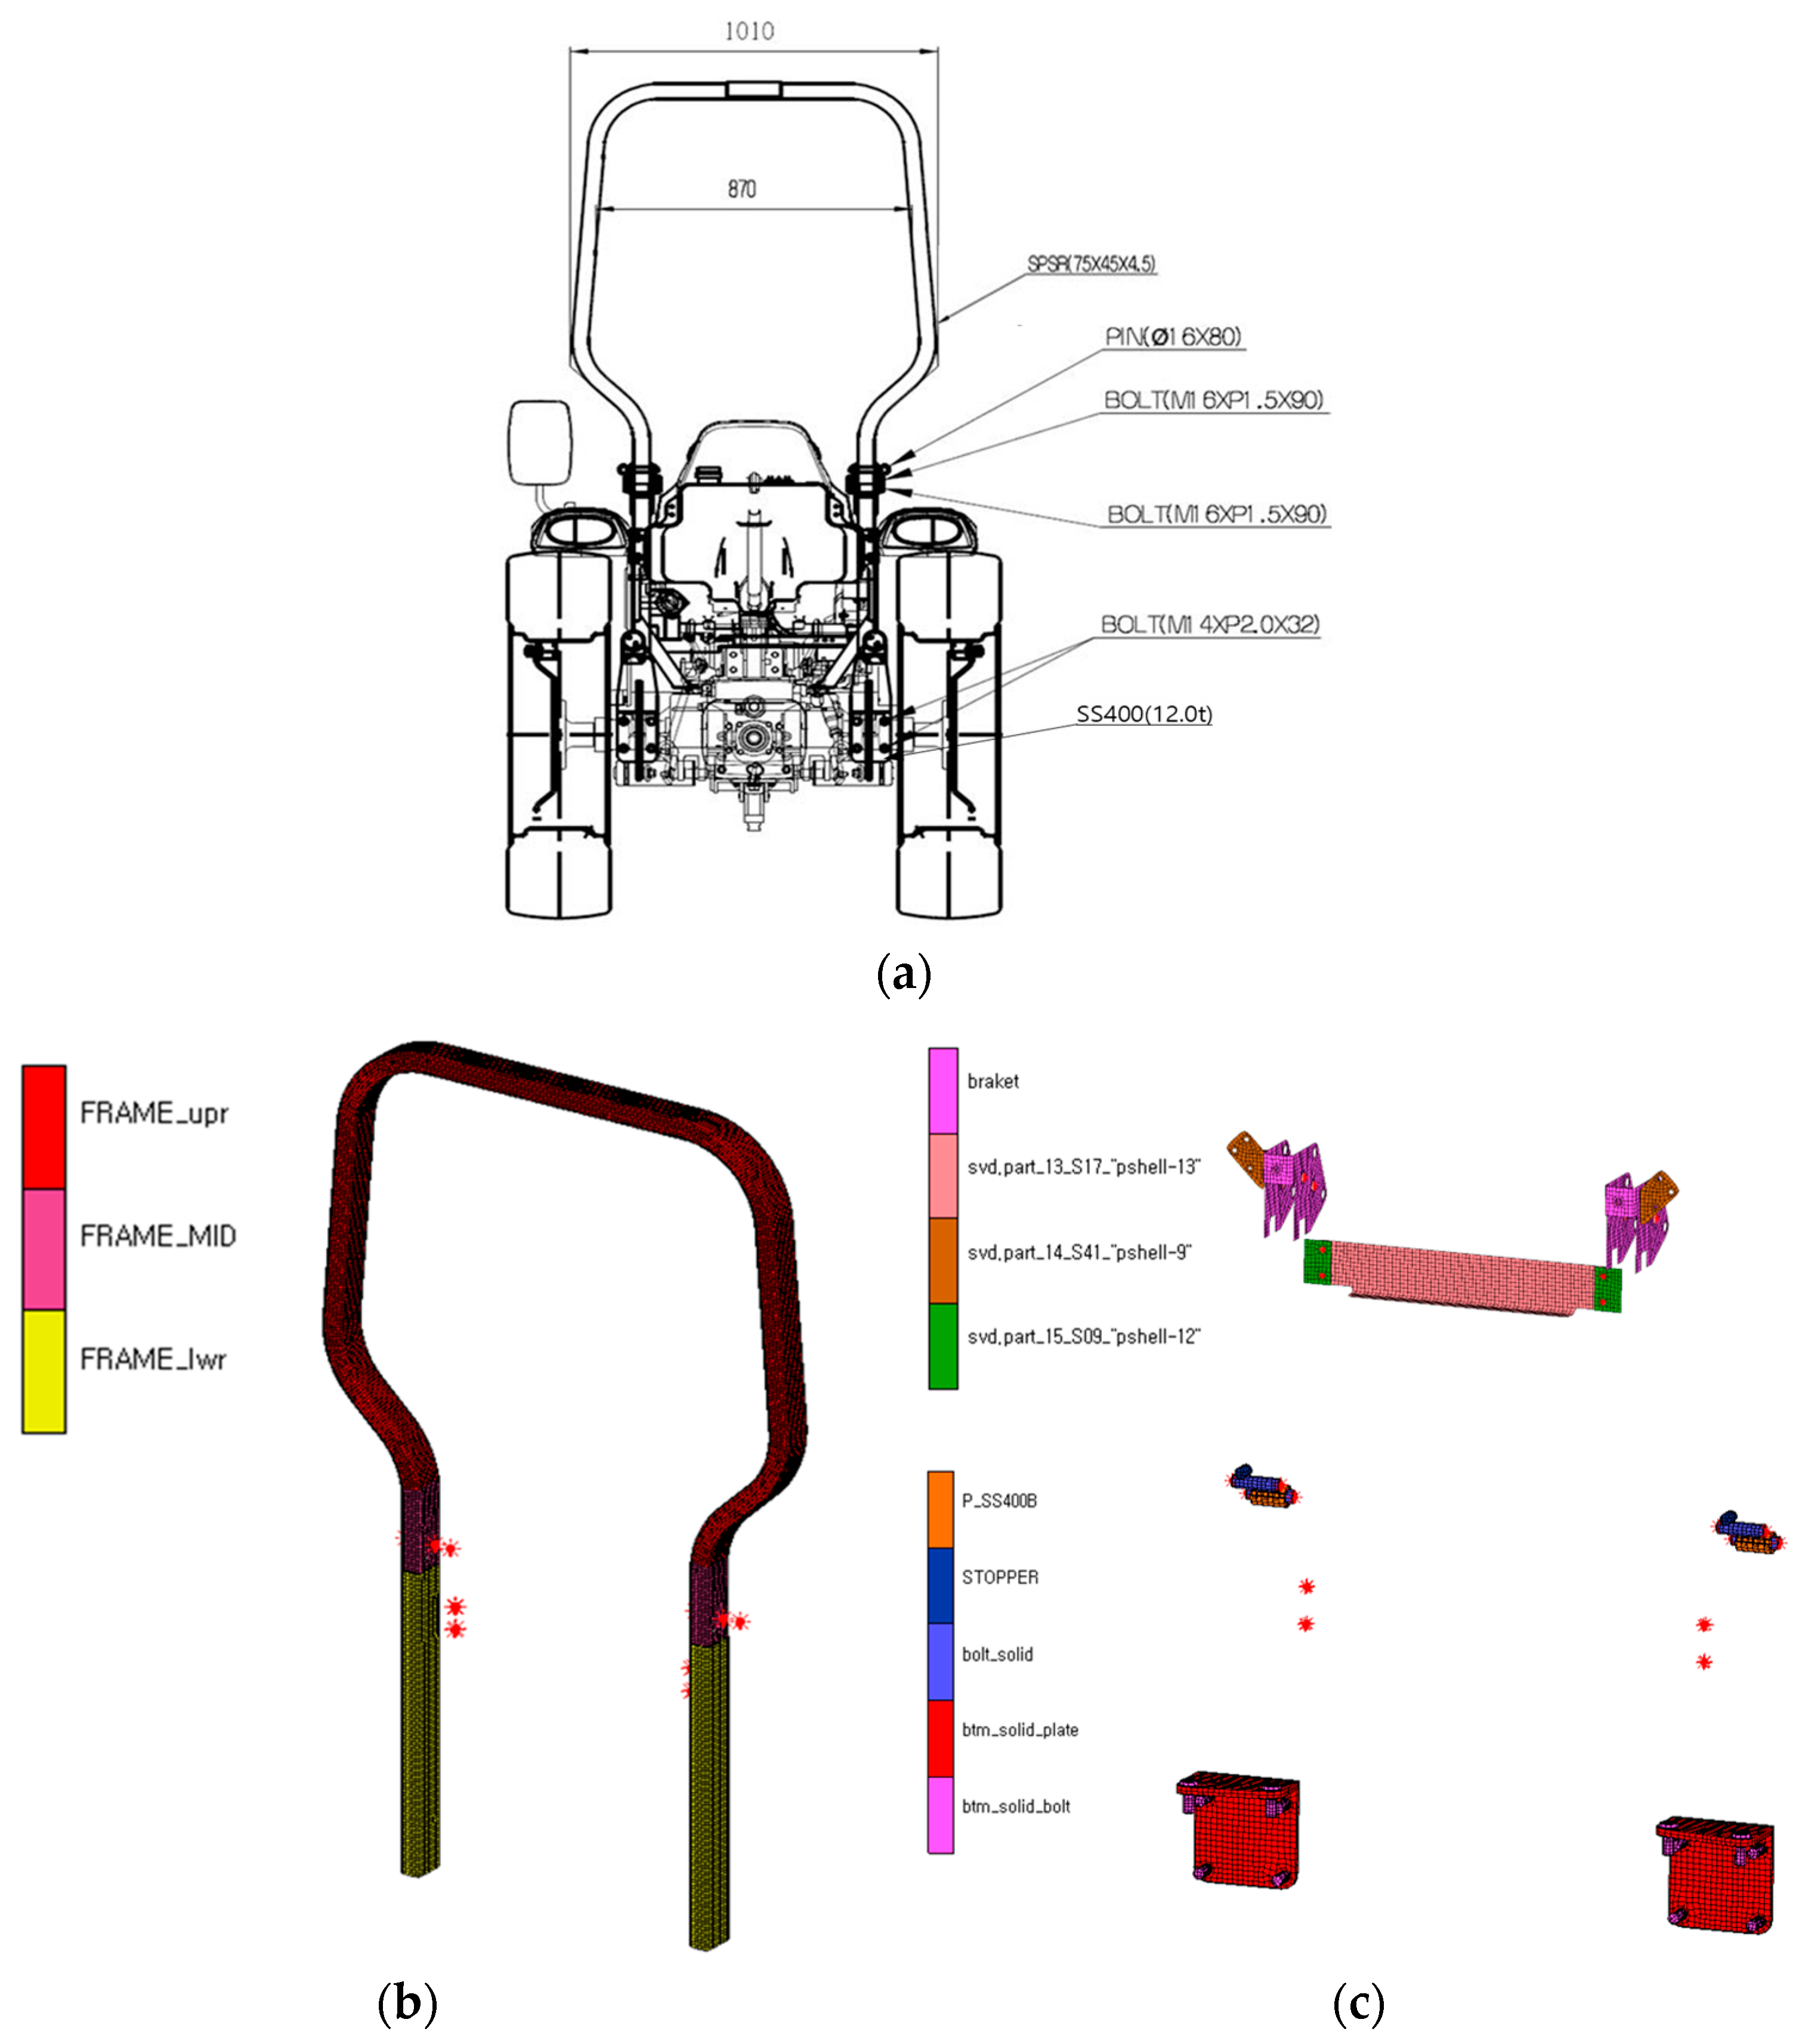
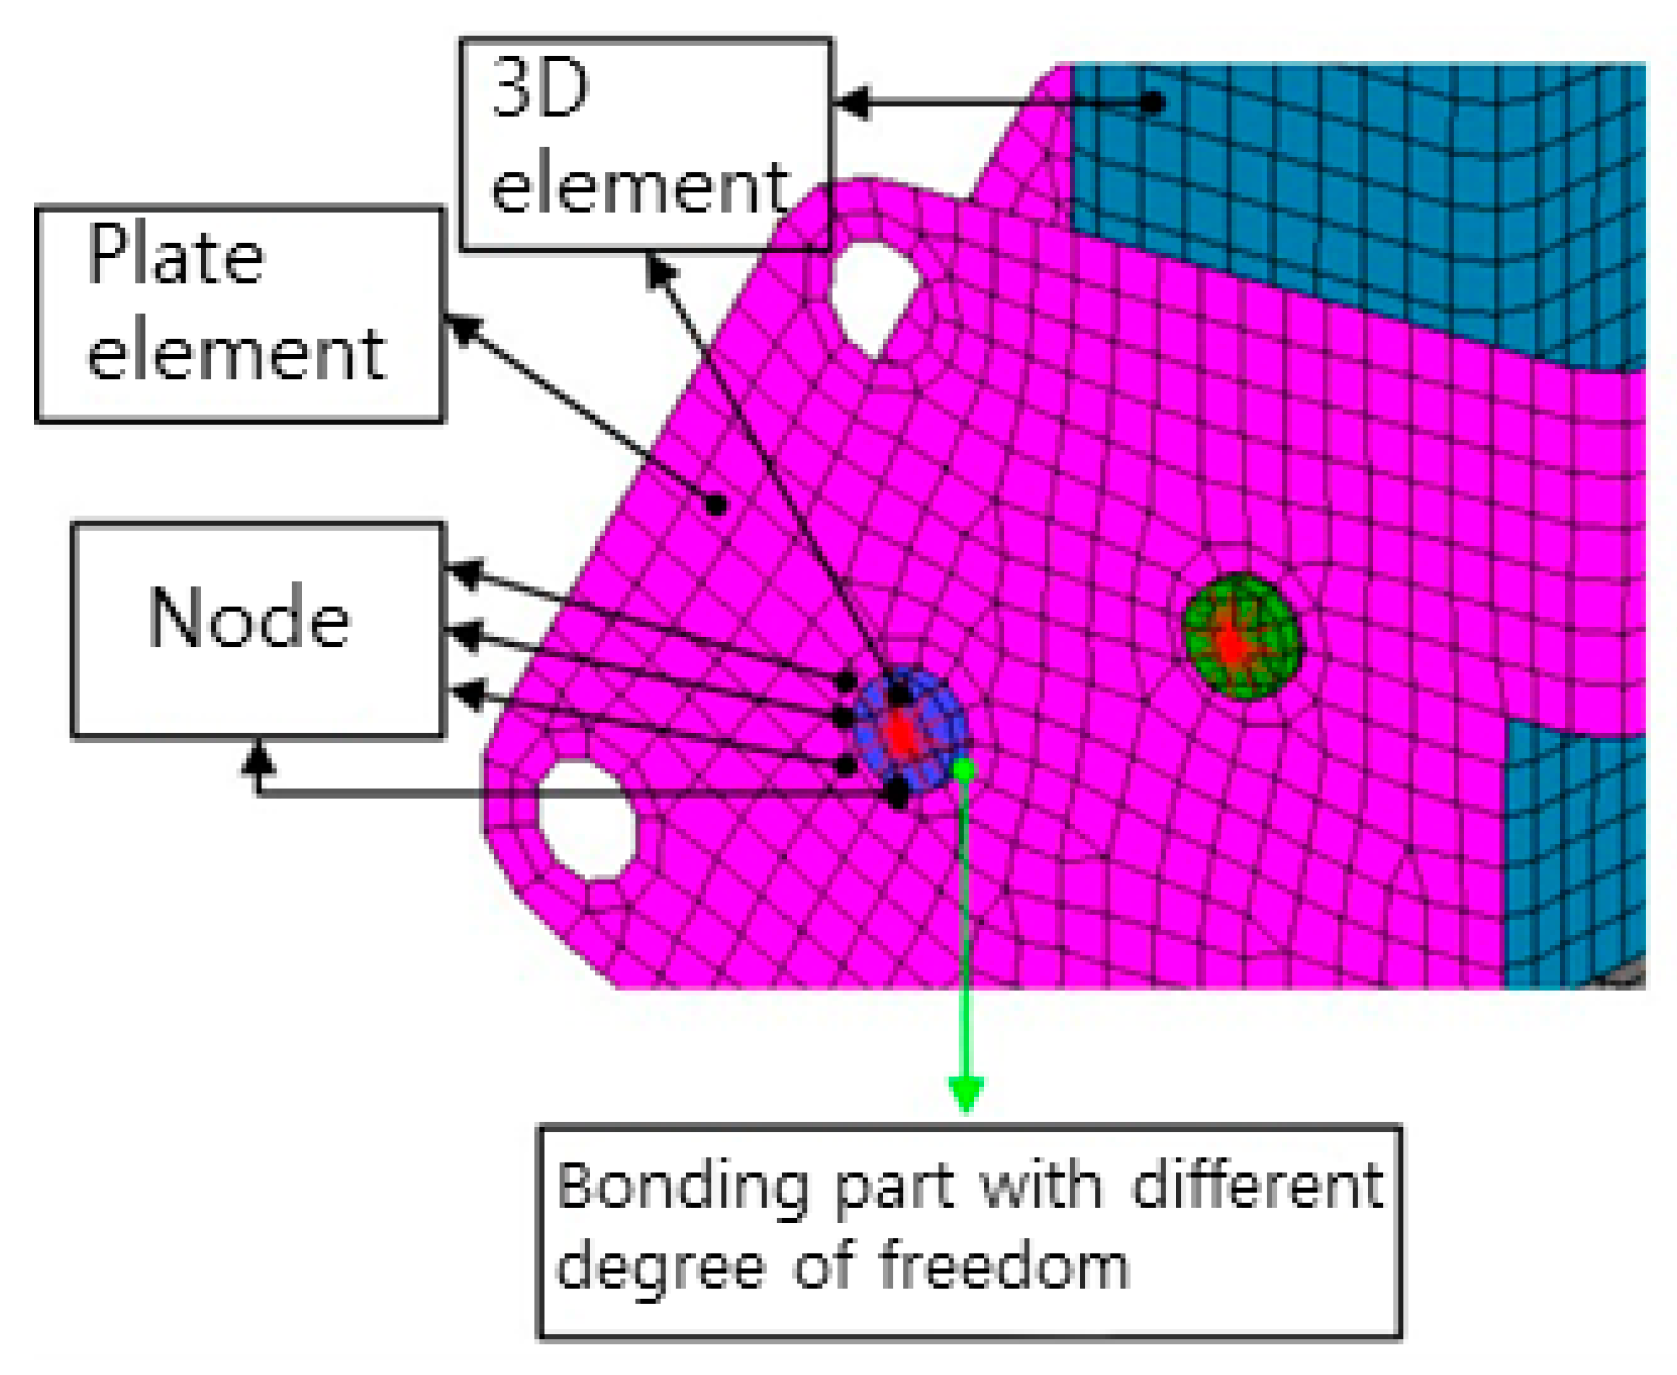
2.3.1. FE Model for the Frame-Type ROPS

For a certification test of ROPS performance, the manufacturer must submit a drawing including detailed information, such as the tractor’s basic characteristics, specifications for each ROPS component, the material used, and the type of assembly and mounting bolts, to an authorized testing agency. The submitted detailed drawings by the tractor manufacturer were used to create the initial FE model for virtual testing. In this study, a 3D model of each ROPS component was developed using Solidworks ver. 2019 (Dassault systems SolidWorks Corp., Waltham, MA, USA) based on a drawing of the tractor, as shown in Figure 2a. The main frame material of the ROPS model was square steel-pipe SPSR, and the folding and mounting portions were made of steel-plate SS400. The FE model used automatic meshing, and local corrections were made for mesh breaks and element shapes. In addition, each component was named and grouped to facilitate finding the requested information for the analysis. A grid was made based on the adaptive FE method for each part, and the shape of each part was accordingly presented. Its advantages allow us to predict and redesign the mesh breaks, shape, etc. for each assembly. Table 1 summarizes the mesh information for the nodes and elements of the entire ROPS and the geometric and material information for each part. The FE model of the ROPS included upper and lower frames, with 26,474 nodes and 25,951 elements. With respect to the shape, there were 24,654 square elements, 217 triangular elements, 792 hexagonal elements, and 276 octagonal elements. The FE model of the generated ROPS is shown in Figure 2b,c. The mainframe, steel plates, pins and mounting plates, and bolts are configured in the same way as the real thing. Therefore, it has the advantage of being able to analyze the FE model by various contact condition methods compared with the real one. In terms of geometry, the mainframe was a 3D shell with upper, middle, and lower parts, and the bolts for folding and mounting the ROPS were 3D solid. Based on previous research, as shown in Figure 3, the true stress–strain values of SS400 and SPSR were used in the simulation. As for the material properties of S45C bolts, the linear properties entered for automatic provision in the analysis software were used.

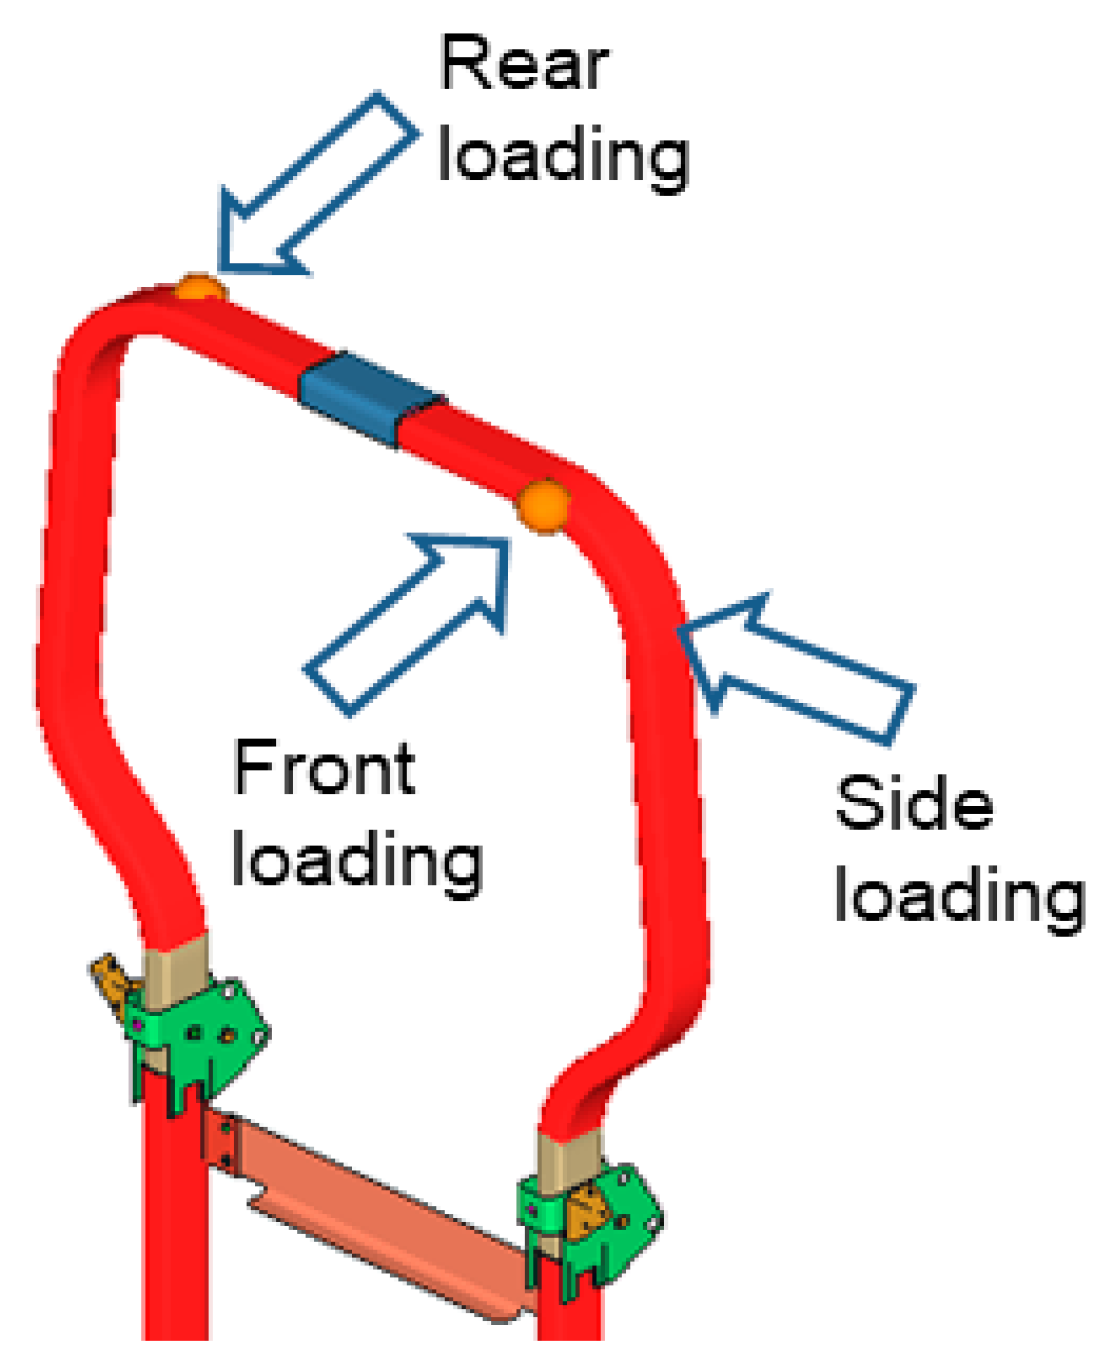
2.3.2. Load Conditions

In the simulation, the load was applied in the rear, side, and front of the ROPS, and the point contact condition was set at the same location as that in the actual test [22]. The evaluation of the ROPS was performed by applying loads with the energy required to simulate real conditions. However, there was no function available in the analysis program to estimate the required energy. Therefore, the representative deformation value for the required energy was selected based on the trail-error method and simulated the model. The load conditions including load direction and point in the ROPS FE model are shown in Figure 4. The ROPS test is a sequential analysis and should take into account the behavior changes caused by the previous test. In particular, the results of the ROPS test can be expressed in a strain–force graph obtained by determining strain energy, displacement, and force over time. The forces applied to the rear, side, and front of the ROPS are represented on the minus Y axis, minus X axis, and Y-axis, respectively.
In the actual test process, as shown in Figure 5a, a load plate of a certain size was attached to the front of the cylinder, and a load was applied. However, since the point of contact was set in the analysis, 2D plate elements were implemented by directly measuring the actual size of the load plate. The number of nodes for the central contact position of the plate element implemented in the analysis was 12,461 for the rear load and 26,475 for the front load, as shown in Figure 5b. As shown in Figure 6a, a load plate was installed to prevent the slipping and separation of the cylinder in order to apply the side load, and after measuring its size, a 2D plate element was introduced in the model, as shown in Figure 6b.

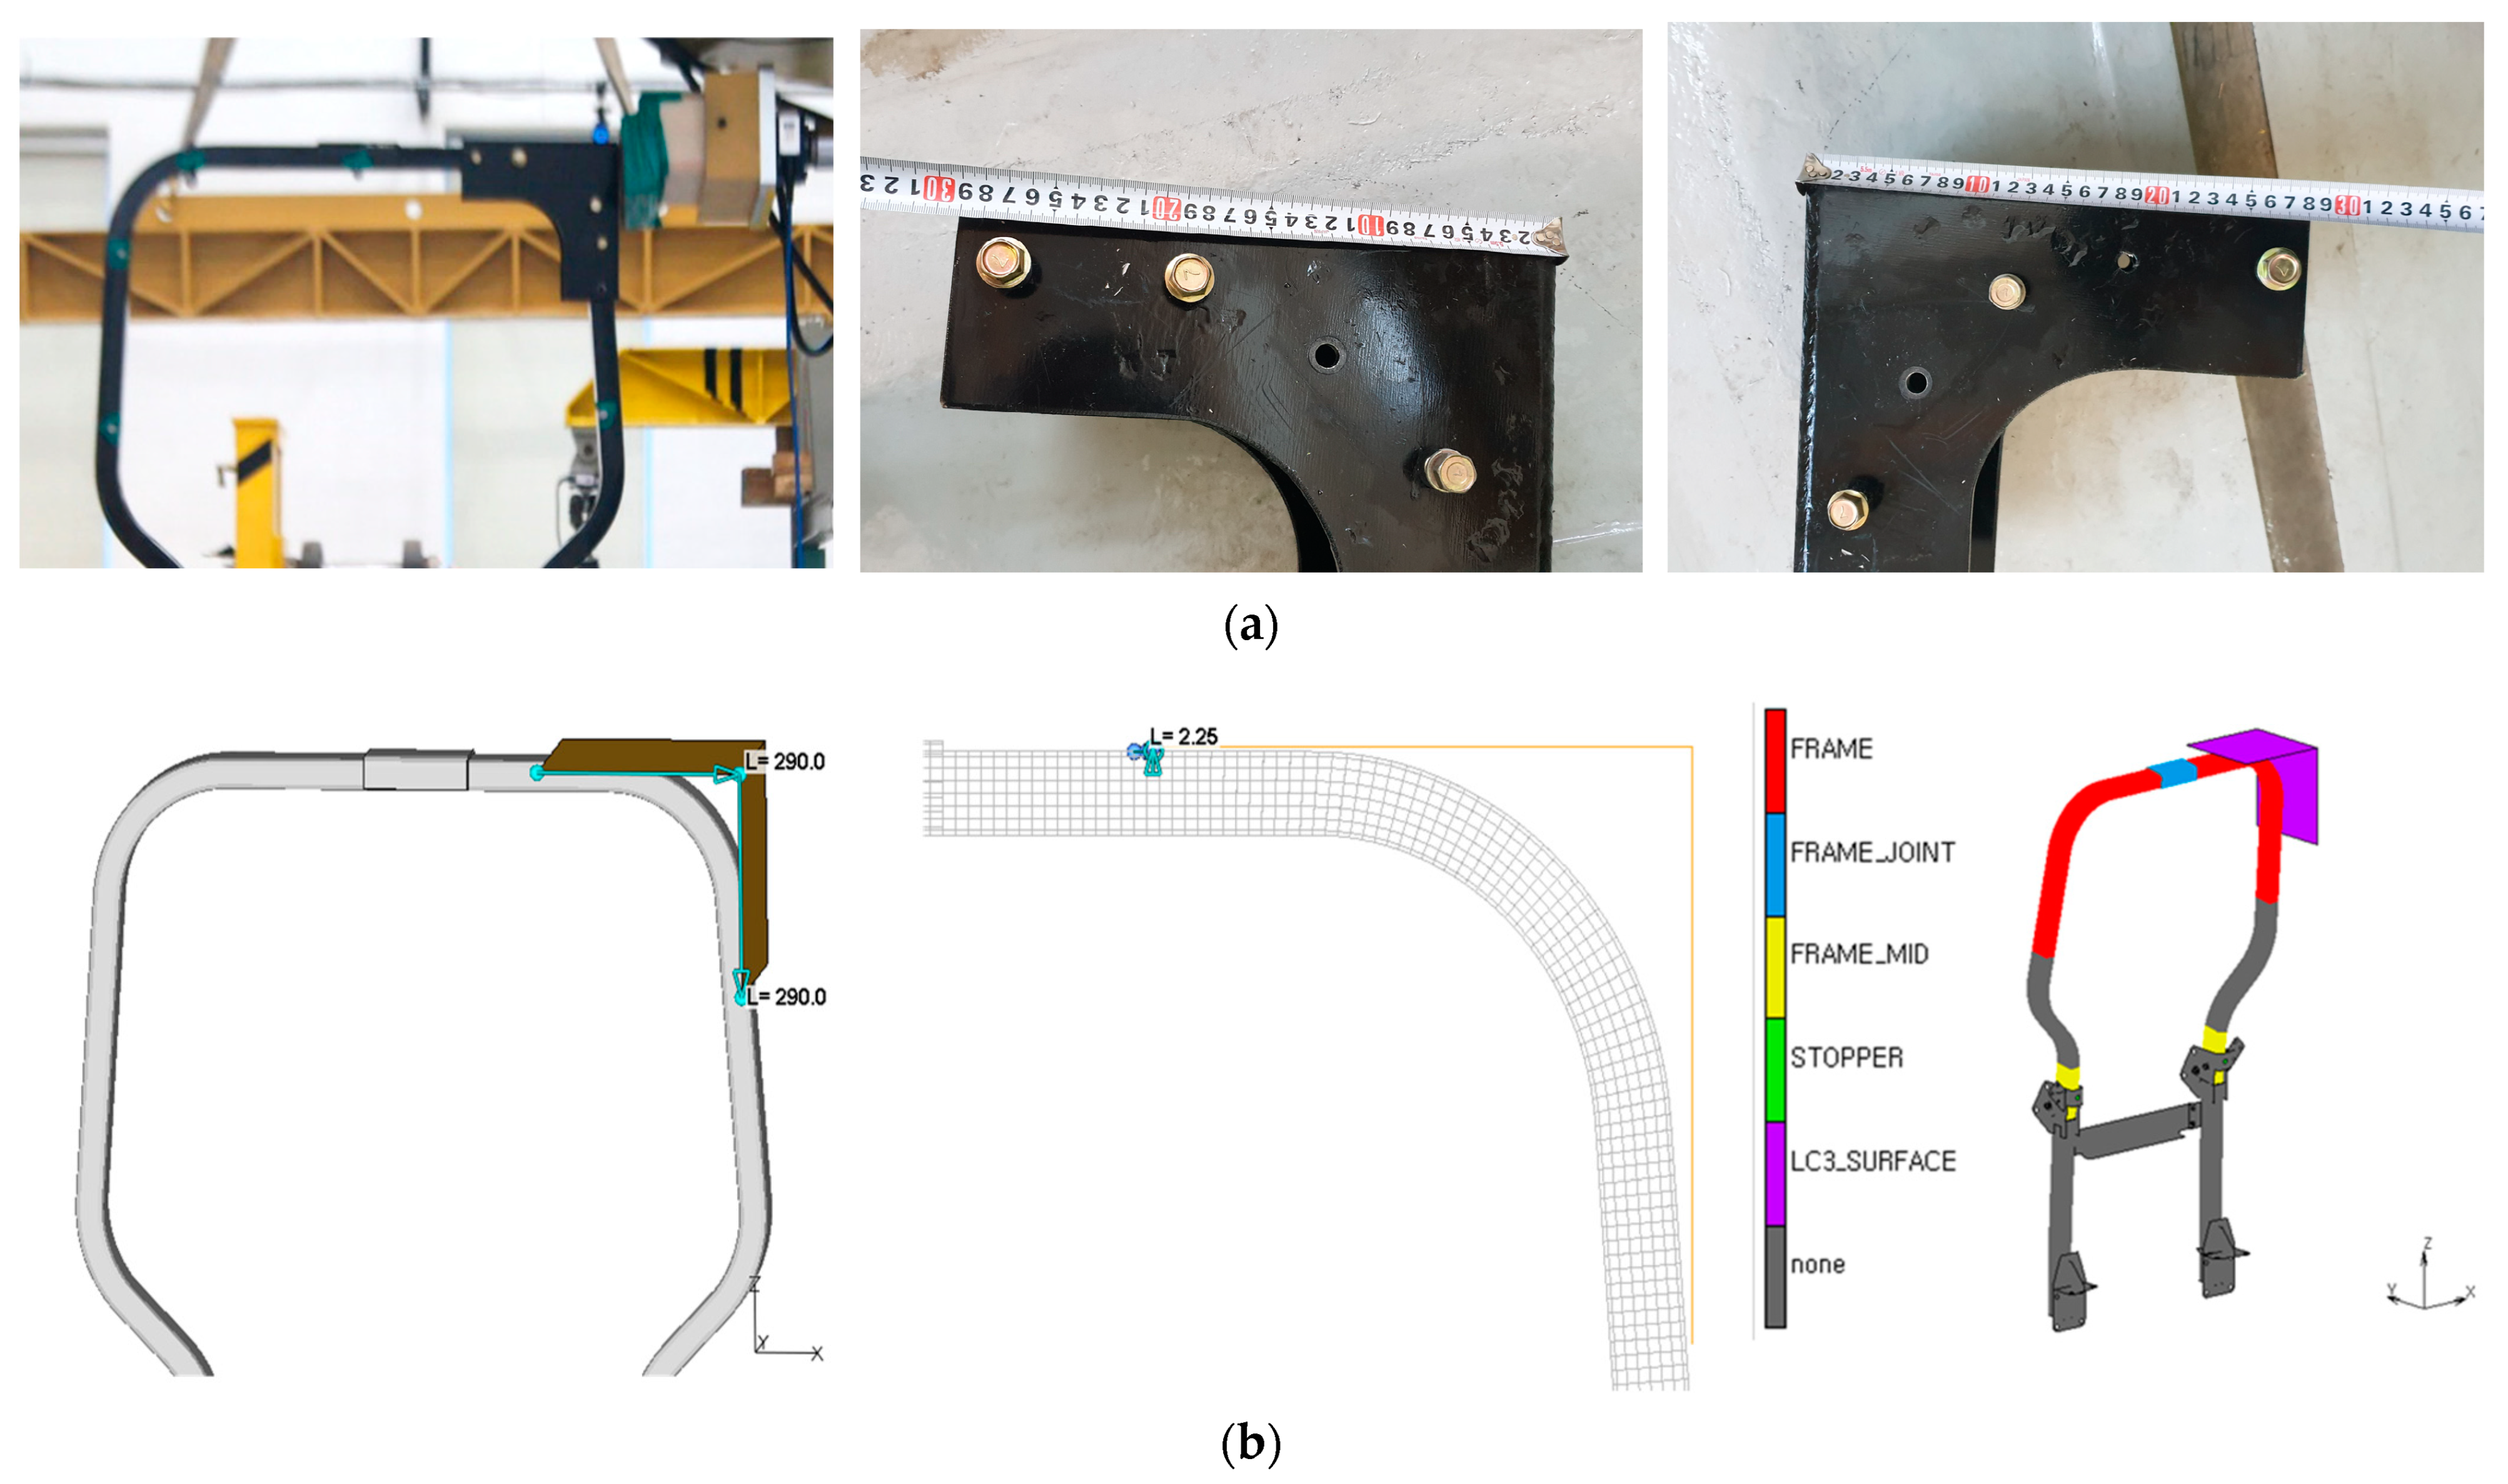
2.3.3. Boundary Conditions

In the FE model, the mounting and folding parts of the ROPS consist of three-dimensional elements (3D shell, solid) connected to plate elements (2D plate). Therefore, when connecting solid elements and plate elements as well as beam elements in the normal direction of the plate elements, a hinge may be introduced. Therefore, a detailed analysis is required. The 3D solid elements have 3 degrees of freedom per node, while the shell plate elements have 6 degrees of freedom per node and generally are not stiff in the normal direction. The ROPS has a relatively complex shape in which solids and shell plates are geometrically connected. The boundary conditions regarded (1) the portion of the ROPS attached to the tractor and (2) the folding portion of the ROPS; the model was developed with two variables. As shown in Figure 7a, instead of 10 bolts for ROPS mounting, it was applied as a rigid body element (except for the bolt modeling process). For the second condition, we modeled the bolts as shown in Figure 7b and then constrained the displacement of the bolts on the x, y, and z axes on a rigid body, as shown in Figure 7c.
The ROPS upper frame can be folded for work convenience. As shown in Figure 8, it was difficult to model a behavior similar to the actual one when a load was applied because in the folding region, a solid element and a plate element were bound and had different degrees of freedom. Therefore, in this study, boundary conditions were set so that the FE model could obtain results that were as close to reality as possible. The boundary conditions were set as follows: (1) the bolts in the folding part were set to rigid restraints, (2) all fastening parts outside the bolts were connected, and (3) the fastening part inside the bolts was set free to rotate in the axial direction. In this study, boundary conditions were defined according to the Korean national standard [23]. This study focused on developing and verifying a virtual test model, and because too much content had to be covered to provide all mathematical equations, it was omitted, which can be confirmed in the standard. Table 2 shows the comparison between the existing methods and this study. The existing method, which did not consider the physical properties of the mounting bolt and the behavior of the connection, and the method of this study, which considered the physical properties of the modeled bolt and the contact condition of the connection, were compared. In addition, we compared it with the virtual test based on data from previous studies such as ROPS actual test, which did not exist until now.

2.3.4. Selection of the Mesh Size

If the same mesh is applied throughout the analysis, and deformation occurs in various parts during the structural analysis, some serious errors may occur, making it difficult to guarantee reliability. To reduce these errors, engineers often locally use fine meshes over the entire finite-element model. This is inefficient in terms of computing resources and time required for the analysis [24]. Also, the meshes of small size do not prevent excessive deformation in an unpredictable dynamics analysis. Therefore, it is important to find the optimal mesh size rather than simply choose a large or a small mesh size [25]. Therefore, in order to evaluate the effect of the mesh size on the FEA of the performance of the ROPS, five mesh sizes, i.e., 4, 6, 8, 10, and 15 mm, were selected using the re-meshing function, as shown in Figure 9. The optimal mesh size was selected by evaluating the difference between the actual test results and those of the FE model.

3. Results and Discussion

3.1. Performance of ROPS Simulation Test

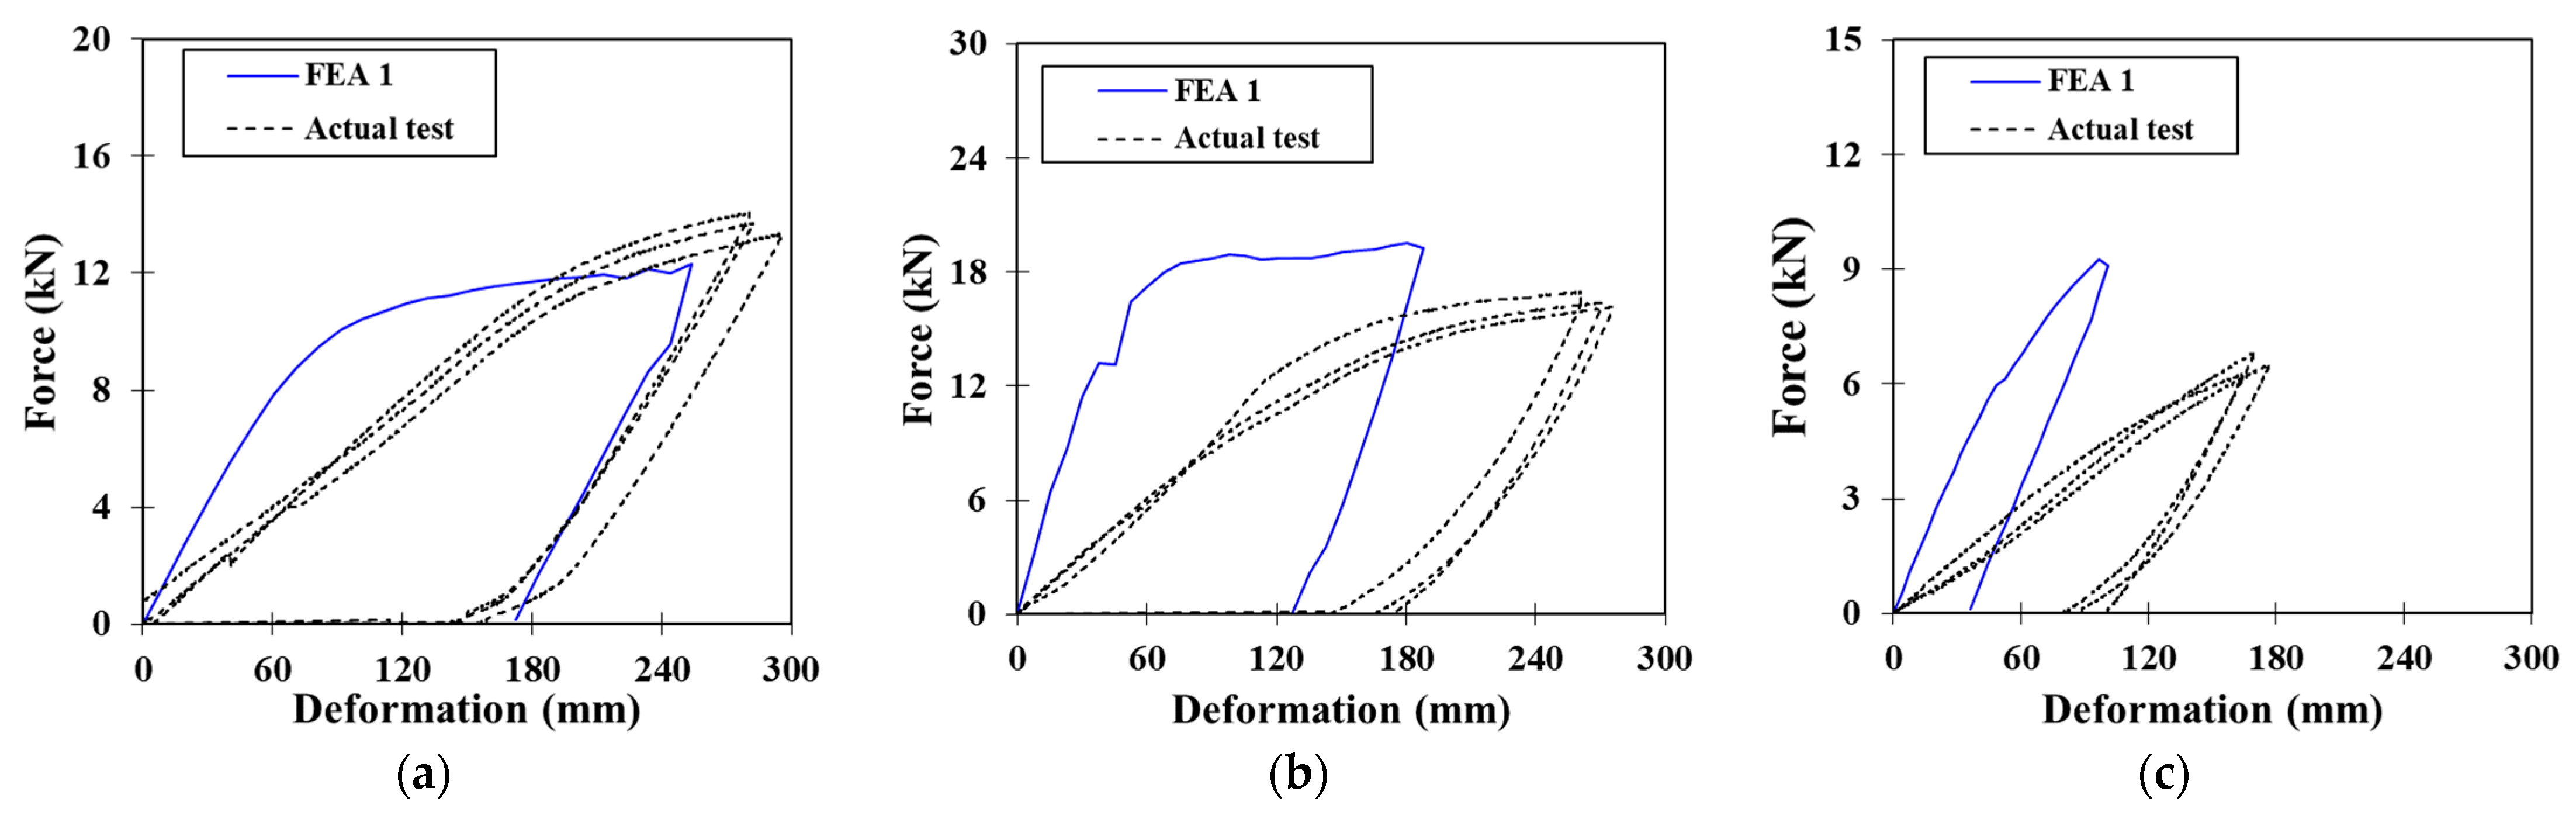
3.1.1. Results by Boundary Conditions Rigid Body Element (FEA 1)

The automatic meshing with a mesh size of 6 mm was applied in the simulation. As a result of the simulation, we measured a force of 12.301 kN on the rear load, 19.515 kN on the side load, and 9.267 kN on the front load, and the corresponding values of maximum deformation were 253.9, 180.6, and 96.9 mm, respectively. Figure 10 shows a force–deformation graph that compares the obtained actual test values from a previous study with the virtual test values. It is evident that, in the simulation, the force sharply increased in each loading direction at the beginning, after the application of the load. This was not observed in the actual test. Because the folding part and the bolt mounting part of the ROPS were set to rigid constraints, a stress stiffening effect occurred. Therefore, it was measured to have higher rigidity and smaller deformation than the actual test.
The errors and simulation results of FEA 1 are summarized in Table 3. The force and maximum deformation in the different loading directions were significantly different. In particular, the force error at the front load reached 43.4%. One-sample t-tests were performed comparing the mean force and the mean deformation measured in the actual test and in the simulation. As shown in Table 4, we found significant differences according to the p values at the confidence level of 95%.

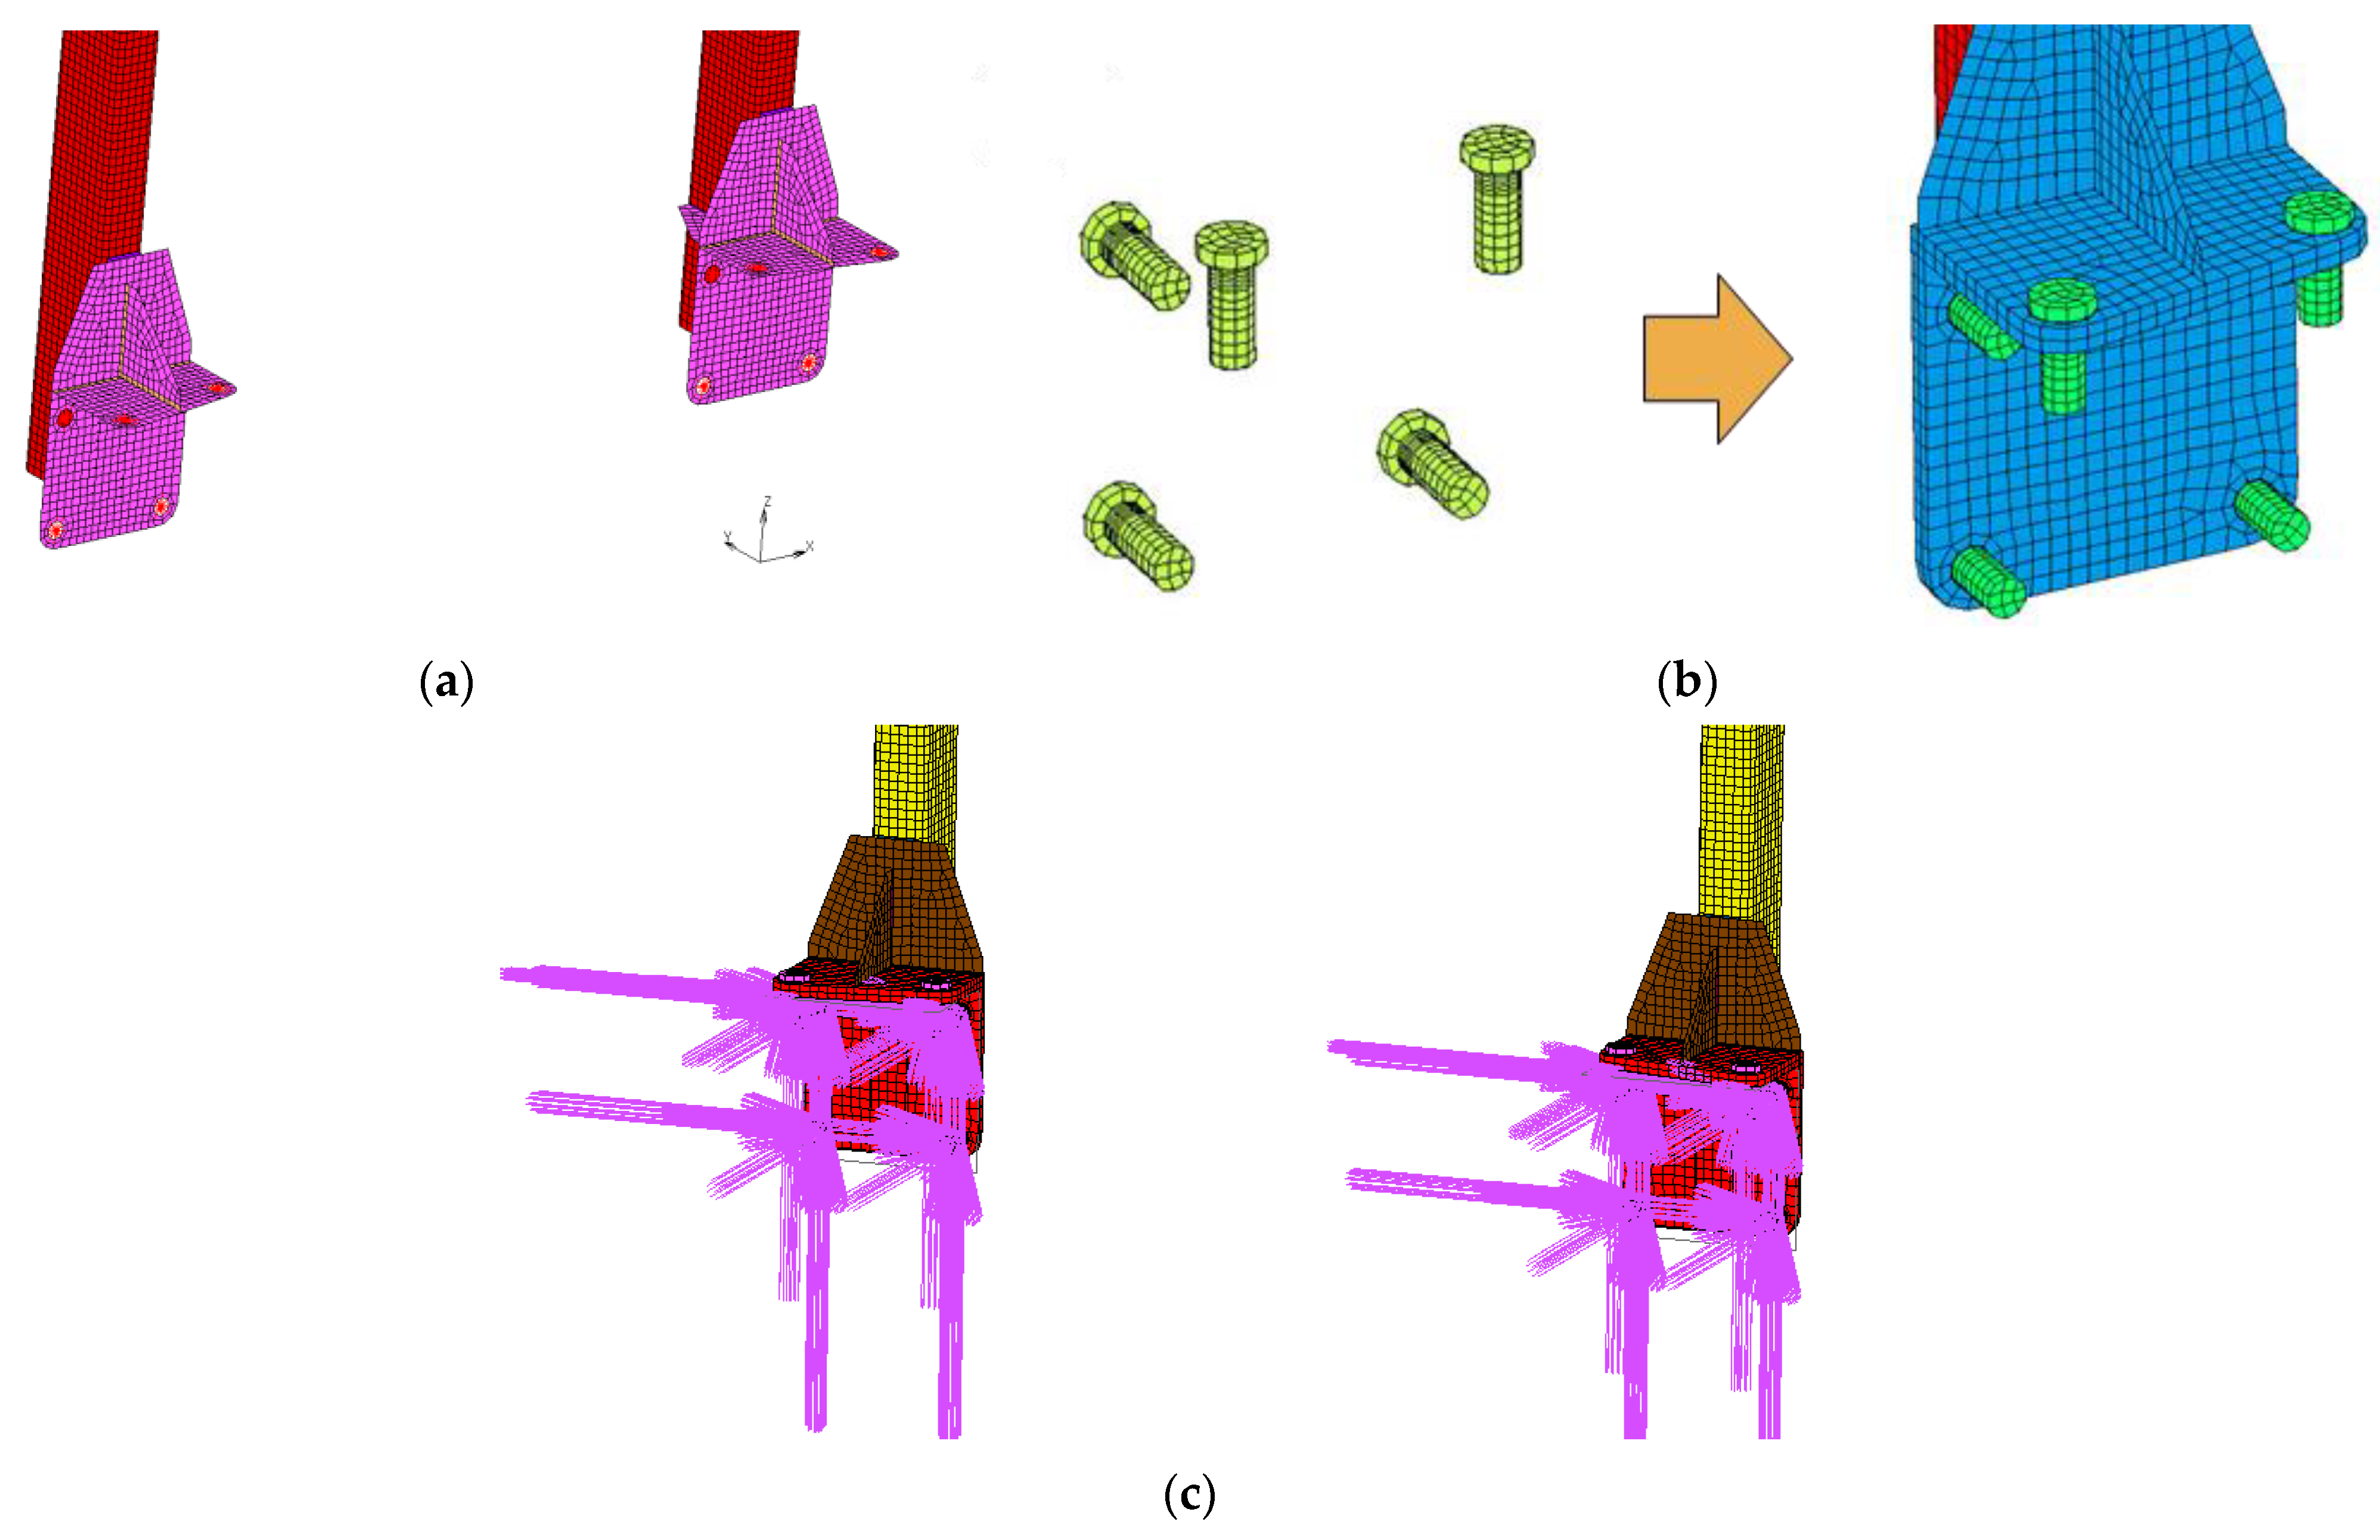
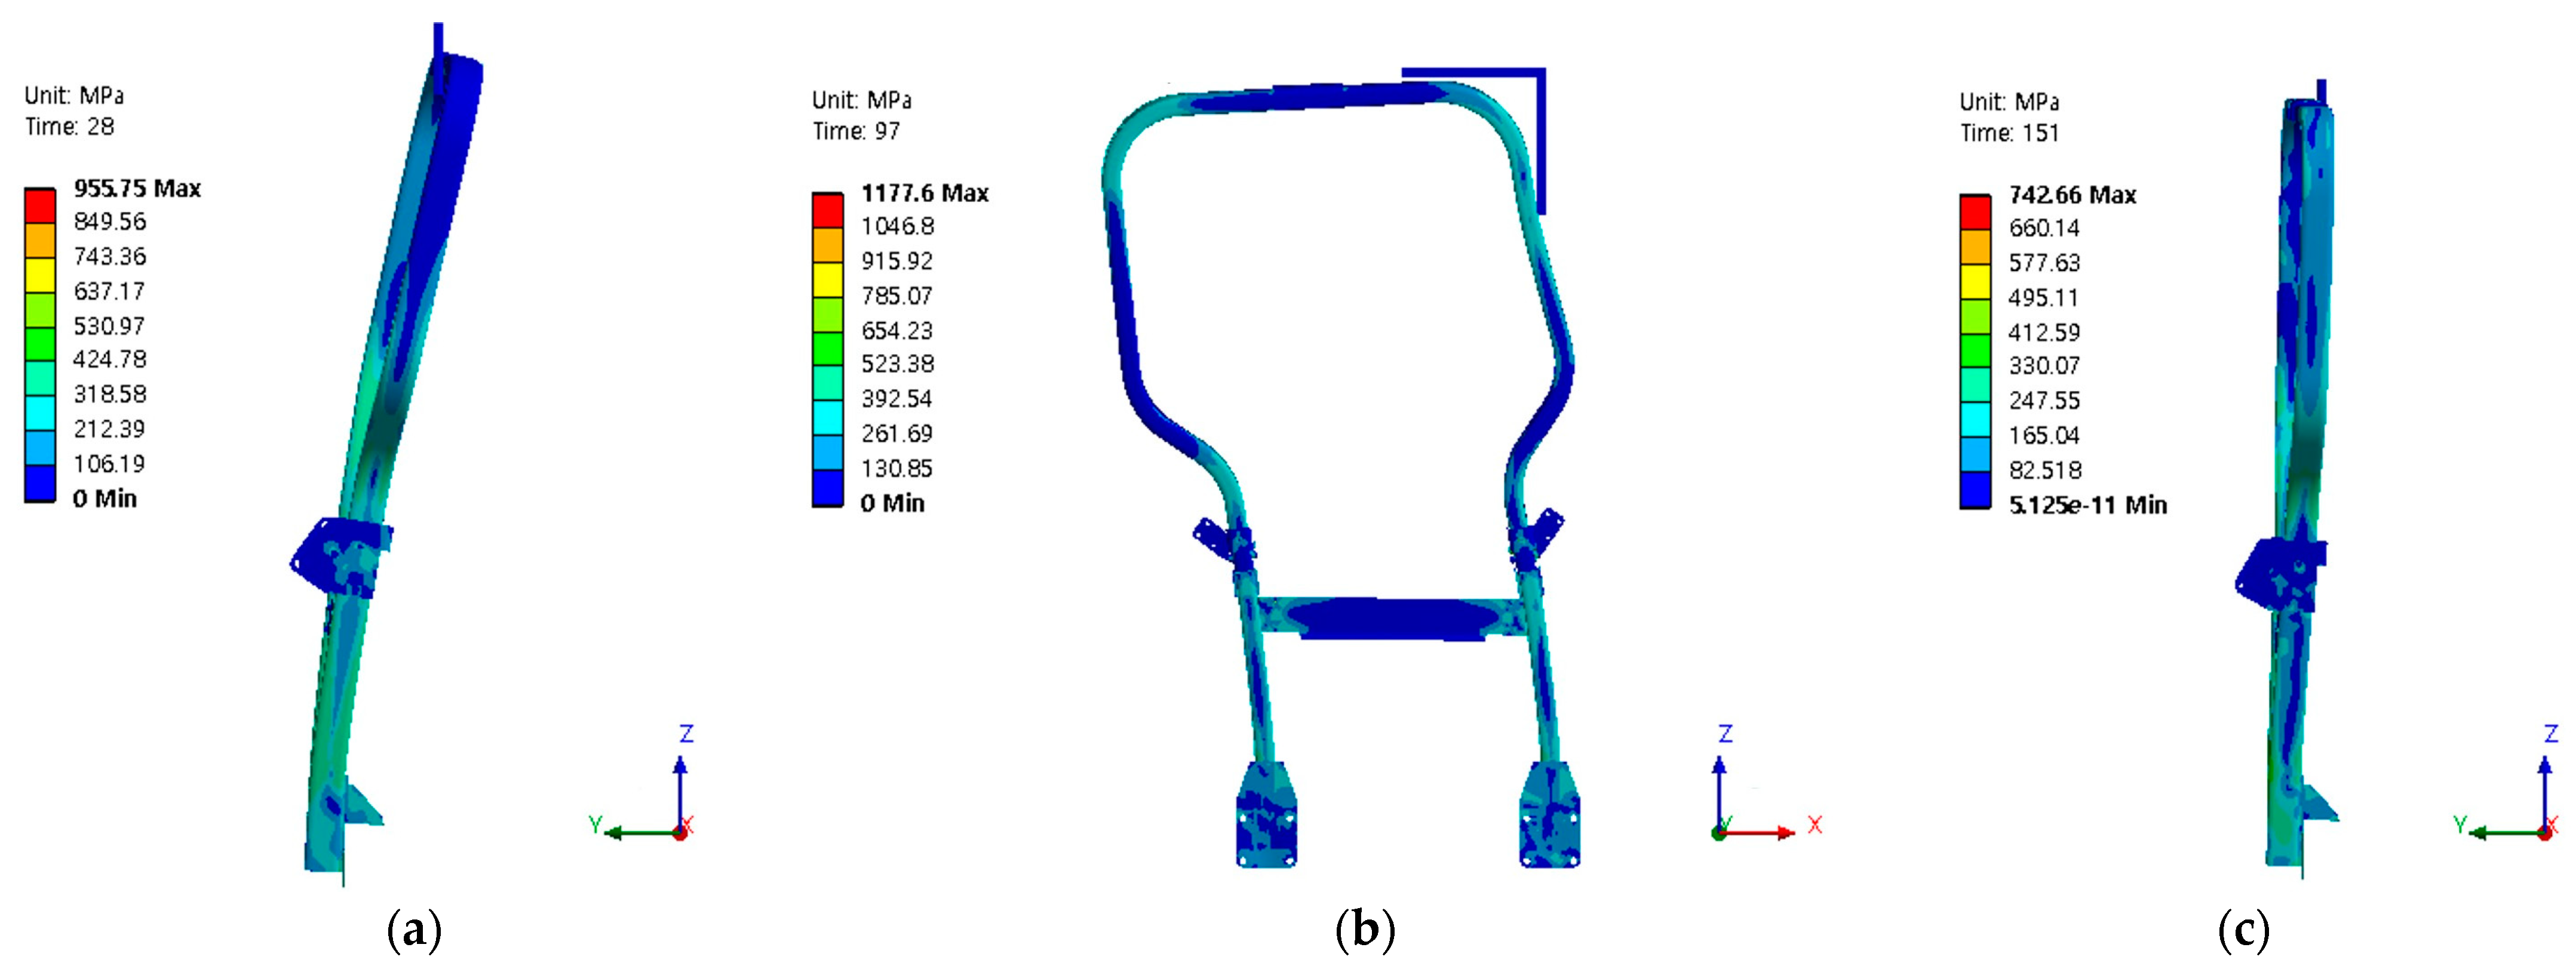
3.1.2. Results by Bolt Modeling and Free Axial Rotation (FEA 2)

External conditions such as load plates were implemented in the same way as in the actual test. In addition, the characteristics of the ROPS contact site were reflected in the FEA boundary conditions. The test of the FE model was performed by setting the contact conditions of the mounting bolt and the folding steel plate. Figure 11 shows the FEA 2 stress distribution and deformation results of ROPS loading. A comparison between the simulation and the actual test is shown in the graphs in Figure 12. The graph obtained with the simulation appeared similar in shape to that obtained with the actual test. As before, a stress stiffening effect was seen at the beginning of the test. In fact, when compared with the actual test, the force at the beginning linearly increased as the deformation reached about 70 mm. But the errors were smaller overall. Table 5 shows the results for each load direction and the corresponding errors. We measured a force of 12.789 kN on the rear load, 17.135 kN on the side load, and 6.911 kN on the front load. The maximum deformation was 298.5 mm at the rear, 243.8 mm at the side, and 153.9 mm at the front. In summary, we found that the errors of load force and corresponding deformation were as follows: rear force 6.5%, deformation 4.4%; side force 5.1%, deformation 9.4%; front force 7.0%, deformation 9.6%. Overall, it showed significantly better performance than FEA 1. The results of one-sample t-tests comparing the actual and the FEA test results are shown in Table 6. We found significant differences only for the forward load deformation and the lateral load force and deformation, as indicated by the small p-value at a confidence level of 95%.

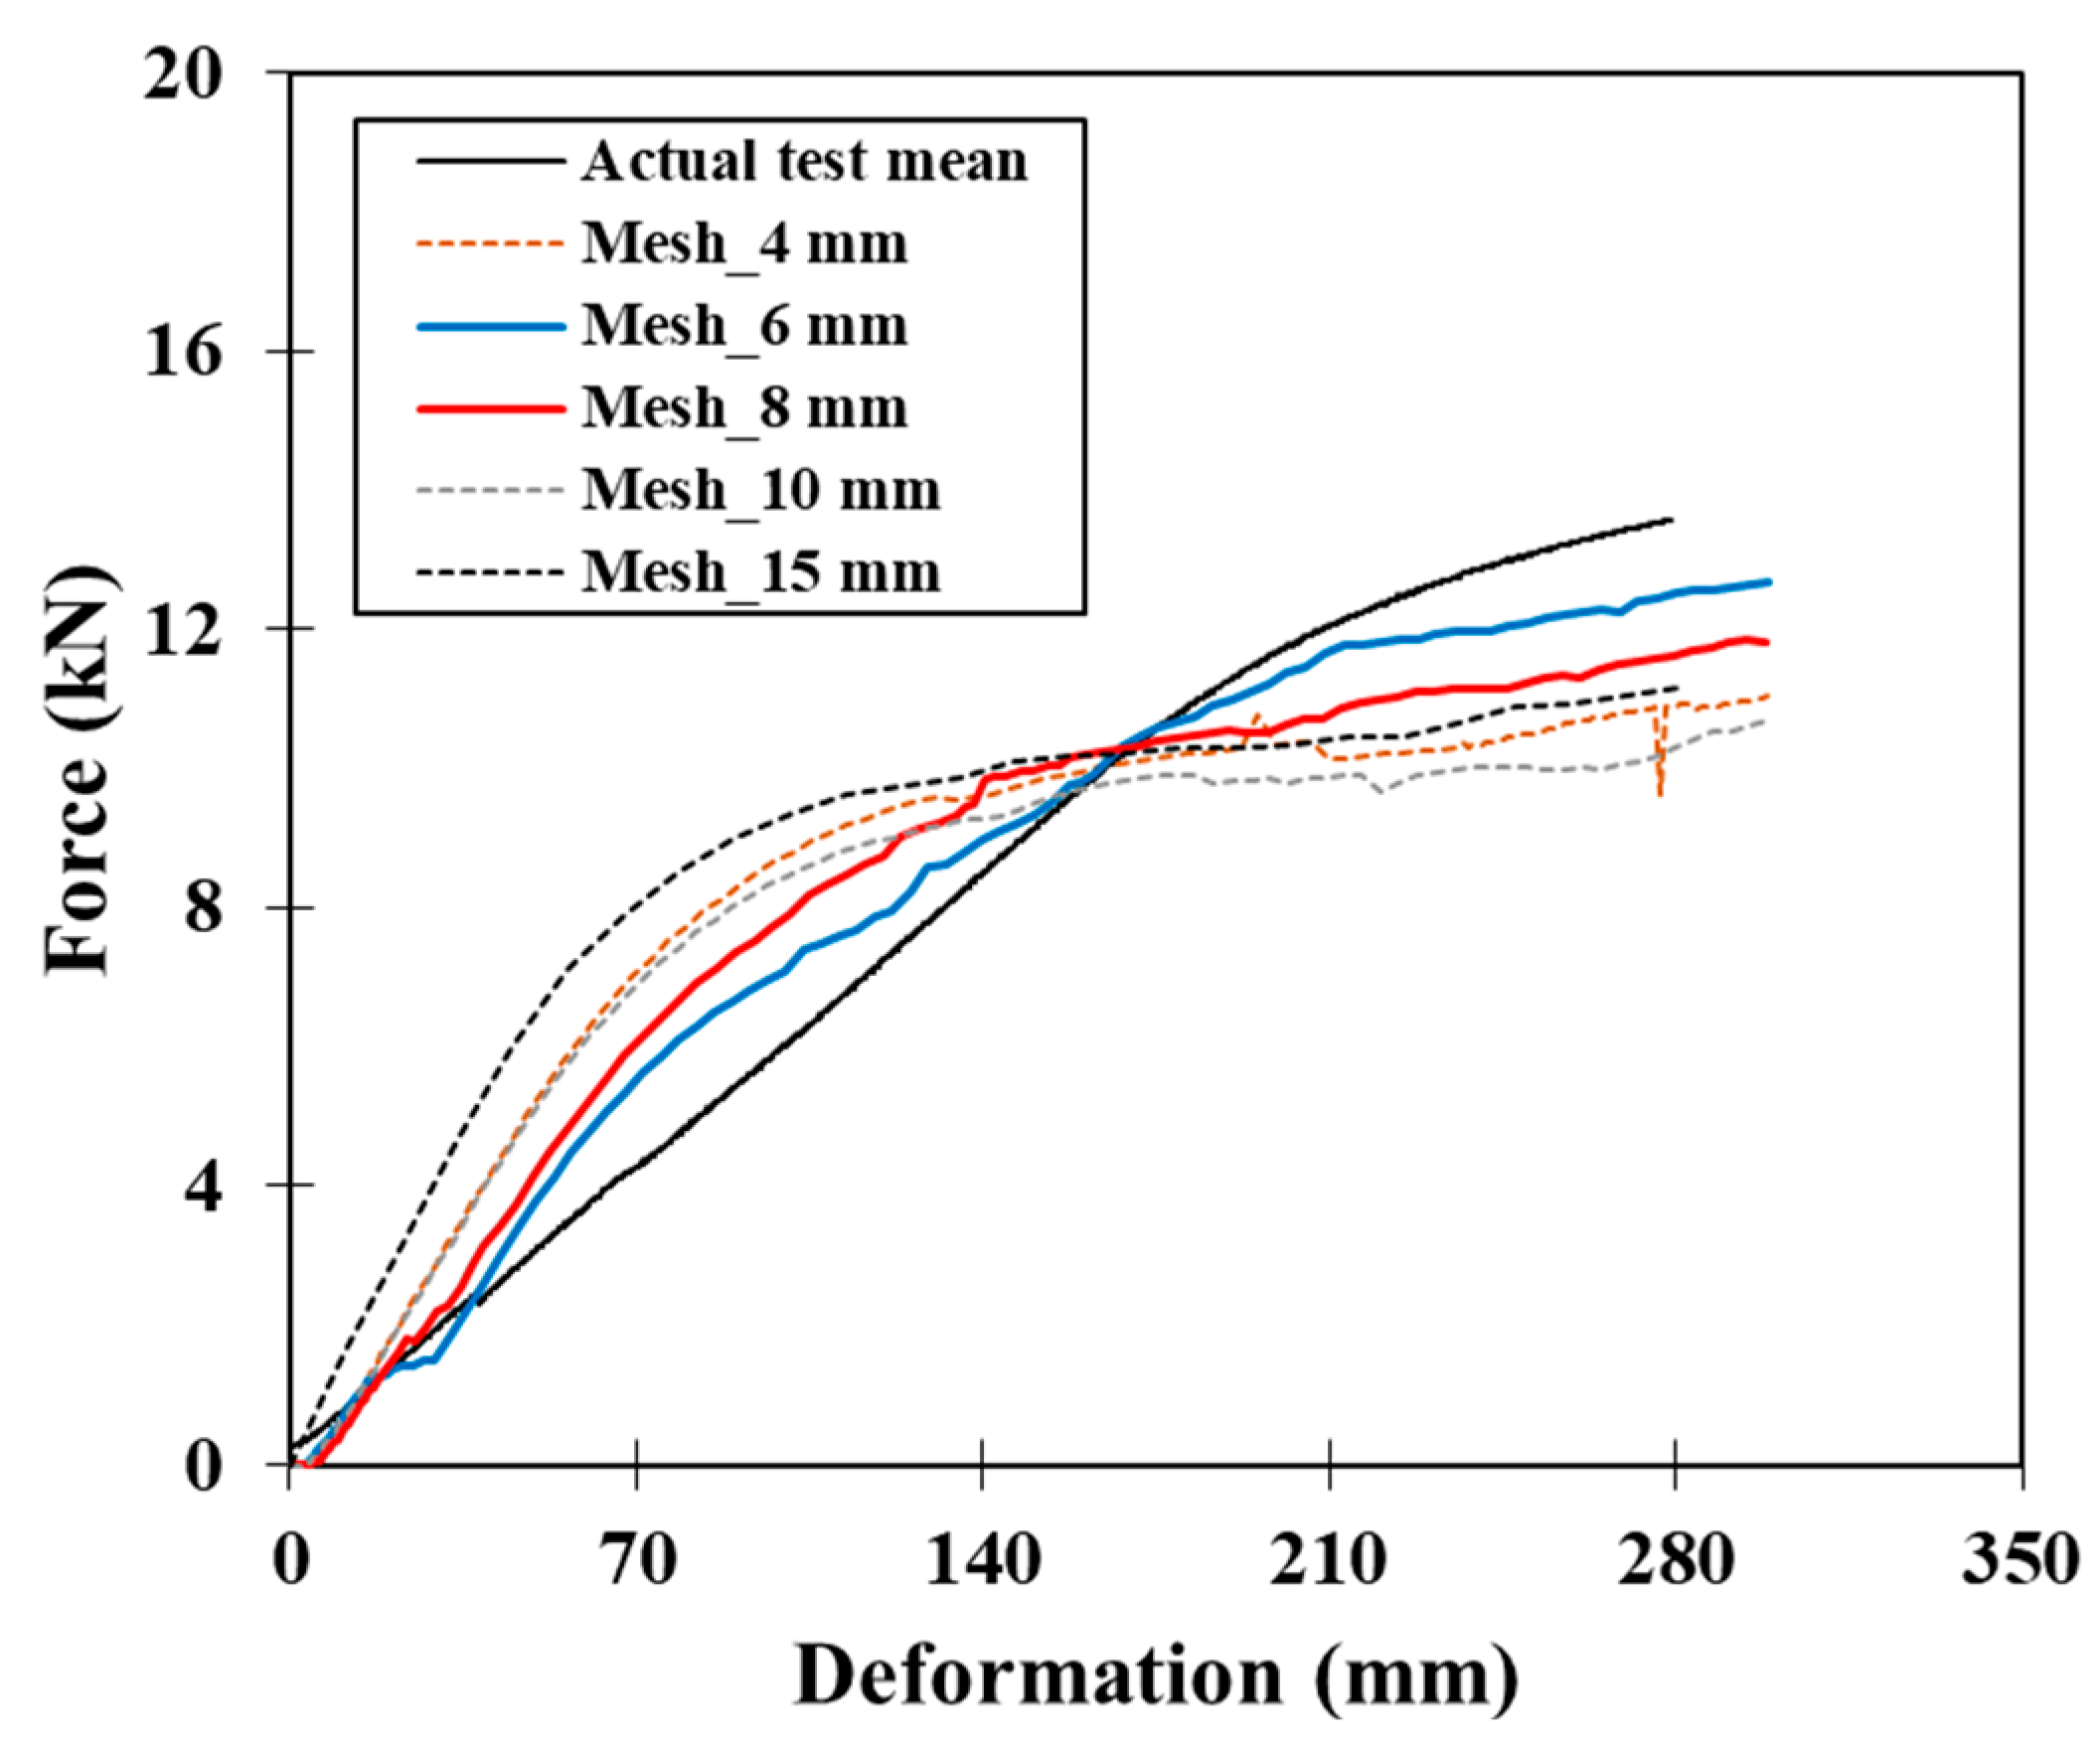
3.2. Simulation Test Results by Mesh Size

The mesh sizes in the ROPS FE model were set differently, and a test was performed on the rear load. The results showing the actual and FEA test results according to the mesh size are shown in Figure 13. The results are shown in Table 7. The time for solving the ROPS finite-element model was 21,285 s for an element size of 4 mm, 8315 s for an element size of 6 mm, 3383 s for an element size of 8 mm, 2540 s for an element size of 10 mm, and 4605 s for an element size of 15 mm. When the size of the element was 8 or 10 mm, the model was solved in a relatively short time, whereas when the element size was 4 mm, it took about 6 h to solve it. The largest error in the force value when comparing the results with those of the actual test was found for the element size of 10 mm and was 21.9%. In addition, the error in the force value was 19.3% and 18.8%, respectively, for the element sizes of 4 mm and 15 mm. Although the mesh size 6 mm showed the lowest error, this condition still required the second highest simulation time among the five mesh conditions. Therefore, the user must select the mesh size considering the appropriate simulation time and error. These results are similar to those presented in the previous research results of Kim and Jung (2012), who studied the relationship between element size, effective characteristics, and analysis time [26]. To replace a real-test ROPS performance, the virtual test is required to be highly accurate. It was observed that the lowest error in the virtual test compared with the actual test was for the mesh size of 6 mm.

4. Conclusions

The ROPS for the tractor driver’s rollover safety must be subjected to load performance tests even when only minor design changes are introduced, such as changes in the position of bolts and in frame thickness. Tractors and the ROPS need to be examined and certified through actual testing, which is costly and requires manpower and money. Therefore, in this study, the characteristics of the tractor frame-type ROPS were considered to develop a simulation as a valid alternative to actual testing. In addition, an FE model was developed considering different boundary conditions. Simulations were performed, and the results were compared with those obtained with the actual test; the corresponding errors were then calculated. The main findings of this study were as follows:
(1)
For the virtual test of the frame-type ROPS, the stress stiffening effect of the tractor and its mounted area must be considered. Therefore, all bolts should be modeled rather than using rigid body constraints. Additionally, the boundary condition of the bolt finite-element model must be set to rotation-free for the bolt itself.
(2)
The size of the load plate in the actual performance test was taken into consideration and reflected in the load conditions. In addition, the boundary conditions of the ROPS part directly mounted on the tractor were simulated by applying bolt 3D modeling and free axial rotation rather than rigid body restraints. As a result, the slope of the force–deformation curve was improved. The measurement error with respect to the actual test measurement was reduced by up to 38.3%.
(3)
A simulation was conducted to identify the mesh size suitable for the ROPS. As for the simulation time, when the mesh size was 8 or 10 mm, the simulation was relatively short. The error with respect to the measurement from the actual test was the smallest, i.e., at 7.3%, when the mesh size was 6 mm.
(4)
We expect that the results of this study will soon allow the establishment of a secure virtual test technology for domestic ROPS. In addition, we expect that it will be possible to propose a domestic virtual test technology to the OECD tractor group. The manufacturers can thus verify ROPS design changes to improve ROPS quality through convenient virtual tests. This is expected to help ensure excellent ROPS quality by reducing costs and saving time.
In this study, the FE model for frame-type ROPS performance was proposed. The results of this study suggested the possibility of replacing real tests with virtual tests. In future research, in order to improve the accuracy of virtual testing, we would like to implement full virtual testing as a replacement for actual testing through advanced research such as individual research on the physical properties of materials.

Author Contributions

Conceptualization, R.-G.L. and Y.-J.K.; methodology, R.-G.L., Y.-J.K. and W.-S.K.; software, R.-G.L.; validation, R.-G.L. and W.-S.K.; formal analysis, R.-G.L. and W.-S.K.; investigation, R.-G.L., W.-S.K., Y.-W.D. and M.A.A.S.; data curation, R.-G.L.; writing—original draft preparation, R.-G.L., W.-S.K. and Y.-W.D.; writing—review and editing, R.-G.L., W.-S.K., Y.-W.D. and M.A.A.S.; supervision, R.-G.L. and Y.-J.K.; project administration, R.-G.L.; funding acquisition, R.-G.L. and Y.-J.K. All authors have read and agreed to the published version of the manuscript.

Funding

This work was supported by Korea Institute of Planning and Evaluation for Technology in Food, Agriculture and Forestry (IPET) through Technology Commercialization Support Program, funded by Ministry of Agriculture, Food and Rural Affairs (MAFRA) (821014-03 and 821053-03).

Institutional Review Board Statement

Not applicable.

Data Availability Statement

The data presented in this study are available within the article.

Conflicts of Interest

The authors declare no conflict of interest.

References

  1. Rural Development Administration (RDA). Current Status of Damage for Farmers Related to Agricultural Machinery; RDA: Jeonju, Republic of Korea, 2019; pp. 20–38. [Google Scholar]
  2. Muneki, T. Survey on the accident caused by agricultural machinery and its protective equipment. In Proceedings of the Japan-Korea Joint Seminar on the Safety of Agricultural Machinery, Saitama, Japan, 31 October 2006. [Google Scholar]
  3. Rautiainen, R.H.; Reynolds, S.J. Mortality and morbidity in agriculture in the United States. J. Agric. Saf. Health 2002, 8, 259–276. [Google Scholar] [CrossRef] [PubMed]
  4. Antunes, S.M.; Cordeiroa, C.; Teixeir, H.M. Analysis of fatal accidents with tractors in the centre of Portugal: Ten years analysis. Forensic Sci. Int. 2018, 287, 74–80. [Google Scholar] [CrossRef] [PubMed]
  5. Kim, H.J.; Kim, K.W.; Choi, S.; Kim, J.S.; Kim, Y.Y.; Kim, J.O.; Kim, H.K.; Kwon, S.H. A Study on Improving the Tractor ROPS and Seatbelt use of Korean Farmers. J. Biosyst. Eng. 2010, 35, 294–301. [Google Scholar] [CrossRef]
  6. Kim, J.H.; Hwang, S.J.; Nam, J.S. Simulation study on the safety of a fastening device of agricultural by-product collector. J. Drive Control 2023, 20, 42–49. [Google Scholar] [CrossRef]
  7. Lee, D.; Yoo, H.J.; Shin, M.; Oh, J.; Shim, S.B. Analysis of overturning stability of small off-road vehicle. J. Biosyst. Eng. 2023, 48, 309–318. [Google Scholar] [CrossRef]
  8. Iqbal, M.Z.; Islam, M.N.; Ali, M.; Kiraga, S.; Kim, Y.J.; Chung, S.O. Theoretical overturning analysis of a 2.6-kW two-row walking-type automatic pepper transplanter. J. Biosyst. Eng. 2022, 47, 79–91. [Google Scholar] [CrossRef]
  9. Lim, R.G.; Kang, Y.S.; Kim, T.J. Measurement uncertainty calculation for improving test reliability of agricultural tractor ROPS test. J. Drive Control 2023, 20, 34–40. [Google Scholar] [CrossRef]
  10. Karakulak, S.S.; Yetkin, E. Agricultural tractor cabin safety analysis and test correlation. Int. J. Automot. Sci. Technol. 2002, 4, 1–9. [Google Scholar] [CrossRef]
  11. Blanco, D.; Martin, C.; Ortalde, A. Virtual ROPS and FOPS testing on agricultural tractors according to OECD standard code 4 and 10. In Proceedings of the 14th International LS-DYNA Users Conference, Detroit, MI, USA, 12–14 June 2016. [Google Scholar]
  12. Fabbri, A.; Ward, S. Validation of a finite element program for the design of roll-over protective framed structures (ROPS) for agricultural tractors. Biosyst. Eng. 2002, 81, 287–296. [Google Scholar] [CrossRef]
  13. Ha, C.W.; Kim, H.J.; Goo, N.S.; Kwon, Y.D. Finite element analysis of an agricultural cabin based on the OECD standard (code 4). J. Biosyst. Eng. 2003, 28, 431–436. [Google Scholar] [CrossRef]
  14. Kim, H.J.; Goo, N.S.; Kwon, Y.D.; Ha, C.W.; Jung, H.K. Structural analysis of an agricultural tractor cabin for OECD certification. In Proceedings of the Korean Society of Mechanical Engineers Autumn Conference, Jeju, Republic of Korea, 27–29 June 2001. [Google Scholar]
  15. Jang, H.; Lee, B. Optimal design of tractor cabin frame using design of experiment of taguch. J. Korea Acad.-Ind. Coop. Soc. 2015, 16, 7377–7384. [Google Scholar] [CrossRef]
  16. Won, J.G.; Yoon, J.I.; Lee, H.A.; Chung, S.G.; Jeong, J.S. Simulation analysis on static safety of 55Hp-servo-based hydrostatic transmission. J. Drive Control 2022, 19, 34–42. [Google Scholar] [CrossRef]
  17. Yu, Y.J.; An, Y.C.; Lee, K.H.; Park, J.H.; Lee, D.; Lee, C.H. Fatigue and severity analysis of drive axle parts according to forklift driving environment. J. Drive Control 2023, 20, 24–30. [Google Scholar] [CrossRef]
  18. Kumar, N.; Tewari, V.K. Modification of reactive muffler in farm tractor to reduce noise level using finite element method. J. Biosyst. Eng. 2023, 48, 165–177. [Google Scholar] [CrossRef]
  19. Lim, R.G.; Kang, Y.S.; Lee, D.H.; Kim, W.S.; Lee, J.H.; Kim, Y.J. Agricultural tractor roll over protective structure (ROPS) test using simplified ROPS model. Korea J. Agric. Sci. 2023, 49, 771–783. [Google Scholar] [CrossRef]
  20. Agius, D.J.; Kourousis, K.I.; Takla, M.; Subic, A. Enhanced non-linear material modelling for analysis and qualification of rollover protective structures. Proc. Inst. Mech. Eng. Part D J. Automob. Eng. 2015, 230, 1558–1568. [Google Scholar] [CrossRef]
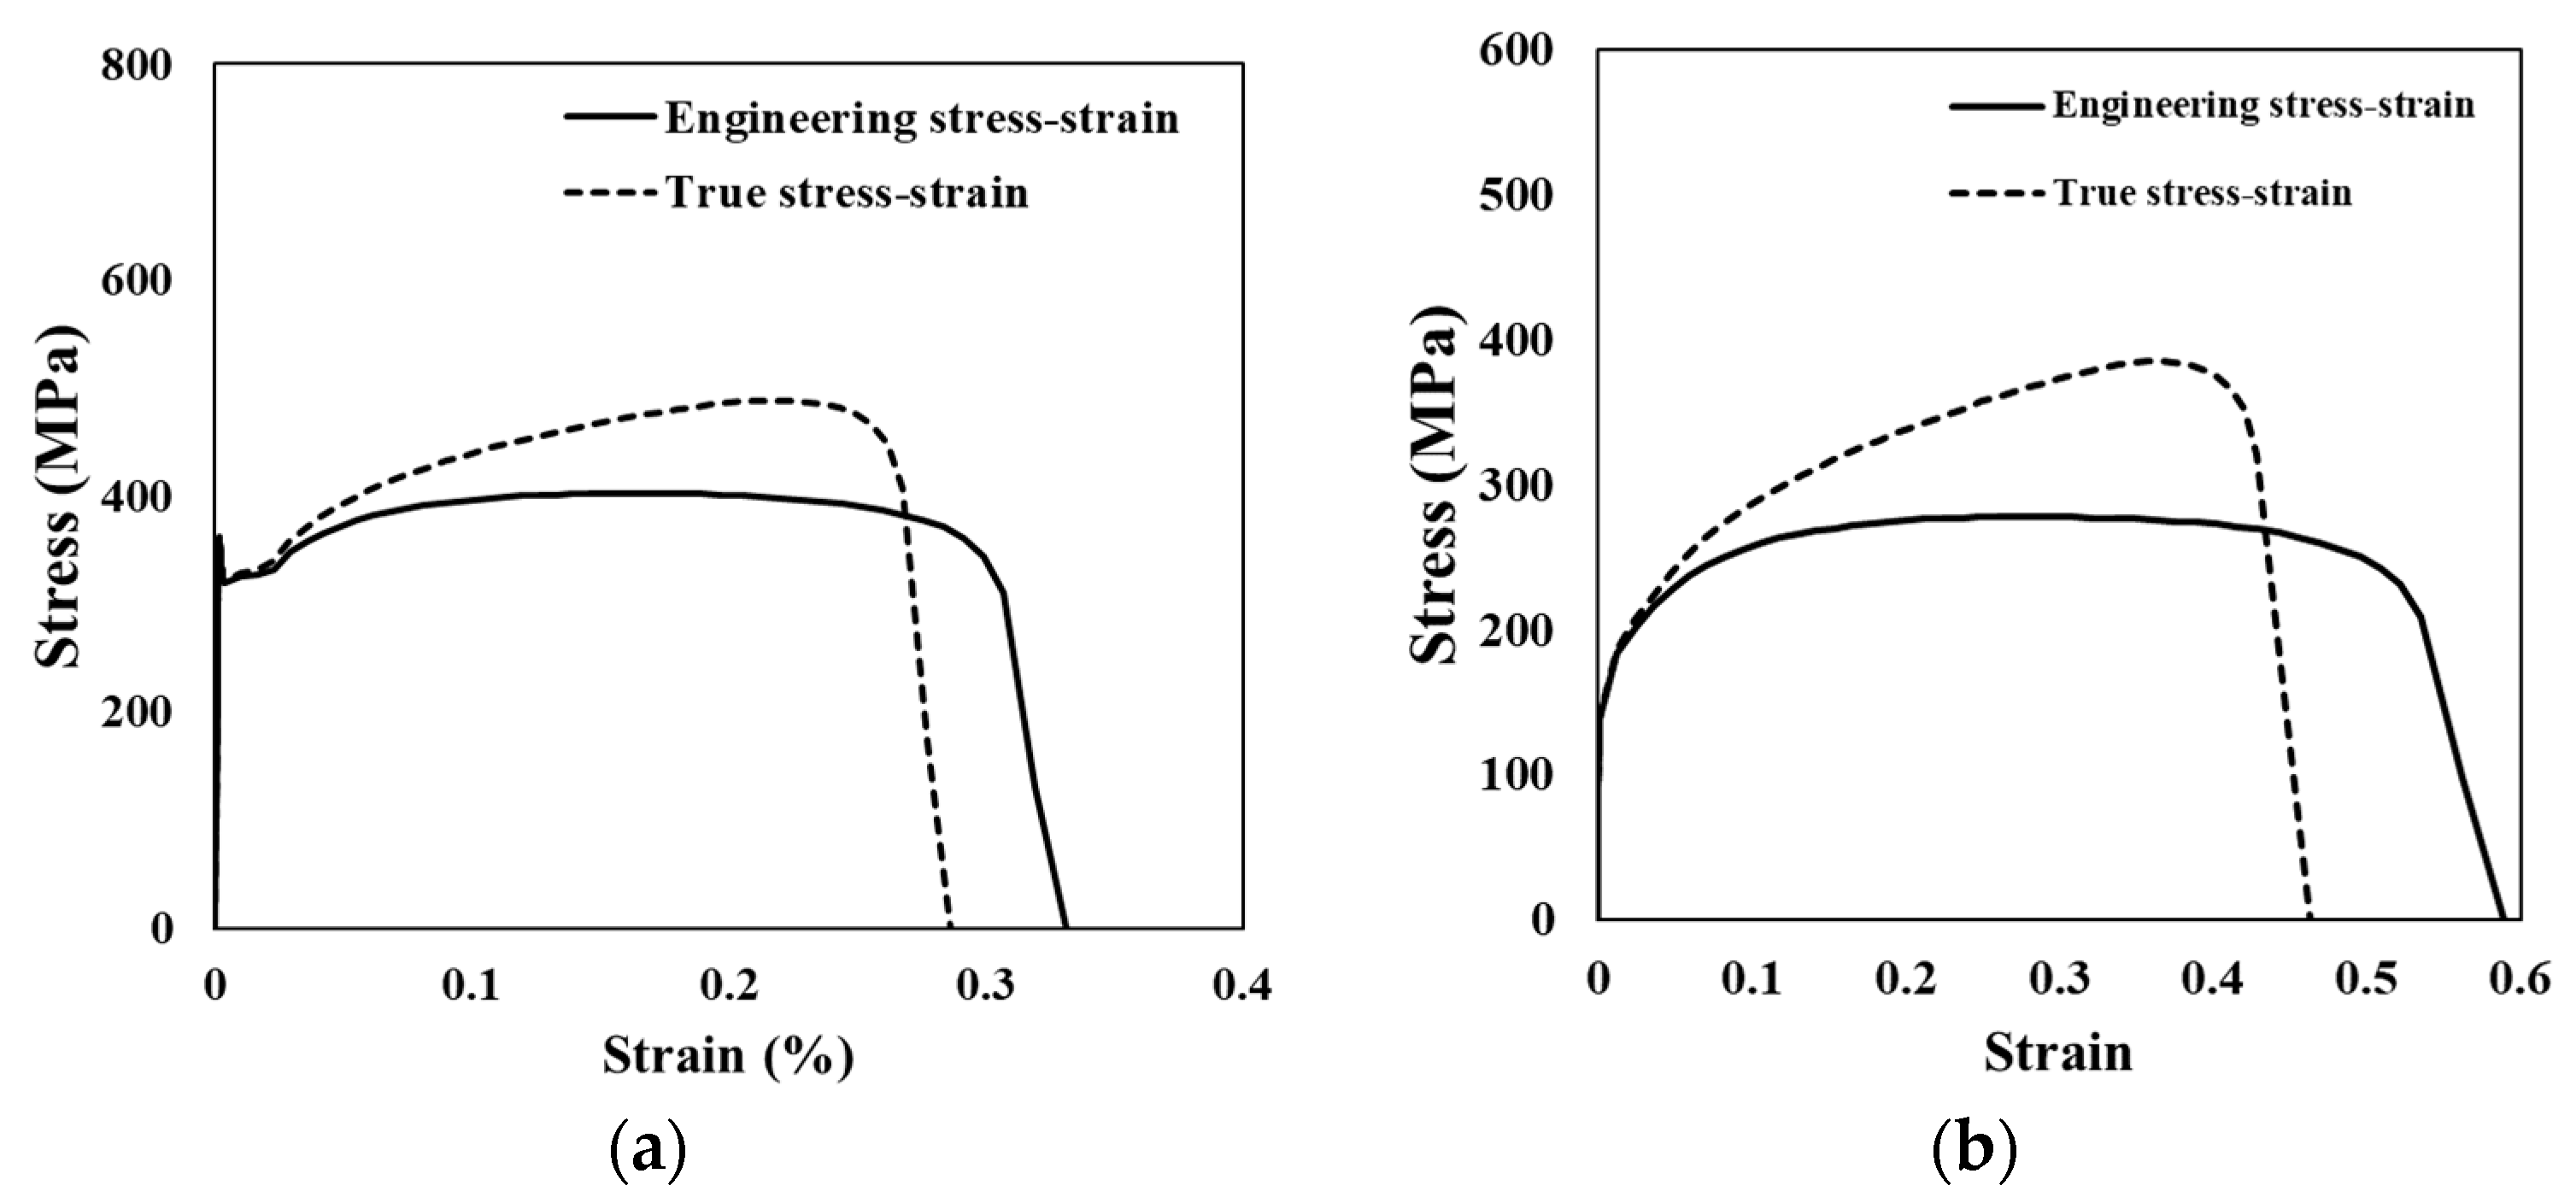
  21. Song, H.S.; Kim, Y.Y.; Lim, R.G. Determination of the properties of structural steel for agricultural tractor roll-over protective structure by tensile test and finite element analysis. J. Korean Soc. Mech. Technol. 2019, 21, 567–576. [Google Scholar] [CrossRef]
  22. OECD (Organization for Economic Cooperation and Development). OECD Standard Code for the Official Testing of Protective Structures on Agricultural and Forestry Tractors (Statics Test); Tractor Standard Code 4-OECD; OECD Headquarters: Paris, France, 2021. [Google Scholar]
  23. KS B 7950; Tractors for Agriculture and Forestry-Two-Post Roll-Over Protective Structures-Virtual Statistic Test Method and Acceptance Conditions. Korea Standards Association: Seoul, Republic of Korea, 2022.
  24. Yoon, C.Y. Efficient adaptive finite element mesh generation for dynamics. Comput. Struct. Eng. Inst. Korea 2013, 26, 385–392. [Google Scholar] [CrossRef]
  25. Heo, J.H.; Kim, H.S. Bending moment calculation method and optimum element size for finite element analysis with continuum elements. Comput. Struct. Eng. Inst. Korea 2018, 31, 9–16. [Google Scholar] [CrossRef]
  26. Kim, S.W.; Jung, H.C. Investigation on the effect of mesh density in FE analysis for prediction of mechanical behavior of a PCM. In Proceedings of the Korean Society for Technology of Plasticity Conference, Jeju, Republic of Korea, 10–11 May 2012. [Google Scholar]
Figure 1. Procedure to develop the virtual test model for ROPS described in this study.
Agriculture 13 02004 g001
Figure 2. Collimation between the FE model and real model for frame-type ROPS: (a) drawing of frame-type ROPS; (b) frame of FE model; (c) folding part, plate, pin, and bolt of FE model. * Boundary conditions of contact area.
Agriculture 13 02004 g002
Figure 3. True stress–strain of material used in this study. (a) SS400; (b) SPSR.
Agriculture 13 02004 g003
Figure 4. Loading conditions in the ROPS FE model.
Agriculture 13 02004 g004
Figure 5. Load plate of the ROPS, for rear and front loading. (a) Actual plate; (b) 2D load plate size and node identification in the FE model.
Agriculture 13 02004 g005
Figure 6. Load plate of the ROPS for side loading. (a) Actual; (b) 2D load plate size in the FE model.
Agriculture 13 02004 g006
Figure 7. Boundary conditions of the mounting parts. (a) Constraints for bolt hole; (b) bolt modeling; (c) constraints for modeled bolts.
Agriculture 13 02004 g007
Figure 8. Model of the 3D shell and 2D plate of the folding portion of a tractor ROPS.
Agriculture 13 02004 g008
Figure 9. Mesh size of the ROPS in the FE model. Chosen mesh sizes: (a) 4 mm; (b) 6 mm; (c) 8 mm; (d) 10 mm; (e) 15 mm.
Agriculture 13 02004 g009
Figure 10. Force–deformation curve; results of FEA 1. (a) Rear loading, (b) side loading, and (c) front loading.
Agriculture 13 02004 g010
Figure 11. Evaluation of the distribution stress and deformation on ROPS according to the loading direction. (a) Rear loading; (b) side loading; and (c) front loading.
Agriculture 13 02004 g011
Figure 12. Force–deformation curve; FEA 2 results. (a) Rear loading, (b) side loading, and (c) front loading.
Agriculture 13 02004 g012
Figure 13. Comparison of the force–deformation curves obtained with the ROPS FE model and the actual test according to the mesh size.
Agriculture 13 02004 g013
Table 1. Specifications of the FE model for ROPS proposed in this study.
MeshGeometric
ComponentsSpecification
(Number)
ComponentsPropertiesNo. of Elements
Nodes26,474Frame upper part3D Shell14,565
Frame mid part3D Shell1518
Elements25,951Frame lower part3D Shell5786
Frame weld3D Shell142
Quad24,654Bolt case3D Solid144
Stopper bolt3D Solid72
Tria217Bolt3D Solid652
Bottom plate3D Solid2336
Hexa792Bottom bolt3D Solid1576
Octagon276Folding part bolt3D thin walled4
Material Properties
ComponentsMass Density
(kg/m3)
Elastic Modulus
(GPa)
Poisson’s RatioNo. of Elements
SPSR79002000.2842,348
SS40079002000.288529
S45C Stopper78502050.2976
S45C Bolt78502050.29652
Table 2. Comparison of existing methods and this study.
DivisionExisting Methods
(FEA 1)
Study Methods
(FEA 2)
ROPS mounting partRigid restraintsBolts modeled
Reflection physical property
ROPS folding partRigid restraintsBetween plate element and 3D element was set rotation-free in the axial direction
Mesh sizeSimple selection of large or small meshesApply mesh after performing simulation tests for each mesh size
Table 3. Results of the force and maximum deformation for ROPS FEA 1 by load direction.
Load
Direction
Force (kN)Maximum Deformation (mm)
Simulated
(FEA 1)
MeasuredError
(%)
Simulated
(FEA 1)
MeasuredError
(%)
Rear12.30113.68110.1253.9285.911.2
Side19.51516.30819.7180.6269.232.9
Front9.2676.46143.496.9170.243.1
Table 4. One-sample t-test on the results from FEA 1 and the actual analysis (α = 0.05, two-tailed).
TestNMeanSDSEtdfpMean Difference
Actual rear/
FEA rear
Force313.70.3530.2046.772.000.021 *1.38
Deformation32868.114.686.852.000.021 * 32.1
Actual side/
FEA side
Force316.30.04020.0232−1382.000.001 *−3.21
Deformation32697.464.3120.62.000.002 *88.6
Actual front/
FEA front
Force36.460.1950.112−25.02.000.002 *−2.81
Deformation31706.463.7319.72.000.003 *73.3
* α = 0.05, p value < α; Therefore, there is a significant difference.
Table 5. Results of the force and maximum deformation for ROPS FEA 2 by load direction.
Load
Direction
Force (kN)Maximum Deformation (mm)
Simulated
(FEA 2)
MeasuredError
(%)
Simulated
(FEA 2)
MeasuredError
(%)
Rear12.78913.6816.5298.5285.94.4
Side17.13516.3085.1243.8269.29.4
Front6.9116.4617.0153.9170.29.6
Table 6. One-sample t-test on the results from FEA 2 and the actual analysis (α = 0.05, two-tailed).
TestNMeanSDSEtdfpMean
Difference
Actual rear/
FEM rear
Force313.70.3530.2044.382.000.0540.892
Deformation32868.114.68−2.682.000.116−12.5
Actual side/
FEM side
Force316.30.04020.0232−35.72.00 0.001 *−0.827
Deformation32697.464.310.0282.00 0.028 *25.4
Actual front/
FEM front
Force36.460.1950.112−4.012.000.057−0.450
Deformation31706.463.734.372.00 0.049 *16.3
* α =0.05, p value < α; Therefore, there is a significant difference.
Table 7. FEA results and errors for the ROPS FE model according to the mesh size.
Mesh Size (mm)4681015
Simulation time (s)21,2858315338325404605
Force (kN)11.04512.68711.83010.68411.147
Error (%)19.37.313.521.918.8
Disclaimer/Publisher’s Note: The statements, opinions and data contained in all publications are solely those of the individual author(s) and contributor(s) and not of MDPI and/or the editor(s). MDPI and/or the editor(s) disclaim responsibility for any injury to people or property resulting from any ideas, methods, instructions or products referred to in the content.

