Article

Analyzing Food Loss in the Fresh Longan Supply Chain: Evidence from Field Survey Measurements

by
Roengchai Tansuchat
1,*,
Tanachai Pankasemsuk
2,
Chanita Panmanee
3,
Tanapol Rattanasamakarn
4 and
Konnika Palason
4
1
Center of Excellence in Econometrics, Faculty of Economics, Chiang Mai University, Chiang Mai 50200, Thailand
2
Academic Services and Research, Payap University, Chiang Mai 50000, Thailand
3
Faculty of Economics, Maejo University, Chiang Mai 50290, Thailand
4
Faculty of Economics, Chiang Mai University, Chiang Mai 50200, Thailand
*
Author to whom correspondence should be addressed.
Agriculture 2023, 13(10), 1951; https://doi.org/10.3390/agriculture13101951
Submission received: 4 September 2023 / Revised: 28 September 2023 / Accepted: 4 October 2023 / Published: 6 October 2023

Abstract

:
Aligned with Sustainable Development Goal 12 and Sub-Indicator 12.3.1.a, this study rigorously examines food loss dynamics in the longan value chain—encompassing the stages from production to wholesale. Longan, a key commodity in Thailand’s national food loss index calculation, undergoes a comprehensive evaluation following FAO guidelines. This study aims to quantify quantity loss in fresh longan fruit, which pinpoints critical loss stages for targeted policy recommendations. Additionally, it seeks to establish a robust methodology for data collection and calculation, providing a model for evaluating food losses in tropical fruits. Results disclose varying loss percentages across supply chains: quantitative loss 14.07% and qualitative loss 11.02% for domestic consumption, quantitative loss 13.50% and qualitative loss 14.82% for export-bound fresh longans on-season, and quantitative loss 9.85% and qualitative loss 6.52% for export-bound fresh longans off-season. Critical loss stages are identified—particularly over-ripe longan harvesting due to labor shortages and price volatility. Further factors contributing to food losses encompass insufficient pre-harvest handling practices, which result in subsequent post-harvest losses, deficiencies in SO2 fumigation and storage processes, as well as transportation-related issues. This study’s contribution lies in its comprehensive guidance, emphasizing field survey measurements and aligning with the FAO guidelines, making it a vital tool for quantifying and addressing food loss, especially in the tropical fruit sector.

1. Introduction

Food loss has emerged as a significant challenge following the 2007–2008 food crisis, further impacting global food availability. The Food and Agriculture Organization of the United Nations (FAO) reported that despite the world’s ability to produce enough food for 7 billion people in 2009, the projected population growth to 9.3 billion by 2050 necessitates a 60% increase in food production to meet the expected 35% to 56% rise in global food demand by 2050 [1,2]. Food loss and waste (FLW) play a substantial role in exacerbating potential food shortages. Approximately one-third of the world’s annual food production is lost or wasted, with an estimated economic impact of over USD 1 trillion annually [3,4]. Harvest and post-harvest losses, inadequate supply chain management, and spoilage contribute to 25–30% of food loss between farm production and grocery store shelves [5,6]. As a result, addressing the issue of food loss has gained increased recognition and focus, particularly concerning food security.
SDG 12, one of the Sustainable Development Goals, focuses on reducing food loss and waste by halving global food waste at the retail and consumer levels, as well as minimizing waste from production processes and supply chains, including post-harvest losses, by 2030 [7]. The reduction of food loss and waste is crucial for various reasons, including lowering production costs, improving the efficiency of the food system, enhancing food security and nutrition, and promoting environmental sustainability. According to a report by the FAO [8], approximately 14.8% of food is lost globally after harvest, incurring a cost of at least USD 400 billion during transit, storage, and processing stages. Additionally, reducing food loss can have positive impacts on several other SDGs, such as SDG 2 (zero hunger), SDG 6 (sustainable water management), SDG 13 (climate change), SDG 14 (marine resources), and SDG 15 (terrestrial ecosystems, forestry, and biodiversity) [9].
For policymakers at the national and international levels to assess the effectiveness of their initiatives in reducing food loss and waste (FLW) and achieving the goal of halving FLW by 2030, it is crucial to have reliable data and comparable measurements. Accurate measurement of FLW and identification of critical loss points are essential for evidence-based interventions and recommendations. Future research on FLW should adhere to the methodology used in the original FAO study or provide a compelling justification for using a different methodology. It is important to investigate if using a different methodology would have led to different conclusions drawn in the initial study. To address these needs, the FAO launched a methodology in 2018 for monitoring SDG 12.3, specifically focusing on the design of the global food loss index, data collection methods, and challenges for SDG 12.3.2, the global food loss index [7].
According to the FAO [8], food loss is defined as the reduction in food quantity or quality resulting from decisions and actions taken by food suppliers within the supply chain, excluding retailers, food service providers, and consumers [
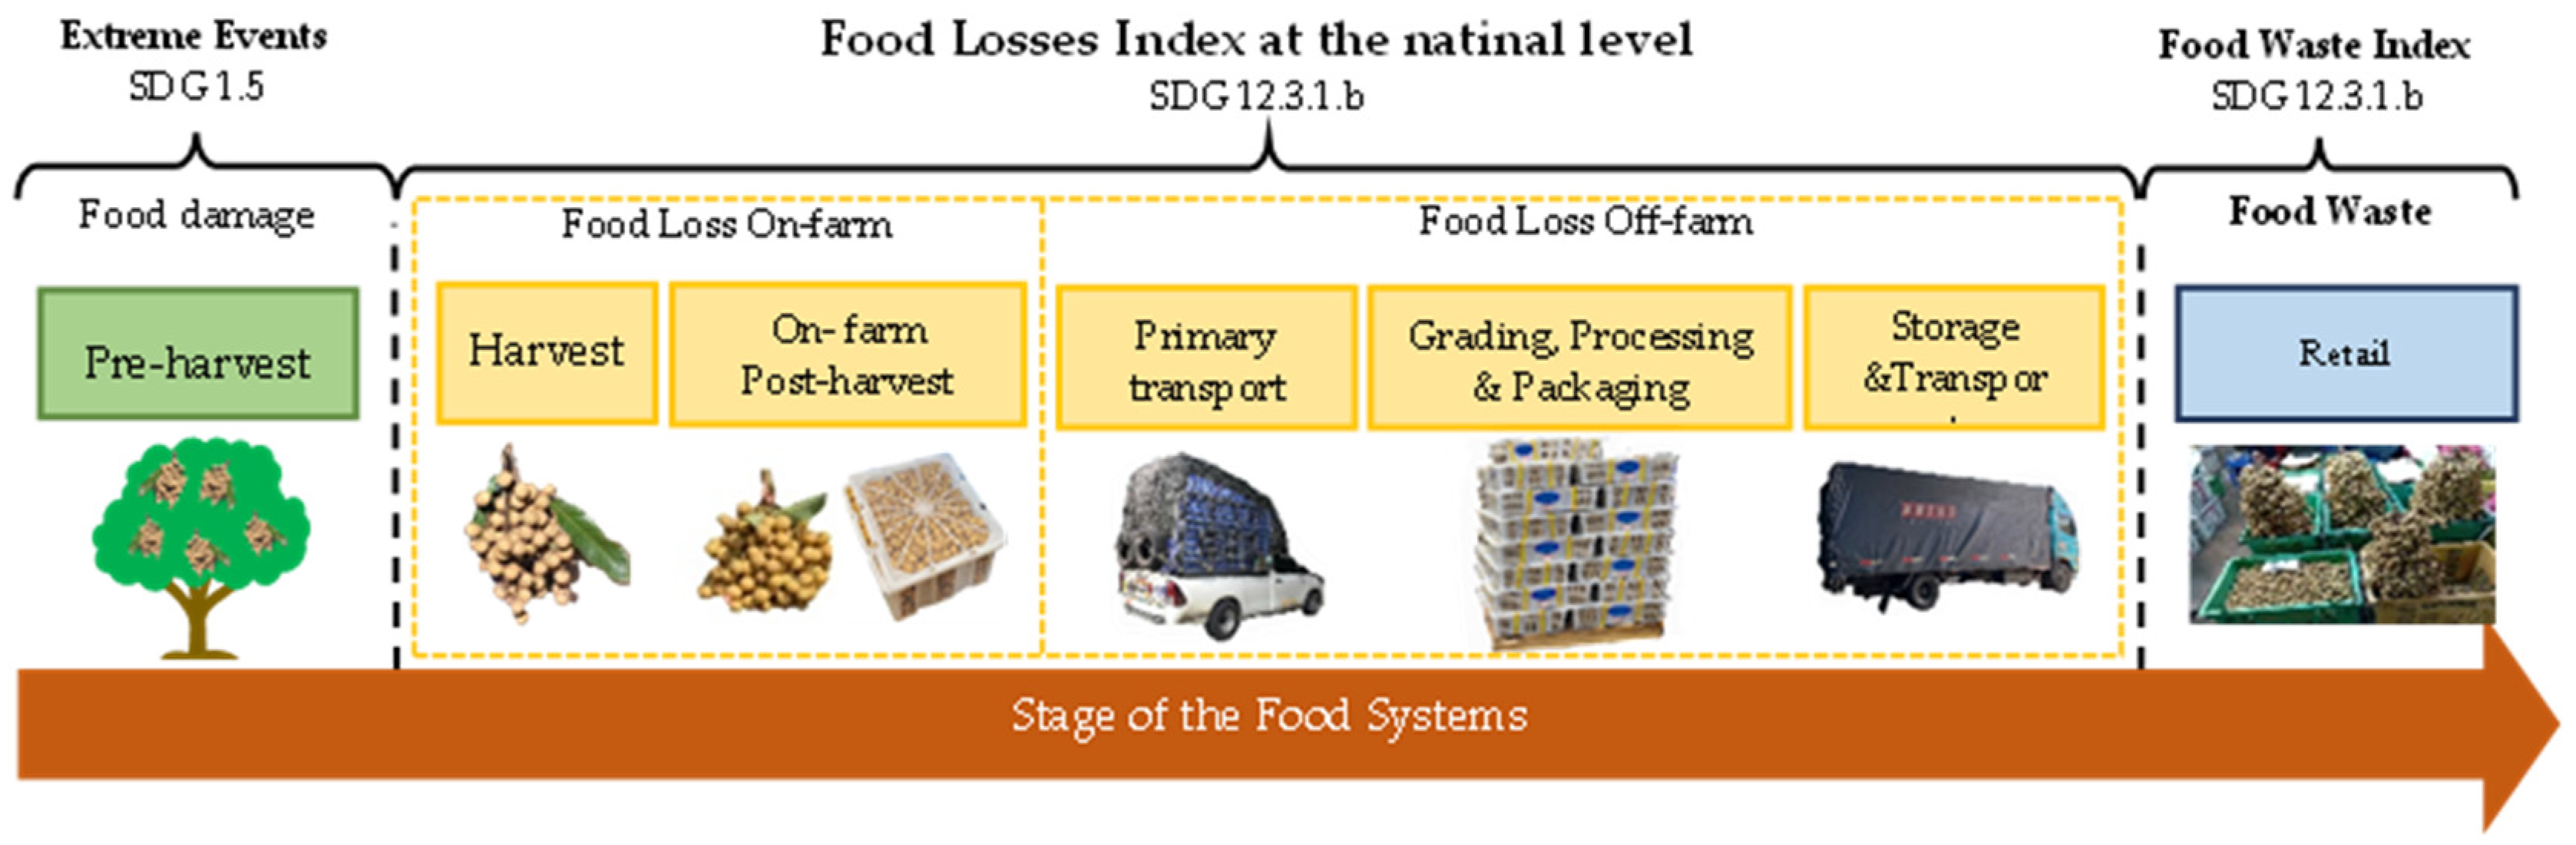
9]. In other words, food loss occurs at various stages of the food supply chain, starting from harvest and continuing up to the point just before the retail level (as depicted in Figure 1). It encompasses losses that happen during storage, transportation, and processing, as well as losses of imported commodities after they arrive in the host country. However, food loss does not include commodities that are utilized for non-food purposes, such as animal feed or industrial use.
In contrast, food waste encompasses food suitable for human consumption that is either discarded or left to spoil at the consumer level, irrespective of the cause. Commonly counted instances of food waste encompass both retail and consumer levels. This includes removing unsold products, including those nearing expiration, or damaged items from store shelves. It also involves discarding prepared but unpurchased food at retail. On the consumer end, food waste involves disposing of purchased but unconsumed items, uneaten leftovers, and food spoiling due to improper storage.
Table 1 displays the estimated food loss percentage in the food supply chain for each commodity group in different regions, and the Sub-Saharan Africa region had the highest percentage of food loss virtually for all food groups, followed by the South and Southeast Asia regions. Among foodstuffs in the South and Southeast Asia region, fruit and vegetable crops are lost at higher estimated rates than other food categories due to their perishable nature [3,10]. Unlike meat, dairy, and grains, fresh fruit can be a more recoverable food group because it requires little or no preparation before distribution [11]. In Asia-Pacific, 15 to 50 percent of fruits and vegetables are out of customers’ reach because of inefficient harvesting, post-harvest handling practices, and inadequate knowledge and infrastructure [12]. Due to the hot weather and inadequate storage, 30 percent of the fruits and vegetables were harmed during shipment [13].
Thailand plays a significant role as a major producer and exporter of agricultural and food products, particularly tropical fruits and processed tropical fruit products. In 2017, the FAO reported that Thailand’s food loss amounted to 6.96 million tons [FAO, 2017]. As the study of food loss is relatively new in Thailand, few investigations have been conducted and are limited to specific aspects. For example, the Office of Agricultural Economics, in collaboration with the Rice Department, conducted a study on the average harvest loss rate of paddy [13]. Moreover, they conducted a food loss study specifically focusing on fourteen fresh vegetables [14]. In a separate study, Attavanich et al. (2020) [15] examined five different commodities. However, it is important to note that both studies had their research methodological differences and deviated from the FAO guidelines.
Recognizing the importance of food loss in strengthening food security, the Thai government emphasizes the need for cooperation among stakeholders throughout the food supply chain, from farmers or producers to consumers, to effectively reduce food loss. This commitment is reflected in the launch of initiatives such as the Sustainable Consumption and Production Roadmap 2017–2037, driven by the Office of Natural Resources and Environmental Policy and Planning (ONEP), and the Strategic Framework for Food Management in Thailand, 2nd Edition (2018–2037), implemented by the National Food Board (NFB) and the Ministry of Agriculture and Cooperatives (MOAC) [16]. The Roadmap aims to achieve a 5% annual reduction in food loss across the entire food supply chain from 2020 to 2037, compared to the base year statistics. Several key government agencies within the Ministry of Agriculture and Cooperatives (MOAC) are responsible for implementing this mission, including the Department of Agriculture (DOA), the Office of Agricultural Economics (OAE), and the Agricultural Research Development Agency (ARDA). In 2019, the Food Loss Reduction Subcommittee (FLRS) was established to propose measures for reducing food waste and driving Sustainable Development Goals.
Subsequently, the ARDA hosted discussions with stakeholder agencies to initiate a research project called “A national food loss assessment in food, and agricultural products”. The project endeavored to establish a food loss baseline to categorize critical food loss points and determine food loss mitigation measures throughout the value chain following the FAO guidelines [7], as well as report on the SDG 12.3.1 implications. The research project received approval from the ARDA and resulted in a national loss index and a global food loss index specific to Thailand. These indexes help manage and report food loss to FAO and the UN. The project also establishes a national loss baseline to guide goal-setting for reducing agricultural and food product losses in Thailand. It provides guidelines for long-term monitoring and reporting of the Thailand loss index, along with policy recommendations to minimize quantity losses across the integrated value chain of agricultural and food products.
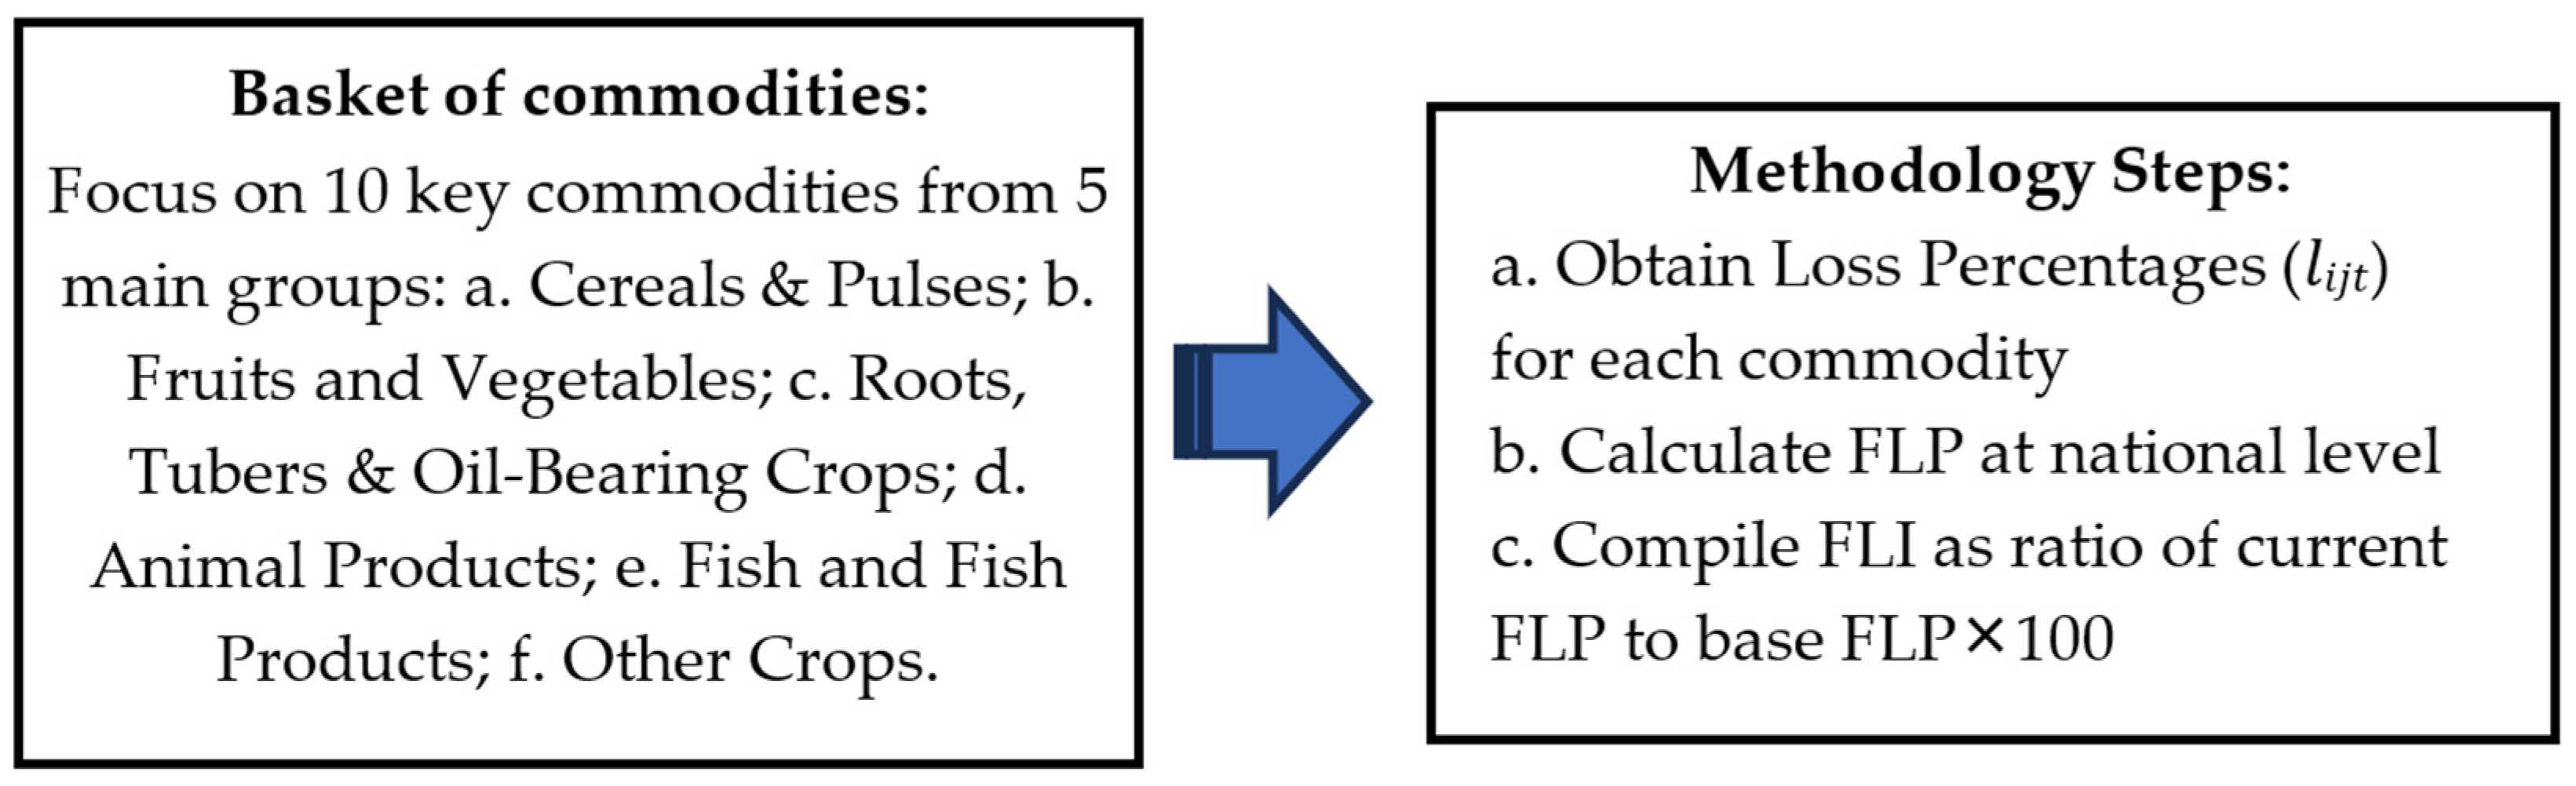
The FAO guidelines [7] stipulate that the national loss index should include five groups of commodities: (1) Cereals and Pulses; (2) Fruits and Vegetables; (3) Roots, Tubers, and Oil-bearing crops; (4) Animal products; and (5) Fish products and Others. The selection of target agricultural and food products is based on criteria such as large-scale production, high economic value, significant losses, and significant environmental impact. After careful consideration, the FLRS (Food Loss Reduction Subcommittee) chose eleven agricultural and food products to be included in the study: Mung beans, Banana, Longan, Mango, Chili, Vegetable salad, Oil palm, Chicken meat, Egg, White leg shrimp, and Sugar cane [17].
Longan, scientifically known as Dimocarpus longan Lour., is a fruit that belongs to the Sapindaceae family. It is commercially cultivated for both fresh consumption and processing purposes. Originating from tropical Asia and China, longan is renowned for its sweet taste. In Thailand, two primary types of longans are consumed and traded: fresh longans and dried whole longan fruit. The fresh longan has been included in the commodity basket for food loss assessment due to its substantial economic value, especially in terms of exports, its extensive large-scale production and cultivation, and the involvement of numerous stakeholders along its value chain. In 2022, longan production in Thailand amounted to 1,032,326.7 million tons [18]. The volume and value of fresh longan export was 470,538.71 metric tons and USD 491.90 million, respectively [19]. China serves as a prominent target market for longan exports.
A comprehensive review of the literature reveals that food losses in various tropical fruits, such as Litchi [20,21,22], Mangoes [23,24,25], and Banana [26], have received significant research attention. However, most of these studies rely on expert opinions or questionnaire surveys on a few stages of the value chain to estimate food loss percentages. A limitation of these methods is that the reported loss percentages are subjective opinions and may not accurately reflect the true extent of the problem. To address this limitation, there is a critical research gap that needs to be filled through comprehensive studies incorporating direct measurements and observations at the farm level. This approach is crucial for obtaining accurate and reliable data on food loss, particularly in the longan value chain. By closing this research gap, valuable insights can be gained into the actual magnitude of food losses and enable the development of targeted strategies to effectively mitigate them.
Therefore, this study aims to address this gap by answering the following research questions related to food loss in the longan industry in Thailand: To what extent, in both quantitative and qualitative terms, does food loss occur throughout the fresh longan supply chain while adhering to FAO guidelines (2019)? Where do food losses reach critical levels within the various stages of the fresh longan supply chain? What actionable policy recommendations can be devised to significantly diminish food losses and promote the sustainability of the fresh longan industry? To achieve answers to these research questions, the study evaluates the percentage of food loss along the supply chain of fresh longan, adhering to the FAO guidelines (2019) [7], identifies critical loss points in each longan supply chain, and proposes the policy suggestion to mitigate the longan loss. The research focuses on two specific longan supply chains: fresh longans for domestic consumption and fresh longans for export. Crop-cutting measurement surveys, on-farm direct measurements, and stakeholder sample surveys with questionnaires are fundamental tools for assessing longan loss. These data collection methods capture crucial information during the on-season and off-season harvesting and post-harvesting of fresh longans at lower levels, providing valuable insights into the extent and causes of the losses.
This is the first time the baseline for longan loss in Thailand will be established from the evaluation of the food loss percentages. As a result, the three main research contributions are (1) the detailed descriptions of the guidelines for field survey measurements, particularly from on-farm measurements, and data collection from stakeholders along the longan supply chain, sampling method, and calculating methodologies following FAO guidelines; (2) the analysis of the critical loss points in each chain; and (3) the policy suggestion to mitigate the longan loss, which can be a synergetic policy package towards food sustainability. This paper’s structure is as follows. In Section 2, we review the definition of food loss, conduct literature reviews on food loss measurement and evaluation, and explore the longan supply chain and longan losses. Section 3 outlines the methodology and data collection process. The empirical results are presented in Section 4, while Section 5 contains the discussion and conclusion. Finally, the last section covers the limitations of the study and suggestions for further research.

2. Literature Review

2.1. Literature Review on Food Loss Measurement and Evaluation Techniques

Food loss is a recognized global challenge, and extensive research has been conducted to measure and evaluate its impact. However, due to the relatively new nature of this field, researchers face various measurement problems and research constraints, including defining food loss, determining study areas, and limited budgets. In response, some researchers have adopted techniques, as shown in Table 2, such as expert opinions, knowledge from professionals, literature reviews, and analysis of secondary data, to assess the extent of food losses [27,28,29,30,31,32]. These techniques offer several advantages. Firstly, expert opinions and knowledge from professionals provide valuable insights into the factors contributing to food losses, ensuring a comprehensive understanding of the issue. Secondly, literature reviews enable researchers to draw from existing studies, enriching their assessments with established knowledge. Additionally, analyzing secondary data sources saves time and resources that would be required for primary data collection. By combining these methods, researchers can obtain a more accurate and comprehensive picture of food losses, enabling targeted interventions and informed policymaking to address this critical global issue.
A questionnaire survey is a widely used method for food loss measurement [33]. On the positive side, it allows researchers to collect data from a large and diverse sample, providing insights into food loss patterns across various regions and value chain stages. It is also cost-effective and time-efficient, enabling quick data collection and analysis. However, this method is susceptible to self-reporting and recall biases, potentially leading to inaccuracies and subjective interpretations of food loss data [32]). Therefore, food loss researchers are cautious about potential biases introduced by participants’ overestimation or underestimation. Despite these limitations, the questionnaire survey remains a valuable tool for gathering valuable information on food loss, especially when combined with other measurement methods such as primary data, on-farm investigations, and real measurements to enhance the comprehensiveness and validity of the findings [41,42].
On the other hand, some studies rely on field measurements, conducting detailed surveys, and assessments at different stages of the value chain. These techniques offer valuable insights into the quantity and nature of food losses, enabling a thorough understanding of each stage’s impact. By identifying critical points and underlying causes of food wastage, these methods facilitate evidence-based policymaking and targeted interventions, supporting the development of effective strategies to reduce food loss and promote sustainable food systems. Additionally, they allow for monitoring progress over time and enable global comparisons, enhancing their value in addressing the global challenge of food loss. However, these approaches come with the drawback of being time and resource-intensive, making it challenging to cover extensive areas and stages of the value chain. Data collection challenges may arise, limiting their generalizability to broader contexts. Despite these limitations, integrating various methods, including questionnaire surveys and expert opinions, can enhance the overall comprehensiveness and reliability of food loss assessments.
To standardize and guide food loss measurement and evaluation, several guidelines and recommendations have been proposed in the literature. The FAO has played a vital role in developing guidelines for estimating harvest and post-harvest losses of cereals and pulses, as well as fruits and vegetables, milk and meat, and fish and fish products. These guidelines focus on enhancing cost-effectiveness, prioritizing data collection efforts, and strengthening national estimates. Furthermore, they advocate for the improvement of predictive models to compensate for data limitations in specific situations.

2.2. FAO Guidelines

The Food and Agriculture Organization (FAO) provides a clear definition of food loss, encompassing all human-edible crop and livestock commodities that completely exit the post-harvest/slaughter production/supply chain and do not re-enter any other utilization, excluding the retail level. This definition covers losses occurring during storage, transit, processing, and even imported quantities. Notably, the entire commodity, including its non-edible components, is considered part of the losses [5]. For fruits, the harvest loss refers to the quantity of produce lost during harvesting operations, which may include losses due to economic conditions such as crops not being harvested due to low prices or contract limits. On the other hand, post-harvest loss is characterized by a reduction in the available quantity of produce, rendering it unsuitable for human consumption. This degradation in quantity occurs from the time of harvest until the point of consumption [8,43,44].
The national food loss index is determined through a bottom-up approach, starting with the creation of a commodity basket consisting of ten key commodities grouped into five main categories representing essential food groups. Food loss percentages (FLP) are then calculated for each commodity by analyzing product loss percentages at each stage of the value chain. The process involves breaking down the problem into structured parts, simplifying the supply chain into main stages, and obtaining loss estimates for each stage, which are aggregated to represent the entire chain. Although the loss percentages are likely representative at the national level, variations may exist among different actors within each stage. The standardized and aggregated FLPs contribute to the assessment of national-level losses.
The process of calculating the food loss index (FLI) involves applying national average loss percentages for crops and years at various stages of the supply chain, considering imports. The FLI is derived through three steps: obtaining product loss percentages (lijt), calculating the FLP using weighted averages based on commodity production values, and compiling the FLI by comparing the current period’s FLP to the base period’s FLP, expressed as a ratio multiplied by 100. The chosen weights are based on the economic value of production for each commodity, which is considered the least biased method for aggregation. It is important to note that the FLI will not capture qualitative or economic losses, nor losses resulting from low market prices. The process determining of FLI at the national level is depicted in Figure 2.
To ensure comparability and accurate estimation of food loss percentages (FLP) throughout the supply chain and over time, a diverse range of data collection instruments is necessary. The selection of measurement methods depends on the assessment’s purpose, available resources, and prior experience in loss assessments. The FAO’s approach prioritizes cost-effective and simplified methods [7]. Choosing the most suitable statistical tool involves considering specific crops and value chain segments (on/off-farm). While sample surveys with objective measurements are deemed the most reliable, their universal applicability in a cost-effective manner may vary. To illustrate, during the harvest stage, FAO recommends using crop-cutting surveys, on-farm direct measurements, and agricultural production questionnaires. For the post-harvest phase, FAO suggests employing sample surveys involving stakeholders to encompass all activities occurring after on-farm commodity harvests, such as sorting, grading, storage, and transportation along the value chain.

2.3. Food Loss Studies in Thailand

In the past, research on food loss in Thailand was limited, but it has gained more attention since the implementation of the Sustainable Development Goals (SDGs). Early studies focused on rice loss during harvest in 1983, revealing a loss percentage of 16.83% in the harvest and post-harvest operations [45]. Subsequently, the Office of Agricultural Economics calculated the average rice loss rate from harvest, accounted for by both human labor and machinery, at 12% of the country’s total production [13]. The International Agricultural Economics Division conducted a study on various fresh vegetables, estimating an overall food loss of 44% along their supply chains. This loss was distributed as follows: post-harvest and storage 9%, processing and packaging 25%, and distribution 10% [14]. Recently, the study of Attavanich et al. 2020 [15] based on the FAO definition reported percentage losses for specific items, such as cabbage (21.52%), tomato (10.21%), cassava (3.89%), UHT milk (2.67%), and tilapia (1.82%). However, the differing data collection approaches used in these studies make it challenging to directly use their results for quantitative assessments and the calculation of national food loss indices for UN reports. With the growing focus on food loss in Thailand, adopting standardized methodologies like FAOs will aid in producing more consistent and comparable data.

2.4. Fresh Longan Supply Chain

Longan is an economically significant fruit in Thailand, with 73.17% of planted area located in the northern region, 24.07% in the central region, 2.74% in the northeastern region, and 0.03% in the south. In recent years, improvements in longan production and technology have allowed for year-round production, resulting in increased income for farmers and the country. The highest concentrations of longan production can be found in Chiang Mai (26.30%), Lamphun (22.33%), and Chanthaburi (17.52%), according to data from the Office of Agricultural Economics [46].
Previous research on the longan supply chain or value chain has primarily focused on identifying issues such as infrastructure, production systems, marketing, management, logistics, and efficiency [47,48]. These studies have also sought to identify problems and obstacles in the longan supply chain or value chain, as well as the potential for exporting longans to China and other ASEAN countries. In Thailand, the longan supply chain includes both fresh longans for domestic consumption and export, as well as processed longans such as whole-dried longan, golden-dried longan, and canned longan. One study examined the green efficiency of a specific longan supply chain using a two-stage DEA approach [49]. There have also been studies on the export supply chain of longan and other fruits to BIMSTEC countries, particularly India [50], and the impact of COVID-19 on Thailand’s longan supply chain [51].

2.5. Longan Losses

Longan loss is influenced by various characteristics and causes, as shown in Table 3. These characteristics encompass physical damage, bruising, and spoilage, often resulting from improper harvesting, handling, and storage practices. Pest and disease infestations, transportation issues, market fluctuations, and the timing of maturity also contribute significantly to losses. Moreover, factors at the pre-harvest stage, such as the suitability of area conditions and farmer readiness, along with farm management practices like pruning, fertilization, and pest control, can impact longan output. Additionally, climate conditions and limited processing facilities play a significant role in affecting both longan production and market opportunities.

3. Materials and Methods

3.1. The Scope of Food Loss Assessment

The scope of this study entails a comprehensive assessment of fresh longan loss, encompassing both in-season and off-season production. The assessment includes examining physical and economic losses at all stages of the fresh longan value chain, including harvesting, sorting, grading, packaging, and transportation. The research adheres to the global food loss assessment guidelines provided by the FAO [7]. The study area focuses on the two largest in-season longan-growing regions in the upper north of Thailand, specifically Chiang Mai and Lamphun, as well as the two largest off-season longan-growing regions in the eastern region, Chanthaburi and Sa Kaeo. Data will be sourced from the OAE database [46].
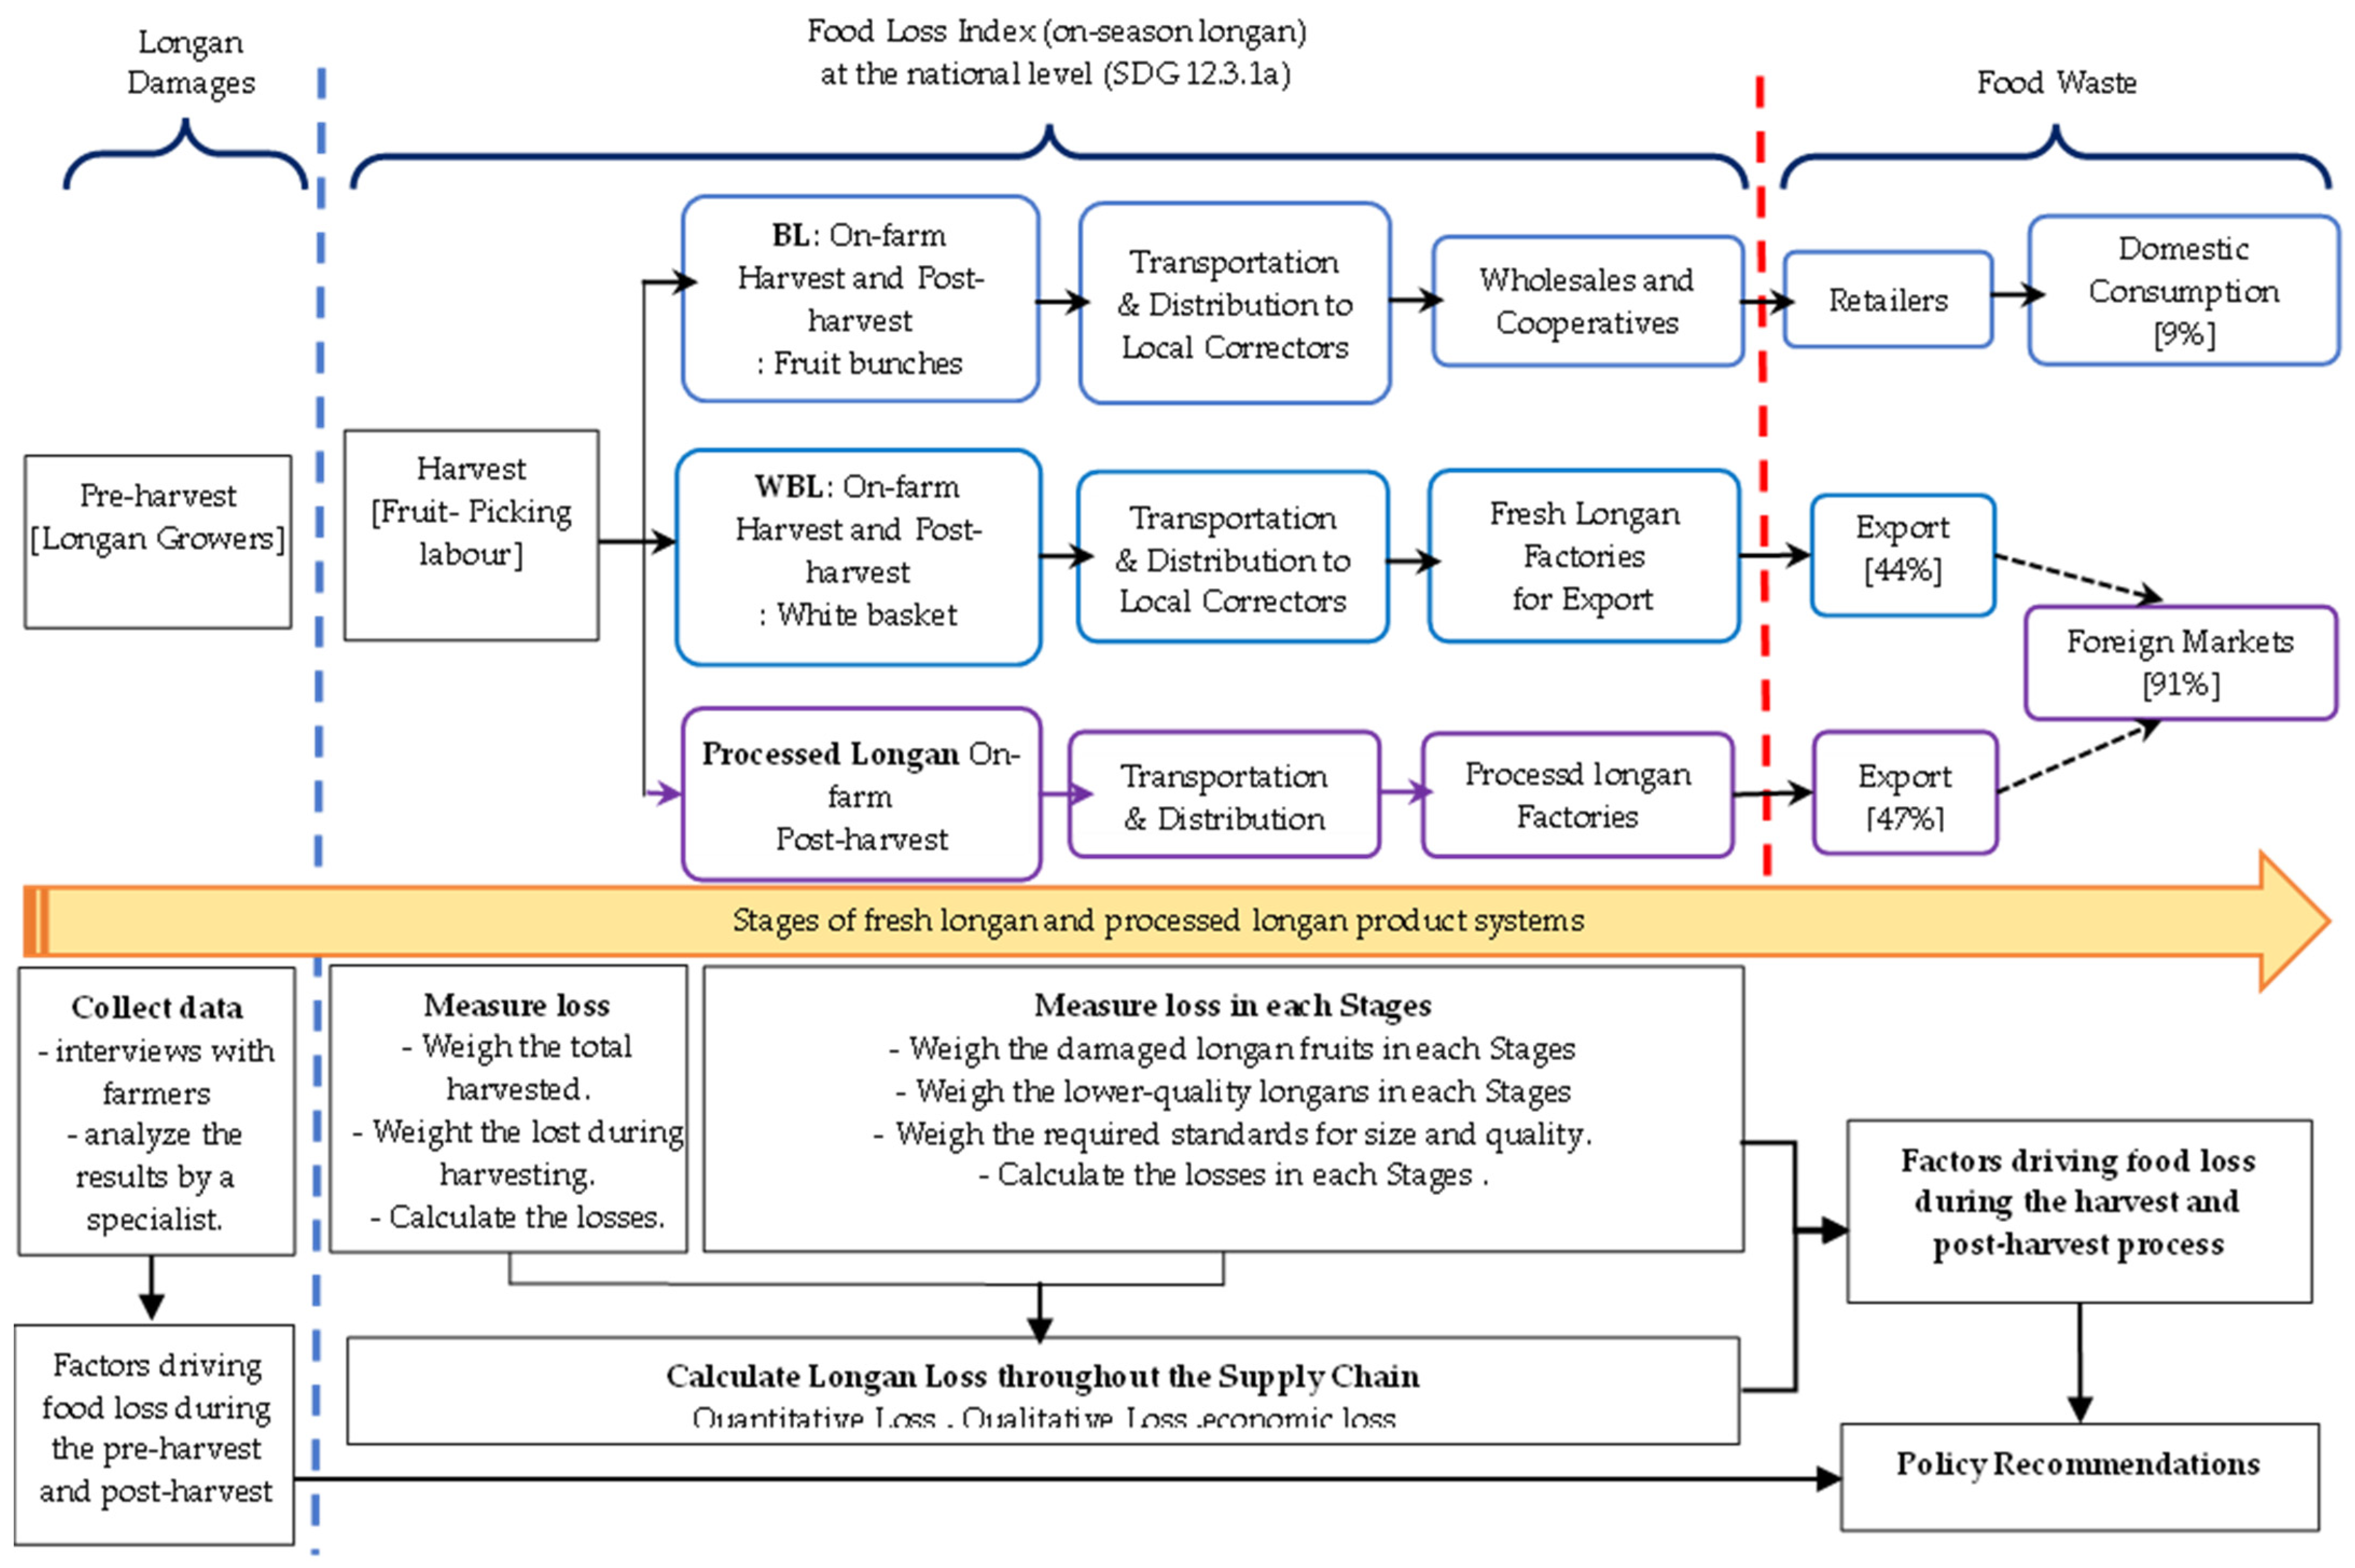
The FAO guidelines recommend commencing food loss assessment by concentrating on product losses, encompassing all quantity losses throughout the value chain. The longan value chain flowchart presented in Figure 3, provided by the Office of Agricultural Economics (OAE), offers insights into the dynamics of the longan industry [47]. Two main fresh longan value chains were examined for food loss measurement: the fresh longan bunch chain for domestic consumption (BL) and the fresh longan in white basket chain (WBL) for export, which account for 9% and 44% of total production, respectively. The remaining 47% of production is directed to the processed longan chain, which includes canned longan, golden-dried longan, and frozen longan. The primary focus of this study revolves around the BL and WBL value chains.

3.2. Population and Sample Size

The population and sample size for longan loss assessment in this study were meticulously determined through two distinct phases. Phase I conducted a preliminary food loss assessment to identify critical loss points, analyze the industry context and supply chain, and determine driving factors affecting food loss. It also calculated the coefficient of variation (CV) and established the appropriate sample size for Phase II.
Data collection for this study involved a comprehensive approach, encompassing in-depth interviews, semi-structured questionnaires, and focus group interviews, targeting longan growers and stakeholders within the fresh longan supply chain. The sample size included 300 longan growers and 19 stakeholders, selected through a combination of snowball and purposive sampling methods. Additionally, two focus group interviews were conducted in Chiang Mai and Chanthaburi provinces, representing the northern and eastern Longan plantation regions, respectively, to obtain valuable insights from key industry stakeholders. Despite the challenges presented by the COVID-19 pandemic, data collection took place from June to December 2020. The computed coefficient of variation (CV) yielded values of 0.78 for longan growers and 0.28 for fresh longan factories or suppliers for export, indicating the variability within the data sets. For more in-depth findings from Phase I, detailed results are available upon request.
Phase II of the study encompassed a comprehensive food loss assessment, which aimed to quantify quantity, quality, and economic losses along the longan supply chain. Additionally, the study sought to analyze critical loss points, identify causal factors, and calculate product loss percentages for the national baseline. The focus was directed toward the top eight longan cultivation provinces, together accounting for 93.05% of the total longan plantation area. Among these provinces, six were known for on-season cultivation, namely Chiang Mai, Lamphun, Chiang Rai, Phayao, Nan, and Lampang, while off-season cultivation took place in Chanthaburi and Sa Kaeo. Data collection for the on-season was undertaken from July 2021 to September 2021, while data for the off-season were gathered from November to December 2021. To assess harvest losses for longan growers, multiple methods were employed, including on-farm direct measurements and agricultural production questionnaires.
The on-farm direct measurements utilized purposive sampling with a focus on clustered areas. This method entails physically measuring and observing crops in the fields. Researchers visit selected farms to directly assess longan quantity, harvested produce weight, and longan loss. This approach ensures precise and accurate data on crop yields and losses at the individual farm level. Sixteen farms were selected for on-farm direct measurements, with ten samples taken from on-season farms and six samples from off-season farms. For on-season farms in Chiang Mai and Lamphun provinces, the planting regions were categorized into upper, middle, and lower parts, considering variations in planting techniques, weather conditions, and harvesting periods. Each area was represented by one sample, resulting in three observations for the Chiang Mai and Lamphun provinces. However, due to the relatively smaller plantations in Nan, Chiang Rai, Lampang, and Phayao, only one sample was collected from each of these provinces. For the off-season longan in Chanthaburi and Sa Kaeo provinces, data collection required selecting four farms from Chanthaburi and two farms from Sa Kaeo. This decision was made because Chanthaburi has a larger area dedicated to longan cultivation compared to Sa Kaeo.
Agricultural production questionnaires, also known as on-farm questionnaires, play a vital role in assessing critical loss points and identifying underlying causes. These surveys are distributed to farmers and agricultural stakeholders to gather essential insights into diverse aspects of agricultural practices—ranging from crop cultivation and input usage to crop yields and losses. By utilizing these questionnaires, researchers can uncover factors influencing food loss and formulate strategic decisions to address agricultural production challenges, thus effectively reducing losses.
Determining the appropriate sample size for the agricultural production questionnaires employed Thomson’s formula for relative precision [66], represented as
n ( r e l ) = N × ( z 2 ) × γ 2 ( z 2 × γ 2 ) + ( N × r 2 )
where N signifies the population size, γ stands for the coefficient of variance, z indicates the 95% confidence level, and r represents the preferred potential error, set to be under 10%. This formula aids in calculating a suitable sample size that captures data with the desired accuracy and confidence level.
The surveys were conducted during the primary longan cultivation season, covering Chiang Mai and Lamphun. Conversely, the off-season encompassed Chanthaburi and Sa Kaeo. Applying Thomson’s formula to the longan grower data from all four provinces yielded a total sample size of 88. Subsequently, the sample allocation for each province was determined proportionally to its population. As a result, 72 samples were collected from in-season farmers in Chiang Mai and Lamphun provinces, while 16 samples were obtained from off-season farmers in Chanthaburi and Sa Kaeo provinces.
The on-farm questionnaire is specifically crafted to gather firsthand information directly from farmers and agricultural stakeholders regarding losses encountered during different stages of longan harvest and post-harvest. The questionnaire aims to comprehensively collect details about diverse facets of agricultural practices. These include harvesting, as well as processes such as collection, grading, packaging, transportation, and storage. Furthermore, the questionnaire delved into essential aspects such as crop cultivation, input utilization, crop yields, losses experienced at the farm level, and the underlying causes of these losses.
Engaging with off-farm stakeholders, including cooperatives, fresh longan export factories, and wholesalers, we adopted a unique approach. In cases where official data for cooperatives were unavailable, we utilized the snowball sampling method to select our sample. With a focus on the primary cultivated regions of Chiang Mai and Lamphun provinces, we chose cooperatives involved in fresh longan activities from each province to represent our sample. This encompassed Pratu Pa Agricultural Cooperative Limited of Lamphun and Phrao Agricultural Cooperative Limited of Chiang Mai. Similarly, for fresh longan export factories strategically situated in high cultivation areas, we computed the sample size using the formula from Equation (1). For the on-season, we determined a sample size of fourteen, equally divided between Chiang Mai and Lamphun provinces, while the off-season in Chanthaburi province was represented by twelve samples. A comparable strategy was employed for wholesale stakeholders. Within the well-known fresh fruit wholesale market, ‘Ta-laadthai’, we identified two wholesale markets as the foundation of our sample through the snowball sampling method.
The off-farm questionnaire is specifically designed to gather information about loss during the transportation, storage, and various other stages of fresh longan beyond the farm level. The questionnaire employed a combination of inquiries and direct observations to comprehensively document these losses. Additionally, the questionnaires recorded supplementary indicators such as transportation mode, packaging type, transported quantity, storage method and facility, quantity stored or handled, humidity, temperature, causes of loss, and the proportion of loss relative to the total quantity handled at each stage of the process.

3.3. Data Collection by On-Farm Direct Measurements

The data collection process for on-farm direct measurements in this study encompassed two distinct approaches to capturing loss data: quantitative loss, which referred to the reduction in the amount of consumable food throughout the supply chain, excluding weight loss, and qualitative loss, characterized by the degradation in food quality or value while still retaining edibility [67].

3.3.1. On-Farm Direct Measurements at the Lower Level of Logan Grower

  • Selection of Sites
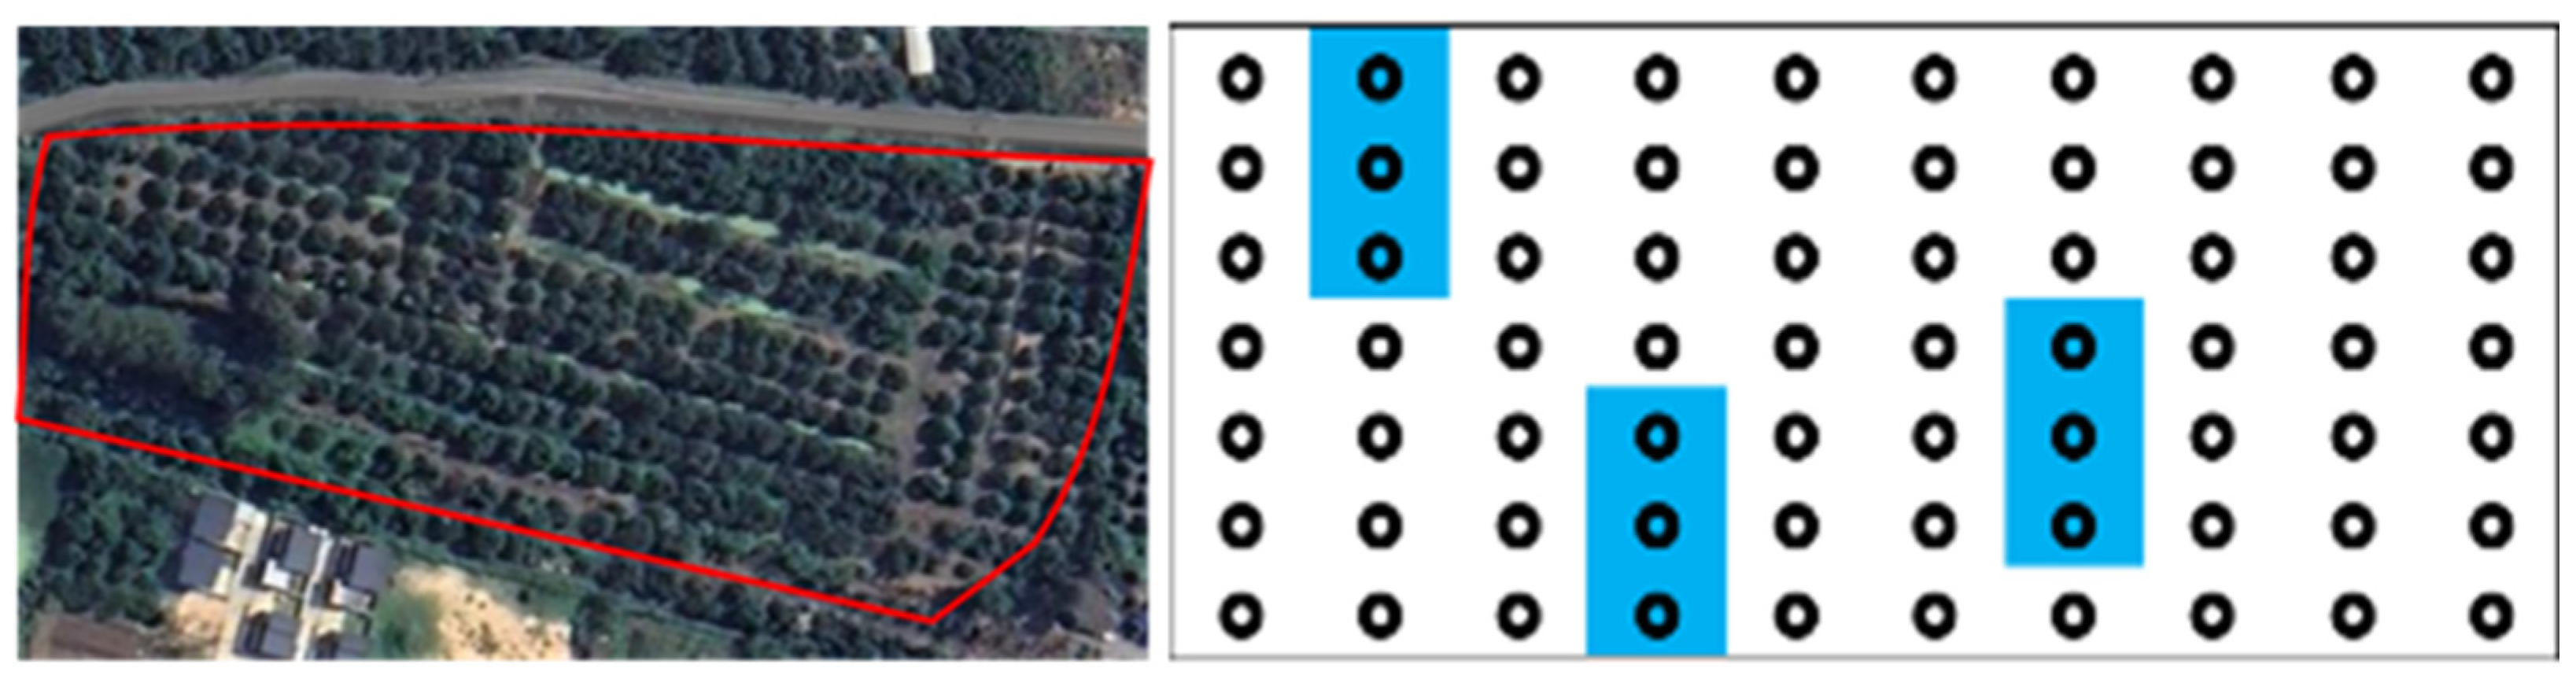
The selection of longan orchards for on-farm direct measurement involved a systematic approach aimed at identifying suitable representative locations reflecting diverse longan farming practices. This method included thorough research to identify areas with high longan production levels, varying cultivation methods, and diverse agro-climatic conditions. The emphasis lay on achieving geographic diversity, accessibility, and collaboration with local farmers to pinpoint pertinent sites. Furthermore, accounting for both the main harvesting season and off-season was crucial to gaining comprehensive insights into the factors impacting longan production.
Once the sample longan orchards were identified, the process commences with conducting interviews with growers to gather information about the longan plantation areas and the number of longan trees. This data aids in creating a comprehensive map of the Longan plantations. Subsequently, the methodology involved establishing points for measuring food loss on the farm, aligning with the FAO’s 2018 food loss measurement guidelines. Specifically, three rows were randomly selected within each of the three clusters of samples, with three longan trees chosen from each row (Figure 4). The research team then undertakes preparations, including cleaning the area beneath the longan trees and laying out a canvas of the same width as the shrub’s size to facilitate accurate measurement procedures.
2.
Food loss measurement
This stage involves assessing losses occurring at the grassroots level of longan cultivation and across the entire longan supply chain. Losses during the harvesting and post-harvest management of longan encompass distinct processes based on their respective purposes.
(2.1)
Harvesting process: Once the canvas was laid out, local harvest laborers commenced the process of harvesting longans. To begin the assessment, the research team first recorded the weight of the various baskets employed by the workers for collecting longans, given that these baskets differ among different orchards. Subsequently, fruit pickers gather the longans and place them in the baskets. The combined weights of the harvested longans were then measured (A) and documented, accounting for the baskets’ weight to accurately determine the longans’ weight. Following this, the research team collects any longans that had fallen during the harvesting process (B) onto the blue plastic canvas, recording their weight. The loss of produce at this stage was considered a “quantitative loss,” as all fallen output was deemed unsuitable for consumption, regardless of the reason for its falling.
(2.2)
Sorting, grading, bunching, and packing process: In this phase, freshly harvested longan fruits were typically sorted, graded, bunched, and packed on the farm by skilled sorting and packing teams, adhering to both domestic consumption and export standards for longan quality. A randomly selected batch of fresh longans from the baskets was weighed, after which the fruit grading and packing personnel meticulously removed any undesirable leaves and branches that did not meet quality standards. Following this, the workers proceeded to identify and separate damaged longan fruits (E) and lower-quality longans (F). The damaged longan fruits represented a ‘quantitative loss,’ while the lower-grade longans signify a ‘quality loss’. The remaining longans, which met the required standards for size and quality, were weighed and documented (D). Subsequently, these premium fresh longan fruits were meticulously packed into baskets destined for selling to both fresh longan business operators and export-oriented fresh longan factories.
3.
Calculation of Food Loss Percentage
Using the collected data, the percentages of food loss (both in terms of quantity loss and quality loss) were calculated using the formula below. Given that the direct measurement of the weight of all longan output (excluding branches and leaves) from a sole longan plant was not feasible within the regular harvest process, it was instead derived from the collected data. Let Y denote the total weight of all harvested longan output from a specific longan plant, except for branches and leaves.
Y   = A ( A × C ( D + E + F ) C × 100 )
Food loss percentage during harvesting (quantitative):
F L q u a n t , 1 = B Y + B × 100
Food loss percentage during grading (quantitative):
F L q u a n t , 2 = E D + E + F × 100
Food loss percentage during grading (qualitative):
F L q u a l , 2 = F D + E + F × 100
where
A = Total weight of harvested longan yield, including longan plant branches and leaves (harvesting process);
B = Weight of fallen longan fruits during harvesting (harvesting process);
C = Weight of a randomly selected basket of longan fruits (grading process);
D = Weight of undamaged longan fruits in one basket (grading process);
E = Weight of damaged longan fruits in one basket (grading process);
F = Weight of non-standard size longan fruits in one basket (grading process).

3.3.2. Actual Measurement at Fresh Longan Factory for Export

1.
Food loss measurement.
The packed fresh longans in the white basket were transported from longan orchards to the fresh longan factory for export. After fresh longans arrived at the factory, laborers would bring the baskets of fresh longans down from the pickup truck to go through the quality inspection process. The process started with sorting out the damaged longan fruits, regrading, and closing the basket. The damaged longan fruit part was a “quantitative loss” because it would be discarded. This process takes a little time because most of the longan fruit produced was packed by skilled labor in the grower’s grading process. After that, the produce would be taken to receive SO2 fumigation. The research team will weigh the good quality longan fruit produce (N) in the basket and the damaged longan fruits (H) and record. To measure SO2 fumigation losses ( F L q u a n t , 4 ( exp ) ), the interview method was used because the SO2 fumigated longan baskets had already been packed on pallets, which had already been packed for loading in a truck container.
2.
Food loss calculation.
Food loss percentage during grading of fresh longan factory for export (quantitative) was
F L q u a n t , 3 ( exp ) = H G + H × 100
where
G = Weight of good quality longan fruit produce;
H = Weight of damaged longan fruits.

3.3.3. Actual Measurement at Agricultural Cooperative

  • Food loss measurement.
The bunched fresh longans in the basket were transported from longan orchards to the agricultural cooperative. After fresh longans arrived at the cooperative, laborers would sort out the damaged longan fruits and pack them in new packaging according to customer requirements. The damaged longan fruit part was a “quantitative loss” because it would be discarded. After that, the produce will be taken to undergo the SO2 fumigation process. The research team weighed the good quality longan fruit produce (I) in the new packaging and the damaged longan fruits (J) and recorded the weights. To measure SO2 fumigation losses ( F L q u a n t , 4 ( d o m ) ), the interview method was used.
2.
Food loss calculation.
Food loss percentage during grading of fresh longan cooperative (quantitative) is
F L q u a n t , 3 ( d o m ) = J I + J × 100
where
I = Weight of good quality longan fruits;
J = Weight of damaged longan fruits.

3.3.4. Actual Measurement at the Wholesale Level

  • Food loss measurement.
After fresh longans arrived at the wholesale establishment, laborers would sort out the damaged longan fruits. The damaged longan fruit part was a “quantitative loss” because it would be discarded. The good quality longan fruits would be rearranged in preparation for selling. The research team weighed the good quality longan fruit produce (K) in the new packaging and the damaged longan fruits (L) and recorded the weights. The food loss was caused by the transportation process from the local fresh longan business operator or cooperative to the wholesaler.
2.
Food loss calculation.
The percentage of food loss of fresh longan wholesalers (quantitative) was
F L q u a n t , 5 = L K + L × 100
where
K = Weight of good quality longan fruits;
L = Weight of damaged longan fruits.

3.3.5. Comprehensive Longan Loss throughout the Supply Chain

The comprehensive assessment of longan loss throughout the supply chain commences with the establishment of the initial quantity, designated as 100, for calculation purposes.
Quantitative Loss
The process unfolded in successive steps, starting with the harvesting activity (Activity 1), where the percentage of quantitative loss (FLquant,1) was gleaned from recorded data. Utilizing this percentage, the loss amount in Activity 1 (Loss1) was computed by multiplying the initial quantity (100) by FLquant,1. The remaining quantity after Activity 1 (Rquant,1) was determined through the subtraction of Loss1 from the initial quantity (100).
Advancing to Activity 2, encompassing grading and bunching, the percentage of quantitative loss was determined based on data records. The loss amount for this activity (Loss2) was evaluated by multiplying Rquant,1 by the percentage of quantitative loss in Activity 2 (FLquant,2). Following this, Rquant,2 (the residual quantity after Activity 2) was computed by deducting Loss2 from Rquant,1.
The quantitative loss computation for Activity 3 (grading at fresh longan factory/cooperative), represented in the third step, follows a similar methodology. The loss amount (Loss3) was determined using Rquant,2, and the corresponding percentage of quantitative loss (FLquant,3). Rquant,3 was ascertained by subtracting Loss3 from Rquant,2.
Transitioning to the fourth step, involving Activity 4 (SO2 fumigation), the calculation was derived from Loss4, which depended on Rquant,3 and the percentage of quantitative loss (FLquant,4). Subsequently, Rquant,4 was calculated by subtracting Loss4 from Rquant,3.
In the culminating step, which corresponded to Activity 5 (Wholesale), the quantitative loss assessment was reiterated. The loss amount (Loss5) was computed utilizing Rquant,4, and the associated percentage of quantitative loss (FLquant,5). Rquant,5 was calculated by subtracting Loss5 from Rquant,4. Consequently, for i = 1 to 5 (signifying activities) and with Rquant,0 = 100 (initial quantity), which could be written the expression as follows:
R q u a n t , i = R q u a n t , i 1 ( R q u a n t , i 1 × F L q u a n t , i )
This concise formula encapsulated the iterative process of computing residual quantities (Rquant) for each activity within the quantitative loss calculation. Ultimately, the comprehensive Longan Loss throughout the Supply Chain was determined by
F L q u a n t = 100 R q u a n t , 5
Qualitative Loss
In terms of the qualitative loss experienced in exported and locally consumed fresh longans, it was notable that there were two prominent stages involved. The first stage was the farmers’ grading, bunching, and packing process (Activity 2). As a result, the comprehensive assessment of qualitative loss (FLqual) within the longan supply chain was established using the subsequent formula:
R q u a l , 2 = 100 ( 100 × F L q u a l , 2 )
F L q u a l = 100 R q u a l , 2 = F L q u a l , 2
The second was regarding the packing house in the factory. This stage had a little qualitative loss (FLqual) because most of the fruits were packed and graded by the skilled workers at the farm level, but sometimes the fruits were packed by the owner’s workers teams before the regrading, which caused qualitative loss (FLqual) at the longan factory level to be significant. As a result, the comprehensive assessment of qualitative loss (FLqual) within the longan supply chain was established using the subsequent formula:
R q u a l , 2 = 100 ( 100 × F L q u a l , 2 )
F L q u a l = 100 R q u a l , 2 = F L q u a l , 2
For this study, all of the longan fruits were sorted, packed, and graded by the skilled workers who were the vendors in the vendor list of the longan factories at the farm level, so the qualitative loss (FLqual) at the longan factory level did not occur. Therefore, qualitative loss (FLqual) at the longan factory level was not used in the calculation.

3.3.6. Economic Loss

The process of assessing economic loss (EL) involved quantifying the monetary value of food that went to waste due to quantitative losses (ELquant) and qualitative loss (ELqual) and understanding the financial impact arising from the deviation from expected normal values due to qualitative losses.
E L = E L q u a n t + E L q u a l
To accurately compute economic loss, it is crucial to have information about the amount of loss, the product’s price, and the extent to which qualitative loss affects its value. The price used for these computations was based on actual market prices observed over the previous three years.
However, there might be challenges in obtaining accurate prices for all activities under certain circumstances. In such cases, this study segmented activities into two categories: those conducted before the SO2 fumigation process and those carried out after it. For quantitative losses, economic loss was obtained by summing up the economic losses before and after SO2 fumigation.
Quantitative economic loss
For quantitative losses, economic loss is obtained by summing up the economic losses before and after SO2 fumigation. The economic loss before SO2 fumigation is calculated by multiplying the price of the product before SO2 fumigation (P1) by the quantitative loss before SO2 fumigation (RTRquant,BEF). The economic loss after SO2 fumigation is determined by multiplying the price of the product after the SO2 fumigation process (P2) by the quantitative loss after SO2 fumigation (Rquant,BEFRquant,AFT). The calculation formula can be presented as follows:
E L q u a n t = [ ( R T R q u a n t , B E F ) × P 1 ] + [ ( R q u a n t , B E F R q u a n t , A F T ) × P 2 ]
where
ELquant = Economic loss;
RT = Quantity of initial product;
Rquant,BEF = Residual quantity of product before SO2 fumigation;
Rquant,AFT = Residual quantity of product after SO2 fumigation;
P1 = Average price of the product before SO2 fumigation over 3 years;
P2 = Average price of the product after SO2 fumigation over 3 years.
Qualitative economic loss
The qualitative loss was found only in pre-SO2 fumigation activities. Thus, the economic loss is calculated by multiplying the reduced value of the product resulting from the quality loss (P3) by the qualitative product loss (RTRqual,BEF). The reduced value of the product (P3) is calculated from the difference between the price of the product that should have been received and the price of the product that has decreased in quality for 3 years on average. The calculation formula can be shown as follows.
E L q u a l = ( 100 R q u a l , B E F ) × P 3
where
ELqual = Qualitative economic loss;
RT = Quantity of initial product (total output in the product supply chain);
Rqual,BEF = Residual quantity of product before SO2 fumigation (from qualitative loss);
P3 = Average reduced value of the product before SO2 fumigation over 3 years.

4. Results

This section underscored the pervasiveness of food loss throughout the supply chain, spanning harvesting, transportation, and storage, resulting in quantitative, qualitative, and economic losses. The results of the study were divided into two parts: first, we present percentages of quantitative, qualitative, and economic food loss for BL and WBL chains, and then key activities driving longan losses are presented.

4.1. Quantitative, Qualitative, and Economic Loss

4.1.1. Fresh Longan for the Domestic Market

Regarding domestic fresh longan supply chains or BL, key participants comprised longan cultivators (for fresh longan), harvesting, bunching, and packaging staff, fresh longan cooperatives, and wholesalers. This complex network of engagements encompassed various tasks like harvesting, post-harvest processes, transporting, sulfur dioxide fumigation, and wholesale operations.
(1) Quantitative Food Loss. The quantitative assessment of food loss unveiled that 14.07% of the longan fruits experienced losses along the supply chain, leaving only 85.93% available for consumers (Table 4). The analysis identified the subsequent activities as sources of quantitative food loss:
Harvesting: At this stage, the longans deemed suitable for harvesting might have attained an optimal level of maturity consistent with the criteria specific to their variety and the cultivation region. Their pericarb should exhibit a smooth texture, and their taste should align with the expectations for fresh consumption. Longans needed to be in a satisfactory condition and to meet the standards of consumer acceptability. Additionally, the longans’ characteristics should include being whole, undamaged, and unaffected by decay or deterioration; they should be devoid of prominent flaws, substantially free from pests and associated damages, and devoid of any injuries caused by extreme temperatures. Harvesters carefully detached the longan inflorescences from the tree branches using gentle techniques to avoid causing any damage to the fruits or the tree. Longan fruit was typically harvested in inflorescences or bunches. Harvesters gathered a group of fruits from the same branch and gently placed them into baskets or containers.
However, quantitative food loss at harvest primarily occurred due to the dropping of overripe longan fruits, which tended to rot, crack, and bruise upon impact. The timing of longan harvesting was a critical factor that directly impacted the quantity loss because longan fruits that were left on the tree for too long might become overripe or start deteriorating due to factors like aging, pest attacks, fungal growth, and physical damage from exposure to weather elements. Overripe fruits could easily split open or become mushy, rendering them unsuitable for consumption and causing a substantial increase in quantity loss. A scarcity of skilled labor, especially amid the COVID-19 pandemic, could result in hurried harvesting, heightening the risk of damage and loss [51]. Waiting too long to harvest could also result in fruit drop, sugar content reduction, growth of the seed’s funiculus, seed germination, higher rate of post-harvest deterioration, and shortened storage life. The other attributes contributing to longan loss at the harvest stage included physical damage from impact force during falling or contact with branches and leaves and microbial and pest attacks such as bacteria, fungi, and moths causing damage and making the fruit unsuitable for consumption. At this stage, the longan loss percentage was 3.92%.
Sorting/grading at the orchard: Following the harvest, the gathered longan bunches were taken to a designated sorting area in the longan orchard. Here, a more meticulous inspection of the fruit occurred, aimed at identifying any instances of damage under standard size (tiny) fruits or overripeness among the longan fruits. Any compromised fruit was isolated from the batch of high-quality ones. The harvested fresh longan fruits were meticulously sorted and categorized into three classes based on criteria like size, skin color, and defects. These categories, namely extra class, class I, and class II, were all fitted for Thai agriculture standard of longans [68,69] and domestic consumption, hence not categorized as food loss. On the other hand, longans that fail short of the defined standards due to factors such as small size (tiny fruit), overripeness, and physical damages like bruising, cracking, blemishes, and scars, or those affected by pest attacks or fungal growth, were deemed unsuitable and were thus classified as food loss. Once the sorting process was completed, the remaining premium longans were attentively bundled and packaged into baskets or containers, ensuring secure packaging to prevent any subsequent damage during the transportation phase. At this stage, the longan loss percentage was 2.54%
Sorting/grading at cooperative: Since the agricultural cooperatives were strategically situated within the immediate vicinity and heart of the longan cultivation zones, transportation distances and times were relatively minimal, leading to negligible quantity loss during the transit from farms to agricultural cooperatives. Nonetheless, upon arrival, meticulous quality checks, including size assessment and damage inspection, were conducted on the harvested longan bunches. Further sorting and grading were executed based on size, color, and defects to ensure quality control. Subsequently, premium longans were meticulously assembled into bunches and repackaged into designated baskets or containers. This packaging approach was designed to mitigate potential damage during subsequent transportation to wholesale markets or department stores. Notably, the percentage of longan loss at this stage stood at 0.26%, contingent upon the quality of prior sorting and grading activities at the orchard stage. In other words, the effectiveness of these earlier activities in eliminating damaged or substandard longans directly impacted the overall loss percentage at this point in the supply chain. If the sorting and grading were thorough and efficient, the remaining longans entering this stage would be of higher quality, resulting in a lower percentage of loss.
SO2 fumigation: At this stage, the percentage of longan loss was 0.16%. The characteristics of loss encompass fruit rotting due to the fruit’s high moisture content, possibly resulting from weather conditions like rain during harvesting or transportation. Additionally, exocarp discoloration, including stained and darkened exocarp, could occur. This staining resulted from insufficient sorting before fumigation, leading to the release of fruit juice from rotting longan fruits. This fruit juice contains sugars that interact with the sulfur dioxide (SO2) used in the process, causing the defective fruit and adjacent longan fruits to become discolored.
Transport to wholesale markets: After SO2 fumigation, during the transportation to agricultural cooperatives and wholesale markets or distribution centers of department stores, the longan loss percentage increased significantly at this point, reaching 7.85%. The factors attributable to this food loss included physical damage to the longans during transportation, such as bruising and cracking caused by impacts. Furthermore, there is a potential for losses due to fruit detachment from the bunch and additional rotting triggered by extended transit durations or unfavorable environmental conditions. This underscored the importance of careful handling and efficient transportation practices to curtail these potential losses and enhance overall product quality.
(2) Qualitative Food Loss. The evaluation of qualitative food loss unveiled that 11.02% of the longan fruit was lost throughout the supply chain, leaving only 88.98% available for consumers (Table 5). The investigation pinpointed the subsequent activities as contributors to qualitative food loss.
Sorting/grading at orchard: Quality loss in domestic consumption longans was specifically identified within the sorting/grading/bunching phase, constituting 11.02% of the total losses. This type of loss primarily involves attributes such as small-sized longans, striped longans, those with darkened exocarps, funiculus growth, seed germination, and instances of coccidae and mealybugs infestations. These discrepancies in quality could be attributed to a range of factors, including less rigorous sorting and grading procedures compared to the export-oriented chain, potential oversight or misjudgment during these processes, and pre-harvest conditions that might encourage the presence of pests or result in uneven fruit development.

4.1.2. Fresh Longan for Export

Within the export-focused fresh longan supply chain, stakeholders included longan cultivators (for fresh longan), laborers for harvesting, sorting, and packaging, as well as entrepreneurs managing fresh longan factories for export purposes. This intricated series of processes encompasses diverse activities like harvesting, post-harvest handling, transportation, sulfur dioxide (SO2) fumigation, and export preparations.
(1) Quantitative Food Loss. In the context of the fresh longan supply chain intended for export, primary participants consisted of longan growers and entrepreneurs responsible for fresh longan factories dedicated to the export market. This sector entailed a spectrum of activities spanning harvest, post-harvest handling, and transportation. The analysis of quantitative food loss in this category revealed an on-season and off-season loss of 13.50% and 9.85% of longan fruit throughout the supply chain, leaving 86.50% and 90.15% available for consumers (Table 6), respectively. The assessment identified several activities as significant contributors to quantitative food loss.
Harvesting: The loss encountered during the harvesting phase predominantly stemmed from the drop of longan fruits. Overripe fruits, vulnerable to rot, cracking, bruising, and weakened stems, often fail during the harvesting process. Factors such as postponed harvesting, insufficient pre-harvest care, and less careful harvesting practices contributed significantly to these losses. The scarcity of proficient labor further compounded these challenges, an issue further intensified by the impacts of the COVID-19 pandemic.
In the realm of export-oriented fresh longan supply chains, the harvest loss percentages stood at 7.29% during the on-season and 4.47% during the off-season. Both of these loss rates surpassed the figure observed in the context of domestic consumption, which remained at 3.92%. These divergent loss patterns stemmed from variations in harvesting techniques, the inadequacy of skilled labor, and the stringent regulations governing exports and local consumption. The approach differed between fresh longan intended for local consumption, where harvesting was often carried out by household or community laborers, ensuring timely collection and mitigating the risk of overripening.
Conversely, within the sphere of exporting fresh longan through the WBL chain, export facilities were compelled to strictly adhere not only to standards such as National Bureau of Agricultural Commodity and Food Standards TAS 1-2003 [68] and National Bureau of Agricultural Commodity and Food Standards [69], GAP but also to the distinct regulations and requisites linked to importing longan, tailored to the unique criteria of each recipient country. These regulations encompassed acts like the Food Safety Law [70] and the Law of Entry and Exit Animal and Plant Quarantine [71].
As a result, these export facilities upholded dedicated teams and specialized staff with expertise in the collection of fresh longan. Harvesting delays constitute a significant cause of food loss and could arise from multiple factors. Entrepreneurs often awaited the optimal size of longan before commencing the harvest, and a scarcity of harvest labor could also contribute to delayed harvesting. This issue was particularly amplified when there was a substantial volume of on-season fresh longan flooding the market. The shortage of harvesting teams could cascade into delays across numerous longan orchards, eventually leading to over-ripen fruits. This, in turn, heightens the susceptibility to food loss due to the fruit’s deterioration resulting from pest infestations, fungal growth, exposure to adverse weather conditions, etc. Consequently, the harvest loss during the on-season period was notably higher than that during the off-season time.
Sorting/grading at the orchard: Following the harvesting stage, the sorting and grading process resulted in wastage due to the identification of rotten, bruised, and damaged fruits, as well as the exclusion of those not suitable for consumption. This procedure encompassed both quantitative and qualitative losses, primarily emerging from delayed harvesting, inadequate pre-harvest care, and insufficient pest and disease management. Additionally, the rigorous import regulations of foreign countries also contributed to this situation. At this phase, the longan loss percentage for the WBL chain was calculated at 5.58% for the on-season and 3.55% for the off-season, which surpassed the 2.54% observed for the BL chain.
The observed higher food loss in export-oriented supply chains, in contrast to domestic consumption, could be attributed to several key factors. Firstly, the process of exporting mandated strict adherence to stringent quality standards set by various countries. In cases where fruits do not align with these standards due to factors such as size, appearance, or the need for more comprehensive pest and disease control measures, the off-standard fruits were removed during sorting and grading, resulting in elevated losses. Secondly, fresh longans intended for export were often harvested slightly before their optimal ripeness. This early harvesting was carried out to ensure the fruits remained fresh during transportation. However, this practice could lead to a decline in overall fruit quality, consequently contributing to increased losses in comparison to domestically consumed fruits, which could be harvested at their full ripeness.
Sorting/grading at the factory: After the freshly sorted longans intended for export were transported from the orchard, they arrived at the longan processing facility. At this point, the harvested longans underwent an initial reception process. During this phase, the overall quality of the batch was evaluated. Any evident concerns, such as visible damage resulting from incomplete sorting and packing at the orchard or issues arising during transportation, such as bruising, crushing, or the formation of cracks on the fruit’s exocarps, were carefully examined. These imperfections could compromise the fruit’s visual appeal and make it more prone to swift deterioration during subsequent storage and transportation. In this phase, a food loss of 1.03% during the on-season and 1.67% during the off-season had been recorded.
SO2 fumigation: The SO2 fumigation stage exhibited two primary patterns of loss. Firstly, post-fumigation, the fruit exocarp displayed staining and darkening. This phenomenon was linked to the presence of decaying longan fruits, with their sugars contributing to the discoloration. Secondly, specific longan fruits underwent rotting during the fumigation process, likely due to their moisture content, which could be influenced by weather factors such as rainfall during harvesting or transportation. During this stage, a food loss of 0.16% during the on-season and 0.50% during the off-season had been documented.
(2) Qualitative Food Loss. In terms of qualitative food loss, evaluations revealed a 14.82% loss during the on-season and a 6.52% loss during the off-season throughout the supply chain. This meant that consumers were left with only 85.18% and 93.48% of high-quality fresh longan, meeting the standards for export (as shown in Table 7). Within this framework, only sorting/grading at the orchard (Activity 2) was identified as a critical point contributing to qualitative food loss.
Sorting/grading at orchard: Qualitative losses encompassed a range of factors, including smaller-sized longans, striped longans, those with darkened exocarps, and those affected by infestations of coccidae and mealybugs. Due to the stringent quality requirements imposed on fresh longans intended for export, the grading and sorting processes for these fruits were notably more intricate compared to those aimed for local consumption. Consequently, the qualitative losses experienced by exported longans tended to exceed those encountered by their domestic counterparts. Longans that fall victim to qualitative loss might be sold at sorting/grading stations at reduced prices or diverted toward processing for dried whole longans. Pre-harvest conditions, such as weather patterns and maintenance practices, frequently contributed to the occurrence of this form of qualitative loss.

4.2. Economic Loss

The results of the study were divided into two parts to distinguish between the two different longan supply chains: fresh longan for the domestic supply chain and fresh longan for the export supply chain based on production volume (Table 8).
This study employed the three-year average price of longans from 2019 to 2021, presented in Table 9 and Table 10, to calculate the price and value for economic losses, as indicated in Table 11 and Table 12. The latter table comprises two main sections: the first part calculates the value of the quantitative loss, dividing the fresh longan price before and after SO2 fumigation. The price before SO2 fumigation originates from the average price of fresh longan bunches sold nationwide, while the price after SO2 fumigation is derived from the price of fresh longan for export. The second part computes the value reduced due to qualitative loss, which is the difference between the average price of fresh longan bouquets that farmers sell and the price of individual longan fruits.

4.2.1. Fresh Longan for Domestic Consumption

The domestic consumption of fresh longan in 2022 amounted to 141,037.86 tons. This category incurred an overall economic loss of 793.59 million THB, comprising 19,848.53 tons of quantitative loss (valued at 527.97 million THB) and 15,542.37 tons of qualitative loss (valued at 265.62 million THB).

4.2.2. Fresh Longan for Export

The fresh longan intended for export in 2021 was calculated, amounting to 44% of the total production volume of 1,567,087.36 tons. Within this product utilization share, 15.43% belonged to on-season exported longans (241,850.37 tons), and 28.57% belonged to off-season exported longans (447,668.07 tons). During the on-season, both quantitative and qualitative losses were observed, contributing to the calculated economic losses of 1484.45 million THB. The quantitative loss for the on-season stood at 32,658.18 tons, valued at 871.91 million THB, while the qualitative loss reached 35,842.22 tons, valued at 612.54 million THB. In the off-season, economic losses summed up to 1691.48 million THB, with 44,108.87 tons of quantitative loss and 29,187.96 tons of qualitative loss.

4.3. Factors Driving Food Loss

The risk factors contributing to longan product loss within the supply chain could be classified into three key categories: Pre-Harvest Risk Factors, Harvest Risk Factors, and Post-Harvest Risk Factors, as outlined below.

4.3.1. Pre-Harvest Risk Factors

The pre-harvest phase encompassed the period during which growers undertook care activities for their longan orchards, commencing from the end of the previous year’s harvest until the upcoming year’s pre-harvest stage. The primary stakeholders involved were longan growers, and the focal activities during this period entailed the diligent care of longan trees until harvest. While the pre-harvest phase was not included in the measurement of food loss, it constituted a pivotal stage contributing to damages that subsequently led to post-harvest food loss. We assessed factors influencing food loss during the pre-harvest stage through interviews with farmers and focus groups, followed by expert analysis to interpret the findings. The analysis of the characteristics of these damages, their underlying causes or factors, and the relevant stakeholders was presented in the corresponding Table 13.

4.3.2. Post-Harvest Risk Factors

(1)
Fresh longan for export.
The post-harvest phase of fresh longans intended for export encompasses a sequence of activities, including sorting, packaging, sulfur dioxide (SO2) fumigation, and eventual exportation. Following an in-depth analysis of data obtained through interviews with farmer groups and expert assessments, we have elucidated the characteristics of food loss, identified causal factors, and pinpointed the stakeholders involved in these contributing factors. A comprehensive summary of these findings is presented in Table 14.
(2)
Fresh longan for domestic consumption
The post-harvest phase of fresh longans intended for domestic consumption involves a series of steps, including grading, packaging, sulfur dioxide (SO2) fumigation, transportation to wholesale markets, and sorting/grading by wholesalers. The analysis of food loss characteristics, causative factors, and stakeholders associated with factors contributing to food loss within each activity was outlined in Table 15.

5. Discussion

In this study, the supply chain for fresh longans for domestic consumption was found to have the most common losses at the stages of transport to wholesale and harvest. This was similar to the findings of a previous study by [53]. However, the estimated loss in this study was lower than that reported by [53], which might be due to differences in the number of samples, the quality of the samples in the field, or the use of pre-harvest technology. Losses at the harvest stage of longan production were often caused by the dropping and disease of the fruit during harvest, which was consistent with the study of Pankasemsuk et al. [72]. The main cause of these losses was delayed harvesting, which led to overripe fruit. Delayed harvesting could be caused by factors such as uneven fruit quality, labor shortages, and farmers waiting for higher prices at the end of the season. In addition, infestation by diseases such as black mold and rot could occur due to late harvest and rain during the harvest, as reported in a study by [52,53,54,55]. To reduce losses at the harvest stage, it was important to address these issues and prioritize timely harvesting. The post-harvest procedures are conducted rapidly due to the perishable nature of longan fruit [56,57,58], as well as the browning and toughening of longan peels [56,59,60,61,62,63]. The swift execution of operations can lead to potential errors, and these errors can manifest as losses during subsequent post-sorting activities at the farm, often stemming from issues in the pre-harvest phase. Overall, there has been limited research on measuring food loss in the longan supply chain, with most studies focusing on post-harvest handling, management methods, and approaches to reduce food losses. It was important to continue studying food loss in the longan supply chain to identify areas for improvement and reduce food loss.
According to food loss data along the supply chain, it was found that upstream management was very important to loss in the longan industry. The pre-harvest process was the one that caused damage, which was one of the causes of post-harvest food loss. This was consistent with previous studies where large amounts of edible yield were lost at the farm scale. For example, heavy rains or sudden uptake of water in the final stages of litchi and longan fruit development make the pulp expand faster than the fruit skin, causing the skin to be broken [54,73,74]. Consistent with tomato losses from a 2015 study by Arah et al., the post-harvest quality status of tomatoes partly depended on pre-harvest practices carried out during production [75].

6. Conclusions and Policy Recommendations

This comprehensive study rigorously amassed data about food loss at every phase of the on-season longan value chain, encompassing fresh longan for export and fresh longan for domestic consumption. The findings illuminated the intricate landscape of food loss within the fresh longan supply chain. Specifically, within the fresh longan intended for export, a quantitative food loss of 13.503%, a qualitative food loss of 14.820% for on-season, and a quantitative loss of 9.85% and a qualitative loss of 6.52% for off-season were recorded. Similarly, for fresh longan designated for domestic consumption, a quantifiable food loss of 14.07% and a qualitative food loss of 11.02% were identified. The study underscored that the crucial stages of harvest and grading/sorting emerged as the focal points of the most pronounced food losses. Late harvesting and insufficient pre-harvest care emerged as the primary factors driving these losses. Importantly, while the pre-harvest process itself did not directly contribute to quantifiable food loss, it significantly influenced longan damage, thereby exacerbating post-harvest food losses.
Therefore, the policy recommendations were as follows. The upstream recommendations are as follows: Water shortage during the fruiting period, a lack of knowledge about fertilizer and plant hormones, and neglect of tree care due to limited capital resulting in cracked longan fruit contribute to smaller-sized and cracked longan fruit. To address this, growers should receive training support in proper irrigation practices and the use of agricultural inputs, and encouraging regular tree care and ensuring consistent water supply through irrigation systems can mitigate this issue. Insects like fruit-piercing moths and oriental fruit flies are attracted to ripe longan fruit, causing rot. Pesticides can serve as a valuable tool to mitigate losses caused by pests and diseases during the pre-harvest phase, ultimately enhancing agricultural output and farm income [76]. However, concerning longans, research by Kuang et al. [77] has unveiled the presence of pesticide residues in Chinese samples, with some exceeding acceptable levels. Additionally, a study conducted by Wongta et al. [78] identified pesticide exposure among villagers, including longan growers, resulting in residue accumulation in their bodies. Thus, responsible pesticide use, alongside other agricultural practices, is vital to maximize effectiveness and minimize adverse impacts. Implementing Integrated Pest Management (IPM) strategies, like using traps and organic insecticides, can effectively control these pests and improve orchard hygiene, thereby reducing qualitative loss. Delaying the harvesting process results in over-ripening, elevated instances of fruit breakage, and an increased likelihood of fruit rot. To address this issue, the Department of Agricultural Extension (DOAE) should launch initiatives focused on improving longan harvesting and grading techniques. By enhancing competency in these crucial aspects, the labor can operate more effectively, leading to enhanced productivity and elevated longan quality.
The establishment of a dedicated fund to support quality longan cultivation was proposed. This fund could catalyze knowledge propagation and provide essential resources for production factors, thereby ensuring a consistent supply of high-quality longans. Collaborative networks foster the exchange of knowledge within the production sphere, encompassing aspects. Additionally, commercial registration of longan growers was suggested to curb the influx of substandard longans into the market, consequently stabilizing market prices. For the Office of Agricultural Economics, the introduction of crop insurance was pivotal to instill confidence and incentivize farmers to invest in cultivating quality longans. Establishing a central agency for overseeing purchase–sales contracts was recommended to enhance trust and transparency in trade interactions between farmers and entrepreneurs.
In the midstream, the Ministry of Industry was encouraged to provide low-interest loans during the long season to offer liquidity support to entrepreneurs. Such financial aid could play a pivotal role in ensuring seamless operations during peak periods. Furthermore, promoting the development of machinery and technology to reduce reliance on manual labor was crucial. This not only improved production efficiency but also aligned with modernization trends in the agricultural sector. A fund dedicated to business enhancement and knowledge propagation should be established to support the growth and development of enterprises, fostering a more robust and competitive industry.
For the downstream, to stimulate domestic consumption, the Ministry of Commerce should focus on establishing a central longan market within the country. This market could serve as a hub for product distribution, effectively channeling longans to consumers and enhancing their accessibility. Embracing these comprehensive policy recommendations could fortify the entire longan value chain, contributing to the perpetuation of high-quality production, improved market dynamics, and the overall advancement of the longan industry.

Author Contributions

Initial ideas and conceptualization, R.T., T.P. and C.P.; research design and methodology, R.T., T.P. and C.P.; resources, data curation, and formal analysis; R.T., T.P., C.P., T.R. and K.P.; writing—original draft preparation, R.T., T.P. and K.P.; writing—review and editing, R.T.; visualization, R.T.; supervision, R.T.; project administration, R.T.; funding acquisition, R.T. All authors have read and agreed to the published version of the manuscript.

Funding

This research was funded by the Kasetsart University, grant CT-FL 05-2564, under the research plan titled “Food Loss Assessment of Agri-food Products for Identifying the Food Loss Reduction Measures along the Whole Value Chain and Reporting SDG 12.3.1 (Phase 1.2 Food Loss Assessment)”, funded by the Agricultural Research Development Agency (Public Organization).

Institutional Review Board Statement

This study adhered to the principles outlined in the Declaration of Helsinki and received ethical approval from the Chiang Mai University Research Ethics Committee (protocol code CMUREC No. 64/114) on 28 July 2022.

Informed Consent Statement

Not applicable.

Data Availability Statement

Not applicable.

Acknowledgments

The authors would like to acknowledge and thank the participants who generously shared their insights and experiences for this study. This research was partially supported by Chiang Mai University.

Conflicts of Interest

The authors declare no conflict of interest.

References

  1. FAO. Global Agriculture towards 2050; FAO: Rome, Italy, 2009; Available online: https://www.fao.org/fileadmin/templates/wsfs/docs/Issues_papers/HLEF2050_Global_Agriculture.pdf (accessed on 22 December 2022).
  2. Van Dijk, M.; Morley, T.; Rau, M.L.; Saghai, Y. A meta-analysis of projected global food demand and population at risk of hunger for the period 2010–2050. Nat. Food 2021, 2, 494–501. [Google Scholar] [CrossRef] [PubMed]
  3. FAO. Global Food Losses and Food Waste—Extent, Causes, and Prevention; FAO: Rome, Italy, 2001; Available online: https://www.fao.org/3/i2697e/i2697e.pdf (accessed on 22 December 2022).
  4. FAO. Food Wastage Footprint: Full Cost-Accounting, Final Report; FAO: Rome, Italy, 2014; Available online: https://www.fao.org/3/i3991e/i3991e.pdf (accessed on 22 December 2022).
  5. Coulomb, D. Refrigeration and cold chain serving the global food industry and creating a better future: Two key IIR challenges for improved health and environment. Trends Food Sci. Technol. 2008, 19, 413–417. [Google Scholar] [CrossRef]
  6. Shafiee-Jood, M.; Cai, X. Reducing Food Loss and Waste to Enhance Food Security and Environmental Sustainability. Environ. Sci. Technol. 2016, 50, 8432–8443. [Google Scholar] [CrossRef] [PubMed]
  7. Fabi, C.; English, A. Methodological Proposal for Monitoring SDG Target 12.3. Sub-Indicator 12.3.1.a The Food Loss Index Design, Data Collection Methods and Challenges. SDG 12.3.1: Global Food Loss Index; FAO: Rome, Italy, 2019; Available online: https://www.fao.org/3/ca4012en/ca4012en.pdf (accessed on 22 December 2022).
  8. FAO. Guidelines on the Measurement of Harvest and Post-Harvest Losses in Cereals and Pulses; FAO: Rome, Italy, 2018; Available online: http://www.fao.org/3/ca6396en/ca6396en.pdf (accessed on 22 December 2022).
  9. FAO. The State of Food and Agriculture. Moving forward on Food Loss and Waste Reduction; FAO: Rome, Italy, 2019; Available online: https://www.fao.org/3/ca6030en/ca6030en.pdf (accessed on 22 December 2022).
  10. Nicastro, R.; Carillo, P. Food loss and waste prevention strategies from farm to fork. Sustainability 2021, 13, 5443. [Google Scholar] [CrossRef]
  11. Garrone, P.; Melacini, M.; Perego, A. Opening the black box of food waste reduction. Food Policy 2014, 46, 129–139. [Google Scholar] [CrossRef]
  12. Acedo, A., Jr.; Easdown, W. Postharvest losses of vegetables in South Asia. UNESCAP CAPSA Palawija Newsl. 2015, 32, 1–5. Available online: https://repositori.unud.ac.id/protected/storage/upload/repositori/5b110633493cf573f7c8d83f18f0c09c.pdf (accessed on 28 December 2022).
  13. Office of Agricultural Economics & Rice Department. Loss Reduction in Paddy Rice Harvesting Process: Case Study of the Rice Harvest in the Promoted Area of Large Scale Farm, Research Project Report. 2018. Available online: http://oaezone.oae.go.th/assets/portals/15/news/185/1_aek.pdf (accessed on 5 January 2023).
  14. International Agricultural Economics Division. Project To Study Approaches to Reduce Food Waste in the Agricultural Production Sector of Thailand: A Case Study of Fresh Vegetables. 2015. Available online: https://oaezone.oae.go.th/assets/portals/3/fileups/biae/files/Journal/Paper_FWFL.pdf (accessed on 5 January 2023).
  15. Attavanich, W.; Bejranonda, S.; Sirisupluxana, P.; Bunyasiri, I.N.; Udomwitid, S.; Obidiegwu, A.; Phasuk, S. The Study of Food Loss in Thailand’s Agricultural Sector, Full Report on Research and Development of Agricultural Research; The Agricultural Research Development Agency (Public Organization): Bangkok, Thailand, 2020. [Google Scholar]
  16. National Food Board. Strategic Framework for Food Management in Thailand, 2nd ed.; Thai Health Promotion Foundation: Nonthaburi, Thailand, 2019; ISBN 978-974-244-332-0. [Google Scholar]
  17. Agricultural Research Development Agency (Public Organization). Food Loss Study to Boost Up Food Security; Agricultural Research Development Agency (Public Organization): Bangkok, Thailand, 2020; ISBN 978-616-8289-020. [Google Scholar]
  18. Department of Agricultural Extension. Agricultural Production Information System. Available online: https://www.https://production.doae.go.th/service/site/login (accessed on 7 January 2023).
  19. Trademap. Trade Statistics for International Business Development. Available online: https://www.trademap.org/Index.aspx (accessed on 7 January 2023).
  20. Molla, M.M.; Islam, M.N.; Nasrin, T.A.A.; Bhuyan, M.A.J. Survey on postharvest practices and losses of litchi in selected areas of Banglades. Bangladesh J. Agric. Res. 2010, 35, 439–451. [Google Scholar] [CrossRef]
  21. Hassan, M.K.; Chowdhury, B.L.D.; Akhter, N. Post Harvest Loss Assessment: A Study to Formulate Policy for Loss Reduction of Fruits and Vegetables and Socioeconomic Uplift of the Stakeholders, Final Report PR #8/08. National Food Policy Capacity Strengthening Programme. 2010. Available online: http://fpmu.gov.bd/agridrupal/sites/default/files/Kamrul_Hassan-PR8-08.pdf (accessed on 9 January 2023).
  22. Kumar, V.; Purbey, S.K.; Anal, A.K.D. Losses in litchi at various stages of supply chain and changes in fruit quality parameters. Crop Prot. 2016, 79, 97–104. [Google Scholar] [CrossRef]
  23. Mohammed, M.; Mpagalile, J.; Lopez, V. Mango value chain in Trinida Guyana and St. Lucia: Measure post-harvest losses. J. Postharvest. Technol. 2018, 6, 001–013. [Google Scholar]
  24. Baltazari, A.; Mtui, H.; Chove, L.; Msogoya, T.; Kudra, A.; Tryphone, G.; Samwel, J.; Paliyath, G.; Sullivan, A.; Subramanian, J.; et al. Evaluation of post-harvest losses and shelf life of fresh mango (Mangifera indica L.) in Eastern zone of Tanzania. Int. J. Fruit Sci. 2020, 20, 855–870. [Google Scholar] [CrossRef]
  25. Tarekegn, K.; Kelem, F. Assessment of mango Post-Harvest losses along value chain in the Gamo zone, southern Ethiopia. Int. J. Fruit Sci. 2022, 22, 170–182. [Google Scholar] [CrossRef]
  26. Wasala, W.M.C.B.; Dissanayake, C.A.K.; Dharmasena, D.A.N.; Gunawardane, C.R.; Dissanayake, T.M.R. Postharvest losses, current issues and demand for postharvest technologies for loss management in the main banana supply chains in Sri Lanka. J. Postharvest Technol. 2014, 2, 80–87. [Google Scholar]
  27. Roels, K.; Vangeyte, J.; Linden, V.V.; Gijseghem, D.V. Food losses in primary production: The case of Flanders. In Proceedings CIGR-AgEng 2012: International Conference on Agricultural Engineering, Valencia, Spain, 8–12 July 2012; p. C1203. [Google Scholar]
  28. Terry, L.A.; Mena, C.; Williams, A.; Jenney, N.; Whitehead, P. Fruit and Vegetable Resource Maps: Mapping Fruit and Vegetable Waste through the Wholesale Supply Chain, Final Report, RSC008; WRAP: London, UK, 2011; Available online: https://pdxscholar.library.pdx.edu/cgi/viewcontent.cgi?article=1109&context=busadmin_fac (accessed on 13 January 2023).
  29. Beretta, C.; Stoessel, F.; Baier, U.; Hellweg, S. Quantifying food losses and the potential for reduction in Switzerland. Waste Manag. 2013, 33, 764–773. [Google Scholar] [CrossRef] [PubMed]
  30. Lipinski, B.; Hanson, C.; Lomax, J.; Kitinoja, L.; Waite, R.; Searchinger, T. Reducing Food Loss and Crop Loss; Working Paper, Installment 2 of Creating a Sustainable Food Future; World Resources Institute: Washington, DC, USA, 2013; Available online: https://www.wri.org/research/reducing-food-loss-and-waste (accessed on 13 January 2023).
  31. Mena, C.; Terry, L.A.; Williams, A.; Ellram, L. Causes of waste across multi-tier supply networks: Cases in the UK food sector. Int. J. Prod. Econ. 2014, 152, 144–158. [Google Scholar] [CrossRef]
  32. WRAP. Food Waste in Primary Production—A Preliminary Study on Strawberries and Lettuce, Final Report; Defra SCF0307/WRAP OIN006-001; WRAP: London, UK, 2017; Available online: https://wrap.org.uk/resources/report/preliminary-study-strawberries-and-lettuces (accessed on 13 January 2023).
  33. Ludwig-Ohm, S.; Dirksmeyer, W.; Klockgether, K. Approaches to reduce food losses in German fruit and vegetable production. Sustainability 2019, 11, 6576. [Google Scholar] [CrossRef]
  34. Capone, R.; Bilali, H.; Debs, P.; Bottalico, F.; Cardone, G.; Berjan, S.; Elmenofi, G.A.; Abouabdillah, A.; Charbel, L.; Arous, S.A.; et al. Bread and Bakery Products Waste in Selected Mediterranean Arab Countries. Am. J. Food Nutr. 2016, 4, 40–50. [Google Scholar]
  35. Goryńska-Goldmann, E.; Gazdecki, M.; Rejman, K.; Kobus-Cisowska, J.; Łaba, S.; Łaba, R. How to Prevent Bread Losses in the Baking and Confectionery Industry?—Measurement, Causes, Management and Prevention. Agriculture 2021, 11, 19. [Google Scholar] [CrossRef]
  36. Symmank, C.; Raak, N.; Zahn, S.; Aschemann-Witzel, J.; Rohm, H.; Rohm, H. Food Losses in the German Food Industry: Insights from Expert Interviews. In Proceedings of the Material form 4th International ISEKI Food Conference, Vienna, Austria, 7 July 2016; pp. 6–8. [Google Scholar]
  37. Johnson, L.K.; Dunning, R.D.; Gunter, C.C.; Bloom, J.D.; Boyette, M.D.; Creamer, N.G. Field measurement in vegetable crops indicates need for reevaluation of on-farm food loss estimates in North America. Agric. Syst. 2018, 167, 136–142. [Google Scholar] [CrossRef]
  38. Baker, G.A.; Gray, L.C.; Harwood, M.J.; Osland, T.J.; Tooley, J.B.C. On-farm food loss in northern and central California: Results of field survey measurements. Resour. Conserv. Recycl. 2019, 149, 541–549. [Google Scholar] [CrossRef]
  39. Kok, M.G.; Snel, H. Food Loss Measurements in the Rice Supply Chain of Olam Nigeria: Analysis of the Pilot Study Results, Report; WCDI-19-084/WFBR-2000; Wageningen University & Research: Wageningen, The Netherlands, 2019. [Google Scholar]
  40. FAO. Guidelines on the Measurement of Harvest and Post-Harvest Losses—Findings from the Field Test on Estimating Harvest and Post-Harvest Losses of Fruits and Vegetables in Mexico; Field Test Report; FAO: Rome, Italy, 2020; Available online: https://www.fao.org/documents/card/es/c/CB1511EN (accessed on 25 December 2022)Field Test Report.
  41. Abbass, A.; Ndunguru, G.; Mamiro, P.; Alenkhe, B.; Mlingi, N.; Bekunda, M. Postharvest food losses in a maize-based farming system of semi-arid savannah area of Tanzania. J. Stored Prod. Res. 2013, 57, 49–57. [Google Scholar] [CrossRef]
  42. Strid, I.; Eriksson, M. Losses in the supply chain of Swedish lettuce–wasted amounts and their carbon footprint at primary production, whole sale and retail. In Proceedings of the 9th International Conference on Life Cycle Assessment in the Agri-Food Sector, San Francisco, CA, USA, 8–10 October 2014; pp. 1274–1279. [Google Scholar]
  43. Fabi, C. SDG 12.3.1.a Food Loss Index: An Introduction. 2020. Available online: https://www.fao.org/3/cb2949en/cb2949en.pdf (accessed on 20 January 2023).
  44. Fabi, C.; Cachia, F.; Conforti, P.; English, A.; Moncayo, J.R. Improving data on food losses and waste: From theory to practice. Food Policy 2021, 98, 101934. [Google Scholar] [CrossRef]
  45. Department of Agriculture. Development of a Rice Quality Inspection System to Create the Image of Thai Hom Mali rice. Ministry of Agriculture and Cooperatives. 2004. Available online: http://www.ricethailand.go.th/rkb3/Eb_012.pdf (accessed on 20 January 2023).
  46. Office of Agricultural Economics. Longan: Perennial Area, Fruiting Area, Yield, and Productivity per Fruiting Area, National, Regional and Provincial Levels. 2022. Available online: https://www.oae.go.th/assets/portals/1/files/longan%2065.pdf (accessed on 20 January 2023).
  47. Office of Agricultural Economics. A Study of the Role of Fruit Entrepreneurs on Thai Fruits. Case Study: Longan, Agricultural Economics Research No. 111. 2020. Available online: https://hectortarr.arda.or.th/api/uploaded_file/iCPe8DQ5zClq32OVvkzxs (accessed on 20 February 2023).
  48. Sopadang, A.; Tippayawong, K.Y.; Chaowarut, W. Application of value chain management to longan industry. Am. J. Agric. Biol. Sci. 2012, 7, 301–311. [Google Scholar] [CrossRef]
  49. Panmanee, C.; Tansuchat, R.; Arkornsakul, P. Green Efficiency Analysis of Longan Supply Chains: A Two-Stage DEA Approach. Chiang Mai Univ. J. Econ. 2018, 22, 1–10. [Google Scholar]
  50. Tansuchat, R.; Piboonrungroj, P.; Nimsai, S. Exploring Opportunities and Threats in Logistics and Supply Chain Management of Thai Fruits to India. Int. Supply Chain. Manag. 2016, 5, 150–157. [Google Scholar]
  51. Tansuchat, R.; Pankasemsuk, T.; Panmanee, C. Impacts of COVID-19 Pandemic on Thai Fruit: A Case Study of Longan Supply Chain. In Revitalising ASEAN Economies in a Post-COVID-19 World: Socioeconomic Issues in the New Normal; World Scientific Publishing, Co Pte Ltd.: Singapore, 2022; pp. 169–199. [Google Scholar] [CrossRef]
  52. Jiang, Y. The use of microbial metabolites against post-harvest diseases of longan fruit. Int. J. Food Sci. Technol. 1997, 32, 535–538. [Google Scholar] [CrossRef]
  53. Noimanee, P.; Boonpasom, P.P.; Theanjumpol, P.; Boonyakia, D. Loss Assessment in Postharvest Handling of Longan Fruit cv. Daw. Agric. Sci. J. 2012, 43, 304–307. [Google Scholar]
  54. Jiang, Y.; Zhang, Z.; Joyce, D.C.; Ketsa, S. Postharvest biology and handling of longan fruit (Dimocarpus longan Lour.). Postharvest Biol. Technol. 2020, 26, 241–252. [Google Scholar] [CrossRef]
  55. Gould, W.P.; Hennessey, M.K.; Peña, J.; Castineiras, A.; Nguyen, R.; Crane, J. Nonhost status of lychees and longans to Caribbean fruit fly (Diptera: Tephritidae). J. Econ. Entomol. 1999, 92, 1212–1216. [Google Scholar] [CrossRef]
  56. Jiang, Y.; Li, Y. Effects of chitosan coating on postharvest life and quality of longan fruit. Food Chem. 2001, 73, 139–143. [Google Scholar] [CrossRef]
  57. Sardsud, U.; Sardsud, V.; Sittigul, C.; Chaiwangsri, T. Effects of plant extracts on the in vitro and in vivo development of fruit pathogens. In Proceedings of the ACIAR Australian Centre for International Agricultural Research, Bangkok, Thailand, 16–18 July 1992; pp. 60–67. [Google Scholar]
  58. Prasad, K.; Neha, P.; Lal, M.K. Cultivation and post-harvest handling techniques of potential future crop ‘longan’ (Dimocarpus longan Lour) in Asia pacific region-A review. Res. Crop. 2017, 18, 384–392. [Google Scholar] [CrossRef]
  59. Qu, H.X.; Sun, G.C.; Jiang, Y.M. Study on the relationship between the peel structure and keeping quality of longan fruit. J. Wuhan Bot. Res. 2001, 19, 83–85. [Google Scholar]
  60. Tian, S.; Xu, Y.; Jiang, A.; Gong, Q. Physiological and quality responses of longan fruit to high O2 or high CO2 atmospheres in storage. Postharvest Biol. Technol. 2002, 24, 335–340. [Google Scholar] [CrossRef]
  61. Tongdee, S. Postharvest handling and technology of tropical fruit. Front. Trop. Fruit Res. 1991, 321, 713–717. [Google Scholar] [CrossRef]
  62. Lin, H.T.; Xi, Y.F.; Chen, S.J. The relationship between the desiccation-induced browning and the metabolism of active oxygen and phenolics in pericarp of postharvest longan fruit. Zhi Wu Sheng Li Yu Fen Zi Sheng Wu Xue Xue Bao J. Plant Physiol. Mol. Biol. 2005, 31, 287–297. [Google Scholar]
  63. Lin, H.T.; Chen, L.; Lin, Y.F.; Jiang, Y.M. Fruit weight loss and pericarp water loss of harvested longan fruit in relation to pericarp browning. In Proceedings of the III International Symposium on Longan, Lychee, and other Fruit Trees in Sapindaceae Family, Fujian, China, 25–28 August 2008; Volume 863, pp. 587–592. [Google Scholar]
  64. Jaroenkit, T.; Ussahatanonta, S.; Phimphimol, J. Postharvest methods to reduce sulfur dioxide residues in fresh longan. In Europe-Asia Symposium on Quality Management in Postharvest Systems-Eurasia 2007; Kanlayanarat, S., Hewett, E.W., Ferguson, I.B., Eds.; ISHS Acta Horticulturae: Bangkok, Thailand, 2007; Volume 804, pp. 183–190. ISBN 2406-6168. [Google Scholar]
  65. Axmann, H.; Soethoudt, H.; Kok, M.; Anh, P.N.; Broeze, J. Roadmap Post Harvest Loss Reduction in Selected Vietnamese Value Chains: Phase 1: Hotspots and Feasible Interventions in Dragon Fruit and Longan, 2161; Wageningen Food & Biobased Research: Wageningen, The Netherlands, 2021; Available online: https://library.wur.nl/WebQuery/wurpubs/fulltext/548408 (accessed on 2 March 2023).
  66. Thompson, S.K. Sampling, 3rd ed.; John Wiley & Sons, Inc.: Hoboken, NJ, USA, 2012; ISBN 987-0-470-40231-3. [Google Scholar]
  67. Parfitt, J.; Barthel, M.; Macnaughton, S. Food waste within food supply chains: Quantification and potential for change to 2050. Philos. Trans. R. Soc. B Biol. Sci. 2010, 365, 3065–3081. [Google Scholar] [CrossRef]
  68. National Bureau of Agricultural Commodity and Food Standards. Longans. In Thai Agricultural Standard TAS 1-2003; Ministry of Agriculture and Cooperatives; Royal Gazette: Bangkok, Thailand, 2003; Volume 120, ISBN 974-403-141-7. [Google Scholar]
  69. National Bureau of Agricultural Commodity and Food Standards. Good agricultural practices for longans. In Thai Agricultural Standard TAS 1000-2003; Ministry of Agriculture and Cooperatives; Royal Gazette: Bangkok, Thailand, 2003; Volume 120. [Google Scholar]
  70. Office of the Permanent Secretary for Ministry of Agriculture and Cooperatives. China’s Food Safety Law (2015). 2015. Available online: https://leap.unep.org/countries/cn/national-legislation/food-safety-law-2015 (accessed on 2 March 2023).
  71. Department of Livestock Development. Law of the People’s Republic of China on the Entry and exit Animal and Plant Quarantine (Order No. 53 of 1991). 2021. Available online: https://faolex.fao.org/docs/pdf/chn5760.pdf (accessed on 2 March 2023).
  72. Pankasemsuk, T.; Noimanee, P.; Theanjumpol, P.; Munphumsai, W. Loss Assessment of longan fruit throughout the supply chain. J. Agric. Sci. 2014, 45, 281–284. [Google Scholar]
  73. Huang, H.B. Advances in fruit physiology of the arillate fruits of litchi and longan. Annu. Rev. Hortic. Sci. 1995, 1, 107–120. [Google Scholar]
  74. Li, H.Y.; Li, C.F. The early high quality and high production techniques for longan trees. South China Fruits 1999, 28, 30–31. [Google Scholar]
  75. Arah, I.K.; Amaglo, H.; Kumah, E.K.; Ofori, H. Preharvest and postharvest factors affecting the quality and shelf life of harvested tomatoes: A mini review. Int. J. Agron. 2015, 2015, 478041. [Google Scholar] [CrossRef]
  76. Popp, J.; Pető, K.; Nagy, J. Pesticide productivity and food security. A review. Agron. Sustain. Dev. 2013, 33, 243–255. [Google Scholar] [CrossRef]
  77. Kuang, L.; Wang, Z.; Cheng, Y.; Li, Y.; Li, H.; Zhang, J.; Xu, G. Residue levels and risk assessment of pesticides in litchi and longan of China. J. Food Compos. Anal. 2023, 115, 104921. [Google Scholar] [CrossRef]
  78. Wongta, A.; Sawarng, N.; Tongchai, P.; Sutan, K.; Kerdnoi, T.; Prapamontol, T.; Hongsibsong, S. The pesticide exposure of people living in agricultural community, Northern Thailand. J. Toxicol. 2018, 2018, 4168034. [Google Scholar] [CrossRef] [PubMed]
Figure 1. FLW at different stages of the food system. Note: Adapted from FAO 2018 [8].
Agriculture 13 01951 g001
Figure 2. The FLI at the country level is to be compiled in three steps. Note: Modified from [7].
Agriculture 13 01951 g002
Figure 3. Flow chart of the longan value chain and collection at each stage to assess longan loss. Source: Modified from [47].
Agriculture 13 01951 g003
Figure 4. Determining points for actual measurement on the farm, aligning with the FAO’s 2018 food loss measurement guidelines.
Agriculture 13 01951 g004
Table 1. Estimated food loss percentage in the food supply chain for each commodity group in different regions.
RegionCerealsRoots and TubersOilseeds and PulsesFruits and VegetablesMeatFish and SeafoodMilk
Europe6.5–16%1%7%17%9.7%15.5%2.2%
North America and Oceania4.5–14%32%6%18%10%15.5%2.2%
Industrialized Asia12.5–22%31%9%18%11.6%19%2.7%
Sub-Saharan Africa13.5%38%18%51%12.7%30%21.1%
North Africa, West and
Central Asia
14–19%26%16%45%10.2%24%16%
South and Southeast Asia12.5%40%22%44%12.3%30%18%
Latin America10–15%29%13%42%11.1%24%16%
Source: Modified from FAO, 2011 [3]. Note: Food loss percentage covers only activities in post-harvest handling and storage, processing and packaging, and distribution.
Table 2. Summary of the literature review on different food loss study methodologies, commodities, and references.
MethodologyCommodities and References
Expert opinions, knowledge from professionals, literature reviews, and analysis of secondary data
-
Livestock, fisheries, arable agriculture, and horticulture [27];
-
Fruits and vegetables [28,29,30,31];
-
Strawberries and lettuce [32].
Questionnaire/survey/interview
-
Strawberries, apples, lettuce, and carrots [33];
-
Fruits and vegetables [28,31].;
-
Cereals, Baking and Confectionery Industry [34,35];
-
Meat industry [36].
Field measurements, on-farm investigation, detailed surveys, and assessments at different stages of the value chain
-
Strawberries and lettuces [32];
-
Fruits and vegetables [37,38];
-
Rice [39].
Application of the FAO guidelines
-
Banana and broccoli [40];
-
Cereals and pulses [8]
Note: Sources for the literature reviews and references in this table include relevant academic articles, research papers, and authoritative publications.
Table 3. Summary of studies on longan losses.
StageLoss CharacteristicsCauses
HarvestFruit rot
-
Bacterial and fungal infections [52]
-
Overripe longan fruit [53]
Skin rupture
-
Heavy rain or sudden uptake of water during the last stage of fruit development [54]
-
Thin-skinned cultivars [55]
Black mold
-
The continuous rain during the harvest [53]
StorageProduce spoiled during storage
-
Longan fruit shelf-life is limited [56,57,58]
Hardening
Pericarp browning
-
Enzymatic browning [56,59,60]
-
water loss of the pericarp [61,62,63]
Sulfur dioxide (SO2) fumigationLongan fruit spoiled during sulfur dioxide (SO2) fumigationInsects [53]
Bruised and broken fruit Tossing during longan basket arrangement before sulfur dioxide fumigation [53]
Sulfur dioxide residues in fresh longan Sulfur dioxide residues in fresh longan [64]
TransportationLongan fruit is broken, rotten, and bruised during transportation.
-
Accumulation of moisture inside the package [53]
-
Compression due to overloading, improper placement, and collision [53,65]
WholesalingFruit rotRot disease is favored by high ambient temperature [65].
Note: Sources for the literature reviews and references in this table include relevant academic articles, research papers, and authoritative publications.
Table 4. Quantitative loss percentage of on-season fresh longan for domestic consumption.
ActivityStatisticsRemaining Amount (kg)
MeanMinMaxSD
1. Harvesting3.923.384.401.2596.08
2. Sorting/grading at orchard2.541.083.910.4893.64
3. Sorting/grading at cooperative0.260.200.330.1293.40
4. SO2 fumigation0.160.130.200.0293.25
5. Transport to wholesale7.856.779.002.2785.93
% food loss 14.07
Amount remaining for consumers (kg) 85.93
Source: Calculation, 2023.
Table 5. Qualitative loss percentage of on-season fresh longan for domestic consumption.
ActivityStatisticsRemaining Amount (kg)
MeanMinMaxSD
1. HarvestingNo qualitative loss was found.100.00
2. Sorting/grading at orchard11.027.9214.543.5988.98
3. Sorting/grading at cooperativeNo qualitative loss was found.88.98
4. SO2 fumigationNo qualitative loss was found.88.98
5. Transport to wholesaleNo qualitative loss was found.88.98
% food loss 11.02
Amount remaining for consumers (kg) 88.98
Source: Calculation, 2023.
Table 6. Quantitative loss percentage of fresh longan for export.
ActivityStatisticsRemaining Amount (kg)
MeanMinMaxSD
On-season
1. Harvesting7.296.478.073.2492.71
2. Sorting/grading at orchard5.582.638.322.7987.54
3. Sorting/grading at factory1.030.801.420.7586.64
4. SO2 fumigation.0.160.100.340.3786.50
% food loss 13.50
Amount remaining for consumers (kg) 86.50
Off-season
1. Harvesting4.473.336.384.4795.53
2. Sorting/grading at orchard3.552.045.133.5592.14
3. Sorting/grading at factory1.671.213.041.6790.60
4. SO2 fumigation.0.500.500.500.5090.15
% food loss 9.85
Amount remaining for consumers (kg) 90.15
Source: Calculation, 2023.
Table 7. Qualitative loss percentage of fresh longan for export.
ActivityStatisticsRemaining Amount (kg)
MeanMinMaxSD
On-season
1. HarvestingNo qualitative loss was found100.00
2. Sorting/grading at orchard14.8210.3519.7610.2685.18
3. Sorting/grading at factoryNo qualitative loss was found85.18
4. SO2 fumigation.No qualitative loss was found85.18
% food loss 14.82
Amount remaining for consumers (kg) 85.18
Off-season
1. HarvestingNo qualitative loss was found100.00
2. Sorting/grading at orchard6.525.278.212.4093.48
3. Sorting/grading at factoryNo qualitative loss was found93.48
4. SO2 fumigation.No qualitative loss was found93.48
% food loss 6.52
Amount remaining for consumers (kg) 93.48
Source: Calculation, 2023.
Table 8. Production volume and proportion of fresh longan in 2021.
ItemTotalFresh Longan for Domestic ConsumptionFresh Longan for Export (44%)
On-SeasonOff-Season
Ratio100%9.00%15.43%28.57%
Production volume in 20211,567,087.36141,037.86241,850.37447,668.07
Source: Calculation, 2023. Notes: 1. The proportion in the longan supply chain from the diagram of the longan supply chain in Figure 3. 2. The proportion of fresh longan exports on-season and off-season compared using the ratio of export volume of fresh longans in season June–October and off-season Jan.–May and Nov.–Dec. 2021.
Table 9. Prices of longan in 2019–2021.
YearAverage Price (THB/kg)
Fresh Longan Bouquets (Average of AA and A Grades) Fresh Longan for ExportWhole Longan *
(Average of Grades AA, A, B, C)
201930.7535.6712.22
202024.8536.248.73
202124.2136.547.58
Average26.636.159.51
Sources: Centre for Agricultural Information, Office of Agricultural Economics 2022. (*) from The Office of Agricultural Extension and Development, Department of Agricultural Extension 2022.
Table 10. Price and value, 2019–2021 average, used to calculate economic losses.
ItemPrice
(THB/kg)
Value Reduced from Qualitative Loss (THB/kg.)
Before SO2 FumigationAfter SO2 FumigationBefore SO2 Fumigation *After SO2 Fumigation
Fresh longan for export.26.636.1517.090
Fresh longan for domestic consumption.26.626.617.090
Source: Calculation 2023. Notes: 1. * Calculated from the difference between the price of fresh longan bunches in the country and the price of individual longan fruits. 2. The domestic price of fresh longan from the government database was the average price of the whole country and could not be separated into the price before and after SO2. 3. After SO2 fumigation, no qualitative loss was observed.
Table 11. Economic losses of fresh longan for domestic consumption.
ItemActivityTotal
Before SO2 FumigationAfter SO2 Fumigation
QuantitativeResidual quantity from 100%93.40%85.93%85.93%
Residual quantity from 141,037.86 tons131,723.87121,189.33121,189.33
Amount lost (tons)9313.9910,534.5419,848.53
Loss value (million THB)247.75280.22527.97
QualitativeResidual volume from 100%88.98%88.98%88.98%
Residual quantity from 141,037.86 tons125,495.49125,495.49125,495.49
Amount lost (tons)15,542.37-15,542.37
Loss value (million THB)265.62-265.62
Total loss value (million THB)513.37280.22793.59
Table 12. Economic losses of fresh longan for export.
ItemActivityTotal
Before SO2 FumigationAfter SO2 Fumigation
On-season
QuantitativeResidual quantity from 100%86.64%86.50%86.50%
Residual quantity from 241,850.37 tons209,527.44209,192.19209,192.19
Amount lost (tons)32,322.93335.2432,658.18
Loss value (million THB)859.7912.12871.91
QualitativeResidual quantity from 100%85.18%85.18%85.18%
Residual quantity from 241,850.37 tons206,008.14206,008.14206,008.14
Amount lost (tons)35,842.22-35,842.22
Loss value (million THB)612.54-612.54
Total loss value (million THB)1472.3312.121484.45
Off-season
QuantitativeResidual quantity from 100%90.60%90.15%90.15%
Residual quantity from 447,668.07 tons405,587.13403,559.20403,559.20
Amount lost (tons)42,080.942027.9444,108.87
Loss value (million THB)1119.3573.311192.66
QualitativeResidual quantity from 100%93.48%93.48%93.48%
Residual quantity from 447,668.07 tons418,480.11418,480.11418,480.11
Amount lost (tons)29,187.96-29,187.96
Loss value (million THB)498.82-498.82
Total loss value (million THB)1618.1773.311691.48
Source: Calculation 2023.
Table 13. Factors driving food loss during the pre-harvest period.
Damage CharacteristicsFactors Contributing to the Damage (Leading to Post-Harvest Losses)Stakeholders in Factors
1. Longan fruit is smaller than the standard. (Giving rise to qualitative loss)Water shortage: During the fruiting period, the longan tree needs a lot of water to make the longan fruit grow larger, but the longan fruiting period is only from roughly February to July. Therefore, some parts of the fruit growing period, March to April, which is the hot season in Thailand, result in water shortages in many areas. Thus, insufficient water in some longan farms will result in small sizes of longan fruit.Longan growers.
Lack of knowledge: Not knowing the use of fertilizers and plant hormones can lead to stunted and low-quality longan fruit, resulting in losses at later stages.Longan growers.
2. Cracked longan fruit. (Giving rise to quantitative loss)Water shortage: The problem of broken longan fruit is a continuing problem due to the lack of water during fruiting (small fruit), causing the exocarp of the longan fruit to be thin. Therefore, when it comes to the harvest period, which is during the rainy season, the longan fruit that receives a large amount of water will expand rapidly, causing the fruit to crack before harvest.Longan growers.
Neglecting to properly care for longan trees: Neglecting to properly care for longan trees due to lack of working capital, resulting in the longan’s exocarp being thin and easily cracked.Longan growers.
3. Rotten longan fruit. (Giving rise to quantitative loss)Fruit piercing moths and oriental fruit fly: When the longan fruit becomes large and has a sweet taste, various insects come to eat the nectar from the longan fruit, causing the problem of rotten longan fruit.Longan growers.
4. Black mold. (Giving rise to qualitative loss)Nectar from sucking insect: Sucking insects such as mealybug and coccidae that suck the nutrients and excretes the syrup on the leaf and bough. The fungi in the air will be blown up on the nectar excreted by the insects and grow into a black stain. The peel will be dirty, so it receives a low price. Entomopathogenic fungi spread by wind and rainwater, especially when the harvest season is coming. Longan growers.
5. Longan peel is dark brown. (Giving rise to qualitative loss)Sunburns: Sunburn causes longan fruit skin to turn dark brown; thus, longan fruit must be sold at a low price.Longan growers.
Table 14. Factors driving food loss during the post-harvest process (fresh longan for export).
ActivityFactors Contributing to Food LossStakeholders in Factors
1. Sorting/grading at the farm or packing longan into a white basket.Late harvesting: Late harvesting of longan fruit can lead to over-ripening, increasing the number of broken and rotten fruits.The person who determines the time of harvest (longan growers or fresh longan factory).
Pre-harvest process: Neglecting to properly care for longan trees before harvest can result in more cracked and rotten longan fruit, smaller fruit size, and weak fruit poles that easily fall off. Laborers must sort out damaged and small fruit during the packing process.Longan growers.
2. Sorting/grading in the factory.Sorting/grading on the farm: Mistakes and experiences of workers in sorting on the farm that end up with inadequate sorting of rotten and cracked longan fruit result in losses found in the grading/sorting process of the factory.Workers sorting the fruit on the farm.
3. SO2 fumigation.Wet/moist longan peel: Moisture in longan exocarp can cause spoilage during the SO2 fumigation process, which is carried out to extend the fruit’s shelf life. This can happen if the longan fruit is too moist and the SO2 cannot penetrate the exocarp. Weather conditions such as rain during harvesting or transportation can also affect the moisture content of longan.Workers performing SO2 fumigation.
Sorting/grading in the factory: Not removing all rotten longan fruit during sorting can cause the process of SO2 fumigation to fail, resulting in some longans having a stained and dark appearance that is not fit for sale (this is rare).Workers sorting the fruit in the factory.
Table 15. Factors driving food loss during the post-harvest process (fresh longan for domestic consumption).
ActivityFactors Contributing to Food LossStakeholders in Factors
1. Sorting/grading on the farm for packing into various containers such as baskets, boxes, or bundles.The food loss characteristics, factors bringing about food loss, and stakeholders in factors driving food loss in each activity are similar to those involving fresh longan for export, only with differences in standards such as color, size, and amount of substance SO2.
2. Sorting/grading in the cooperative.
3. SO2 fumigation.
4. Sorting/grading by wholesaler.Transport to wholesale market: Overloading of longan fruit during transportation can cause the bottom of the fruit to be pressed, resulting in cracking and rotting. Temperature and duration during transportation can also affect the spoilage of Longan.Transporter.
Disclaimer/Publisher’s Note: The statements, opinions and data contained in all publications are solely those of the individual author(s) and contributor(s) and not of MDPI and/or the editor(s). MDPI and/or the editor(s) disclaim responsibility for any injury to people or property resulting from any ideas, methods, instructions or products referred to in the content.

