Article

Risk Amplification, Risk Preference and Acceptance of Transgenic Technology

1
College of Economics and Management, Shanghai Maritime University, Pudong District, Shanghai 201306, China
2
Antai College of Economics and Management, Shanghai Jiao Tong University, Xuhui District, Shanghai 200030, China
3
Department of Management, CUHK Business School, The Chinese University of Hong Kong, Shatin, Hong Kong
4
Lee Shau Kee School of Business and Administration, Hong Kong Metropolitan University, Kowloon, Hong Kong
*
Author to whom correspondence should be addressed.
Agriculture 2023, 13(10), 1871; https://doi.org/10.3390/agriculture13101871
Submission received: 15 August 2023 / Revised: 16 September 2023 / Accepted: 20 September 2023 / Published: 25 September 2023
(This article belongs to the Section Agricultural Economics, Policies and Rural Management)

Abstract

:
Consumer preferences and attitudes toward genetically modified (GM) food have been widely studied, yet there is little research on the aspects of farmers and risk amplification. Based on both a field survey and an experiment conducted in villages in China’s eastern provinces of Shandong, Shanxi and Henan in 2021, we explore the impact of producers’ risk amplification and risk preferences on the acceptance of transgenic technology. Results show that only 37.3% of participants from the whole sample did not amplify the risk associated with GM products. In terms of regions, the percentages of participants in Henan, Shanxi and Shandong who amplified the risk associated with GM products were 65.3%, 62.4% and 60%, respectively. Moreover, the results of the economic experiment on risk preference indicate that over two-thirds of farmers proved to be risk-averse. Finally, full sample estimation results using ordered logit and Poisson models showed that risk amplification, relative risk aversion and risk perception all have negative impacts on producers’ response to GM plant seeds, including participants’ acceptance intention, purchasing intention and recommendation intention.

1. Introduction

Innovation greatly promotes social progress [1], but it carries inherent risks and uncertainties [2]. According to the society amplification framework of risk (SARF), the risk of an event can be magnified by the government, experts, media, the internet and others [3,4]. Largely groundless worry can weaken the effectiveness of policies, which in turn slows down the adoption of helpful new products or technologies, as well as the speed of economic growth [5]. The application of transgenic technology has attracted much attention from the Chinese government [6]. Transgenic technology can not only create new varieties with greater resistance, better quality and higher yields, but it can also reduce the use of chemical pesticides and fertilizers and minimize water requirements. Farmers as well as consumers can benefit from genetically modified (GM) crops [3]. According to ISAAA, in 2016, GM crops helped 17 million smallholder farmers and their families, totaling more than 65 million people, thereby helping to alleviate poverty. Second, GM crops have reduced the amount of pesticides used by 670 million kilograms. Third, fewer insecticide sprays reduced CO2 emissions by 27.1 billion kilograms, equivalent to taking 16.7 million cars off the road in a year. China’s involvement in GM technology can be traced back to the 1990s, when experiments with insect-resistant cotton in Henan and Shandong provinces achieved great success, but China is still quite far from the world’s advanced level in the commercialization of large-scale GM production. If policy and public opinion take an overly cautious turn, and the public’s risk aversion becomes stronger, unnecessary risks may be amplified, which is not conducive to the promotion of innovation and new ventures [5].
Risk involves the limited predictability of the effects of an activity with respect to something of value. Risk amplification theory says that certain aspects of a risk portrayed in mediated sources can interact with psychological processes in ways that might decrease or amplify people’s perceptions of the risk and, in turn, shape their behaviors. Based on previous research, three aspects of risk are key to understanding producers’ technology adoption behavior: risk amplification effects, individual risk preferences and risk perception. The risk amplification effect was first proposed by Kasperson et al. [4]. A risk signal may strengthen or weaken the public’s cognitive ability through the joint action of a variety of factors. Risks are amplified at different levels and links. Taking gender imbalance as an example, Slovic stated that in group events, risk is amplified in information fermentation, psychological identity and an absence of government to offer a public response [7]. Referring to the anchoring effect, Tversky and Kahneman argued that in uncertain situations, people often estimate the target value through the initial perceived value or amount, and the public’s risk perception is more difficult to subsequently correct [8]. The risk from food safety could be amplified easily, since it is closely related to people’s health and day-to-day activities.
In addition, SARF is often used as a classic auxiliary tool for learning risk concepts. Using SARF, Kim and colleagues discussed the influence of risk perception of pesticide residues on purchasing intention [9], Lee and colleagues examined the impact of consumers’ risk perception on their willingness to pay for GM food [10], and Li and Zhang examined Chinese consumers’ willingness to buy GM papaya and further investigated how different dimensions of media-reported risk impacted consumers’ acceptance of GM agricultural products [11].
Individual and household characteristics of producers are also important factors that impact risk perception. When describing individual characteristics, the most frequently used variables are age, farming experience (in years), gender, capital status and education levels. Awotide et al. found that in reality, men are more inclined to adopt technology than are women [12]. Tanaka et al. investigated how wealth, political history, occupation and other demographic variables are related to risk perception, time discounting and trust in Vietnam [13]. The study showed that people in richer villages are less averse to loss and more patient compared to those in poorer ones. Farmers with more household members in the labor force are more willing to adopt new technologies [14]. Korir and colleagues found that the higher the level of education, the higher the likelihood of adoption of new technologies [15]. Financial status affects the adoption of new technologies to a certain extent [16]. Huang et al. studied how cotton farmers’ knowledge, risk preference and education level as well as market regulation and pesticide price influence pesticide application [17]. More recent research added more variables to individual characteristics.
Finally, producers’ risk preference plays an important role in their decision to adopt new technology. Previous research has found that producers are generally risk-averse, and the higher the degree of risk aversion, the more likely it is that the producer will not adopt or will delay the adoption of new technologies. Liu discusses how Chinese farmers’ risk attitudes impact their adoption of a new form of agricultural biotechnology and concluded that risk-averse farmers adopt GM cotton later than farmers who are less risk-averse [6]. When asked why insect-resistant cotton was not adopted immediately, 97% of farmers indicated it was mainly because of its uncertainty in reducing insect pests [18]. Risk aversion is an important factor hindering the extension of agricultural technology [19,20]. Luo et al. found that risk seeking has a significant positive impact on the adoption of new technologies [21].
Researchers have also reached similar conclusions when studying consumers’ new product adoption decisions. Lusk and Coble, Zhou et al. and Zhang et al. found that the higher the degree of risk aversion, the less likely for consumers to adopt new technologies [22,23,24]. The former two studies found that most individuals are risk-averse, and only a small number of individuals are risk-seeking; the third study concluded that risk-seeking consumers are more likely to choose uncertain promotional activities. Gambling experiments that ask individuals to make lottery choices are often used to capture an individual’s risk preference. The most classic methods are Binswanger’s orderly lottery selection design (OLS design) [25] and Holt and Laury’s multiple price sequence design (MPL design) [26]; MPL design is regarded as the “gold standard” for risk preference measurement experiments. OLS designs eight different lotteries and then sorts them. The subjects choose one of them, and the income is determined by the selected lottery. In MPL, subjects see a series of paired options and choose one for each row. Harrison et al. expanded MPL and developed turning multiple price sequence design (sMPL) and iterative multiple price sequence design (iMPL) [27]. The difference between the sMPL experimental design and the MPL one is that in sMPL, subjects only need to choose the switching point from lottery A to lottery B.
Consumer preference for GM food has been widely studied, yet there are few studies from the viewpoint of farmers on the background of risk amplification. Based on a field survey and an economic experiment conducted at random in villages in China’s eastern provinces of Shandong, Shanxi and Henan in 2021, this paper explores the impact of producers’ risk amplification and risk preferences on the acceptance of transgenic technology.

2. Materials and Methods

2.1. Field Surveys

Field surveys were carried out with producers in rural areas of China to understand producers’ cognition, perception and expectations towards GM crops. We obtained 338 valid questionnaires, including 149 in Shanxi, 95 in Henan and 94 in Shandong. From west to east are Shanxi, Henan and Shandong. Information on these three provinces is shown in Table 1.
Due to the mountainous terrain around Yangquan City in Shanxi, large-scale agricultural production is very limited. During the experiment, we found that 90% of the cultivated land was terraced, the crops were mainly cash crops, and the proportion of the primary industry was relatively low. Anyang City, Henan Province was selected in the eastern plain. The proportion of primary industry in GDP was 11.8%, which was the highest among the three regions, but the per capita GDP was the lowest. Rizhao City, Shandong Province has a port. Thanks to its export-oriented economy, Rizhao City’s per capita GDP was the highest among the three selected cities, and the proportion of primary industry in GDP was the second. Regional differences between inland and coastal cities may also affect producers’ risk preference. Henan Province and Shandong Province are the “hardest hit areas of the college entrance examination”, they invest more resources in education, and there are a large number of colleges and universities in these areas. Transgenic insect-resistant cotton was also first introduced into Henan Province and Shandong Province.
The entire questionnaire was divided into two parts. The first part included basic information of each participant and their family. In the second part, we designed several questions from the perspectives of producers’ knowledge, risk perception, acceptance of GM plant seeds and so on. The second part of the questionnaire was deliberately designed to check the validity of participants’ answers. Some questions were asked multiple times in different ways, and some options were reverse-coded.

2.2. Economic Experiment Design

We used the method of an economic experiment/lottery game to obtain the relative risk aversion coefficient. Cash was used in economic experiments as a reward. The experimental difficulty mainly lies in the complexity of the rules of the game and the way of determining the income from the game. Considering that participants may have difficulty understanding the rules of the sMPL experiment, two experimental assistants accompanied the participants throughout the entire process, so that participants could provide timely answers when encountering difficulties. The sMPL experiment consisted of three series with 35 rows of choices. Each row contains lottery A and lottery B, shown in Table 2. Participants needed to select a switching point for each series. After the selection was complete, one of the three selected lotteries was randomly drawn to determine the participant’s monetary return. The participants were paid off according to the lottery that was randomly drawn. Because participants do not know which type of lottery they will draw, this method allows participants to pay enough attention to each choice, and it enables us to obtain relatively reliable risk preference data.
Take row 1 of series 1 for example. It shows that lottery A offers 8 CNY with a probability of 30% and 2 CNY with a probability of 70%, whereas lottery B offers 10 CNY with a probability of 10% and 0.5 CNY with a probability of 90%. Every farmer in our experiment had to choose his/her preference between lottery A and lottery B in each row of the three series.
Series 1Lottery ALottery B
Row 18 CNY—①②③
2 CNY—④⑤⑥⑦⑧⑨⑩
10 CNY—①
0.5 CNY—②③④⑤⑥⑦⑧⑨⑩
We used a WeChat small program of random number drawing to complete the randomization process. For example, if one participant prefers lottery A in row 1 of series 1 and the number 2 is drawn by the small program, he/she would receive 8 CNY. However, if this participant prefers lottery B in row 1 of series 1 and number 2 is drawn at random, he/she would receive 0.5 CNY.
In series 1 of Table 2, it is obvious that lottery A does not change, and the participant always receives 8 CNY with a probability of 30% and 2 CNY with a probability of 70%. In lottery B of series 1, when moving down the rows, a return with small probability increases, which means the expected value of lottery B increases, and starting from row 9, the value eventually exceeds that of lottery A. Based on the assumption of economic rationality, it is easy to conclude that in each series, participants only switch from A to B once, or they do not switch at all. Participants are required to answer questions in the following form: “I choose lottery A from line 1 to line n”; “I choose lottery B from lines n to 14”.
In series 2, lottery A always offers 8 CNY with a probability of 90% and 6 CNY with a probability of 10%”. In lottery B, when moving down the rows, a return with a high probability increases. The return in option B of series 2 is lower than that of series 1. The more risk-averse participants are inclined to switch to lottery B later than the less risk-averse participants in both series 1 and series 2. In prospect theory, people’s risk preference in the domain of gain differs from that in the domain of loss. Therefore, series 3 is used to measure whether producers maintained the same risk preference when facing both gain and loss. The three lottery series used in the experiment are shown in Table 2.

2.3. Empirical Analysis

We use MATLAB 2016 software to get the coefficients of factors of the dependent variable. The dependent variable is the degree of acceptance of GM plant seeds. Building upon Lusk (2005) [22], we designed 5 Likert scale questions: “I am willing to accept GM plant seeds”; “I am willing to purchase GM plant seeds”; “I will recommend GM plant seeds to others”; “I agree with China’s large-scale import of GM plant seeds”; “I support the development of GM crops”. In the scale questions, assigning values of 1–5 represents “strongly disagree”, “relatively disagree”, “neutral agree”, “agree”, “agree” and “strongly agree”. The integer value obtained by rounding the average value is the value of the dependent variable.
The explanatory variables include three core explanatory variables and control variables.
The first explanatory variable is the degree of risk amplification of GM crops (ra). A health hazard ranking question was used to measure whether participants overestimate the harm of GM crops. Participants had to rank the five hazards based on their perception from high to low.
a.
Smoking hazards in the workplace;
b.
Food additives that exceed the regulatory limit;
c.
GM agricultural products;
d.
Bacteria-infected food and expired food;
e.
The impact of bird flu on humans.
It has been shown that genetically modified organisms pose the least harm of the risks listed above. GMO food can be considered to be the most thoroughly tested in the world, and hence the harmfulness of GMO varieties are largely groundless [28]. Risk amplification will be 4 if GM food was ranked first; by analogy, risk amplification will be 0 if Gm food was ranked last. Therefore, the risk amplification has the value of 0, 1, 2, 3 or 4. The degree of risk amplification is positively correlated with the value. The frequency distribution is shown in Figure 1.
Figure 1 shows that only 37.3% of participants did not amplify the GM risk (ra = 0), and 9.8% of participants strongly exaggerated the risk of GM products (ra = 4). In terms of regions, the percentage of participants who amplified the GM risk was 65.3%, 62.4% and 60%, respectively, in Henan, Shanxi and Shandong.
The second explanatory variable is the relative risk preference coefficient. We assume the producer has the utility function shown in Equations (1)–(3):
U ( x , p ; y , q ) = π p v x   +   π q v y ;   x   <   y   <   0 v y   +   π p v x     v y ;   x   >   y   >   0   O r   x   <   y   <   0
v ( x ) = λ ( - x ) 1 σ ;   x   <   0 x 1 σ ;   x   >   0
π ( p ) = exp L n ( p ) α
where U ( x , p ; y , q ) is farmer’s utility function, v ( x ) denotes value function, x is a high income when “unexpected luck” occurs, y is a low income without “unexpected luck”, p and q denote the probability of obtaining a high income and a low income, respectively. π p ,   π ( q ) represent weights of two probabilities in the utility function. 1 σ measures the curvature of the value function. α denotes the attraction of “unexpected luck” to farmers. λ means the negative utility brought by the loss divided by the positive utility brought by the same amount of gain.
The relative risk aversion coefficient will be calculated based on the formula of Lusk (2005): U ( x ) = x 1 r r / ( 1 r r ) , U ( x ) indicates the utility of a benefit. The range of the relative risk preference coefficient is calculated using MATLAB 2016 software. The greater the coefficient, the more risk averseness indicated. Taking the first line of series 2 as an example, if a participant chooses option A, it must be because the utility of option A exceeds that of option B, i.e., U ( A ) > U ( B ) , and the following inequality can be obtained (0.9, 0.1, 0.7 and 0.3 are the probability of obtaining different benefits.):
0.9 8 1 r r 1 r r + 0.1 6 1 r r 1 r r > 0.7 9 1 r r 1 r r + 0.3 0.5 1 r r 1 r r
Following the same logic, the relative risk coefficient estimation results are obtained and shown in Table 3. rr1 represents the relative risk aversion coefficient of series 1, and rr2 represents the relative risk coefficient of series 2. The TL (transform line) is the line indicating that the subject made a change when choosing the lottery ticket. TL = 1 means that the subject chose option B on each row; TL = 2 means that the subjects all chose option B starting from the second row. Similarly, TL = “NEVER” indicates that the subject chose option A in each row and never chose option B. Frequency is the number of people on its corresponding transform line. For example, in series 1, the number of people who chose option B starting from line 1 is 29.
Table 3 demonstrates that the relative risk coefficient increases with a higher transform line, and a larger rr indicates that subjects are more risk-averse. Over 230 farmers are risk-averse in both series 1 and series 2, which accounts for over two-thirds of all subjects.
The third explanatory variable measures health and environment risk perception of GM technology (rp). Seven statements were presented to participants, including: genetic modification in food production may bring risks to me and my family; the national control over the safety of GM agricultural products is sufficient; genetic modification in food production may bring new diseases to humans; the promotion of GM agricultural products will cause gene pollution or environmental pollution; I am worried that transgenic technology will destroy natural selection; eating GM agricultural products will cause allergic reaction; regular consumption of GM agricultural products will have an uncertain impact on human offspring. We assigned a value of 1 to “strongly disagree” and a value of 5 to “strongly agree”. The average of these variables serves as risk perception. The frequency distribution of rp is shown in Figure 2.
A lower score indicates a higher perceived risk by participants. Overall, the perceived risk by participants follows a normal distribution. Among the 338 observations, one observation in Shandong Province had the highest perceived risk. The number of observations at the medium level (rp = 3) was the largest, accounting for 49.4% of the total sample.
The demographic variables include the participant’s age, gender, marital status, household size, whether there were children under 7 years old in the household, whether there were elderly people over 60 years old in the household, education level, monthly household income and so on.
We also included a series of control variables. The variable char measures whether a participant was in charge of purchasing food in the household. The variable freq captures how often a participant read the production date, shelf life or ingredient and nutrition information on a food package when buying food. The options were: “every time”, “often”, “sometimes”, “not often” and “not at all.” freq was measured on a 1–5 Likert scale, and the higher the score, the lower the frequency. The third variable trust measures participants’ trust in the Chinese food industry. Two 5-point Likert scale questions were included. The first question was: “Are you confident with the safety provided by the national food quality and safety certification?” The options were “completely confident”, “confident”, “neutral”, “unconfident” and “completely unconfident.” The second question was: “What do you think of the current food safety problems in China?” The options were “very problematic”, “problematic”, “neutral”, “not problematic” and “not problematic at all.” The variable trust took the mean of the answers to these questions after the first question was reversely coded. A higher score indicates a greater degree of trust in the Chinese food industry. The variable cog measures participants’ knowledge or cognition of GM agricultural products.
Five questions related to participants’ knowledge about GM crops were asked. The first question was: “Do you agree with the following statements? The GM products allowed to grow in China are disease-resistant papaya and insect-resistant cotton; and additionally China is allowed to import five kinds of GM products, including cotton, corn, soybean, rape, and sugar beet.” A participant received one point if he/she selected “agree.” The second question was: “Before this survey, have you heard of GM agricultural products?” A participant received one point if she/he selected “yes.” The third question was: “Have you ever heard of homologous transgene?” If a participant selected “yes”, he/she received one point. The fourth question was: “It is said on the Internet that virgin fruit, large colored pepper and small pumpkin are GM agricultural products. Do you agree?” If a participant selected “disagree”, he/she received one point. The last question was: “What is the most widely cultivated GM crop in the world?” If a participant selected “soybean”, he/she received one point. These points were summed up to obtain a score (cog) measuring participants’ knowledge about GM agricultural products. A higher score implies a better understanding of GM crops.
The variable cr measures commercial risk towards GM agricultural products. Two 5-point Likert scale questions were asked: “Are you worried about the safety and sale of GM agricultural products?” and “Are you worried about the future of GM agricultural products?” Participants were asked to indicate their levels of agreement with these statements on 5-point Likert scales. The variable cr takes the average of the answers to these questions.
The variable knowl measures participants’ genetic knowledge. Participants chose right or wrong for the following four statements: “The gender of a child is determined by the father’s genes”; “Tomatoes do not contain genes, and transgenic tomatoes contain genes”; “It is impossible to transfer animal genes to plants”; “Hybrid rice uses transgenic technology”. A higher score indicates better genetic knowledge. The variable label measures participants’ attitudes toward the labeling of GM agricultural products. The question was “Do you think GM agricultural products need to be labeled mandatorily?” Participants had to answer “yes” or “no” to this question.
The details of these variables are shown in Table 4.

3. Results

3.1. Descriptive Statistics

A summary of descriptive statistics of explanatory variables is shown in Table 5.

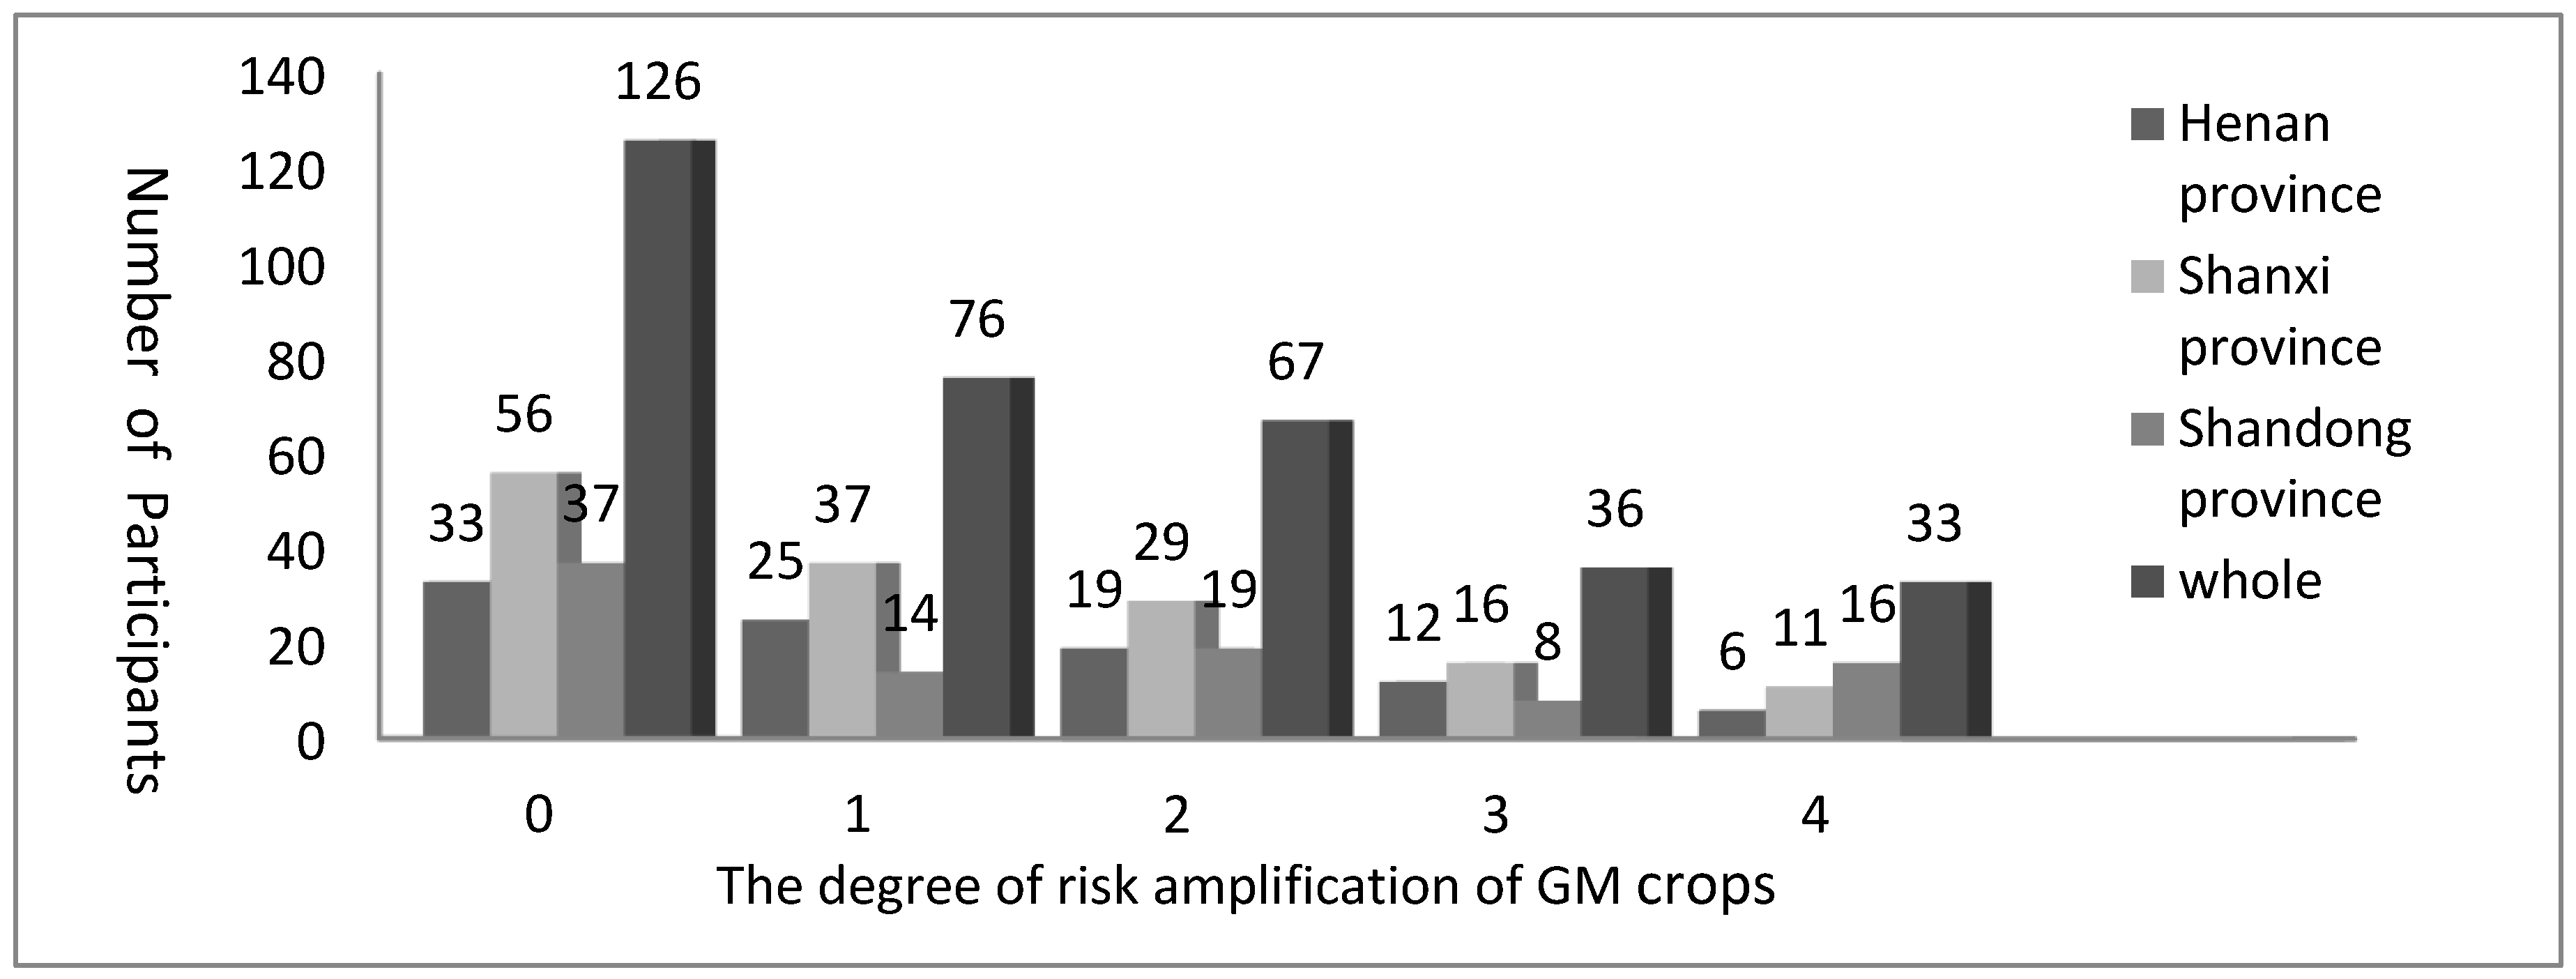
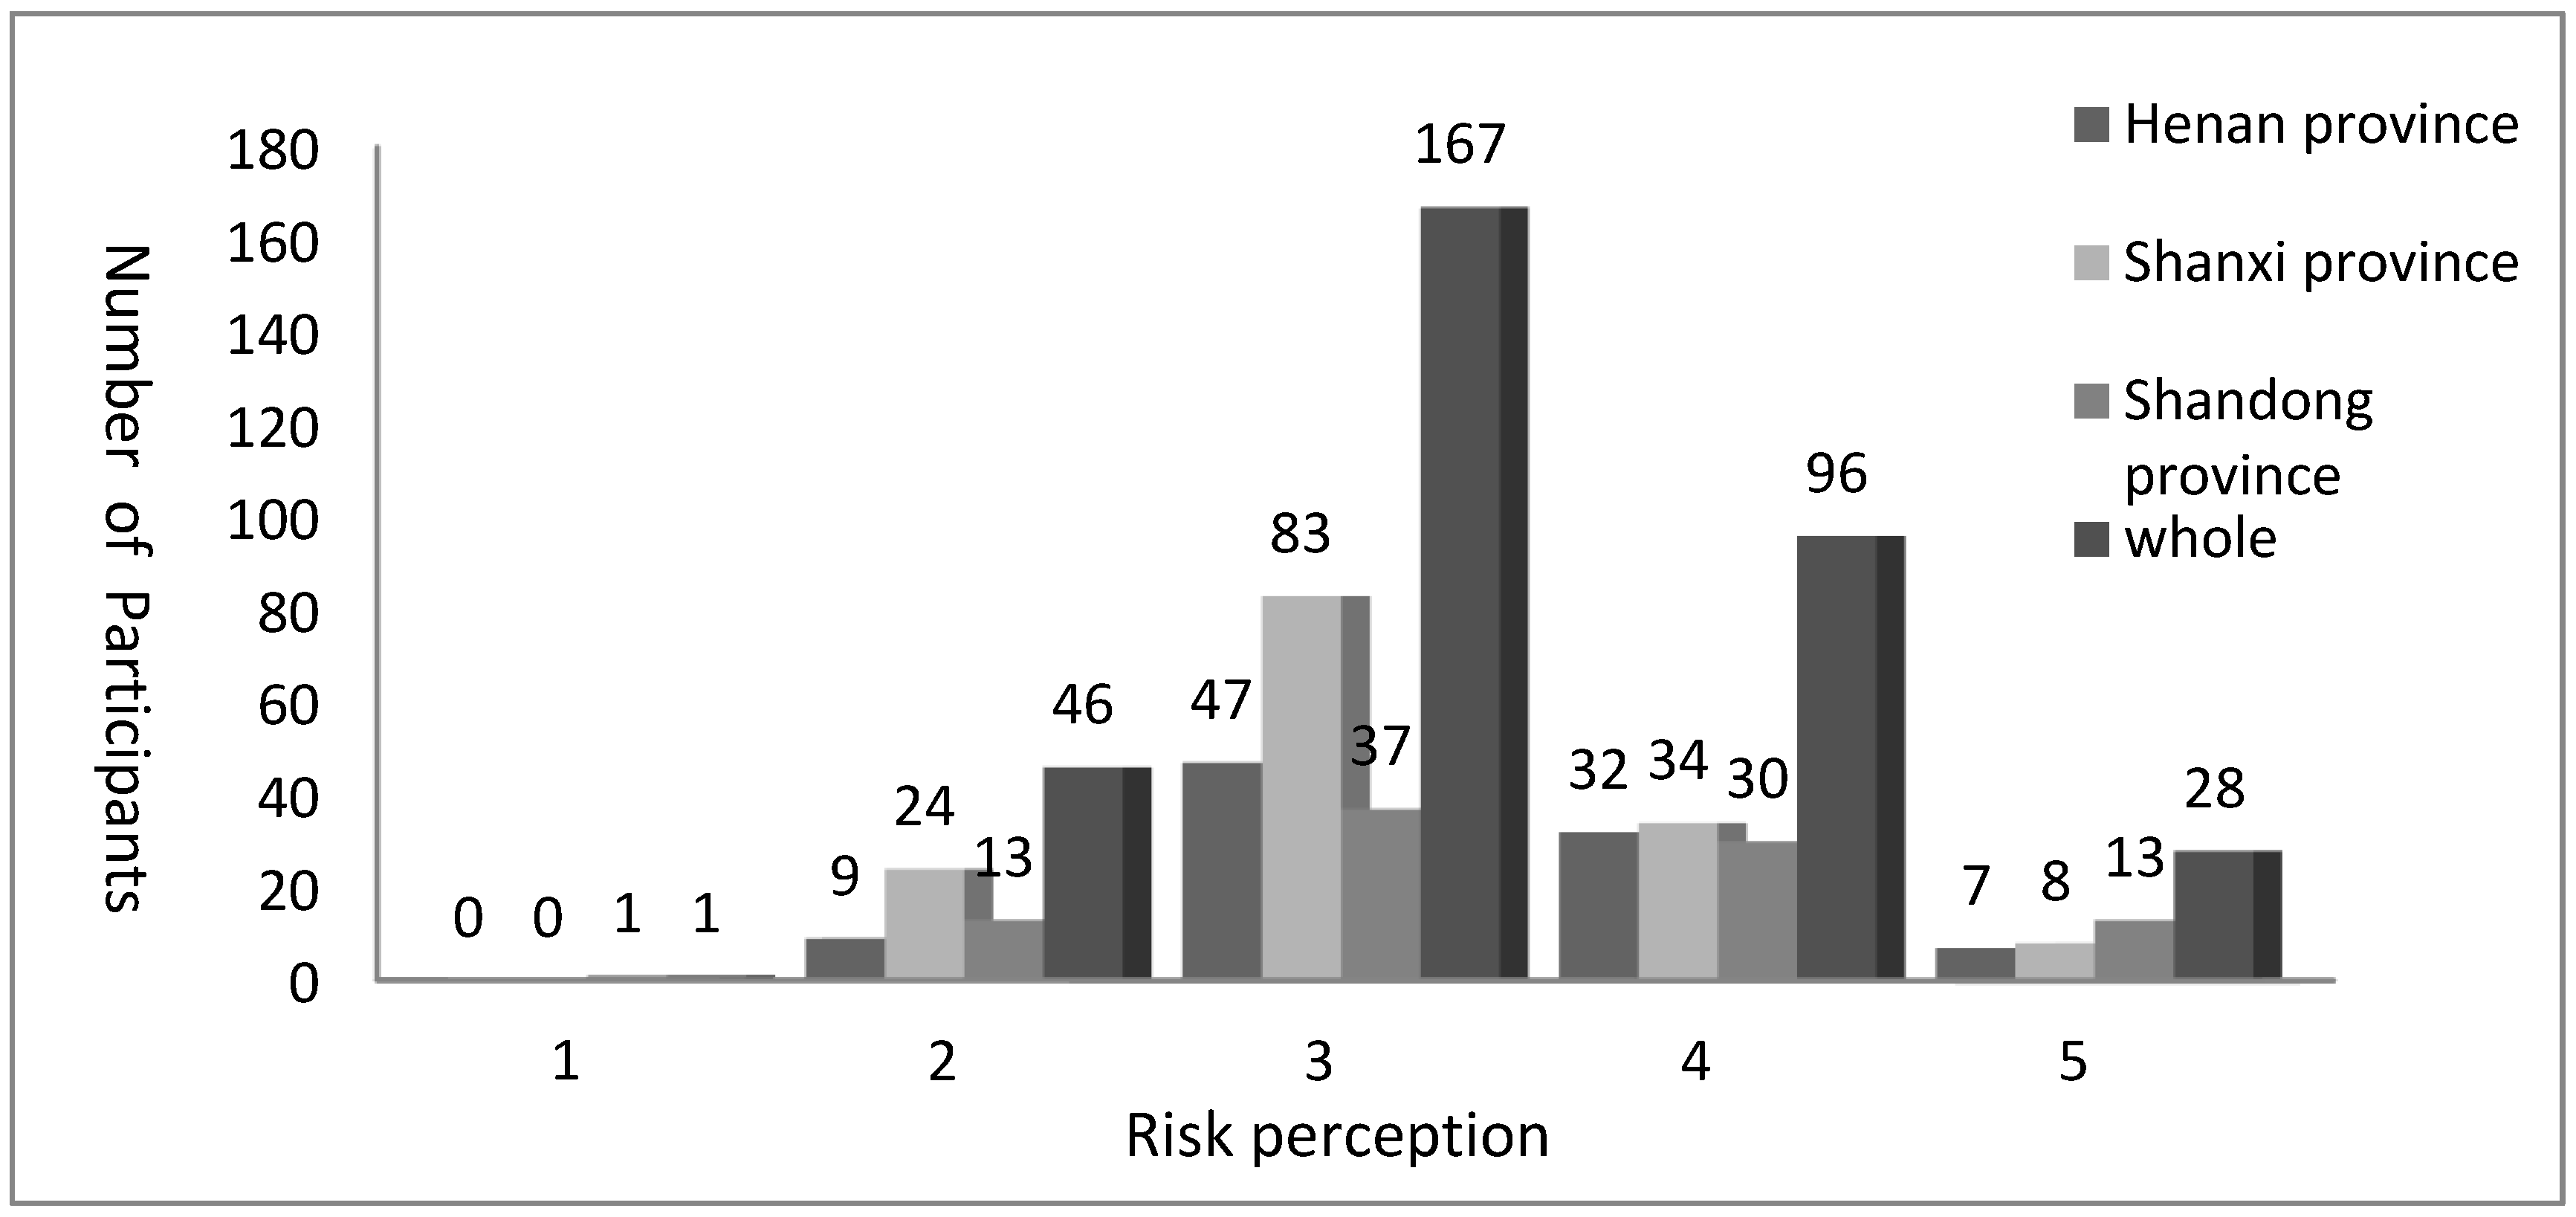
3.1.1. Summary Statistics of Core Risk-Related Explanatory Variables

The summary statistics of core risk-related explanatory variables are shown in Table 6. For the whole sample, the average risk amplification (ra), risk perception (rp) and relative risk coefficients (rr1 and rr2) were 1.33, 3.31, −0.09 and 0.30, respectively. All these risk measures had the highest value for participants from Shandong Province and the lowest value for those from Shanxi Province, indicating that participants from Shandong Province tended to amplify the risk of GM crops the most as well as to amplify the perceived transgenic risk the most, and they were the most risk-averse among the three provinces. A higher score indicates a higher level of acceptance. Overall, ten percent of participants were willing to adopt GM agricultural products at relatively higher degrees (4–5). But there were differences in different regions: Shanxi had the highest level, followed by Shandong and then Henan; overall, less than 10% of participants were (strongly) willing to recommend GM agricultural products to others. In terms of regions, Shanxi participants had the highest willingness to recommend these products (13.42%), followed by Shandong (11.73%), then by Henan (only 1.05%). About 35% participants (strongly) disagreed that China should import a large number of GM agricultural products, and the highest percentage of participants in Shanxi Province (strongly) disagreed with the import of GM agricultural products. About 20% of participants (strongly) supported the development of GM agricultural products, which was the highest among the four acceptance measurements. It can be seen that although participants had some reservations about GM crops, they showed some level of support for the development of GM agricultural products. The acceptance of GM crops was the highest in Shanxi and the lowest in Henan, with coastal Shandong in the middle. However, the degree of agricultural development in Shanxi is not as high as that of the other two provinces. The results showed the different levels of acceptance of GM crops between large agricultural and non-agricultural provinces in China. Participants who strongly disagreed with the purchasing of GM plant seeds accounted for the largest proportion (30.5%), and the proportion in the other three provinces was 37.9%, 26.2% and 29.8%, respectively. Relatively high levels of agreement (4–5) accounted for 16%, Henan Province had the lowest percentage of agreement (4.2%), Shanxi Province had the highest percentage (27.6%), and Shandong Province accounted for 9.6%.

3.1.2. Participants’ Sociodemographic Background

The summary statistics of individual and household characteristics are shown in Table 7. Men and women often have different risk preferences and consumption habits, which may lead to different choices. Therefore, we tried to balance the number of male and female participants. Overall, the gender distribution was relatively balanced, with slightly more men than women.
In the survey, we asked participants to choose their age categories. Since the average marriage age in rural China is about 25 years old, we took 25 years old as the first dividing point, and then 10 years as the interval for the age categories. Although there were differences among the three regions, most participants’ ages were between 25 and 55 years old. Among them, there were full-time agricultural producers and part-time ones. For example, there is a large number of migrant workers in Henan, but they return home to work on their farms during busy farming seasons.
The percentage of married participants was 80%, and it was as high as 90.43% in Shandong. The household size was about four to five people, which is in line with the basic situation in rural areas. Households with fewer than three people accounted for 41.72% of the sample. This was because most of the participants were in an early stage of marriage and had no children or elderly people living with them. More than 70% of participants had no children under the age of 7, and more than half of the sample had elderly people over the age of 60 in their households. About 67% of participants had education below the undergraduate level, and the education levels of older participants were mostly primary school and junior middle school. With the implementation of relevant national policies and economic development, the education level of farmers has also improved, so participants with senior high school and undergraduate education accounted for more than 50% of the sample. Sixty percent of participants had a low income, but there was a trend that the higher the level of education, the higher the income. For participants with master’s degrees, the monthly income could be more than CNY 20,000, which is not different from urban households’ income.

3.1.3. Producer Risk Preference When Facing Loss

In the gambling experiment, series 3 was used to test participants’ risk preference when there was a 50% probability of loss. The number of participants switching at various rows are shown in Figure 3. Switching row 1 means option B was selected at the first row, switching row 2 means option B was selected at the second row, and so on.
The later the switching row, the more sensitive a participant was to loss. The frequency distribution has a “U” shape. A total of 19.8% of participants made the choice of “large negative return but large positive return” at row 1. This group of participants did not have obvious loss aversion. At row 2–6, the negative return and the return of option B were higher than that of option A, but the gap between the returns brought by the two options narrows down, and about 40.9% participants switched at row 2–6. At the last row, the negative returns of the two options were similar, but the positive return of option B was 30 times that of option A, and 16.8% participants switched at the last row. The remaining 22.6% of participants always chose option A and never switched. When considering those who switched at row 4 and 5 as “risk neutral”, 55.8% of participants were risk-averse.

3.2. Full Sample Estimation Results

The full sample estimation results on factors of GM plant seeds’ acceptance by producers are showed in Table 8. Model 1 and model 2 are both ordered logit models, and model 3 and model 4 are both Poisson models. Compared to model 1 and model 3, model 2 and model 4 add interaction items.

3.2.1. Ordered Logit Estimation Results

The regression results of model 1 and model 2 indicate that the coefficients of relative risk aversion and risk perception both have significant negative impacts on the acceptance of transgenic technology. Farmers with higher risk aversion and perceived risks are inclined to refuse transgenic technology. The more attention paid to food information on packages (production date, shelf life and nutrition information) when shopping, the less likely for the producers to accept transgenic technology, since the coefficients of freq are both significant in models 1 and 2. Moreover, the significantly negative coefficients of char show that participants who are mainly charge of purchasing plant seeds had lower acceptance of transgenic technology. Finally, the higher the level of trust in the Chinese food industry, the less likely the amplification of GM risk would impact producers’ willingness to adopt transgenic technology.
There is a negative relationship between the degree of risk amplification (ra) and the acceptance of transgenic technology. The psychological amplification of the risk involved in GM crops would significantly reduce the possibility of accepting transgenic technology. After adding an interaction term between risk amplification and trust in the food industry in model 2 (ra*trust), the coefficient is doubled and becomes very significant. This shows that when the trust in the food industry is high, this is very likely to alleviate the inhibitory effect of risk amplification on the acceptance of transgenic technology.
Table 8 shows that the variable cog has no significant impact on the dependent variable. This means that producers’ understanding of transgenic technology has less impact than subjective factors on the acceptance of transgenic technology. Label has a significant negative impact on the acceptance of transgenic technology. This means that producers who believe that mandatory labeling is necessary and GM and non-GM products need to be separated have lower acceptance of transgenic technology.
Among the demographic variables, only age and education significantly affected the acceptance of transgenic technology. Older participants are less likely to accept transgenic technology than younger ones. On the one hand, the education level of the older generation in China’s rural areas is relatively low; on the other hand, older participants’ experiences of the hard times before the Chinese economic reform and open-up make them very cautious about adopting new technologies with uncertainty. Therefore, the possibility of them accepting GM crops is low. As expected, participants with a higher education level are more likely to accept GM crops.

3.2.2. Poisson Regression Results

In this study, we ran Poisson regression to validate the results of the ordered logit model.
Model 3 and model 4 show that the coefficients of three core risk-related explanatory variables (ra, rp and rr) are significantly negative at the levels of 1%, 10% and 1%, respectively. In addition, age, education, being the person in charge of household food purchases, the frequency of looking at information on food packages, expectation towards GM agricultural products, genetic knowledge, views on whether GM agricultural products should be labeled and the interaction terms are significant and have the same signs as the results from the ordered logit model.
The calculation of the value of incident rate ratios (IRR) can help us more intuitively understand the impact of each explanatory variable on the dependent variable. Suppose a participant’s original probability of accepting GM crops is p0. The IRR results show that the probability of accepting GM crops will be reduced to 0.951p0, 0.913p0 and 0.948p0 for each level increase in risk amplification (ra), risk perception (rp) and relative risk coefficient (rr), respectively. The probability of acceptance decreases to 0.996p0 when the age increases by one year. When the household size increases by one, the acceptance probability increases to 1.015p0. When the education level and income increase by one level, the probability of GM acceptance will rise to 1.064p0 and 1.007p0, respectively. When the frequency of reading the food package information decreases by one level, the acceptance degree increases to 1.025p0. When trust in the food industry increases by one level, the GM acceptance probability increases to 1.015p0. The transgenic technology acceptance probability increases to 0.992p0, 0.827p0 and 0.951p0 when the GM cognition, GM expectation and genetic knowledge scores increase by one level, respectively.

3.3. Estimation Results for the Three Provinces

To understand how the factors impact the detailed producers’ response to GM agricultural products in different regions, we further ran the models for three individual questions that measure participants’ acceptance intention (willingness to accept GM plant seeds), purchase intention (willingness to purchase GM plant seeds) and recommendation intention (willingness to recommend GM plant seeds to friends). Table 9 reports the estimation results for the whole sample and the three provinces.
For willingness to accept GM plant seeds, the coefficients of the degree of risk amplification (ra) are significant and negative for the whole sample as well as the samples from the three provinces. For Shandong Province, health and environment risk perception (rp) has a significant positive impact on the willingness to accept GM products. The relative risk coefficient (rr) and education level have more significant effects on the willingness to accept GM agricultural products in Shanxi Province than in the other two provinces. For participants from Henan Province and Shandong Province, the older the age, the higher their willingness to accept GM plant seeds, but the coefficient of age for Henan Province is more significant. For participants from Henan province, marital status significantly impacts their willingness to accept GM plant seeds: married participants are more likely to accept GM plant seeds, which is the opposite from the other two places. For participants from Shandong Province, household size significantly impacts participants’ degree of acceptance of GM plant seeds. For participants from Shanxi and Shandong, the acceptance of GM plant seeds by those who had people “over 60 years old” in their household was significantly lower, indicating that participants are more cautious about the choice of food for elderly people. For the whole sample, the acceptance level by participants who are in charge of food purchases, read information on food package more frequently and have richer genetic knowledge is significantly lower, but coefficients are not significant for the three provinces. For participants from Shanxi Province, the higher the cognitive level of GM technology, the lower the acceptance level of GM agricultural products. For Henan participants who thought GM agricultural products should be labeled, the lower their expectations towards GM technology, the lower the degree of their acceptance of GM plant seeds (negative and significant coefficient of exp*label). The interaction term between risk amplification and trust in the food industry (ra*trust) is significantly positive, similar to the results in Table 8.
For purchasing intention, the degree of risk amplification has no significant impact on participants from Henan Province; for participants from Shandong Province, the risk perception has no significant impact on the purchase intention. The relative risk coefficient for Shandong participants is significantly higher than those of the other two samples. Gender has a significant impact on willingness to accept GM products for Shanxi participants: women are more willing to accept GM agricultural products than men, whereas gender has no significant impact on purchasing intention for Shandong and Henan participants. For the Henan sample, older participants have stronger purchasing intentions than younger ones. For the Shanxi sample, the intention of participants with family members younger than 7 years old to purchase GM agricultural products is significantly higher, but the purchasing intention of participants with family members over 60 years old is significantly lower. The higher the level of education, the higher the purchasing intention. For the three provinces, only the coefficient for the interaction between risk amplification and trust in the food industry for Shanxi participants is significantly positive. This indicates that the higher the degree of trust in the food industry, the greater the Shanxi participants’ willingness to buy GM plant seeds.
For recommendation intention, the coefficient for risk perception (rp) of Henan participants is significantly negative, the coefficient for relative risk (rr) of Shanxi participants is significantly negative, and the coefficients for the risk-related variables are not significant for the sample of Shandong Province. Older and married participants from Henan Province have a significantly higher willingness to recommend GM agricultural products. The coefficient of education level for Shanxi participants is significantly positive, similar to that of the whole sample. In the whole sample, the recommendation intention by participants in charge of food purchasing is significantly lower than those who are not in charge of food purchasing, but it is not significant for the three individual provinces. For participants from Shanxi Province, those who read information on food packaging more frequently and have a higher degree of cognition of GM technology are less willing to recommend GM agricultural products, which is the same as the willingness to accept and the willingness to purchase estimation results. The coefficient for label is significantly negative for the sample of Shanxi Province, which means that participants who believe that GM agricultural products should be labeled have lower willingness to recommend GM agricultural products. The coefficients for the two interaction terms in the whole sample are significantly positive, which is consistent with the results in Table 8.
These results show that risk-related factors, producers’ demographic backgrounds and food purchasing behavior impact the acceptance and purchasing of new technology as well as the recommendation intentions of producers in different areas in different ways.

4. Discussion

Factors impacting consumers’ willingness to accept or consume GM food have been analyzed extensively. The early literature includes Bredahl (1999), Lusk (2004) and De Steur (2010) [29,30,31]. Bredahl showed that the risk perception of GM food impacted the willingness of consumers to purchase GM food [29]. Based on surveys from the United States, the United Kingdom and France, Lusk found that information has a significant impact on consumers’ behavior, and the benefits to the environment brought by transgenic technology will greatly improve consumers’ willingness to purchase these products [30]. De Steur conducted a survey on consumer groups in Shanxi, China and found that consumers have a relatively high willingness to accept GM rice, and that objective knowledge and risk perception will affect consumers’ acceptance of GM rice [31].
More recently, Kubisz et al. found that the negative attitudes of Polish society towards GM food could be considered irrational; these were based on fears [28]. Guo et al. surveyed 573 consumers from Shandong Province, China and found that perceived risk negatively impacted the purchasing intention toward GM food, and that risk communication was vital for the acceptance of GM foods. The authors used a structural equation model [32].
There is abundant research on consumer risk perception and consumer purchasing intentions. However, there are few studies from the point of view of farmers. Some authors have studied the perceptions of farmers about GM products. American farmers have a broadly positive view of GMOs regardless of scale, whereas few small-scale farmers in Brazil had well-defined opinions in relation to GM crop cultivation, and many of them were illiterate [33]. In India, about 82% of farmers were aware of biotechnology, and about 77% were aware of GM crops. Over 80% agreed that GM technology increases productivity and offers solutions to the world’s food problems [34]. In Malaysia, most farmers believed GM crops have high benefits; hence, they have highly positive attitudes towards GM crops [35]. Chinese farmers’ cognition of transgenic technology is limited [36,37]. In Jiangsu Province and its neighborhood in China, about 18% of farmers have never heard of GM crops, 60% have heard of GM crops but were not familiar with them, only 22% are familiar with GM agricultural products. Additionally, even if farmers were clearly informed of the potential benefits of growing GM agricultural products, 35% of farmers were willing to grow GM agricultural products, 36% of farmers chose not to grow GM agricultural products, and 29% of farmers were not sure whether they would grow these crops [38].
Some focus on economic benefit of GM crops and the planting intentions of producers. Much evidence has shown that transgenic technology increases crop yields [39]. There has also been much success with crop varieties that are drought- and cold-resistant [40]. Economic benefits and low planting costs associated with GM products have been demonstrated [41,42]. Regarding the planting intention, Lu and Sun believe that education is an important factor affecting farmers’ adoption of new technologies [43]. Zhu found that high yield was an important factor affecting farmers’ planting intentions regarding transgenic rice [44], but Qaim and De Janvry proposed that farmers have come to realize that high yield and high profit are not exactly the same [45].
The present study also studied the impact of producers’ amplified risk and risk preferences on the adoption of GM technology. Figure 1 shows that only 37.3% of participants did not amplify the GM risk, and about 10% of participants from the whole sample strongly exaggerated the risks involved with GM technology. In terms of regions, the percentage of participants who amplify the GM risk was 65.3%, 62.4% and 60%, respectively, in Henan, Shanxi and Shandong. This conclusion is consistent with the findings of Kubisz et al., who demonstrated that the low level of understanding and acceptance of GMO technologies in Polish society is based to a large extent on stereotypes rather than on scientific knowledge [28]. This result is also supported by Li and Zhang, who believe that the media promotes the social amplification of GMO risk, and it has had a serious impact on residents’ perceptions of GMO risks and their purchasing intentions [46]. Our study found a new way to measure the degree of risk amplification. A health hazard ranking question was used to measure whether participants overestimate the harm of GM crops. In addition to the risks associated with GM products, participants had to rank the hazards of smoking, food additives, expired food and bird flu based on their perceptions of these from high to low. It has been proved that genetically modified organisms pose the least harm among these. GMO food can be considered to be the most thoroughly tested in the world; hence, the perception of harmfulness of GMO varieties is groundless [28]. Risk amplification will be 4 if GM food was ranked first among these options; by analogy, risk amplification will be 0 if GM food was ranked last.
Regarding the risk preferences, Table 3 demonstrates that the relative risk aversion coefficient increases with a higher transform line, and a larger coefficient indicates that subjects are more risk-averse. Over two-thirds of farmers were risk-averse in both series 1 and series 2. This result is consistent with Jin et al. [47] and Sulewski and Kloczko-Gajewska [48]. Our contribution was to calculate risk preferences with an economic experiment and to additionally add the loss in a series to measure whether producers maintain the same risk preference when facing both gain and loss. In prospect theory, people’s risk preference in the domain of gain differs from that in the domain of loss. It is significant to add loss into the choice.
In accordance with Table 8, the relative risk aversion coefficient and risk perception have significantly negative impacts on GM acceptance. In another word, participants who are more risk-averse and have a higher perception of risks associated with GM agricultural products are less likely to accept GM crops. The results are consistent across the ordered logit model and Poisson regression, and the coefficients are highly significant. The results are intuitive, because the lower the expectation towards transgenic crops, the lower the acceptance of them. Producers’ risk preferences affect their decisions to a great extent. This indicates that producers’ risk amplification might lead to irrational decisions in the adoption of GM crops. Jin et al. [47] showed that farmers’ risk preferences play an important role in agricultural production decisions such as those regarding climate change adaptation measures. This paper explores the impact of producers’ risk preferences on the acceptance of transgenic technology against the background of risk amplification.
The paper’s empirical analysis suggests important policy implications for the promotion of GM crops. The governments of China and other countries with similar characteristics of farmers should give consideration to relieving the degree of risk amplification and farmers’ risk aversion towards transgenic technology. In this way, a more collaborative approach can be taken in which the common objective is both a better understanding of the real risks (and benefits) and superior solutions for producer and consumer alike [49].

5. Conclusions

In this paper, we estimated the relative risk aversion coefficients of producers in three provinces of China based on economic experiments and calculated participants’ risk amplification, the perception of GMO and the acceptance of transgenic technology according to survey data. We then investigated how these risk-related variables impacted producers’ willingness to accept transgenic technology. We also included a series of other variables in the analysis, including the degree of trust in the Chinese food industry, the level of genetic knowledge, cognition regarding GM agricultural products, socio-demographic information and some purchasing behavior variables.
The findings about risk amplification, risk preference and risk perception were as follows. Only 37.3% of participants in the entire sample did not amplify the risk of genetically modified organisms. From a regional perspective, the proportions in Henan, Shanxi and Shandong provinces were 65.3%, 62.4% and 60%, respectively. The risk amplification variable significantly affects producers’ acceptance of genetically modified technology in the regression, and the two are negatively correlated. Additionally, the results of the economic experiment showed that over 67% of participants were risk-averse. The higher the relative risk aversion coefficient, the lower the acceptance of genetically modified technology by producers, and the former has a significant impact on the latter. Moreover, the stronger the risk perception, the significantly lower the subjects’ acceptance of genetically modified technology. Our three key variables all showed a negative impact on producers’ response to genetically modified plant seeds, including participants’ willingness to accept, purchase and recommend GM products. It can be seen that higher levels of knowledge and cognition do not necessarily make producers more rational. Individual risk attitudes significantly affect producers’ decision-making methods.
The impact of personal and family characteristics on the acceptance of transgenic technology are as follows: Producers’ demographic backgrounds and purchasing behavior impact their acceptance intention, purchasing intention and recommendation intention of GM agricultural products in different ways. For example, the marital status of a producer impacts the acceptance intention differently from its impact on purchasing intention and recommendation intention. Similarly, there are regional differences in terms of which variables impact the acceptance, purchasing and recommendation intentions.
Finally, we found that transparent policies and actions of the government (such as labeling GM seeds) can reduce the risk amplification effect on producers and increase their acceptance of GM seeds [2]. A high level of trust in the government can increase the acceptance of transgenic technology.
According to results of this study, the following recommendations can be considered to improve producers’ acceptance of key transgenic technology. First, supportive environments and policies will lower farmers’ risk aversion levels and thus improve their acceptance of transgenic technology [43]. The government should provide financial support such as agricultural subsidies and also improve agricultural insurance systems to ensure that farmers do not fear potential major losses from the planting of GM crops. These actions can help to encourage the diffusion, application, and further development of helpful innovations that enhance the health and standard of living of the food producers and the population as a whole [50].

Author Contributions

Conceptualization: L.Z., S.L., H.G. and D.A.; Methodology: L.Z., S.L. and H.G.; Writing: L.Z. and S.L.; Providing idea: L.Z. and H.G.; Providing revised advice: H.G. and D.A. All authors have read and agreed to the published version of the manuscript.

Funding

This research was funded by the National Science Foundation of China (Grant No. 71803132) and the National Social Science Foundation of China (Grant No. 22ZDA058).

Institutional Review Board Statement

Not applicable.

Data Availability Statement

The data collected are deposited in an Excel file at Shanghai Maritime University.

Conflicts of Interest

The authors declare no conflict of interest.

References

  1. McCloskey, D.N. The great enrichment: A humanistic and social scientific account. Soc. Sci. Hist. 2016, 40, 583–598. [Google Scholar] [CrossRef]
  2. Zhao, L.; Gu, H.; Yue, C.; Ahlstrom, D. Consumer welfare and GM food labeling: A simulation using an adjusted Kumaraswamy distribution. Food Policy 2013, 42, 58–70. [Google Scholar] [CrossRef]
  3. Kubisz, P.; Dalton, G.; Majewski, E.; Pogodzińska, K. Facts and Myths about GM Food—The Case of Poland. Agriculture 2021, 11, 791. [Google Scholar] [CrossRef]
  4. Kasperson, R.E.; Renn, O.; Slovic, P. The social amplification of risk: A conceptual framework. Risk Anal. 1988, 8, 178–187. [Google Scholar] [CrossRef]
  5. Ahlstrom, D. Innovation and growth: How business contributes to society. Acad. Manag. Perspect. 2010, 24, 11–24. [Google Scholar] [CrossRef]
  6. Liu, E.M. Time to change what to sow: Risk preferences and technology adoption decisions of cotton farmers in China. Rev. Econ. Stat. 2013, 95, 1386–1403. [Google Scholar] [CrossRef]
  7. Slovic, P. Perception of risk. Science 1987, 236, 280–285. [Google Scholar] [CrossRef] [PubMed]
  8. Tversky, A.; Kahneman, D. Judgment under Uncertainty: Heuristics and Biases. Science 1974, 185, 1124–1131. [Google Scholar] [CrossRef]
  9. Kim, J.; Lee, D.; Lee, M.; Ryu, K.; Kim, J.B. Monitoring and Risk Assessment of Pesticide Residues in School Foodservice Agricultural Products in Gwangju Metropolitan Area. J. Food Hyg. Saf. 2019, 34, 283–289. [Google Scholar] [CrossRef]
  10. Lee, S.; Lee, N.; Dockte, C.E. Effects of Message Presentation Type on GM Food Risk Perception, Similarly Judgment, and Attitude. Health Commun. 2020, 6, 1666–1676. [Google Scholar] [CrossRef]
  11. Li, D.; Zhang, Q. The influence of media risk amplification on consumers’ willingness to buy genetically modified agricultural products. J. Zhejiang Agric. Sci. 2020, 61, 1011–1015. (In Chinese) [Google Scholar]
  12. Awotide, B.A.; Karimov, A.A.; Diagne, A. Agricultural technology adoption, commercialization and small holder rice farmers’ welfare in Rural. Agric. Food Econ. 2016, 4, 3. [Google Scholar] [CrossRef]
  13. Tanaka, T.; Camerer, C.F.; Quang, N. Risk and time preferences: Linking experimental and household survey data from Vietnam. Am. Econ. Rev. 2010, 100, 557–571. [Google Scholar] [CrossRef]
  14. Ofuoku, A.U.; Egho, E.O.; Enujeke, E.C. Integrated Pest Management (IPM) Adoption among Farmers in Central Agro-Ecological Zone of Delta State, Nigeria. Agric. Stint si Pract. 2012, 7, 123–130. [Google Scholar] [CrossRef]
  15. Korir, J.K.; Affognon, H.D.; Ritho, C.N. Grower adoption of an integrated pest management package for management of mango- infesting fruit flies (Diptera:Tephritidae) in Embu, Kenya. Int. J. Trop. Insect Sci. 2015, 35, 80–89. [Google Scholar] [CrossRef]
  16. Rezaei, M.M.; Hayati, D.; Rafiee, Z. Analysis of administrative barriers to pistachio integrated pest management: A case study in Rafsanjan City. Int. J. Mod. Manag. Foresight 2014, 1, 35–43. [Google Scholar]
  17. Huang, J.; Qi, L.; Chen, R. Technical information knowledge, risk preference and pesticide application by farmers. Manag. World 2008, 5, 71–76. (In Chinese) [Google Scholar] [CrossRef]
  18. Yang, P.; Malcolm, I.; Su, Y.; Flavia, J. Farmers Knowledge, Perceptions and Practices in Transgenic Bt Cotton in Small Producer Systems in Northern China. Crop Prot. 2005, 24, 229–239. [Google Scholar] [CrossRef]
  19. Karlan, D.; Osei, R.; Osei-Akoto, L. Agricultural decisions after relaxing credit and risk constraints. Q. J. Econ. 2014, 129, 597–652. [Google Scholar] [CrossRef]
  20. Brick, K.; Visser, M. Risk preferences, technology adoption and insurance uptake: A framed experiment. J. Econ. Behav. Organ. 2015, 118, 383–396. [Google Scholar] [CrossRef]
  21. Luo, M.; Lin, Y.; Qiu, H. Risk preferences, training participation and farmers’ adoption of new technology: Case of Henan province. J. Arid. Land. Resour. Environ. 2021, 35, 43–48. (In Chinese) [Google Scholar] [CrossRef]
  22. Lusk, J.L.; Coble, K.H. Risk perceptions, Risk preference, and Acceptance of risky food. J. Agric. Econ. 2005, 87, 393–405. [Google Scholar] [CrossRef]
  23. Zhou, Y.; Zuo, C.; Chen, Y.; Lian, H.; Ye, H. An experimental study on risk aversion of individuals with social preferences. Manag. World 2012, 6, 86–95. (In Chinese) [Google Scholar] [CrossRef]
  24. Zhang, S.; Sun, C.; Zhang, J. Research on the psychological mechanism of uncertain promotion-Experiment based on risk preference. J. Commer. Econ. 2021, 6, 60–64. (In Chinese) [Google Scholar]
  25. Binswanger, H.P. Attitudes Toward Risk: Experimental Measurement in Rural India. Am. J. Agric. Econ. 1980, 62, 395–407. [Google Scholar] [CrossRef]
  26. Holt, C.A.; Laury, S.K. Risk Aversion and Incentive Effects. Am. Econ. Rev. 2002, 92, 1644–1655. [Google Scholar] [CrossRef]
  27. Harrison, G.W.; Lau, M.I.; Rutström, E.E.; Sullivan, M.B. Eliciting Risk and Time Preferences Using Field Experiments: Some Methodological Issues. Res. Exp. Econ. 2005, 10, 125–218. [Google Scholar] [CrossRef]
  28. Dong, O.X.; Ronald, P.C. Genetic engineering for disease resistance in plants: Recent progress and future perspectives. Plant Physiol. 2019, 180, 26–38. [Google Scholar] [CrossRef]
  29. Bredahl, L. Consumers Cognitions with Regard to Genetically Modified Foods. Results of a Qualitative Study in Four Countries. Appetite 1999, 33, 343–360. [Google Scholar] [CrossRef]
  30. Lusk, J.L.; House, L.O.; Valli, C.; Jaeger, S.R.; Moore, M.; Morrow, J.L.; Traill, W.B. Effect of Information about Benefits of Biotechnology on Consumer Acceptance of Genetically Modified Food: Evidence from Experimental Auctions in United States, England, and France. Eur. Rev. Agric. Econ. 2004, 31, 179–204. [Google Scholar] [CrossRef]
  31. De Steur, H.; Gellynck, X.; Storozhenko, S.; Liqun, G.; Lambert, W.; Van Der Straeten, D.; Viaene, J. Willingness-to-Accept and Purchase Genetically Modified Rice with High Folate Content in Shanxi Province, China. Appetite 2010, 54, 118–125. [Google Scholar] [CrossRef] [PubMed]
  32. Guo, Q.; Yao, N.; Zhu, W. How consumers’ perception and information processing affect their acceptance of genetically modified foods in China: A risk communication perspective. Food Res. Int. 2020, 137, 109518. [Google Scholar] [CrossRef] [PubMed]
  33. Carla, A.; Luisa, M.; Ildeu, D.C.M. Perceptions of Brazilian small-scale farmers about genetically modified crops. Ambient. Soc 2015, 18, 193–210. [Google Scholar] [CrossRef]
  34. Autade, R.H.; Jadhav, R.M.; Gaikar, P.S.; Jori, D.B.; Antre, S.H.; Reddy, P.G. Farmers perception, knowledge and attitude towards Biotech (GM) crops at Agrowon Agri Expo—A survey. Int. J. Agric. Environ. Biotechnol. 2015, 8, 753–761. [Google Scholar] [CrossRef]
  35. Muhammad, A.d.C.M.; Mohamed, F.N.B.; Latifah, A. Farmers’ attitudes towards GM crops and their predictors. J. Sci. Food Agric. 2021, 101, 5457–5468. [Google Scholar] [CrossRef]
  36. Xu, J.P.; Yan, Z.Y. Farmers’ Cognition of Transgenic Technology and Production Intention of Transgenic Staple Foods-taking Hubei Area Grainfarmers as Investigation Objects. Forum Sci. Technol. China 2010, 11, 142–148. (In Chinese) [Google Scholar] [CrossRef]
  37. Wang, G.X.; Yang, Y.Z.; Chen, G. A Survey of the Planting Condition and the Peasant Attitude of Genetically Modified Crops in Henan Province. J. Anhui Agri. Sci. 2013, 41, 8106–8108+8111. [Google Scholar] [CrossRef]
  38. Wang, C.W.; Wang, S.T.; Wang, Y.D. An empirical analysis of the effect of farmers’ willingness to purchase genetically modified food on their willingness to grow genetically modified agricultural products. J. Guangxi Univ. Financ. Econ. 2021, 34, 114–126. [Google Scholar]
  39. Rymuza, K.; Radzka, E.; Cała, J. The Effect of Applied Biostimulants on the Yielding of Three Non-Genetically Modified Soybean Cultivars. Agriculture 2023, 13, 900. [Google Scholar] [CrossRef]
  40. Umezawa, T.; Fujita, M.; Fujita, Y.; Yamaguchi-Shinozaki, K.; Shinozaki, K. Engineering Drought Tolerance in Plants: Discovering and Tailoring Genes to Unlock the Future. Curr. Opin. Biotechnol. 2006, 17, 113–122. [Google Scholar] [CrossRef]
  41. Hancock, J.F. Frame work for assessing the risk of transgenic crops. Bioscience 2003, 53, 512–519. [Google Scholar] [CrossRef]
  42. Bennett, R.; Ismael, Y.; Kambhampati, U.; Morse, S. Economic Impact of Genetically Modified Cotton in India. AgBioForum 2004, 7, 96–100. [Google Scholar]
  43. Lu, Q.; Sun, J. Study on the influence of farmers’ cognition about genetically modified crops on planting intention. J. China Agric. Univ. 2014, 19, 34–42. (In Chinese) [Google Scholar] [CrossRef]
  44. Zhu, S. Research on rice farmers’ cognition, planting intention and influencing factors of transgenic rice: Based on the empirical analysis of rice farmers in Huai‘an City, Jiangsu Province. Sci. Technol. Manag. Res. 2011, 31, 211–214. (In Chinese) [Google Scholar] [CrossRef]
  45. Qaim, M.; De Janvry, A. Genetically modified crops, corporate pricing strategies and farmers’ adoption: The case of Bt Cotton in Argentina. Am. J. Agric. Econ. 2003, 85, 814–828. [Google Scholar] [CrossRef]
  46. Zhao, L.; Huang, J.; Gu, H.; Yue, C.; Parasuram, U.; Ahlstrom, D. Consumers’ risk perception and willingness to pay for abnormally shaped vegetables in China. Int. Food Agribus. Manag. Rev. 2023. [Google Scholar] [CrossRef]
  47. Jin, J.; Gao, Y.; Wang, X.; Pham, K.N. Farmers’ risk preferences and their climate change adaptation strategies in the Yongqiao District, China. Land Use Policy 2015, 47, 365–372. [Google Scholar] [CrossRef]
  48. Sulewski, P.; Kloczko-Gajewska, A. Farmers’ risk perception, risk aversion and strategies to cope with production risk: An empirical study from Poland. Stud. Agric. Econ. 2014, 116, 140–147. [Google Scholar] [CrossRef]
  49. Dunbar, R.L.M.; Ahlstrom, D. Seeking the institutional balance of power: Avoiding the power of a balanced view. Acad. Manag. Rev. 1995, 20, 171–192. [Google Scholar] [CrossRef]
  50. Tomizawa, A.; Zhao, L.; Bassellier, G.; Ahlstrom, D. Economic growth, innovation, institutions, and the Great Enrichment. Asia Pac. J. Manag. 2019, 37, 7–31. [Google Scholar] [CrossRef]
Figure 1. Frequency distribution diagram of producers’ risk amplification degree.
Agriculture 13 01871 g001
Figure 2. Frequency distribution diagram of producers’ health and environment risk perception.
Agriculture 13 01871 g002
Figure 3. Number of participants switching at different rows in the gambling experiment series 3. (Switching at row 1 means that only option B is selected. The number of valid observations is 328).
Agriculture 13 01871 g003
Table 1. Basic information on the sampled area.
Shanxi ProvinceHenan ProvinceShandong Province
LandformsWest of central Taihang MountainMountains in the west and plains in the eastSituated in front of a mountain and facing the sea; mountains, hills and plains are distributed alternately
Resident population1408.8 thousand5192.2 thousand2959.5 thousand
Annual per capita GDPCNY 47,790 CNY 42,936 CNY 58,110
Number of universities376
Proportion of primary industry 1 in GDP1.50%11.80%8.40%
1 The primary industry is mainly agriculture, including hunting, fishery, animal husbandry and forestry.
Table 2. Economic experiment/lottery game.
TLLottery ALottery B
Series 1
1+8 CNY with 30%, +2 CNY with 70%+0.5 CNY with 90%, +10 CNY with 10%
2+8 CNY with 30%, +2 CNY with 70%+0.5 CNY with 90%, +13 CNY with 10%
3+8 CNY with 30%, +2 CNY with 70%+0.5 CNY with 90%, +16 CNY with 10%
4+8 CNY with 30%, +2 CNY with 70%+0.5 CNY with 90%, +19 CNY with 10%
5+8 CNY with 30%, +2 CNY with 70%+0.5 CNY with 90%, +22 CNY with 10%
6+8 CNY with 30%, +2 CNY with 70%+0.5 CNY with 90%, +25 CNY with 10%
7+8 CNY with 30%, +2 CNY with 70%+0.5 CNY with 90%, +28 CNY with 10%
8+8 CNY with 30%, +2 CNY with 70%+0.5 CNY with 90%, +33 CNY with 10%
9+8 CNY with 30%, +2 CNY with 70%+0.5 CNY with 90%, +38 CNY with 10%
10+8 CNY with 30%, +2 CNY with 70%+0.5 CNY with 90%, +45 CNY with 10%
11+8 CNY with 30%, +2 CNY with 70%+0.5 CNY with 90%, +55 CNY with 10%
12+8 CNY with 30%, +2 CNY with 70%+0.5 CNY with 90%, +65 CNY with 10%
13+8 CNY with 30%, +2 CNY with 70%+0.5 CNY with 90%, +80 CNY with 10%
14+8 CNY with 30%, +2 CNY with 70%+0.5 CNY with 90%, +100 CNY with 10%
Series 2
1+8 CNY with 90%, +6 CNY with 10%+0.5 CNY with 30%, +9 CNY with 70%
2+8 CNY with 90%, +6 CNY with 10%+0.5 CNY with 30%, +10 CNY with 70%
3+8 CNY with 90%, +6 CNY with 10%+0.5 CNY with 30%, +11 CNY with 70%
4+8 CNY with 90%, +6 CNY with 10%+0.5 CNY with 30%, +12 CNY with 70%
5+8 CNY with 90%, +6 CNY with 10%+0.5 CNY with 30%, +13 CNY with 70%
6+8 CNY with 90%, +6 CNY with 10%+0.5 CNY with 30%, +14 CNY with 70%
7+8 CNY with 90%, +6 CNY with 10%+0.5 CNY with 30%, +15 CNY with 70%
8+8 CNY with 90%, +6 CNY with 10%+0.5 CNY with 30%, +17 CNY with 70%
9+8 CNY with 90%, +6 CNY with 10%+0.5 CNY with 30%, +19 CNY with 70%
10+8 CNY with 90%, +6 CNY with 10%+0.5 CNY with 30%, +21 CNY with 70%
11+8 CNY with 90%, +6 CNY with 10%+0.5 CNY with 30%, +23 CNY with 70%
12+8 CNY with 90%, +6 CNY with 10%+0.5 CNY with 30%, +25 CNY with 70%
13+8 CNY with 90%, +6 CNY with 10%+0.5 CNY with 30%, +29 CNY with 70%
14+8 CNY with 90%, +6 CNY with 10%+0.5 CNY with 30%, +35 CNY with 70%
Series 3
1+12 CNY with 50%, −2 CNY with 50%+15 CNY with 50%, −10 CNY with 50%
2+2 CNY with 50%, −2 CNY with 50%+15 CNY with 50%, −10 CNY with 50%
3+0.5 CNY with 50%, −2 CNY with 50%+15 CNY with 50%, −10 CNY with 50%
4+0.5 CNY with 50%, −2 CNY with 50%+15 CNY with 50%, −8 CNY with 50%
5+0.5 CNY with 50%, −4 CNY with 50%+15 CNY with 50%, −8 CNY with 50%
6+0.5 CNY with 50%, −4 CNY with 50%+15 CNY with 50%, −7 CNY with 50%
7+0.5 CNY with 50%, −4 CNY with 50%+15 CNY with 50%, −5 CNY with 50%
Table 3. Relative risk coefficient distribution of series 1 and series 2.
TLRange of rr1rr1 FrequencyRange of rr2rr2 Frequency
1rr < −3.93−3.9329rr < −1.57−1.5791
2−3.93 < rr < −1.42−2.67512−1.57 < rr < −0.42−0.9957
3−1.42 < rr < −0.96−1.199−0.42 < rr < 0.02−0.27
4−0.96 < rr < −0.52−0.74100.02 < rr < 0.270.1458
5−0.52 < rr < −0.34−0.4370.27 < rr < 0.430.357
6−0.34 < rr < −0.21−0.275100.43 < rr < 0.550.499
7−0.21 < rr < −0.12−0.165130.55 < rr < 0.630.5910
8−0.12 < rr < −0.01−0.065160.63 < rr < 0.770.720
9−0.01 < rr < 0.070.03120.77 < rr < 0.840.80511
100.07 < rr < 0.150.11170.84 < rr < 0.910.87518
110.15 < rr < 0.240.195310.91 < rr < 0.960.93516
120.24 < rr < 0.300.27240.96 < rr < 10.9818
130.30 < rr < 0.360.33331 < rr < 1.061.0315
140.36 < rr < 0.420.39431.06 < rr < 1.121.0916
Never0.42 < rr 0.42721.12 < rr 1.1285
SUM 338 338
Table 4. Summary of explanatory variables.
Variable SymbolExplanatory VariableNotesExpected Direction
Core explanatory variable
raRisk amplification0-1-2-3-4: No risk amplification to the highest degree of risk amplification
rrRelative risk aversion coefficientThe degree of risk averseness increases as this variable increases
rpHealth and evironment risk perception1-2-3-4-5: Low–high
crCommercial risk perception towards GM agricultural products1-2-3-4-5: Low–high
Demographic variables
genderGender of participantFemale = 1, male = 0
ageAge of participantContinuous variable
marryMarital status of participantMarried = 1, unmarried = 0
nmNumber of people in the householdContinuous variable
Under7Whether there are children under 7 years old in the householdYes = 1; other = 0
Byond60Whether there are elderly people who are 60 years and older in the householdYes = 1; other = 0
eduParticipants’ education levelPrimary school = 1, junior high school = 2, high school = 3, undergraduate and junior college = 4, master’s degree or above = 5+
mhiMonthly household income1–10 levels: the higher the level, the higher the monthly income of the household+
Other control variables
charIf a participant was in charge of purchasing seedsYes = 1; other = 0
freqHow often participants read production date, shelf life and nutrition information on food package when purchasing food1-2-3-4-5: Rarely–frequently+
trustDegree of trust in Chinese food industry1-2-3-4-5: Lowest degree of trust to highest degree of trust+
cogCognition of GM agricultural products1-2-3-4-5: Very unfamiliar–very familiar+
knowlGenetic knowledge0-1-2-3-4: Poor genetic knowledge to rich genetic knowledge+
labelGM agricultural products must be labeledYes = 1; other = 0
Table 5. Descriptive statistics of explanatory variables.
Henan ProvinceShanxi ProvinceShandong ProvinceWhole
NumberProportionNumberProportionNumberProportionNumberProportion
Level of willingness to accept GM plant seeds
13233.68%5838.93%3840.43%12837.87%
22324.21%2315.44%2728.72%7321.60%
33334.74%4530.20%2122.34%9929.29%
433.16%128.05%55.32%205.92%
544.21%117.38%33.19%185.33%
Level of willingness to recommend GM plant seeds
13536.84%4731.54%3840.43%12035.50%
22728.42%3724.83%3436.17%9828.99%
33233.68%4530.20%1111.70%8826.04%
411.05%1610.74%77.45%247.10%
500.00%42.68%44.26%82.37%
Level of agreement with importing a large number of GM plant seeds
13637.89%4630.87%3537.23%11734.62%
22728.42%3020.13%3234.04%8926.33%
32728.42%5637.58%1414.89%9728.70%
433.16%106.71%1111.70%247.10%
522.11%74.70%22.13%113.25%
Level of support for the development of GM agricultural products
13334.74%4228.19%3436.17%10932.25%
22223.16%1812.08%2627.66%6619.53%
33233.68%4731.54%2021.28%9929.29%
433.16%2214.77%88.51%339.76%
555.26%2013.42%66.38%319.17%
Level of willingness to purchase GM plant seeds
13637.9%3926.2%2829.8%10330.5%
21920%2416.1%3941.5%8224.3%
33637.9%4530.2%1819.1%9929.3%
422.1%1912.8%55.3%267.7%
522.1%2214.8%44.3%288.3%
Table 6. Summary statistics of core risk-related explanatory variables.
MeanStd. Error MeanStd. Error
ra rr1
Henan Province1.291.26Henan Province−0.071.08
Shanxi Province1.261.27Shanxi Province−0.121.10
Shandong Province1.491.50Shandong Province−0.060.74
Whole sample1.331.33Whole sample−0.091.00
rp rr2
Henan Province3.390.77Henan Province0.221.16
Shanxi Province3.170.76Shanxi Province0.131.20
Shandong Province3.440.93Shandong Province0.660.45
Whole sample3.310.82Whole sample0.301.06
Table 7. Summary statistics of participants’ sociodemographic backgrounds.
Henan ProvinceShanxi ProvinceShandong ProvinceWhole Sample
NumberProportionNumberProportionNumberProportionNumberProportion
Gender (0 = male, 1 = female)
14648.42%8053.69%3739.36%16348.22%
04951.58%6946.31%5760.64%17551.78%
Age
≤251818.95%2416.11%33.19%4513.31%
25–352122.11%3322.15%1515.96%6920.41%
35–451212.63%4731.54%3638.30%9528.11%
45–552930.53%3322.15%3436.17%9628.40%
>551515.79%128.05%66.38%339.76%
Marital status (0 = unmarried, 1 = married)
17781.05%11174.50%8590.43%27380.77%
01818.95%3825.50%99.57%6519.23%
Number of family members
≤33536.84%5738.26%4952.13%14141.72%
4–55254.74%8154.36%4042.55%17351.18%
>588.42%117.38%55.32%247.10%
Members under the age of 7
No6972.63%11073.83%6063.83%23970.71%
Yes2627.37%3926.17%3436.17%9929.29%
Members beyond the age of 60
No5456.84%6644.30%4345.74%16348.22%
Yes4143.16%8355.70%5154.26%17551.78%
Education (1 = primary school degree, 2 = junior high school degree, 3 = high school degree, 4 = college degree, 5 = master’s degree or above)
11313.68%138.72%1212.77%3811.24%
23031.58%4026.85%4244.68%11233.14%
32223.16%3120.81%2526.60%7823.08%
42728.42%5939.60%1515.96%10129.88%
533.16%64.03%00.00%92.66%
Monthly household income (1 = CNY 4000–5999, 2 = CNY 6000–9999, 3 = above CNY 10,000)
15658.95%10771.81%3840.43%20159.47%
22324.21%3020.13%3537.23%8826.04%
31616.84%128.05%2122.34%4914.50%
Table 8. Full sample estimation results using ordered logit model and Poisson model.
Explanatory VariableOrdered Logit ModelPoisson Regression
Model 1Model 2Model 3Model 4
ra−0.216 *** (0.079)−0.819 *** (0.281)−0.050 *** (0.030)−0.194 *** (0.101)
rp−0.383 ** (0.160)−0.404 *** (0.162)−0.092 * (0.054)−0.091 * (0.055)
cr−1.026 *** (0.174)−1.018 *** (0.173)−0.190 *** (0.058)−0.186 *** (0.058)
rr−0.237 ** (0.104)−0.282 *** (0.105)−0.053 ** (0.036)−0.059 *** (0.036)
gender0.135 (0.213)0.180 (0.215)0.067 (0.080)0.067 (0.080)
age−0.025 ** (0.011)−0.027 ** (0.011)−0.004 ** (0.004)−0.004 * (0.004)
marry−0.231 (0.247)−0.216 (0.248)−0.062 (0.085)−0.048 (0.084)
nm0.009 (0.090)−0.032 (0.091)0.015 (0.035)0.014 (0.035)
under7 −0.028 (0.089)−0.019 (0.090)
beyond60 −0.037 (0.078)−0.040 (0.078)
edu0.216 ** (0.109)0.178 * (0.119)0.062 * (0.041)0.057 * (0.042)
mhi0.019 (0.055)0.004 (0.059)0.007 (0.020)0.009 (0.020)
char−0.476 ** (0.218)−0.409 ** (0.244)−0.090 ** (0.084)−0.091 ** (0.085)
freq0.128 (0.078)0.137 ** (0.082)0.025 ** (0.028)0.091 ** (0.028)
trust0.143 (0.140)0.210 (0.207)0.015 (0.051)0.068 (0.075)
cog−0.087 (0.086)−0.330 * (0.190)−0.008 (0.032)−0.094 (0.066)
knowl −0.051 * (0.038)−0.051 * (0.038)
label−0.694 ** (0.278)−1.502 *** (0.493)−0.142 *** (0.096)−0.269 *** (0.172)
ra*trust 0.239 ** (0.106) 0.058 ** (0.038)
cog*label 0.365 * (0.207) 0.059 * (0.074)
Note: *, **, *** denote significance at 10%, 5% and 1%, respectively. Standard errors are in parentheses.
Table 9. Estimation results of factors impacting the willingness of producers to accept, to purchase and to recommend GM technology in different provinces.
Willingness to AcceptWillingness to Purchase SeedsWillingness to Recommend
Explanatory VariableFull Sample ShanxiHenanShandongFull SampleShanxiHenanShandongFull SampleShanxiHenanShandong
ra−0.920 ***
(0.238)
−1.212 ***
(0.446)
−1.693 *
(1.058)
−4.383 ***
(1.142)
−0.402 *
(0.216)
−0.865 **
(0.370)
−0.873
(0.750)
−0.891 *
(0.518)
−0.579 ***
(0.219)
−0.345
(0.361)
−1.627
(1.043)
−1.074
(0.747)
rp−0.320 **
(0.170)
−0.361
(0.270)
−1.896 ***
(0.447)
1.043 **
(0.408)
−0.686 ***
(0.171)
−0.647 **
(0.274)
−1.425 ***
(0.406)
−0.159
(0.365)
−0.522 ***
(0.171)
−0.389
(0.271)
−1.429 ***
(0.412)
−0.226
(0.356)
cr−0.653 ***
(0.184)
−0.842 **
(0.313)
0.171
(0.377)
−1.358 ***
(0.429)
−0.953 ***
(0.187)
−1.845 ***
(0.356)
−0.171
(0.392)
−0.676 *
(0.406)
−0.893 ***
(0.188)
−1.160 ***
(0.333)
−0.012
(0.342)
−1.129 ***
(0.395)
rr−0.298 ***
(0.105)
−0.395 **
(0.155)
−0.244
(0.212)
−0.230
(0.340)
−0.246 **
(0.108)
−0.226
(0.158)
−0.231
(0.206)
−0.800 **
(0.323)
−0.199 *
(0.107)
−0.330 **
(0.159)
−0.227
(0.210)
−0.209
(0.322)
gender0.288
(0.234)
0.418
(0.376)
0.732
(0.594)
0.096
(0.546)
0.139
(0.227)
0.745 **
(0.369)
−0.261
(0.574)
−0.345
(0.519)
0.293
(0.233)
0.404
(0.366)
0.412
(0.577)
0.279
(0.524)
age−0.006
(0.012)
−0.011
(0.021)
0.076 ***
(0.028)
0.052
(0.051)
−0.023 *
(0.012)
−0.016
(0.020)
0.063 **
(0.027)
−0.086 **
(0.043)
−0.030 **
(0.012)
−0.024
(0.020)
0.048 *
(0.028)
−0.058
(0.045)
marry0.080
(0.230)
−0.630
(0.479)
2.259 **
(0.939)
−0.597
(1.192)
−0.540 *
(0.289)
−0.703
(0.485)
1.387
(0.924)
−1.506
(1.076)
−0.482 *
(0.301)
−0.398
(0.463)
1.519 *
(0.918)
−0.919
(1.035)
nm0.124
(0.102)
−0.183
(0.162)
0.311
(0.243)
0.642 **
(0.277)
0.085
(0.098)
0.089
(0.156)
0.420 *
(0.238)
0.118
(0.242)
−0.057
(0.102)
−0.006
(0.160)
0.105
(0.249)
−0.158
(0.243)
under7−0.245
(0.255)
0.222
(0.487)
−0.514
(0.509)
0.196
(0.675)
−0.083
(0.253)
0.929 **
(0.467)
−0.502
(0.497)
−0.384
(0.639)
0.194
(0.250)
0.490
(0.451)
−0.203
(0.514)
0.554
(0.616)
beyond60−0.504 **
(0.225)
−0.788 *
(0.405)
−0.766
(0.501)
−1.350 **
(0.611)
−0.101
(0.221)
−0.720 *
(0.403)
−0.291
(0.485)
−0.630
(0.553)
0.049
(0.226)
−0.301
(0.409)
−0.451
(0.498)
0.239
(0.539)
edu0.198 *
(0.120)
0.495 **
(0.199)
0.358
(0.304)
0.134
(0.335)
0.386 ***
(0.120)
0.52 ***
(0.186)
0.245
(0.299)
−0.186
(0.308)
0.317 ***
(0.120)
0.549 ***
(0.187)
0.374
(0.305)
−0.016
(0.313)
mhi0.057
(0.059)
0.111
(0.105)
0.019
(0.142)
−0.039
(0.146)
−0.0019
(0.057)
−0.054
(0.099)
0.157
(0.147)
0.136
(0.134)
0.031
(0.058)
0.033
(0.105)
−0.054
(0.139)
0.111
(0.126)
char−0.497 **
(0.244)
−0.425
(0.417)
−0.369
(0.568)
−0.271
(0.566)
−0.088
(0.241)
−0.426
(0.417)
0.317
(0.564)
0.333
(0.515)
−0.513 **
(0.246)
−0.031
(0.425)
−0.515
(0.573)
−0.703
(0.512)
freq0.146 *
(0.087)
0.152
(0.127)
0.094
(0.189)
−0.180
(0.258)
0.112
(0.083)
0.017
(0.130)
0.128
(0.188)
−0.068
(0.228)
0.144 *
(0.082)
0.194 *
(0.118)
0.092
(0.196)
0.03
(0.229)
cog−0.230
(0.197)
−0.488 *
(0.293)
0.473
(0.488)
0.148
(0.566)
−0.069
(0.199)
−0.184
(0.288)
0.435
(0.501)
0.037
(0.575)
−0.540 ***
(0.208)
−0.648 **
(0.288)
−0.272
(0.543)
−0.546
(0.611)
knowl−0.186 *
(0.111)
−0.116
(0.182)
−0.002
(0.259)
−0.035
(0.293)
−0.244 *
(0.108)
−0.200
(0.172)
0.026
(0.249)
−0.311
(0.271)
−0.147
(0.111)
0.025
(0.173)
−0.413
(0.263)
−0.093
(0.260)
label−1.056 **
(0.513)
−1.593 **
(0.775)
0.21
(0.986)
−0.674
(1.683)
−0.460
(0.522)
−0.773
(0.821)
0.331
(0.990)
1.002
(1.611)
−1.181 **
(0.528)
−1.722 **
(0.799)
−0.855
(1.114)
−0.190
(1.690)
ra*trust0.225 ***
(0.084)
0.445 **
(0.183)
0.513
(0.422)
1.193 ***
(0.351)
0.052
(0.079)
0.291 *
(0.156)
0.171
(0.277)
0.099
(0.155)
0.165 **
(0.079)
0.134
(0.154)
0.493
(0.416)
0.290
(0.241)
cog*label0.240
(0.219)
0.577 *
(0.322)
−0.458
(0.533)
−0.237
(0.617)
−0.030
(0.221)
0.005
(0.329)
−0.538
(0.541)
−0.265
(0.604)
0.456 **
(0.229)
0.420
(0.325)
0.374
(0.580)
0.548
(0.650)
Pseudo R212.46%16.41%22.76%27.72%14.58%21.34%19.73%22.34%14%18.61%21.24%17.8%
Sample size338149959433814995943381499594
Note: *, **, *** denote significance at 10%, 5% and 1%, respectively. Standard errors are in parentheses.
Disclaimer/Publisher’s Note: The statements, opinions and data contained in all publications are solely those of the individual author(s) and contributor(s) and not of MDPI and/or the editor(s). MDPI and/or the editor(s) disclaim responsibility for any injury to people or property resulting from any ideas, methods, instructions or products referred to in the content.

