Article

An Analysis of the Determinants of Irrigation Farmworkers’ Food Security Status: A Case of Tshiombo Irrigation Scheme, South Africa †

School of Agriculture, Earth and Environmental Sciences, University of KwaZulu-Natal, Carbis Road, Scottsville, Pietermaritzburg 3201, South Africa
*
Author to whom correspondence should be addressed.
This research work is the part of Master thesis of Rudzani Mudzielwana.
Agriculture 2022, 12(7), 999; https://doi.org/10.3390/agriculture12070999
Submission received: 3 May 2022 / Revised: 11 June 2022 / Accepted: 6 July 2022 / Published: 11 July 2022
(This article belongs to the Topic Sustainable Development and Food Insecurity)

Abstract

:
Food insecurity is a comprehensive challenge. Food, being one of the most basic human needs, has become one of the most important concerns in the world, as more people are living in poverty and are vulnerable to food insecurity. Food insecurity levels vary across sectors, meaning that policy recommendations to address the problem have to be in specific contexts. Farmworkers in irrigation schemes are a sub-group that has received little attention in research regarding food security outcomes. This paper provides evidence of a study that was carried out to analyze food security among irrigation scheme farmworkers who either rent or do not rent irrigation plots from their employers in the Tshiombo Irrigation Scheme, Limpopo Province. Data were collected from 191 randomly selected farmworkers. The Household Food Insecurity Access Scale (HFIAS) was utilized to determine the extent of food security among the irrigation scheme farmworkers. Data were analyzed using the ordered probit model. Among the variables considered in the model, land size (p < 0.05), land leasing (p < 0.01), total household expenditure (p < 0.05), and food stored by farmworkers (p < 0.1) were found to significantly influence irrigation farmworkers’ food security status. These findings suggest that policymakers should design policies that encourage stakeholders from NGOs, and private and public sectors to train and provide resources that will enable and develop livelihood skills among farmworkers.

1. Introduction

There are various definitions of food security. The most recognized is that by FAO [1], which denotes that food security exists when all people, at all times, have physical, social, and economic access to sufficient, safe, and nutritious food that meets their dietary needs and food preferences for an active and healthy life [2]. The four pillars of food security are food availability, food access, food utilization, and food stability [3]. Food availability refers to an effective or continuous supply of food at both national and household levels. Food availability is affected by the production capabilities of the agricultural sector, and input and output market conditions [1]. Food access refers to the ability of households to acquire enough nutritious food [4]. This pillar reflects the demand side of food security and highlights the uneven inter and intra-household food distribution and sociocultural limits on food choices [5]. Food access is determined by two factors: economic and physical access. Economic access is determined by disposable income, food prices, and accessibility to social support, while physical access depends on the physical infrastructure that supports access such as paved roads, railways, electricity, and irrigation facilities [5]. Food utilization refers to a process through which the body utilizes various nutrients in the food. It also requires proper food preparation and hygiene practices, wide-ranging eating habits, and a diverse diet that necessitates the availability of all essential nutrients and the proper intra-household distribution of food [4]. Food stability strives to secure the dimensions of food availability, food access, and food utilization over time; therefore, access to food should remain unaffected even during sudden shocks such as economic crises [4]. FAO [1] points out that the variables in this pillar measure the dependence on food imports, domestic price variability, and variation in land equipped with irrigation. To achieve food security, all four dimensions must be fulfilled simultaneously [4]. Food insecurity is considered to occur when one or more of these factors are affected [6]. Vorster, et al. [7] agreed that South Africans, particularly those with a low income, may select a relatively less healthy diet that is associated with malnutrition. McLaren, et al. [8] stated that the right to food is highlighted in the international human rights documents and in section 27(1) (b) of the Constitution of the Republic of South Africa, which states that everyone has the right to have access to sufficient food and water; this is often violated. One of the challenges for the South African government is aligning policies and programs to reach and maintain food security status for all [9]. South Africa still lacks specific and accepted methods to measure food security and has no regulated way of monitoring the food security status of its population [10].
Smallholder and commercial farming are the pillars of South Africa’s primary agricultural production and food security. South Africa has an impressive level of food self-sufficiency. However, large numbers of households in South Africa are food-insecure [11]. One in four South Africans experiences hunger due to poverty, low wage, and high food prices [12]. Farmworkers in irrigation schemes earn the lowest wage in the agricultural sector in South Africa [13]. The government promotes and supports smallholder irrigation in former homelands to create jobs, reduce poverty, and enhance economic growth [11]. Ironically, food insecurity is rising among farmworkers in South Africa.
In Western Cape, many farmworkers lost their jobs after the farmworkers’ strike of 2013. Many describe how their food supplies are exhausted by mid-week, forcing them to skip meals due to low wages and, during tough periods, ending up eating porridge twice a day [14]. Countrywide, the agricultural labor force has shifted from workers with permanent contracts to seasonal or casual workers [13]. Seasonal and casual farmworkers are more vulnerable to food insecurity than permanent farmworkers because the former are employed only during the agricultural season and often earn below the legislated minimum wage rate [13]. Several studies in Africa have assessed the livelihood, labor, and employment status of farmworkers in rural areas, and these include Zimbabwe [15], Nigeria [16], and South Africa [17]. However, the recent literature of studies that can guide policymakers on food security and nutrition among farmworkers in an irrigation scheme in South Africa is scarce. Hence, this study analyzed the determinants of food security status among irrigation scheme farmworkers in the Limpopo Province of South Africa. The hypothesis is that irrigation scheme farmworkers who rent land from landlords are more food-secure than nonland-renting irrigation scheme farmworkers. To test our hypothesis, we used parametric ANOVA for continuous variables and a chi-square test for categorical variables to indicate the association between the irrigation scheme farmworkers’ food security status with different economic parameters. Furthermore, the ordered probit model was used to analyze factors that influence irrigation farmworker food security status.

2. Review of Food Security Measurements

2.1. Major Indicators Utilized to Measure Food Security Dimensions

The following indicators have been identified, their robustness and validity have proven to be cost-effective, time-sensitive, and effective in identifying those that lack access to adequate food, and these have been used across different geographical locations and cultures [18]. Each of these measures has been confirmed to be valid by the following authors: The Household Food Insecurity Access Scale by [18]; CSI Coping Strategies Index by Maxwell, et al. [19]; Household Dietary Diversity Score HDDS by Maxwell et al. [19].

2.1.1. Household Dietary Diversity

The Household Dietary Diversity Score (HDDS) was released in 2006 as part of the Food and Nutritional Technical Assistance (FANTA) II project as a population-level indicator of household food access [20]. Household dietary diversity can be described as the number of food groups consumed by a household over a given period and is an important indicator of food security dimensions. A more diversified household diet is correlated with caloric and protein adequacy, the percentage of protein from animal sources, and household income. The HDDS indicator indicates a household’s ability to access food as well as its socioeconomic status based on the previous 24 h [21]. The dietary diversity questionnaire is based on a set of food group questions and can be used to find a household’s dietary diversity score by categorizing different types of food based on the nutrients they comprise.
Few households in South Africa are making use of wild foods as part of their nutrient diet [22]. Wild foods are important for food security and poverty alleviation, and they are often cost-efficient and time-efficient to collect, saving households time and money [23]. Wild foods are especially important for the more disadvantaged members of the communities; those that are at most risk of food insecurity rely on these products for food, while others consume these because of cultural and taste preferences [23]. According to Bvenura and Afolayan [24], the consumption of wild vegetables is on the decline. Their economic importance is not fully realized by most South African citizens, unlike in other Sub-Saharan countries such as Zimbabwe, Zambia, Kenya, Botswana, Nigeria, and Swaziland, whose citizens continue to cultivate wild vegetables in abundance. Some of the vegetables grown are C. olitorius, C. gynandra, and some Amaranthus species that are also sold to supplement household income. The species mentioned above are also still cultivated on a small scale in some parts of Limpopo and KwaZulu Natal provinces [24]. Rural households also supplement their dietary needs with a variety of insects and wild meats and also collect wild fruits for consumption and sale.

2.1.2. Coping Strategies Index

The coping strategy index (CSI) is a group of questions that are asked in a household to find out how they manage to cope with the shortage of consuming enough food. The coping strategy index is estimated by measuring behavior, such as the alternative actions individual households use when they cannot acquire sufficient food [25]. The coping strategies are often identified by the person who is responsible for preparing or consuming the food. The coping strategies observed are usually linked to food practices in the short-term [26]. Chagomoka, et al. [27] observed that the gathering of wild food and selling of firewood was widely practiced in the rural parts of Limpopo Province, and they identified five coping strategies in the rural areas as the most severe in times of food insecurity, namely skipping a whole day without food, borrowing, buying food on credit, consuming seed stock, and restricting adult intake in favor of children. A study conducted by Oldewage-Theron, et al. [28] in Gauteng (Vaal triangle) revealed that most female-headed households experienced incidences of money shortfall as their money was used for food the month preceding the study. The coping strategies employed by these households were cooking a limited variety of foods during the previous month and limiting portion sizes [28].

2.1.3. The Household Food Insecurity Access Scale

The HFIAS is a continuous measure for investigating the incidents of household food insecurity in the previous month [18]. The scale is based on the principle that the occurrence of food insecurity can be established, quantified, and examined by classifying individual households using the food insecurity level. According to Carletto, et al. [29], the HFIAS highlights three broad aspects of household food insecurity access, which include: worrying about the likelihood of food insecurity, inadequate quality of food, and inadequate food supplies. The HFIAS is an advanced tool for measuring household food insecurity and it consists of a set of nine generic questions [18]. The first question addresses the anxiety and uncertainty of household food supply, Q2–Q4 address food quality variety and preference, and Q5–Q9 address insufficient food intake and its physical consequences. Q2–Q4 and Q5–Q9 are organized in order of increasing severity of the food insecurity condition [18]. Based on the response to the nine questions and frequency of occurrence over the past 30 days, households are assigned a score that ranges from 0 to 27 [30]. A study by Kabalo, et al. [31] indicated that the HFIAS method produces accurate results because of its internal consistency, criterion validity, and reliability for analyzing household food insecurity. Therefore, the Household Food Insecurity Access Scale (HFIAS) was utilized to determine the extent of food security among the irrigation scheme farmworkers in Tshiombo Village.

3. Materials and Methods

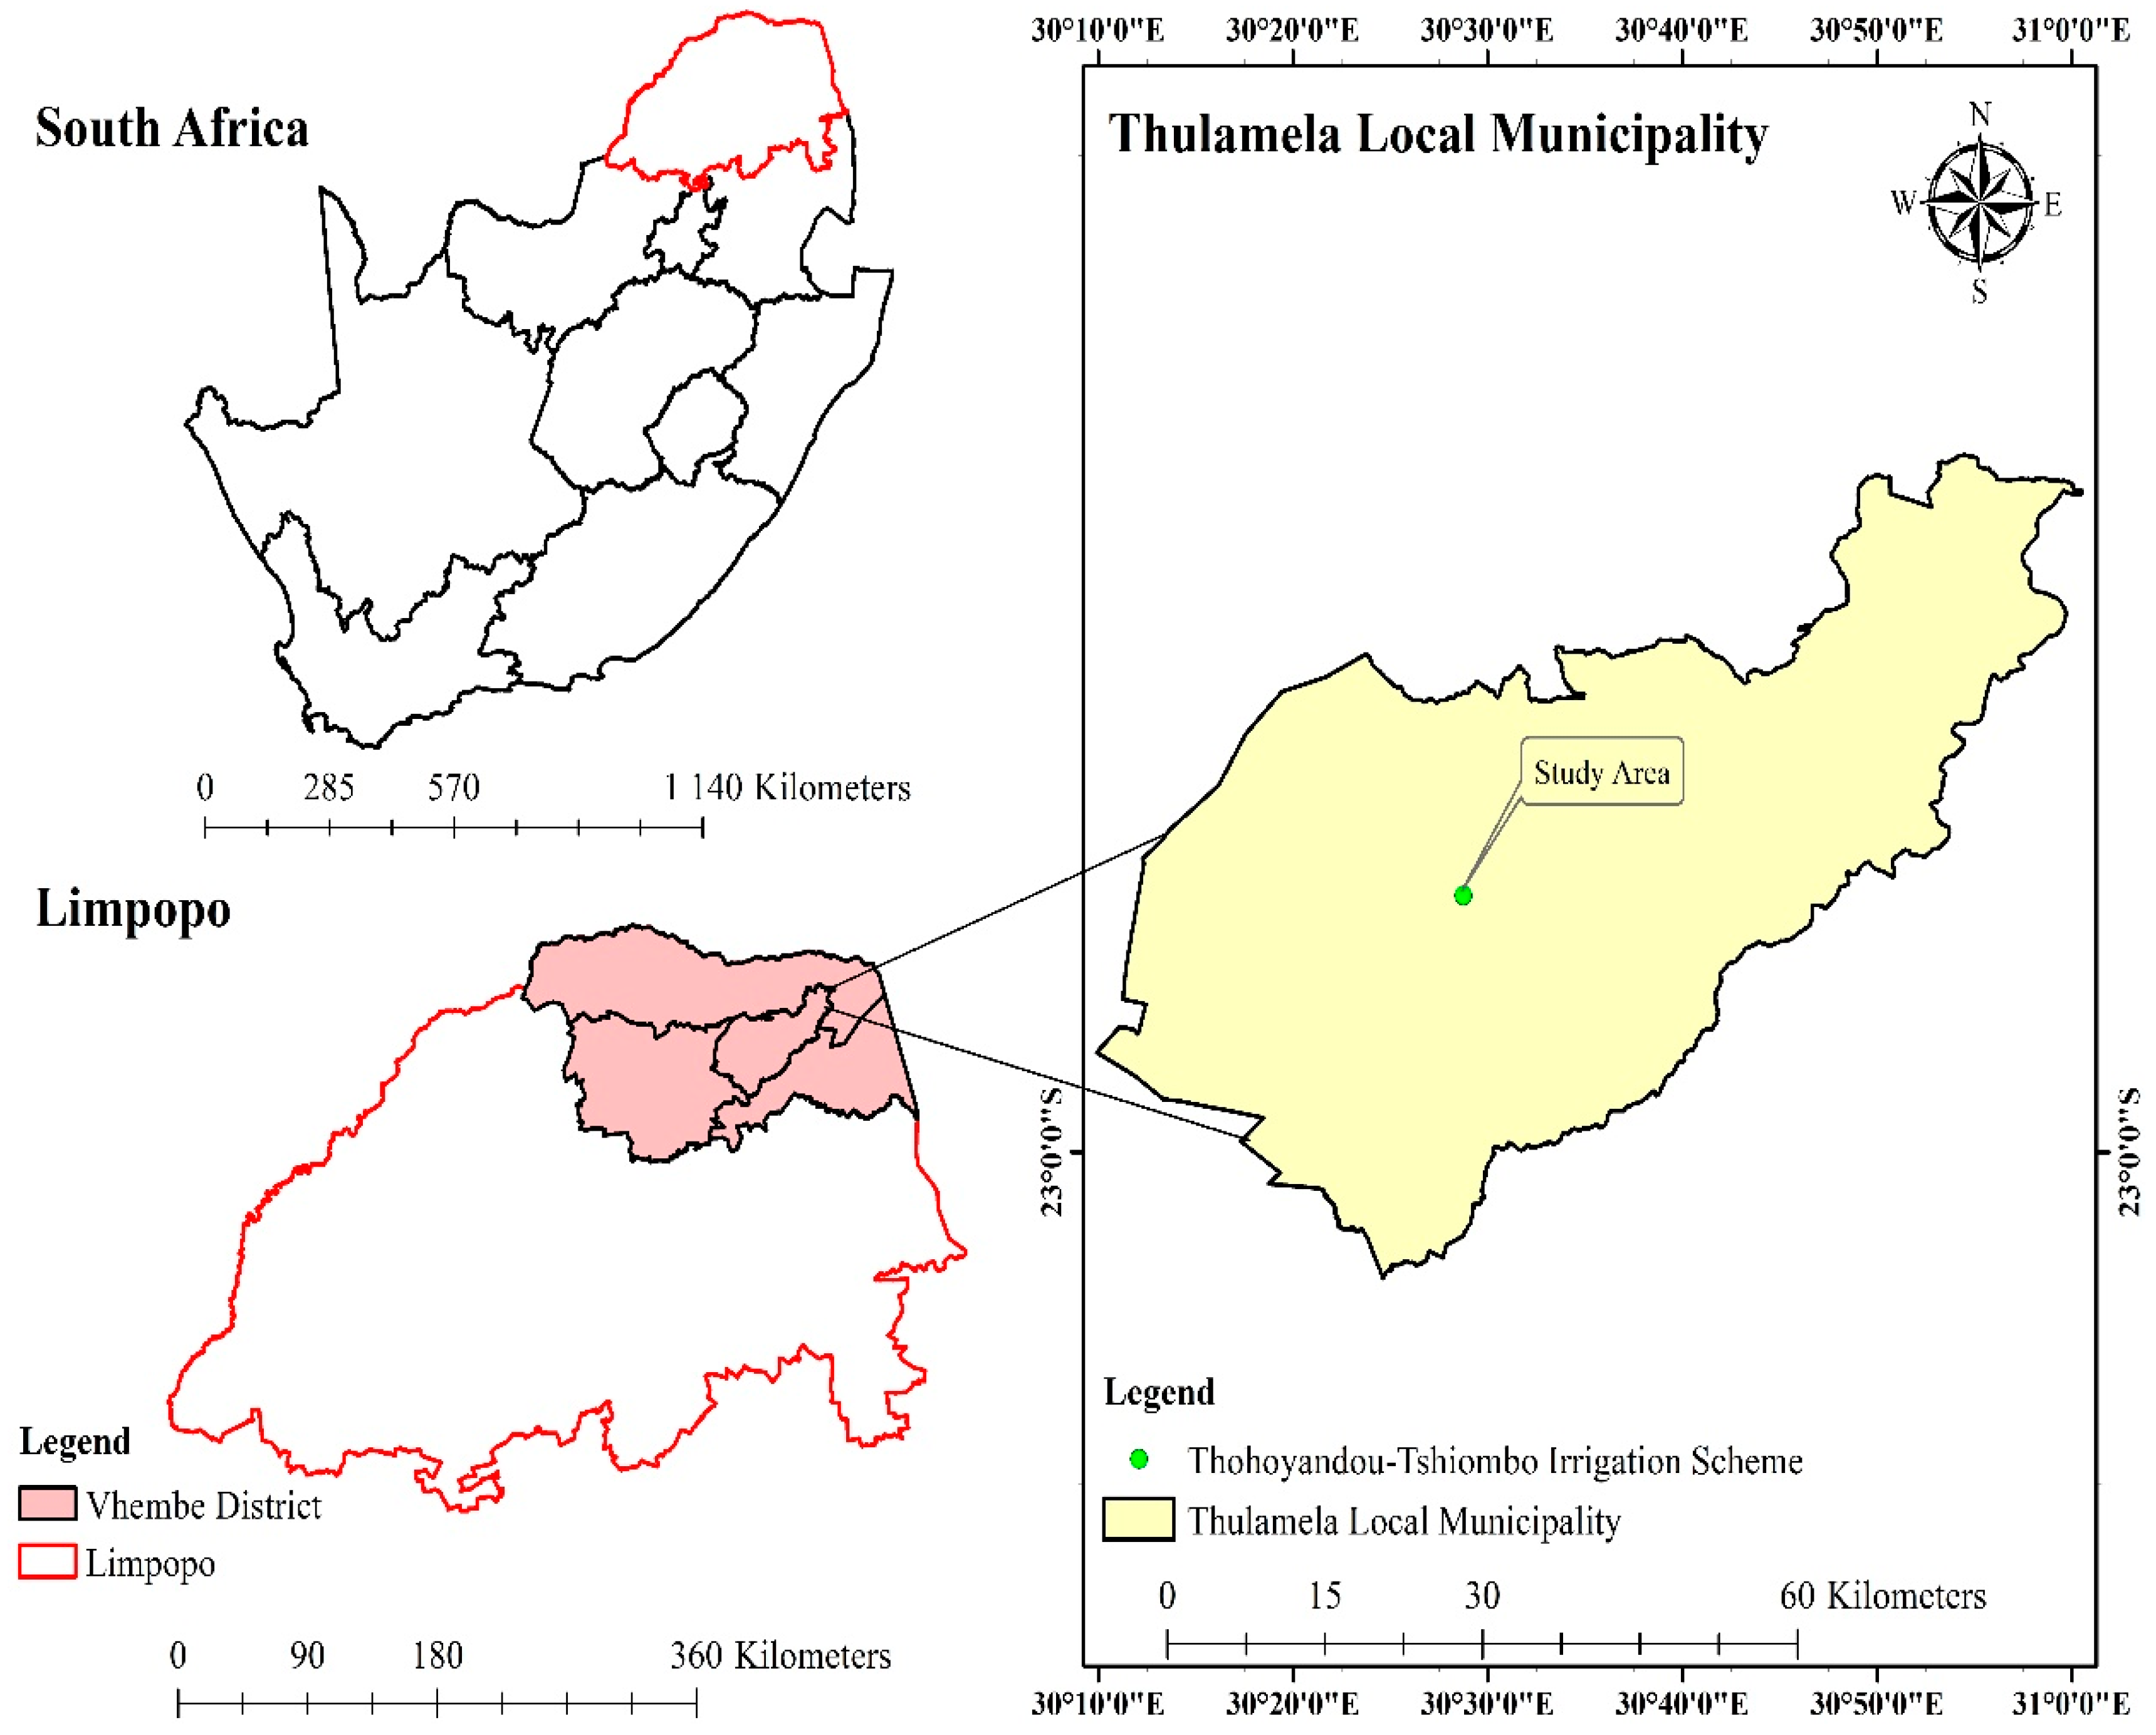
3.1. Description of the Study Area

We carried out the study in the Tshiombo Irrigation Scheme located 40 km north of Thohoyandou Service Centre, Vhembe District in Limpopo Province of South Africa (Figure 1). The scheme is 1195 hectares with 930 plots and each farmer owns an average of 1.286 hectares. Project beneficiaries of the Tshiombo Irrigation Scheme are from seven villages [32]. The average rainfall is ±500 mm/annual, with most of it falling during summer (October to March) [33]. The irrigation scheme offers the local community an opportunity to increase income and participate in the local economy. Irrigation development benefits the rural poor in various ways including (a) reduced food prices resulting from increased production and (b) increased on-farm and off-farm employment, leading to income generation for the poor [34]. About 50% of the farmers also sell crops in the formal markets with maize, cabbages, potatoes, tomatoes, onions, beans, spinach, and butternut being the most commonly produced in the irrigation scheme [35].

3.2. Sampling Size and Sample Technique

To obtain a representative sample, the study used the sample size determination formula given by [36]:
n = N 1 + ( e 2 )
where n is the sample size, N is the population size, and e is the level of precision of 0.005. A total of 114 land-leasing farmworkers were selected from a population of 160, while a total of 77 nonland-leasing farmworkers were selected from a population of 95.
A probability sampling method involving a simple random technique was used to select a total of 191 farmworkers with the aid of information obtained from the extension farmworker. Both males and females had an equal chance of being selected for the study.

3.3. Method of Data Collection

A pre-tested questionnaire was used as a primary data collection tool. The questionnaire was administered by well-trained enumerators. The data were collected on the characteristics of the irrigation farmworkers, food access or availability, and the availability of resources.

3.4. Method of Analysis

Data were captured and analyzed using Statistical Package for Social Scientists (SPSS) and STATA. Before the analysis of the variables, the Shapiro–Wilk test was applied to test the normality of the explanatory variables using SPSS. From the test conducted, if the p-value of the Shapiro–Wilk test was greater than 0.05, the data were considered normal. A one-way Analysis of Variance (ANOVA) parametric test was used to analyze the descriptive statistics for continuous variables. The p-values were generated by SPSS for a one-way Analysis of Variance (ANOVA) parametric test. The ANOVA parametric test was validated by the following assumptions: the variables were checked for normality and it was satisfied, the variance in the samples was approximately equal, and the data were randomly and independently sampled from the population. The chi-square test was used to analyze the descriptive statistics of categorical variables through SPSS. The SPSS generated the p-values throughout the study. The significant levels for the coefficients in the study were categorized into three levels: 1%, 5%, and 10%. STATA was used for econometrics modeling.

3.5. Household Food Insecurity Access Scale (HFIAS)

To determine food insecurity among irrigation farmworkers, a Household Food Insecurity Access Scale (HFIAS) of nine questions was used, as detailed in the HFIAS Indicator Guide v3 (Appendix A) [18]. The HFIAS represented a generally increasing level of severity of food insecurity and how often the condition occurred [18]. If the response to the condition described in the corresponding occurrence question was yes, the farmworker household-head was asked to describe how often a condition had occurred in the past 30 days. The four categories of food security status comprise the following as detailed in the HFIAS Indicator Guide v3 [18]:
  • A food-secure household experiences none of the food insecurity (access) conditions or just experiences worry, but rarely. HFIA category = 1 if ((Q1a = 0 or Q1a = 1) and Q2 = 0 and Q3 = 0 and Q4 = 0 and Q5 = 0 and Q6 = 0 and Q7 = 0 and Q8 = 0 and Q9 = 0).
  • A mildly food-insecure household sometimes or often worries about not having enough food and is unable to eat preferred foods, or eats a more monotonous diet than desired, or, however rarely, eats some foods considered undesirable. HFIA category = 2 if ((Q1a = 2 or Q1a = 3 or Q2a = 1 or Q2a = 2 or Q2a = 3 or Q3a = 1 or Q4a = 1) and Q5 = 0 and Q6 = 0 and Q7 = 0 and Q8 = 0 and Q9 = 0).
  • A moderately food-insecure household sacrifices quality more frequently, by eating a monotonous diet, or, sometimes or often, undesirable foods. They sometimes, however rarely, start cutting back on quantity by reducing the size or number of meals, although they do not experience any of the three main severe conditions. HFIA category = 3 if ((Q3a = 2 or Q3a = 3 or Q4a = 2 or Q4a = 3 or Q5a = 1 or Q5a = 2 or Q6a = 1 or Q6a = 2) and Q7 = 0 and Q8 = 0 and Q9 = 0).
  • A severely food-insecure household goes further to cut down on meal size or the number of meals, and/or experiences any of the three most severe conditions (running out of food, going to bed hungry, or going the whole day and night without eating). HFIA category = 4 if (Q5a = 3 or Q6a = 3 or Q7a = 1 or Q7a = 2 or Q7a = 3 or Q8a = 1 or Q8a = 2 or Q8a = 3 or Q9a = 1 or Q9a = 2 or Q9a = 3) [18].

3.6. Estimating Determinants of Farmworkers’ Food Insecurity: Ordered Probit Model

The Ordered Probit is suitable for modeling with an ordered categorical dependent variable and determines factors that influence farmworkers’ food security status. The dependent variable in this study was farmworkers’ food security, grouped into four ordered categories. The four categories were formulated such that a household can fall into any one of the four categories during a survey depending on the household’s socioeconomic condition. The categories were Q1 (food-secure), Q2 (mildly food-insecure), Q3 (moderately food-insecure), and Q4 (severely food-insecure).
The respective category for food security is unobserved and is denoted by the latent variable Q i *. The latent equation below models how Q i * varies with personal characteristics.
Q i * = X i  
where Q i * measures the difference in the value derived by individual i from either food-secure, mildly food-secure, moderately food-insecure, or severely food-insecure. i = 1, 2, 3 … n; n represents the number of respondents. Each individual i belongs to one of the four groups. X is a vector of exogenous variables.
Following [37], and taking the value of 4 if the household was severely food-insecure and 1 if a household was food-secure, the implied probabilities are as follows:
Pr {Qi = 1∣Xi} = Φ (−Xiβ),
Pr {Qi = 2∣Xi} = Φ (μ2Xiβ) − Φ (μ − Xiβ),
Pr {Qi = 3∣Xi} = Φ (μ3Xiβ) − Φ (μ2Xiβ),
Pr {Qi = 4∣Xi} = 1 − Φ (μ3Xiβ).
where μi is the unknown parameter that is estimated jointly with β. Estimation is based upon the maximum likelihood, where the above probabilities enter the likelihood function. The interpretation of the β coefficients is in terms of the underlying latent variable model in the equation.
The probability of households being found between 1 and 4 can be written as:
Pr (Qi = 1) = Φ (Xiβ1)
where Φ (·) is the cumulative distribution function (cdf) of the standard normal.

3.7. Definitions of Variables

The ordered probit model was used to determine farmworkers’ characteristics that predict their food security status. The farmworker food security determinants were obtained through a review of the literature. A description of the explanatory variables used in the ordered probit model and the expected signs of the potential explanatory variables are provided in Table 1. The “+” means the variable is expected to have a positive effect on the dependent variable “−“means the variable is expected to have a negative effect on the dependent variable.
The coefficients of the ordered probit model did not represent the magnitude of the effects of the explanatory variables. A positive value indicates an increase in the food insecurity prevalence, which implies an increase in the likelihood that a household would be food-insecure. In contrast, a negative coefficient implies a likelihood that a household would be more food-secure.
The age of the household head is a continuous variable measured in years. Age is expected to influence farmworkers’ food insecurity negatively. The more experienced the household head is, as expressed in the age of the head of household, the fewer chances for a household to be food-insecure [38].
The gender of the household head is a dummy variable that takes the value of 1 if the respondent is male and 0 if the respondent is female. Females have a high dependency and are likely to have fewer chances of participating in other income-generating activities [39]. A negative effect on food insecurity is expected.
Female household heads have fewer years of education and resources than male household heads. A negative effect on food insecurity is expected [40].
The marital status of the household head is a dummy variable that takes the value 1 if the household head is married and 0 if otherwise. Married household heads may have a larger household size and are liable to feed more mouths in the household. A positive effect is expected in the study [41].
The level of education is a dummy variable that takes the value of 1 if the household head has acquired formal education and 0 if otherwise. A negative effect is expected between the level of education and household food security. Food insecurity decreases with higher levels of education achieved by a household head. Education positively influences the household head’s production and nutritional decisions [40].
The number of dependents is a continuous variable. A positive effect is expected as a household head with a small household is likely to be food-secure and feed fewer mouths compared to a large household [40].
Land leasing is a dummy variable that takes the value of 1 if the household head leases land from an employer and 0 if otherwise. Irrigation farmworkers’ households who lease irrigation scheme plots from their employers are expected to be more food-secure than those who do not lease. Leasing land is often used to generate quick cash in response to emergency needs [42]. Therefore, a negative effect is expected in the study.
Food storage is a dummy variable that takes 1 if the household head stores food for emergencies to alleviate future malnutrition shocks, drought, or high food prices. A negative effect is expected between food storage and household head food security. Land size is a continuous variable. In this study, farm size is expected to affect household head food insecurity negatively. More food storage can alleviate any future shocks such as droughts and high food prices [37].
Total monthly income is a continuous variable measured in Rand (R). According to income determines the quantity and quality of food that a household can access, taking into account the size of the household. High incomes can increase household purchasing power and food security. Conversely, low incomes can adversely affect food security because households cannot buy food [39]. A positive effect was expected in the study.
Total monthly household expenditure is a continuous variable measured in Rand (R). Households with a higher proportion of their total income spent on food are more vulnerable to the dynamics of food prices than households with a lower proportion of food [43]. A negative effect was expected in the study.

4. Result

4.1. Descriptive Statistics

The explanatory variables were checked for normality and were deemed normal. The sample of 191 irrigation farmworkers was dominated by female farmworkers (62.8%). Middle-age irrigation farmworkers dominated in the Tshiombo Irrigation Scheme with an average of 46 years for both males and females. Most of the respondents surveyed resided in households with more than five members. About 55.5% of the respondents had acquired formal education and 44.5% had no formal schooling. While 51% of the irrigation farmworker households were food-secure, 7.3% were mildly food-insecure, 19.9% were moderately food-insecure, and 20.9% were severely food-insecure.
Table 2 presents the parametric one-way Analysis of Variance (ANOVA) test results of continuous variables. The land size was statistically significantly different between food-secure, mildly food-insecure, moderately food-insecure, and severely food-insecure. The ANOVA test indicated that recipients of land who were food-secure received 1.94 plots, those who were mildly food-insecure received 2 plots, those who were moderately food-insecure received 1.34 plots, and those who were severely food-insecure received 4 plots. There was a statistically significant difference in the total household monthly expenditure between food-secure, mildly food-insecure, moderately food-insecure, and severely food-insecure. Table 2 shows that every month, a food-secure irrigation farmworker spent R2222, a mildly food-insecure farmworker spent R1894 a month, a moderately food-insecure irrigation scheme worker spent R2306, and a severely food-insecure irrigation scheme farmer spent R2613.
Table 3 presents the chi-square test results of categorical variables. A statistically significant relationship exists between irrigation farmworker food security status and leasing of land from the employer (p < 0.01). These results were in line with our hypothesis. Table 3 shows that 64.5% of the irrigation farmworkers who leased land from employers were food-secure, 22% were mildly food-insecure, 7.8% were moderately food-insecure, and 5.3% were severely food-insecure. In the category of irrigation farmworkers who could not lease land from employers, 32.5% were food-secure, 7% were mildly food-insecure, 22.8% were moderately food-insecure, and 37.7% were severely food-insecure.
A statistically significant relationship was found between irrigation farmworkers’ food security status and food storage (p < 0.01). The results indicated that 89.7% of irrigation farmworkers who stored food were food-secure, 7.5% were mildly food-insecure, 1.9% were moderately food-insecure, and 0.9% were severely food-insecure. In the comparison of irrigation farmworkers who did not store their food, 4.6% were food-secure, 7.1% were mildly food-insecure, 42.4% were moderately food-insecure, and 45.9% were severely food-insecure.

4.2. Determinants That Influence Irrigation Scheme Farmworkers’ Food Security Status

The ordered probit model was used to determine household characteristics that influence irrigation farmworker households’ food security status (Table 4). The results indicate that all estimated coefficients are statistically significant as the LR X2 statistic is statistically significant (p < 0.01). The coefficients of the ordered probit model do not represent the magnitude of the effects of the explanatory variables. Instead, the marginal effects are discussed. It follows that a positive coefficient implies an increase in the likelihood that a household would be food-insecure. In contrast, a negative coefficient implies a likelihood that a household would be food-secure. The results indicate that irrigation farmworkers’ characteristics such as land leasing, food storage, land size, and total household expenditure are statistically significant determinants of food security.

5. Discussion

The study hypothesis was that irrigation scheme farmworkers who rent land from landlords are more food-secure than nonland-renting irrigation scheme farmworkers. In agreement with the results in Table 3, the results show that there is a statistically significant and positive relationship between leasing land and food security among irrigation farmworkers. Similarly, the results in Table 4 also show that leasing land is statistically significant and, as expected, has a negative influence on farmworkers’ food insecurity status. This implies that when an irrigation farmworker can lease land from their employer, they have lower chances of becoming food-insecure. The results indicate that if a household head leases land from an employer, the household will have a 26.6% chance of becoming food-secure and about a 1.8% worse probability of becoming mildly food-secure. Similarly, suppose an irrigation farmworker has no access to leasing land, then the household has a 19.9% chance of moving into the moderately food-insecure and another 4.8% chance of dropping into the severely food-insecure category. The results build on the existing evidence by [44] that land rental markets play an important role in enhancing income in the short run and can effectively eradicate poverty and food insecurity in rural households as a safety net from food insecurity shocks. The land is the most productive asset for rural residents in developing countries to curb food insecurity and unemployment [45]. African countries such as Malawi, Zambia, Kenya, and Ethiopia are involved in land rental markets [46], but the land market contract arrangements vary considerably across countries. The majority of the land African smallholder farmers use is under a customary system, making the sale of land prohibited. Land rental markets are a significant way of re-adjusting land-labor ratios among farming households [42]. Leasing land is often used to generate cash in response to emergency needs. Poor households cannot afford to rent land, and having an unstable income makes it difficult to have the financial security needed to rent land [47]. The Government of Ethiopia allows land leasing and informal transfers of irrigable land, but not land sales, to avoid the issues of land redistribution.
Table 3 shows that land size is statistically significant and has a relationship with farmworkers’ food security status. However, contrary to expectations, the ordered probit model in Table 4 shows that land size is statistically significant and positively influences farmworkers’ food insecurity. This suggests that when land size increases, food insecurity also increases among farmworkers. The results indicate that a one-hectare increase in the land household has resulted in a 0.2% increase in the chance of becoming food-insecure from food-secure and about a 0.6% increase in the chance of becoming mildly food-insecure. Similarly, a hectare in area access increases the chances of a household moving from mildly food-insecure to moderately food-insecure by 4.2%, and a 0.8% chance of falling under the severely food-insecure category. However, our results do not support the existing evidence by Nkomoki, et al. [48,49]. A possible explanation is that household heads might have resource constraints for investing in their land. Nkomoki, Bavorová and Banout [48] studied the influence of land size on household food consumption score (FCS) and household hunger score (HHS) in Zambia. Their findings showed that land size is associated with households being less likely to be in the poor FCS. Furthermore, our finding is not in agreement with [49], who used a model similar to ours to estimate if the land size was a determinant of household food and nutrition security in Myanmar. Their result indicated that an increase in land size enhanced household food security status. Similarly, our result is not aligned with that of [50], who analyzed the relationship between land access and food security in Kenya. They demonstrated that an increase in land size resulted in a rise in household food security.
In agreement with the results in Table 3, the results show that there is a statistically significant and positive relationship between total monthly farmworker household expenditure and food security among irrigation farmworkers. Similarly, the results in Table 4 also show that the total monthly farmworker household expenditure is statistically significant and is positively related to household food insecurity. This implies that a one-Rand increase in monthly expenditure on basic household needs has a 0.9% chance of remaining food-secure. The same households have a 0.68% chance of moving into moderately food-insecure and 0.13% probability of falling into severely food-insecure categories if there is a Rand short in their total monthly expenditure. A possible explanation would be that there is no direct relationship between monthly income and monthly expenses. Irrigation farmworkers could be vulnerable to food insecurity due to monthly expenditures exceeding their monthly income. The findings are consistent with the findings of [51].
In agreement with Table 3, the descriptive statistic results show that the variable food stored is statistically significant and has a relationship with farmworkers’ food security status. Similarly, Table 4 shows that the food stored by irrigation farmworkers is statistically significant and negatively related to food insecurity. This suggests that the probability of a household being food-secure increases as the household head stores food for long-run purposes, such as future shocks due to loss of employment for farmworkers during off-seasons. The results indicate that if a household head stored food, the household will have an 85.4% chance of becoming food-secure and about a 0.5% worse chance of becoming mildly food-secure. In a similar year, if a household head does not store food for future shocks, the household has a 46% chance of moving into moderately food-insecure and a 38.8% chance of falling under the severely food-insecure category. A study by [52] pointed out that despite the abundant food supply in South Africa, food storage is needed as it plays a significant role in ensuring food availability at a household level.

6. Conclusions

The main aim of the study was to determine the food security status among farmworkers. Food security was measured by a Household Food Insecurity Access Scale. From the study sample, the ordered probit model revealed that the total household monthly expenditure and land size lower the probability of a household being food-insecure. On the other hand, leasing land and food storage increase the probability of a household being food-secure. Based on the study’s findings, the total household expenditure lowered the probability of farmworkers being food-secure. The study recommends that stakeholders should encourage farmworkers to engage in nonfarm activities to reduce food insecurity. Regarding the study’s hypothesis, the results showed that irrigation farmworkers who leased land had a better chance of becoming food-secure and had a worse chance of becoming mildly food-insecure, moderately food-insecure, and severely food-insecure than those who do not lease land. Based on the findings, the study recommends an involvement of private and public stakeholders to provide training that will promote livelihood skill development and the provision of resources to lessen the chances of recipients falling into the severe food insecurity category.
Encouraging farmworkers on irrigation schemes to rent land from their employers will reduce household food insecurity. These findings suggest that policymakers should design policies that enhance irrigation farmworkers’ food security through engagement in informal land lease contracts to enable land rental market participation by farm employers and farm workers in rural areas such as Tshiombo Village.
Food security is a complex subject whose accomplishment can be measured in various ways such as HDD, CSI, and HFIAS. This study only used the HFIAS tool for measuring food security among irrigation scheme farmworkers in Tshiombo. Therefore, the study’s findings should not be generalized to all irrigation schemes, as circumstances may be different. The study should be supplemented with studies that use other tools for measuring food security so that a more comprehensive conclusion can be drawn. It is vital to note that ongoing research on the issue of food security status among farmworkers in irrigation schemes is needed. To fully understand the complex dynamics of this issue and to acquire more information on the diverse conditions regarding food and nutrition insecurity among farmworkers laboring in smallholder farms, this would include:
  • An examination of income inequality among farmworkers could provide further insight into the welfare of rural farmworker households. Income inequality was not examined in this study.
  • A comparative investigation of a seasonal hunger analysis among farmworkers in rural households needs to be investigated through monthly to yearly monitoring indicators, which measure different aspects of food insecurity and determine to what extent food security fluctuates.

Author Contributions

Conceptualization, R.M, P.M and M.M.; methodology, R.M. and M.M.; software, R.M.; validation, P.M. and M.M.; formal analysis, R.M.; investigation, R.M.; resources, P.M.; data curation, R.M.; writing—original draft preparation, R.M.; writing—review and editing, R.M. and P.M.; visualization, R.M.; supervision, P.M. and M.M.; project administration, P.M.; funding acquisition, P.M. All authors have read and agreed to the published version of the manuscript.

Funding

This research was funded by South Africa’s National Research Foundation (NRF) grant number (86893) for study and collection.

Institutional Review Board Statement

The study was conducted in accordance with the Declaration of Helsinki, and approved by the Humanities and Social Sciences Research Ethics Committee (HSSREC) of UNIVERSITY OF KWAZULU NATAL (protocol reference number: HSS/0415/019M 19 July 2019).

Informed Consent Statement

Informed consent was obtained from all subjects involved in the study.

Acknowledgments

The authors acknowledge NRF for funding this study. Extension workers and farmers in Tshiombo Irrigation Scheme are honored for their contributions to the success of this study.

Conflicts of Interest

The authors declare no conflict of interest. The funders had no role in the design of the study; in the collection, analyses, or interpretation of data; in the writing of the manuscript, or in the decision to publish the results.

Appendix A

Household Food Insecurity Access scale
In the past four weeks …
  • Did you worry that your household would not have enough food?
  • Were you or any household member not able to eat the kinds of foods you preferred because of a lack of resources?
  • Did you or any household member have to eat a limited variety of foods due to a lack of resources?
  • Did you or any household member have to eat some foods that you did not want to eat because of a lack of resources to obtain other types of food?
  • Did you or any household member have to eat a smaller meal than you felt you needed because there was not enough food?
  • Did you or any household member have to eat fewer meals in a day because there was not enough food?
  • Was there ever no food to eat of any kind in your household because of a lack of resources to get food?
  • Did you or any household member go to sleep at night hungry because there was not enough food?
  • Did you or any household member go a whole day and night without eating anything because there was not enough food?
Respondents indicate whether the response is Yes, or No. If the response is “Yes”, then they are asked to indicate the extent to which they agree with the statement. The responses of frequency are coded 0, 1, and 2, where (0) Rarely (once or twice in the past four weeks), (1) Sometimes (three to ten times in the past four weeks), and (2) Often (more than ten times in the past four weeks) [18].

References

  1. FAO. The Future of Food and Agriculture–Trends and Challenges; Annual Report; FAO: Roma, Italy, 2017; Volume 296, pp. 1–180. [Google Scholar]
  2. Jones, A.D.; Ngure, F.M.; Pelto, G.; Young, S.L. What are we assessing when we measure food security? A compendium and review of current metrics. Adv. Nutr. 2013, 4, 481–505. [Google Scholar] [CrossRef] [PubMed] [Green Version]
  3. Sinyolo, S.; Mudhara, M. The impact of entrepreneurial competencies on household food security among smallholder farmers in KwaZulu Natal, South Africa. Ecol. Food Nutr. 2018, 57, 71–93. [Google Scholar] [CrossRef] [PubMed]
  4. Hwalla, N.; El Labban, S.; Bahn, R.A. Nutrition security is an integral component of food security. Front. Life Sci. 2016, 9, 167–172. [Google Scholar] [CrossRef] [Green Version]
  5. Headey, D.D.; Ecker, O. Improving the Measurement of Food Security; IFPRI: Washington, DC, USA, 2012. [Google Scholar]
  6. Magombeyi, M.; Taigbenu, A.; Barron, J. Rural food insecurity and poverty mappings and their linkage with water resources in the Limpopo River Basin. Phys. Chem. Earth Parts A/B/C 2016, 92, 20–33. [Google Scholar] [CrossRef]
  7. Vorster, H.H.; Venter, C.S.; Wissing, M.P.; Margetts, B.M. The nutrition and health transition in the North West Province of South Africa: A review of the THUSA (Transition and Health during Urbanisation of South Africans) study. Public Health Nutr. 2005, 8, 480–490. [Google Scholar] [CrossRef] [PubMed] [Green Version]
  8. McLaren, D.; Moyo, B.; Jeffery, J. The Right to Food in SOUTH Africa: An Analysis of the Content, Policy Effort, Resource Allocation and Enjoyment of the Constitutional Right to Food; Studies in Poverty and Inequality Institute (SPII): Johannesburg, South Africa, 2015. [Google Scholar]
  9. Altman, M.; Hart, T.G.; Jacobs, P.T. Household food security status in South Africa. Agrekon 2009, 48, 345–361. [Google Scholar] [CrossRef]
  10. De Cock, N.; D’Haese, M.; Vink, N.; Van Rooyen, C.J.; Staelens, L.; Schönfeldt, H.C.; D’Haese, L. Food security in rural areas of Limpopo province, South Africa. Food Secur. 2013, 5, 269–282. [Google Scholar] [CrossRef] [Green Version]
  11. Chikazunga, D.; Paradza, G. Smallholder Farming: A Panacea for Employment Creation and Enterprise Development in South Africa? Lessons from the Pro-Poor Value Chain Governance Project in Limpopo Province; Working Paper; PLAAS: Cape Town, South Africa, 2013. [Google Scholar]
  12. Teka, T.Y.; Rusare, M.; Mistry, R. Hidden Hunger in South Africa: The Faces of Hunger and Malnutrition in a Food-Secure Nation; Oxfam international: Eastern Cape, South Africa, 2014. [Google Scholar]
  13. Devereux, S.; Tavener-Smith, L. Seasonal food insecurity among farm workers in the northern cape, South Africa. Nutrients 2019, 11, 1535. [Google Scholar] [CrossRef] [Green Version]
  14. Wilderman, J. From Flexible Work to Mass Uprising; Statistics South Africa: Pretoria, South Africa, 2015.
  15. Scoones, I.; Mavedzenge, B.; Murimbarimba, F.; Sukume, C. Labour after land reform: The precarious livelihoods of former farmworkers in Zimbabwe. Dev. Chang. 2019, 50, 805–835. [Google Scholar] [CrossRef] [Green Version]
  16. Moda, H.M.; Nwadike, C.; Danjin, M.; Fatoye, F.; Mbada, C.E.; Smail, L.; Doka, P.J. Quality of work life (QoWL) and perceived workplace commitment among seasonal farmers in Nigeria. Agriculture 2021, 11, 103. [Google Scholar] [CrossRef]
  17. Devereux, S. Violations of farm workers’ labour rights in post-apartheid South Africa. Dev. S. Afr. 2020, 37, 382–404. [Google Scholar] [CrossRef]
  18. Coates, J.; Swindale, A.; Bilinsky, P. Household Food Insecurity Access Scale (HFIAS) for Measurement of Food Access: Indicator Guide (V. 3); Food and Nutrition Technical Assistance Project, Academy for Educational Development: Washington, DC, USA, 2007. [Google Scholar]
  19. Maxwell, D.; Coates, J.; Vaitla, B. How Do Different Indicators of Household Food Security Compare? Empirical Evidence from Tigray; Tufts University: Medford, Oregon, 2013; Volume 26. [Google Scholar]
  20. Swindale, A.; Bilinsky, P. Development of a universally applicable household food insecurity measurement tool: Process, current status, and outstanding issues. J. Nutr. 2006, 136, 1449S–1452S. [Google Scholar] [CrossRef] [PubMed]
  21. Kennedy, G.; Ballard, T.; Dop, M.C. Guidelines for Measuring Household and Individual Dietary Diversity; Food and Agriculture Organization of the United Nations: Roma, Italy, 2011. [Google Scholar]
  22. Chakona, G.; Shackleton, C.M. Food insecurity in South Africa: To what extent can social grants and consumption of wild foods eradicate hunger? World Dev. Perspect. 2019, 13, 87–94. [Google Scholar] [CrossRef]
  23. Dymond, J. Ecosystem services in New Zealand: Conditions and Trends; Manaaki Whenua Press: Lincoln, New Zealand, 2013. [Google Scholar]
  24. Bvenura, C.; Afolayan, A.J. The role of wild vegetables in household food security in South Africa: A review. Food Res. Int. 2015, 76, 1001–1011. [Google Scholar] [CrossRef]
  25. Drysdale, R.E.; Moshabela, M.; Bob, U. Adapting the Coping Strategies Index to measure food insecurity in the rural district of iLembe, South Africa. Food Cult. Soc. 2019, 22, 95–110. [Google Scholar] [CrossRef]
  26. Ndobo, A. Discourse and attitudes on occupational aspirations and the issue of gender equality: What are the effects of perceived gender asymmetry and prescribed gender role? Eur. Rev. Appl. Psychol. 2013, 63, 231–241. [Google Scholar] [CrossRef]
  27. Chagomoka, T.; Unger, S.; Drescher, A.; Glaser, R.; Marschner, B.; Schlesinger, J. Food coping strategies in northern Ghana. A socio-spatial analysis along the urban–rural continuum. Agric. Food Secur. 2016, 5, 4. [Google Scholar] [CrossRef] [Green Version]
  28. Oldewage-Theron, W.H.; Dicks, E.G.; Napier, C.E. Poverty, household food insecurity and nutrition: Coping strategies in an informal settlement in the Vaal Triangle, South Africa. Public Health 2006, 120, 795–804. [Google Scholar] [CrossRef]
  29. Carletto, C.; Zezza, A.; Banerjee, R. Towards better measurement of household food security: Harmonizing indicators and the role of household surveys. Glob. Food Secur. 2013, 2, 30–40. [Google Scholar] [CrossRef]
  30. Musemwa, L.; Muchenje, V.; Mushunje, A.; Aghdasi, F.; Zhou, L. Household food insecurity in the poorest province of South Africa: Level, causes and coping strategies. Food Secur. 2015, 7, 647–655. [Google Scholar] [CrossRef]
  31. Kabalo, B.Y.; Gebreyesus, S.H.; Loha, E.; Lindtjørn, B. Performance of an adapted household food insecurity access scale in measuring seasonality in household food insecurity in rural Ethiopia: A cohort analysis. BMC Nutr. 2019, 5, 54. [Google Scholar] [CrossRef] [PubMed]
  32. Van Averbeke, W.; Denison, J.; Mnkeni, P. Smallholder irrigation schemes in South Africa: A review of knowledge generated by the Water Research Commission. Water SA 2011, 37, 797–808. [Google Scholar] [CrossRef] [Green Version]
  33. Cai, X.; Magidi, J.; Nhamo, L.; van Koppen, B. Mapping Irrigated Areas in the Limpopo Province, South Africa; International Water Management Institute (IWMI): Colombo, Sri Lanka, 2017; Volume 172. [Google Scholar]
  34. Machethe, C.; Mollel, N.; Ayisi, K.; Mashatola, M.; Anim, F.; Vanasche, F. Smallholder Irrigation and Agricultural Development in the Olifants River Basin of Limpopo Province: Management Transfer, Productivity, Profitability AND Food Security Issues; Report to the Water Research Commission on the Project “Sustainable Local Management of Smallholder Irrigation in the Olifants River Basin of Limpopo Province,”; Water Research Commission: Pretoria, South Africa, 2004. [Google Scholar]
  35. Louw, D.; Flandorp, C. Horticultural Development Plan for the Thulamela Local Municipality: Agricultural Overview; OABS Development (Pty) Ltd.: Paarl, South Africa, 2017. [Google Scholar]
  36. Morse, J.; Niehaus, L. Mixed Method Design; Left Coast Press: Walnut Creek, CA, USA, 2009. [Google Scholar]
  37. Muzah, O. An Assessment of Household Food Security in Urban and Peri-Urban Areas: A Case Study of Bindura Municipal Area, Mashonaland Central, Zimbabwe; ResearchSpace: Edinburgh, Scotland, 2015. [Google Scholar]
  38. Agidew, A.-M.A.; Singh, K. Determinants of food insecurity in the rural farm households in South Wollo Zone of Ethiopia: The case of the Teleyayen sub-watershed. Agric. Food Econ. 2018, 6, 10. [Google Scholar] [CrossRef]
  39. Cele, T.; Mudhara, M. Impact of Market Participation on Household Food Security among Smallholder Irrigators in KwaZulu-Natal, South Africa. Agriculture 2022, 12, 261. [Google Scholar] [CrossRef]
  40. Maziya, M.; Mudhara, M.; Chitja, J. What factors determine household food security among smallholder farmers? Insights from Msinga, KwaZulu-Natal, South Africa. Agrekon 2017, 56, 40–52. [Google Scholar] [CrossRef]
  41. Asefach, A.; Nigatu, R. Correlates of household food security in densely populated areas of southern Ethiopia: Does the household structure matter? Stud. Home Community Sci. 2007, 1, 85–91. [Google Scholar] [CrossRef] [Green Version]
  42. Ricker-Gilbert, J.; Chamberlin, J. Transaction costs, land rental markets, and their impact on youth access to agriculture in Tanzania. Land Econ. 2018, 94, 541–555. [Google Scholar] [CrossRef]
  43. Oduntan, O.; Akinro, A.O. Determinants of Households’ Food Security in Akure South Local Government Area of Ondo State, Nigeria. J. Econ. Sustain. Dev. 2021, 12, 22. [Google Scholar]
  44. Garedow, B.T.; Edriss, A.-K. The Dynamics of Land Market and Food Security in Malawi. Int. J. Sustain. Dev. World Policy 2014, 3, 115–131. [Google Scholar]
  45. Chang, T.; Takahashi, D. Willingness to Pay and Willingness to Accept for Farmland Leasing and Custom Farming in Taiwan. In Proceedings of the 2018 Conference, Vancouver, BC, Canada, 28 July–2 August 2018. [Google Scholar]
  46. Chamberlin, J.; Ricker-Gilbert, J. Participation in rural land rental markets in Sub-Saharan Africa: Who benefits and by how much? Evidence from Malawi and Zambia. Am. J. Agric. Econ. 2016, 98, 1507–1528. [Google Scholar] [CrossRef] [Green Version]
  47. Gottlieb, C.; Grobovšek, J. Communal land and agricultural productivity. J. Dev. Econ. 2019, 138, 135–152. [Google Scholar] [CrossRef] [Green Version]
  48. Jin, S.; Jayne, T.S. Impacts of Land Rental Markets on Rural Poverty in Kenya Annual Meeting; Agricultural and Applied Economics Association: Pittsburgh, PA, USA; 24–26 July 2011.
  49. Nkomoki, W.; Bavorová, M.; Banout, J. Factors associated with household food security in Zambia. Sustainability 2019, 11, 2715. [Google Scholar] [CrossRef] [Green Version]
  50. Rammohan, A.; Pritchard, B. The role of landholding as a determinant of food and nutrition insecurity in rural Myanmar. World Dev. 2014, 64, 597–608. [Google Scholar] [CrossRef]
  51. Muraoka, R.; Jin, S.; Jayne, T.S. Land access, land rental and food security: Evidence from Kenya. Land Use Policy 2018, 70, 611–622. [Google Scholar] [CrossRef] [Green Version]
  52. Thamaga-Chitja, J.M.; Hendriks, S.L.; Ortmann, G.F.; Green, M. Impact of maize storage on rural household food security in Northern Kwazulu-Natal. J. Consum. Sci. 2004, 32. Available online: https://www.ajol.info/index.php/jfecs/article/download/52843/41445 (accessed on 2 May 2022). [CrossRef]
Figure 1. Study site, Limpopo Province (Source: Author).
Agriculture 12 00999 g001
Table 1. Description of independent variables used in the model.
Variables Measures Expected Sign
AgeYears
GenderMale = 1; Female = 0
Marital statusMarried = 1; Single = 0+
Level of education1 = Formal education; 0 = Non-formal education
Number of dependentsNumber of dependents
Leasing land from employerYes = 1; No = 0
Land sizeHectares
Food storageYes = 1; No = 0
Total monthly incomeRand (R)
Total monthly household expenditureRand (R)+
Source: Research survey, 2020. + means the variable is expected to have a positive effect on the dependent variable; − means the variable is expected to have a negative effect on the dependent variable.
Table 2. Parametric One-Way ANOVA results for farmworkers’ food security determinants.
Variables
(Mean)
Food-SecureMildly
Food-Insecure
Moderately
Food-Insecure
Severely
Food-Insecure
p-Value
Age (Years)44.9851.5046.4247.63ns
Number of dependents4.965.575.025.57ns
Land size (ha)1.942.001.344.00***
Total household monthly expenditure (ZAR)2222.821894.282306.322613.75*
Total household monthly income (ZAR)2026.361557.141744.471817.30ns
Note: *** and * mean the coefficient is statistically significant at 1% and 10% levels, respectively. ns = not statistically significant. Source: Research survey, 2020.
Table 3. Association between food security and socioeconomic parameters.
VariableMeasureFood-Secure
(n = 99)
(%)
Mildly Food-
Insecure (n = 14)
(%)
Moderately Food-Insecure
(n = 38)
(%)
Severely Food-
Insecure
(n = 40)
(%)
nX2 Sig. Level
Marital statusSingle45.08.020.027.0100ns
Married59.36.619.814.391
GenderFemale 46.76.723.323.3120ns
Male 60.68.514.116.971
Leasing land from employerNo32.5 7.022.837.777***
Yes64.922.07.85.3114
Level of educationNo form education50.208.214.127.185ns
Formal education52.86.624.516.0106
Food storedNo4.67.142.445.966***
Yes89.77.51.90.9125
Note: *** means the coefficient is statistically significant at 1%. ns = not statistically significant. n = sample size. X2 = chi-square. Source: Research survey, 2020.
Table 4. Ordered probit results of determinants of household food insecurity.
Independent
Variables
Marginal Effects
CoefficientsRobust St. Errorp > zFood-SecureMildly Food-InsecureModerately Food-InsecureSeverely Food-Insecure
Gender−0.0510.2330.8260.020−0.002−0.015−0.003
Marital status−0.2060.2190.3450.081−0.009−0.060−0.012
Level of education0.2400.2610.359−0.0950.0110.0700.013
Leasing land from employer−0.6910.2590.008 ***0.266 ***−0.018 ***−0.199 ***−0.048 ***
Total monthly
income
−0.00010.00010.1590.0068−7.45 ×10⁻⁶−0.0051−0.0001
Food storage−3.0280.2730.000 ***0.854 ***−0.005 ***−0.460 ***−0.388 ***
Land size0.1440.0570.012 **0.002 **0.006 **0.042 **0.008 **
Total monthly household
expenditure
0.00020.00010.035 **−0.0091 **9.99 × 10⁻⁶ **0.0068 **0.0013 **
Note: Number of observations = 191. LR X2 = ***. Pseudo R2 = 0.48; Log likelihood = −116.57. ** and *** mean the coefficient is statistically significant at 5% and 1% levels, respectively. Research survey, 2020.
Publisher’s Note: MDPI stays neutral with regard to jurisdictional claims in published maps and institutional affiliations.

