Article

Utilizing Urea–Chitosan Nanohybrid for Minimizing Synthetic Urea Application and Maximizing Oryza sativa L. Productivity and N Uptake

by
Omnia M. Elshayb
1,
Abdelwahed M. Nada
1,
Khaled Y. Farroh
2,
Arwa Abdulkreem AL-Huqail
3,*,
Maha Aljabri
4,
Najat Binothman
5 and
Mahmoud F. Seleiman
6,7,*
1
Agricultural Research Center, Rice Research and Training Center, Field Crops Research Institute, P.O. Box 33717 Sakha, Kafr El Sheikh 33511, Egypt
2
Nanotechnology and Advanced Materials Central Laboratory, Agricultural Research Center, P.O. Box 588 Orman, Giza 12619, Egypt
3
Department of Biology, College of Science, Princess Nourah bint Abdulrahman University, P.O. Box 84428, Riyadh 11671, Saudi Arabia
4
Department of Biology, Research Laboratories Centre, Faculty of Applied Science, Umm Al-Qura University, Makkah 21955, Saudi Arabia
5
Department of Chemistry, College of Sciences & Arts, King Abdulaziz University, Rabigh, Saudi Arabia
6
Plant Production Department, College of Food and Agriculture Sciences, King Saud University, P.O. Box 2460, Riyadh 11451, Saudi Arabia
7
Department of Crop Sciences, Faculty of Agriculture, Menoufia University, Shibin El-Kom 32514, Egypt
*
Authors to whom correspondence should be addressed.
Agriculture 2022, 12(7), 944; https://doi.org/10.3390/agriculture12070944
Submission received: 17 May 2022 / Revised: 22 June 2022 / Accepted: 24 June 2022 / Published: 29 June 2022

Abstract

:
In paddy fields, overuse of nitrogen fertilizer to maximize yields can lead to excessive economic loss and degradation of the environment. Therefore, studying the effects of urea–chitosan nanohybrid as a slow released source of nitrogen fertilizer on rice cultivation was the aim of our study. The effects of fertilization applications, namely: CU: control treatment; U1: application of a full recommended dose of classical urea (165 kg N ha−1); U2: adding recommended dose of classical urea by 80% + exogenous urea–chitosan nanohybrid 250 mg N/L; U3: adding recommended dose of classical urea by 80% + exogenous urea–chitosan nanohybrid 500 mg N/L; U4: adding recommended dose of classical urea by 60% + exogenous urea–chitosan nanohybrid 250 mg N/L; U5: adding recommended dose of classical urea by 60% + exogenous urea–chitosan nanohybrid 500 mg N/L; U6: adding recommended dose of classical urea by 40% + exogenous urea–chitosan nanohybrid 250 mg N/L; and U7: adding recommended dose of classical urea by 40% + exogenous urea–chitosan nanohybrid 500 mg N/L on growth indicators, yield-related components, grain productivity, and N uptake status of rice plants were investigated during two successive seasons. As a result, significant achievements concerning growth, yield and yield-related traits were obtained when rice plants were fertilized with exogenous urea–chitosan nanohybrid (i.e., 500 mg N/L) + 60% classical urea without a significant decline in the studied traits compared to the full recommended dose of classical urea. Accordingly, this investigation revealed that chitosan nanohybrid at 500 mg N/L as a compensatory alternative can be used in saving 40% of classical urea requirement.

1. Introduction

The demand for fertilizers is growing day by day to sustain agrarian production and provide nutritional requirements. Globally, the most rapid increase in fertilizers consumed was recorded on the African continent, with a growth of 79% (equivalent to 3 MT) from the period 2000 to 2019. The synthetic fertilizer application and high-yield crop varieties were the main keys to increasing crop productivity [1]. Worldwide, nitrogen (N) is considered the highest produced element among different elements in synthetic fertilizer production due to its importance for plant growth, development, and reproduction [2,3]. It is a vital component for chlorophyll, amino acids, adenosine triphosphate, and nucleic acids. In 1913, the Haber–Bosch process was a watershed event in the industrial mass production of nitrogen fertilizer [4]. The ammonia synthesis industry is considered one of the largest global energy consumers (to break the triple bond in N2 and convert it into NH3), including for its role as a greenhouse gas emitter [5].
The primary cereals including wheat (Triticum aestivum L.), rice (Oryza sativa L.), and maize (Zea mays L.) are considered to be the largest consumers (about 50%) of the world’s synthetic nitrogen production [6]. Among these cereals, rice is considered an indispensable ingredient in the world’s food basket. By 2050, rice production has to increase by 28% to cater to the needs of the fast-growing global inhabitants [7]. In Egypt, urea [Co (NH2)2] is a popular conventional source of N nutrient in paddy fields owing to government subsidies. Using urea (46%N) has a positive side due to the high content of N nutrient and ease of uptake by plants, but also a negative side due to the high level of leaching, runoff, volatilization, and denitrification. Accordingly, a high N loss ratio (about 60%) has occurred by using N fertilizer, resulting in economic and environmental impairment [8,9]. In this respect, the loss of N as N gas as a result of denitrification is 30–40%, the loss of N as ammonia gas due to volatilization is 10–20, and the loss of N as nitrate due to leaching is 44%, and erosion can reach 45%. Conversely, it was reported that the application of excessive synthetic nitrogen fertilizers under the current rice cultivation system in most countries results in a negative impact on global warming and consequently, to dysfunctional climate status [10,11]. Furthermore, irrigated paddy fields are ranked the second-largest in the generation of methane gas (CH4) emissions after cattle stocking (approximately 19%), while it shared about 11% of the global estimates of nitrous oxide (N2O) emissions [12,13]. Hence, agrarian fertilizer practices in paddy fields need to be rethought to establish eco-friendly alternatives to overcome unfavorable climate perturbations [14].
Chitosan (CS) is a natural safety biopolymer derived from chitin and a source of renewable carbon [15,16,17]. Owing to its non-toxicity and high affinity, CS has widespread applications in cosmetics, pharmaceuticals, food, feed additive, and the agro-sector [18,19,20,21,22]. Modified materials such as nanotechnology can increase nutrient management during the fertilization process; consequently, it can minimize nutrient loss through leaching [23,24]. Modifying CS into nanoparticles as a carrier for different nutrients is a slow release source for plant nutrients during the growing seasons. In this work, the transmutation of CS to CS nanoparticles (CS NP) can act as a nanocarrier binder. Herein, a hybridization between CS NP and urea granules could produce a unique fertilizer with slow release properties [25,26,27]. The previous investigations have focused only on the interaction mechanism between urea and chitosan nanoparticles, which are known as urea chitosan nanohybrid (CS–urea NH), and not only on the plant’s response to this hybrid fertilizer. However, the mixtures of NPK synthetic fertilizers and CS NP hybridization were investigated for enhancing growth and productivity of wheat [28], cucumber; Cucumis sativus L. [29], and potato; Solanum tuberosum L. [30]. Until now, the application of urea chitosan nanoparticles in paddy fertilization practices has remained unexplored or limited.
On this basis, this investigation intended to utilize a urea–chitosan nanohybrid for minimizing synthetic urea application to maximize rice productivity and N uptake in paddy fields.

2. Materials and Methods

2.1. Materials

Chitosan (CS) (molecular weight 50,000–190,000 Da, degree of deacetylation 75–85% and viscosity: 20–300 cP), acetic acid, sodium tripolyphosphate (TPP), Tween 80, and urea. All the chemicals used in this study were used without further purification and were purchased from Sigma-Aldrich, Burligton, VT, USA.

2.2. Preparation and Characterization of Chitosan–Urea Nanohybrid

Chitosan-urea nanohybrid (CS–Urea NH) was prepared according to [31] with some modifications. Briefly, CS aqueous solution (0.2% w/v) was prepared by dissolving CS in acetic acid solution (1% v/v) at room temperature. Subsequently, TPP solution (0.02% w/v) was added dropwise to CS solution under vigorous stirring for 30 min. The nanohybrid was prepared from a mixture of chitosan solution and urea (1% w/v; 1 g urea/100 mL chitosan solution) by homogenizing the solution at 18,000 rpm for 30 min in presence of Tween 80. The chemical structure of Chitosan–urea nanohybrid was assessed using X-ray diffraction (XRD) technique. The corresponding XRD pattern was recorded in the scanning mode (X ’pert PRO, PAN analytical, Amesterdam, The Netherlands) operated by Cu K radiation tube (=1.54 A) at 40 kV and 30 mA. The obtained diffraction pattern was interpreted by the standard ICCD library installed in PDF4 software. Dynamic light scattering (DLS) measurement of size and Zeta Potential was undertaken using a Nano-zeta sizer (Malvern, ZS Nano, Edgbaston, UK). The morphology of the Chitosan–urea nanocomposite was imaged by a high-resolution transmission electron microscope (HR-TEM) operating at an accelerating voltage of 200 kV (Tecnai G2, FEI, Eindhoven, The Netherlands). Diluted chitosan–urea nanohybrid solution was ultra-sonicated for 5 min to reduce the particles aggregation. Using a micropipette, three drops from the sonicated solution were deposited on a carbon-coated copper grid and left to dry at room temperature. Synthesis and characterization of chitosan–urea nanohybrid were performed at Nanotechnology and Advanced Materials Central Laboratory (NAMCL), Agricultural Research Center (ARC), Giza, Egypt.

2.3. Field Experimental Details

Across both summer seasons (2020 and 2021), two field experiments were performed at the Experimental Farm of Sakha, Kafr El Sheikh, Egypt (Latitude: 31° 60; Longitude 30° 560 E). The annual climatological datasets are recorded in Table 1. However, soil samples were gathered from the experimental site before cultivation, which were taken from the surface layer (depth, 0–30 cm), and then analysis commenced in the lab. The initial physiochemical traits of the tested soil samples have been described by the standards set by [32], as seen in Table 2.

2.4. Experimental Design and Treatments

In a randomized complete block experimental study, four replicates with seven treatments were conducted on the experimental farm. The size of the plot was 15 m2 (5 m length × 3 m width). The details of different treatments are explained in Table 3.

2.5. Experimental Details

Pre-germinated certified rice seeds (Oryza sativa L. CV. Sakha super 300) at a rate of 120 kg/ha were soaked in plenty of water for 24 h and further incubated for another 48 h to hasten seed germination. Germinated seeds were broadcasted in the nursery field on 13 and 16 of May during the 2020 and 2021 seasons, respectively. At 26 days after sowing, seedlings were transplanted into the permanent fields. Three seedlings of rice were planted in each hill, and the distance between hills and rows was 20 × 20 cm. Weeds were controlled chemically using Saturn herbicide 50% (at the rate of 4.8 L/ha) five days after transplanting rice plants.
According to each treatment of classical urea, the amount was divided into two doses and applied as soil application. The first dose (i.e., 66.67% of the applied urea treatment) was applied at sowing; while the second dose (33.33% of the applied urea treatment) was applied at the panicle initiation stage. However, the urea chitosan nanohybrid either at 250 or 500 mg N L−1 was applied as an exogenous application. Both potassium sulfate (48% K2O) and calcium superphosphate (15% P2O5) were applied at the recommended rate of 50 kg K2O kg/ha and 37 kg P2O5/ha, respectively. Zinc fertilizer in the shape of ZnSO4 (24 kg/ha) was broadcasted before transplanting.

2.6. Measurements

2.6.1. Growth Traits

At the heading stage, chlorophyll content (Chl, SPAD values), leaf area index (LAI), and dry matter (DM) production as g/hill were measured from five tagged hills. Chlorophyll content was determined from ten flag leaves using a chlorophyll analyzer (Model–SPAD 502), Minolta, Japan. To obtain the LAI value, six healthy and full expanded leaves from five tagged hills were taken to estimate LAI value (leaf area; cm2/covered soil area; cm2) according to Radford [33]. The above-mentioned samples were air-dried followed by oven-dried at 70 °C for 48 h until a constant weight was obtained as described by Yoshida et al. [34] and Cock et al. [35].

2.6.2. Yield and Its Components

At the maturity of rice plants in both planting seasons, plant height was measured (cm). In addition, ten hills were randomly collected from the middle of each plot to record the number of panicles per hill, both panicle weight (g) and length (cm), number of filled grains/panicle, empty grains/panicle, and 1000-grain weight (g). To estimate biological yield as a ton per hectare, the area of 12 m2 from the inner of each plot was harvested manually and dried based on 14% moisture content to record the weight of both grain and straw output which is explicated as tons per hectare (t/ha). After that, dried plants were threshed mechanically to estimate grain productivity according to Yoshida [36].

2.6.3. Nutrients Uptake

Selected samples of both harvestable grain and straw (5 g of each) yields were subjected to oven-drying (+70 °C) to obtain a constant weight. After this step, samples were ground and then digested using H2SO4-H2O2. By using the Micro-Kjeldahl method as described earlier by Yoshida et al. [34], N content was estimated in the digested samples. The total N uptake was calculated (kg ha−1) in grains and straw parts by multiplying N content resultant by mass weight of grains and straw:
N   uptake   kg / ha   DM = N   content   g / kg × grains   or   straw   yield   kg / ha × 0.001

2.7. Statistical Analysis

The accessing data were subordinated to an analysis of variance according to [37]. The means of different traits for different treatments were compared by a Tukey’s test to show the significant differences at p ≤ 0.05 probability [38]. All statistical analyses were officiated using the analysis of variance technique employing the “COSTATC” computer software package.

3. Results

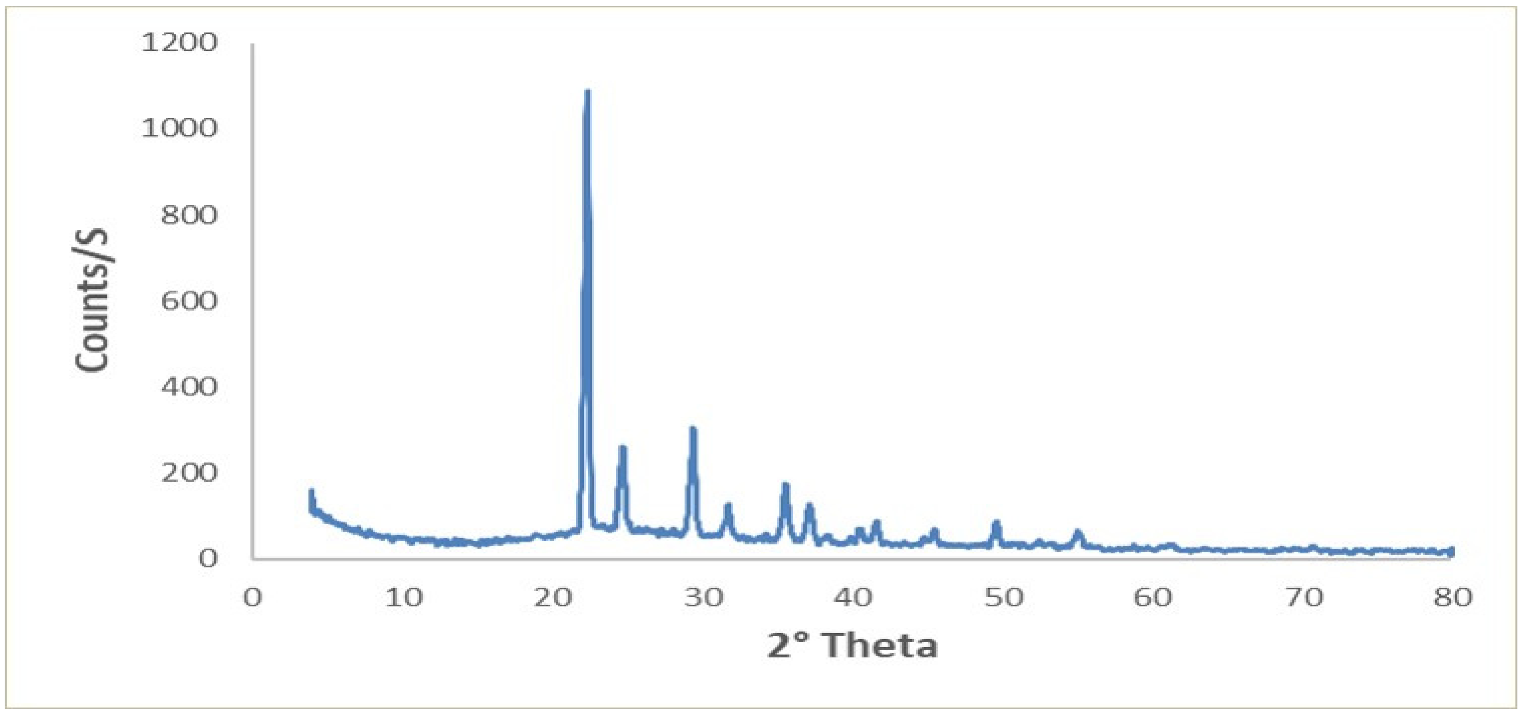
3.1. X-ray Diffraction (XRD) Pattern of CS–Urea NC

Figure 1 shows the XRD pattern of the prepared CS–urea NC. The presence of chitosan and urea and the absence of impurity phases is evident from the XRD image. The peaks of urea were indexed to the face-centered tetragonal structure, which is in good agreement with the JCPDS card no. 01-083-1436. The characteristic diffraction pattern shows sharp intense and narrow peaks at 22.25°, 29.32°, 24.62°, 35.53°, and 37.12° 2θ angles, corresponding to hkl parameters of (110), (111), (101), (210) and (201), respectively. The results show that the synthesized nanoparticles were urea nanoparticles because the position and relative intensity of all the diffraction peaks of the samples were consistent with the crystalline pattern of urea.

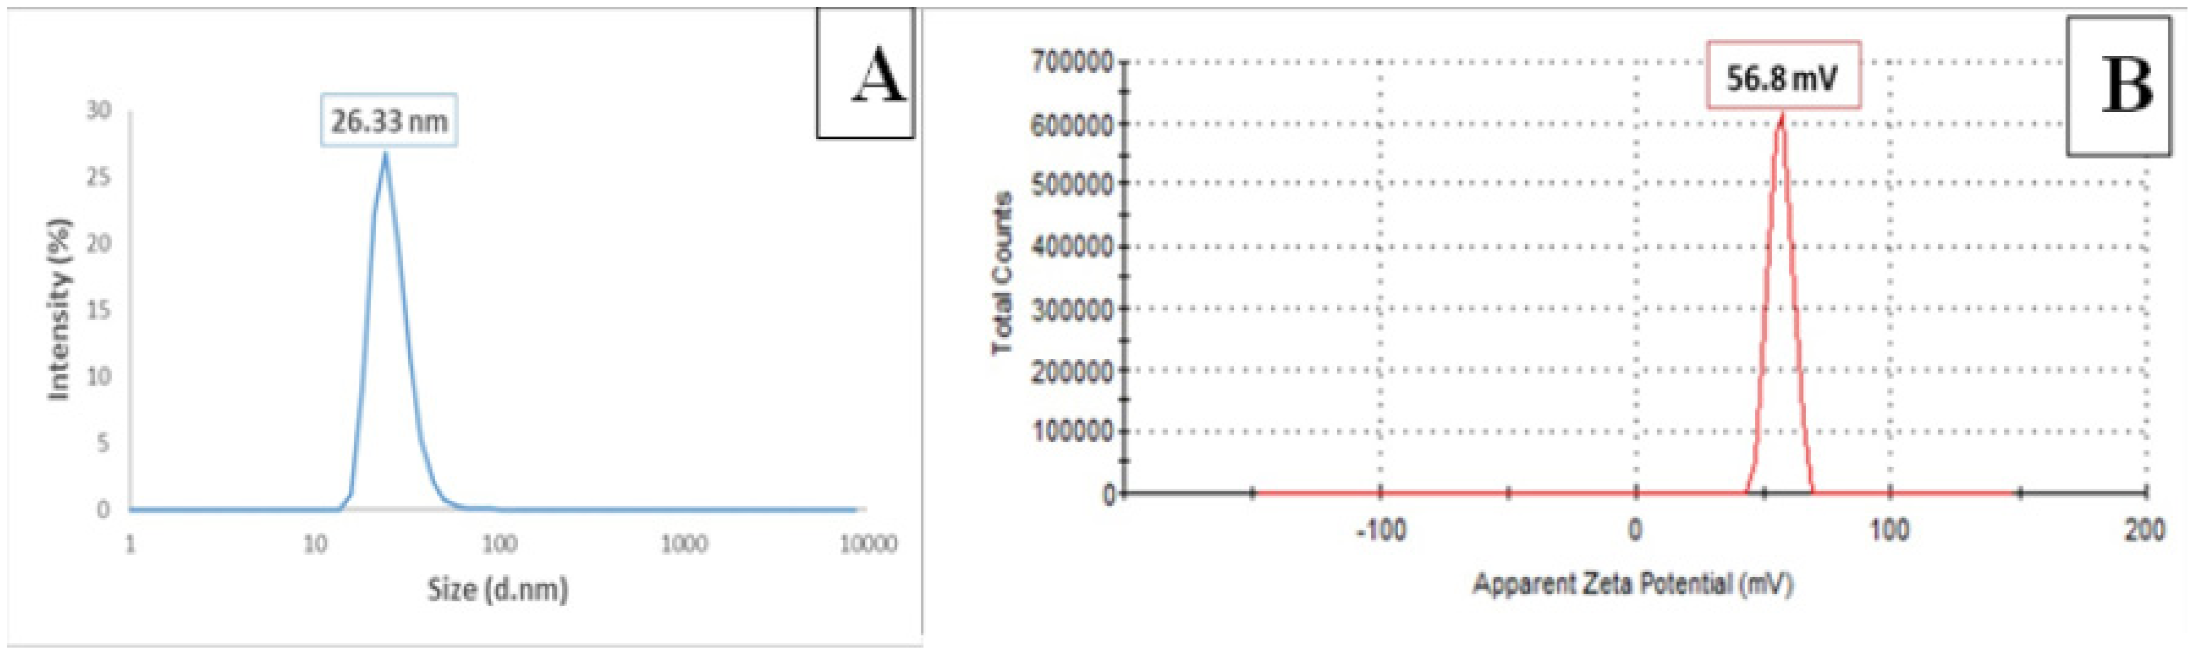
3.2. Dynamic Light Scattering (DLS) Analysis

DLS was used to measure hydrodynamic diameter in the nanometer range. The size of the chitosan–urea nanocomposite was 26.33 nm, with a zeta potential of 56.8 mV (Figure 2).

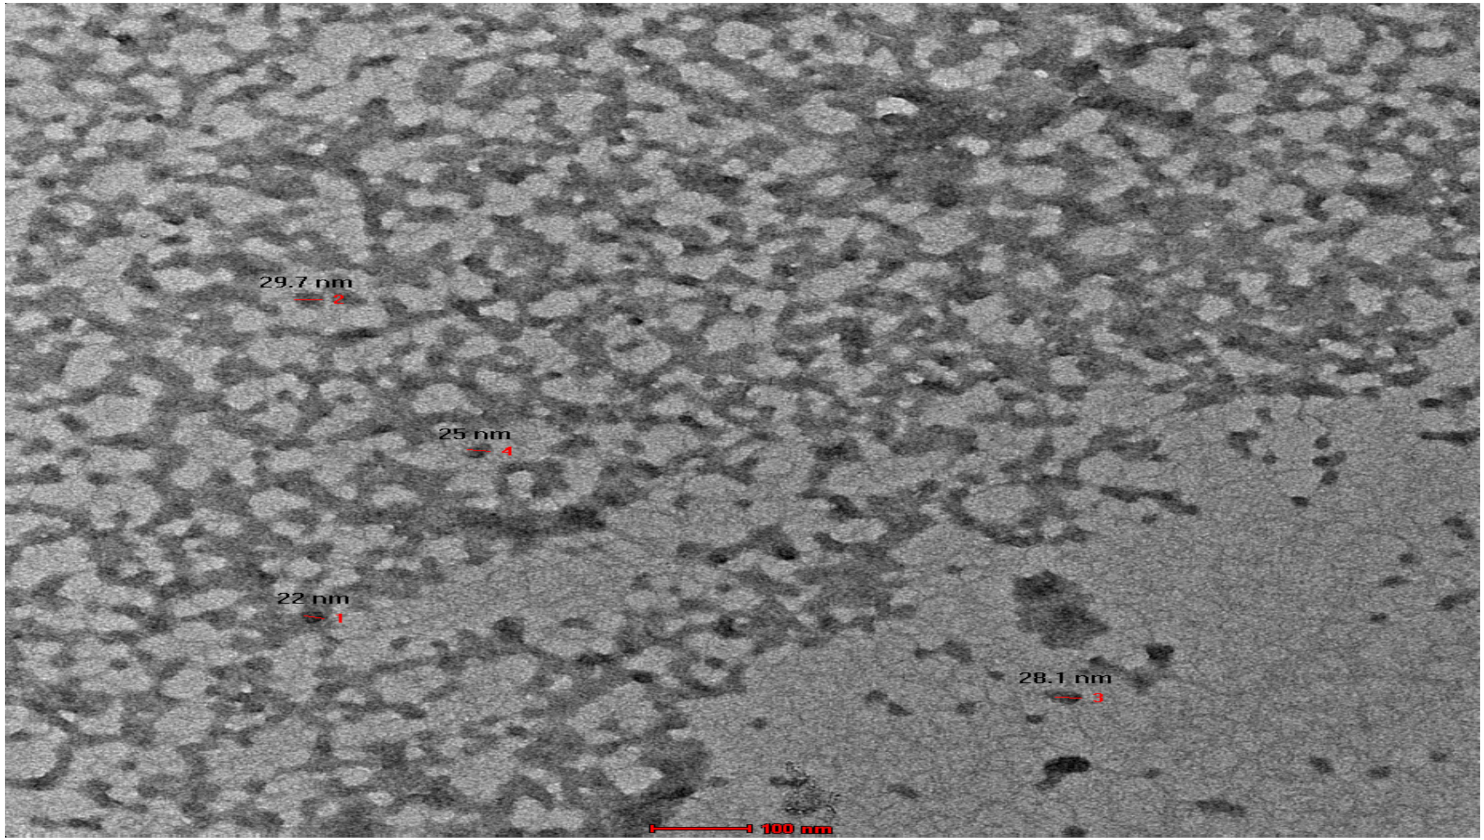
3.3. TEM Analysis Result

A transmission electron microscope (TEM) gave us information on the particle shape and the determination of particle size. A typical TEM micrograph of the CS–urea NH is shown in Figure 3. CS–urea NH has a nearly spherical shape, smooth surface, and an average size of 26.2 nm.

3.4. Effects of Different Rates of Classical Urea Fertilizer, Urea Chitosan Nanohybrid and Their Combinations on Rice Growth Traits

Growth traits such as Chl content, LAI, and DM production were remarkably different under different investigated treatments, as shown in Table 4. The results showed that the highest Chl content was obtained from plants fertilized with U1 and U3 during both growing seasons. As for LAI, the highest values (7.68 and 7.71) were represented when plants were fertilized with U3 in both seasons. Across each season, there was a statistical match among the effects of U1, U2, U3, and U5 treatments on plant growth traits. The same trend was observed concerning DM production, whereby the treatment of U3 gave the highest weight (52.32 and 53.04 g/hill) of DM in both seasons. Moreover, statistical conformity was noted between U1, U2, U3, and U5 treatments in the first and second seasons. The lowest values of chlorophyll content (36.11 and 34.45), LAI (5.64 and 5.35), and DM production (26.36 and 25.74 g/hill) were obtained from plants fertilized with CU, respectively, in both seasons.

3.5. Effects of Different Rates of Classical Urea Fertilizer, Urea Chitosan Nanohybrid, and Their Combinations on Rice Yield and Related Traits

In addition, different treatments of chemical urea fertilizers as soil application, urea chitosan nanoparticles as exogenous application, and their combinations had an effect on the plant height (cm), number of panicles/hill, and panicle weight (g) during both seasons (Table 5). The tallest plants (126.4 and 124.9 cm during both seasons) were obtained from plants fertilized with U3 and U1 treatments, which was statistically similar to those values obtained from plants fertilized with U2, U4, and U5 during the first and second seasons. In addition, the highest number of panicles/hill (25.34 panicles) was obtained from plants fertilized with the U3 treatment in the first season, but it (24.77 panicles per hill) was obtained from plants fertilized with U1 in the second season. Across each planting season, there was a statistical match among plants fertilized with U1, U2, U3, and U5 in terms of the number of panicles/hill. Concerning panicle weight, the heaviest weight (4.31 and 4.20 g, in both seasons) was obtained underlying the application of U3 with no significant difference between U1 and U5 in the first season and with U1, U2, and U5 in the second season. In each season, the shortest plants (98.6 and 96.9 cm), the lowest number of panicles per hill (13.26 and 12.18), and the minimal panicles weight (2.51 and 2.32 g) were obtained from plants fertilized with CU.
Regarding the impact of classical urea fertilizer rates, urea chitosan nanoparticles as exogenous application rates, and their combination on panicle length (cm), both numbers of filled and empty grains/panicle are depicted in Table 6. The longest panicle measured (23.72 and 23.48 cm) and the highest number of filled grains (156.3 and 150.7 grains) were observed from plants fertilized with U3, respectively, in the first and second seasons. In addition, in each season, statistic conformity was noted between U1, U2, and U5 treatments in connection with the panicle length and filled grains number/panicle in the 2020 and 2021 seasons. The lowest length of panicle (17.10 and 16.66 cm) and the least number of filled grains/panicle (110.6 and 107.8 grains) were realized in plants fertilized with CU in both seasons. Contrarily, the application of U1 resulted in the highest number of empty grains/panicle (17.0 and 19.6, in both years) with a statistical match with U6 treatment in the first and second seasons. Across two seasons, the lowest number of empty grains (5.1 and 6.0 grains, in both seasons) was noted under U3 with statistical conformity with U1, and U2 in the first season and with U1, U2, and U5 treatments in the second season.
As for the character of 1000-grain weight, the data in Table 7 imply that the application of U1 and U3 significantly elevated the weight of 1000-grain (31.08 and 31.23 g, in both planting seasons), which obtained a statistical match with U1, U2, and U5 in each studied season. However, grain productivity (final grain yield) was significantly increased when plants were fertilized with U3 (12.58 and 12.45 t/ha, in both cropping seasons). By scrutinizing the data given, the application of U3 gave identical statistics with U1, U2, and U5 in both seasons. The same trend was distinguished as to straw yield, which gave the highest values (t/ha) when U3 treatment (15.35 and 15.18 t/ha, in both seasons) occurred beside a statistical match with U1, U2, U4, and U5 treatments in the first and second seasons. However, the least values of 1000-grain weight (28.23 and 28.04 gm), grain productivity (8.10 and 7.87 t/ha), and straw yield (10.82 and 9.91 t/ha) in both planting seasons were rendered under the application of CU (control).

3.6. Effects of Different Rates of Classical Urea Fertilizer, Urea Chitosan Nanohybrid, and Their Combinations on N Content and Uptake

The value of N content in both grain and straw yields has witnessed a noted change in various treatments (Table 8). Under the treatment of U3, N content recorded the highest rank in both grains (1.421 and 1.447%) and straw (0.484 and 0.481%) yields in both seasons. In each season, there was no significant difference between U1, U2, U3, and U5 treatments concerning the concentration of N element in rice grain. Again, in the first season, there was no significant difference observed among U1, U2, U3, and U5 treatments regarding the concentration of N content in rice straw. The minimal N content in grain (0.964 and 0.927%) and straw (0.301 and 0.283%) yields was represented under control treatment (CU) in the 2020 and 2021 seasons.
As for the status of N uptake resultant in both grain and straw yields (Table 9), the U3 application accomplished improving N uptake in both grains (by 6.4% and 10.8%) and straw (17.8 and 16.2%) yields, in both the first and second seasons compared with applying classical urea only (U1). However, in each season, U5 gave identical statistics with U1, U2, and U3 concerning N uptake value in both grain and straw parts. Once again, the lowest given N uptake values were ascertained in CU treatment in both seasons.

4. Discussion

Previous investigations have studied the combination between polymers and fertilizers and have reported that fertilizers can be converted into slow-release sources for nutrients in a more controlled and smart manner [39,40]. Corradini et al. [31] and Hussain et al. [41] explored the utilization of CS NP as a controlled device for undesirable nutrient loss in several ways (air, soil, and water,) which perhaps can lead to increased effectiveness of the nutrients under low fertilizer application. In addition, an easy translocation feature of CS NP to various systemic organs (leaves, roots, and stems) might ensure nutrients delivery to plant parts and that the required change has occurred [42]. Conversely, a nanosized product of CS–urea NH (average size of about 26.2 nm) offers a unique size that has a different behavior from bulk materials, which can be physically explicated by the quantum effect [31]. Accordingly, the change in both physical properties and chemical reactivity is possible for achieving exceptional influence on CS–urea NH efficacy. Hence, a unique hybrid synthesis of CS–urea NH may create a slower release for urea fertilizer in a smart manner, consequently enhancing nutrient (N) translocation and decreasing fertilizer loss [26,31,43].
The presence of N as a basic component in both hybridization pairs (urea and chitosan) may lead to the production of a nitrogen-rich material. Furthermore, utilizing CS–urea NH may enhance chlorophyll content in plant cells via reinforcing tetra pyrrole ring biosynthesis, which plays a pivotal biochemical role in chlorophyll synthesis. Based on CS NP preparation, it acts as an efficient photocatalyst that can improve photosynthesis activity and nitrogen metabolism, which may cause an enhancement in cell division and growth vigor [28]. In another interpretation, CS–urea NH promotes cytokinin formation and enhances the availability of amino compounds, which are released from CS NP [44,45]. Furthermore, via utilizing CS–urea NH, benign N metabolism may have occurred in the plant physiological pathway as a result of higher activities of ammonia-assimilate enzymes (glutamate synthase, glutamate dehydrogenase, and glutamine syntheses) [46].
Therefore, the improvement of growth traits as indicated in our study (Table 4) is probably due to the application of CS–urea NH, which may be positively reflected on the Chl content and LAI of rice plants and thus enhances the photosynthesis process. An earlier study by [47] noted a significant improvement in rice leaf area and Chl content by treating the plants with CS at 40 ppm. In another report, exogenous application of CS NP at 90 ppm increased the Chl content and leaf area of stressed wheat plants [45]. By another agronomic view, CS–urea NH sprinkling after transplanting with 20 and 40 D may pave the way for aligning N provisions to plant requirements, where N plant needs are increased during the mid-tillering and flowering stages [46]. As reported by [48], the hybridization of superabsorbent polymer (such as CS NP) and various plant nutrients improves the synchronization of nutrient release with the plant’s needs.
The variation in DM weight is linked with the efficient use of solar radiation by the aerial parts [49,50]. Herein, a benign increase in DM output under higher and sufficient levels of N application (U1, U2, U3, and U5 treatments) was found in our study (Table 4). The above-mentioned result is probably because of larger LAI and developed generative organs, which may cause rapid nutrient accumulation and favorable DM production [51].
After exogenous application, CS NP penetrates the epidermis of plant leaves, which paves the way to easy absorption via the plant organs. Exogenous nano-sized manner moves towards the shoot (inside xylem) and root (inside phloem) directy because the plant vascular system is noncirculatory [52,53]. Accordingly, the foliar application of CS–urea NH has a phloem pathway only, which may be used to supported the translocation process from paddy leaves to its root resulting in enhances NUE [54]. CS NP may enhance some physiological pathways (transpiration, photosynthesis process, and gas exchange) through the facilate uptake of the molecule [15,16]. Our study hypothesis was that CS–urea NH was held by N nutrients (in urea granules) and was assimilated into rice plants, which may reflect favorably on cell development (elongation and division), meristematic activity, and internode elongation, consequently enhancing plant height. Prior research by [55,56] noted benign vigorous growth in treated plants with nano-chitosan NPK, and they attributed this to the increase in the flux of NPK inside plant tissues and the consequent benefits for plant growth.
It is reported that the exogenous application of micro-nutrients can significantly enhance crop nutrient uptake by leaves; consequently, significant assimilation of such nutrients can occur during the grain-filling period [57,58]. Streamlined translocation of photosynthesis output to a higher amount of panicles (sink capacity) can inevitably lead to a higher amount of filled grain number and grain yield outcome [50,51,59,60]. This explanation is in harmony with the obtained results in our study, which indicate that the yield components of plants fertilized with U5 (99 kg N/ha of urea as soil application + 500 N mg/L CS–urea NH as exogenous application) were not significantly different when compared with those obtained from plants fertilized with fully recommended classical urea as a soil application (Table 7). In this context, CS–urea NH might have compensatory benefits in the case of supplemental fertilizer (N) deficiency. In another agronomic view, the abovementioned findings are perhaps related to higher N-use efficacy of the cultivated variety (Sakha super 300) as reported by [61], as well as related to the importance of CS–urea NH as a slow-release source of nutrients.
Overall, the availability of nitrogen in a plant’s growth environment leads to and encourages the absorption of light energy and enhances photochemical efficiency in paddy leaves [62]. In all grain crops, individual mass grain is determined based on reserves of assimilates stored in the vigorous vegetative phase and on the C assimilation rate during grain filling [63,64]. In addition, adequate and balanced fertilizer N at panicle initiation works on optimizing both the weight and number of spikelets to ensure a high yield outcome [65,66,67,68]. The effect of engineered CS NP may occur by decreasing the total soluble sugar and by increasing polysaccharides, which is reflected positively on both carbohydrate and protein contents in yielded grain [28]. Accordingly, exogenous CS–urea NH at a proper and sufficient dosage might stimulate bio-physiological activities to promote the formation of carbohydrates. This benign carbohydrate accumulation is linked with higher N uptake during the vegetative period up to panicle initiation, which might increase reproductive tillers and lessen tiller abortion [69]. Therefore, this is possibly the reason for the enhancement of grain productivity under U5 treatment (Table 7) with no significant impact when urea application was decreased to 60% of the total recommended amount. As per [70], the application of CS in soybean crops contributed to improving branch length, shoot growth, number of node/plant, and seed yields. A positive significant impact was observed on maize yield attributes and harvestable seed yields when the plants were exposed to exogenous application of oligo-CS at a rate of 75 ppm [71].
However, using only CS NP positively affected N uptake (increased up to 27.4% compared with control) as mentioned earlier by [26]. Modified urea with a slow-release feature increased both N absorption and the accumulation inside plant tissues [72]. A prior study by [28] noted the improvement of N uptake efficacy by curtailed N loss. Hence, utilizing CS–urea NH may enhance and promote N content in both grain and straw yields, consequently improving N uptake status. Furthermore, exogenous N applying in the active growth stages resulted in the activation of rapid availability and uptake status, especially when combined with soil application [73].

5. Conclusion

The utilization of a modified fertilizer of CS–urea NH as a slow-release source of N can create a new approach for improving agrarian productivity. CS–urea NH represented a benign capacity to bind urea fertilizer as the N sourced. In the current investigation, CS–urea NH was considered as a good application to compensate for N shortages, and it could reduce the use of synthetic fertilizers by 60% for sustaining a high production of grain yield. On the above basis, we recommended using the exogenous application of CS–urea NH in paddy fields for reducing excessive N inputs, as well as enhancing growth, yield, grain productivity, and N uptake of rice plants.

Author Contributions

Conceptualization, O.M.E., A.M.N., K.Y.F., A.A.A.-H., M.A. and M.F.S.; data curation, A.A.A.-H., M.A., N.B. and M.F.S.; investigation, O.M.E., A.M.N., N.B. and K.Y.F.; methodology, O.M.E., A.M.N., K.Y.F., A.A.A.-H., M.A. and M.F.S.; resources, O.M.E., A.M.N. and K.Y.F.; software, A.A.A.-H., N.B., M.A. and M.F.S.; writing—original draft, O.M.E., A.M.N., K.Y.F. and M.F.S.; writing—review and editing, O.M.E., A.M.N., K.Y.F., A.A.A.-H., M.A., N.B. and M.F.S. All authors have read and agreed to the published version of the manuscript.

Funding

This research was funded by Princess Nourah bint Abdulrahman University Researchers Supporting Project number (PNURSP2022R93), Princess Nourah bint Abdulrahman University, Riyadh, Saudi Arabia.

Institutional Review Board Statement

Not applicable.

Informed Consent Statement

Not applicable.

Data Availability Statement

All data are presented within the article.

Conflicts of Interest

The authors declare that they have no conflict of interest.

References

  1. Borlaug, N.E. The Green Revolution Revisited and the Road Ahead; Nobelprize.org: Stockholm, Sweden, 2002. [Google Scholar]
  2. Seleiman, M.F.; Almutairi, K.F.; Alotaibi, M.; Shami, A.; Alhammad, B.A.; Battaglia, M.L. Nano-Fertilization as an Emerging Fertilization Technique: Why Can Modern Agriculture Benefit from Its Use? Plants 2021, 10, 2. [Google Scholar] [CrossRef]
  3. Eid, M.A.M.; Abdel-Salam, A.A.; Salem, H.M.; Mahrous, S.E.; Seleiman, M.F.; Alsadon, A.A.; Solieman, T.H.I.; Ibrahim, A.A. Interaction Effects of Nitrogen Source and Irrigation Regime on Tuber Quality, Yield, and Water Use Efficiency of Solanum tuberosum L. Plants 2020, 9, 110. [Google Scholar] [CrossRef] [Green Version]
  4. Soloveichik, G. Electrochemical synthesis of ammonia as a potential alternative to the Haber–Bosch process. Nat. Catal. 2019, 2, 377–380. [Google Scholar] [CrossRef]
  5. Hassan, M.U.; Aamer, M.; Mahmood, A.; Awan, M.I.; Barbanti, L.; Seleiman, M.F.; Bakhsh, G.; Alkharabsheh, H.M.; Babur, E.; Shao, J.; et al. Management Strategies to Mitigate N2O Emissions in Agriculture. Life 2022, 12, 439. [Google Scholar] [CrossRef] [PubMed]
  6. Ladha, J.; Tirol-Padre, A.; Reddy, C.; Cassman, K.; Verma, S.; Powlson, D.; Van Kessel, C.; Richter, D.d.B.; Chakraborty, D.; Pathak, H. Global nitrogen budgets in cereals: A 50-year assessment for maize, rice and wheat production systems. Sci. Rep. 2016, 6, 19355. [Google Scholar] [CrossRef] [PubMed] [Green Version]
  7. Zhu, C.; Kobayashi, K.; Loladze, I.; Zhu, J.; Jiang, Q.; Xu, X.; Liu, G.; Seneweera, S.; Ebi, K.L.; Drewnowski, A. Carbon dioxide (CO2) levels this century will alter the protein, micronutrients, and vitamin content of rice grains with potential health consequences for the poorest rice-dependent countries. Sci. Adv. 2018, 4, eaaq1012. [Google Scholar] [CrossRef] [PubMed] [Green Version]
  8. Ladha, J.K.; Pathak, H.; Krupnik, T.J.; Six, J.; van Kessel, C. Efficiency of fertilizer nitrogen in cereal production: Retrospects and prospects. Adv. Agron. 2005, 87, 85–156. [Google Scholar]
  9. Omara, P.; Aula, L.; Oyebiyi, F.; Raun, W.R. World cereal nitrogen use efficiency trends: Review and current knowledge. Agrosystems Geosci. Environ. 2019, 2, 1–8. [Google Scholar] [CrossRef]
  10. Badawy, S.A.; Zayed, B.A.; Bassiouni, S.M.A.; Mahdi, A.H.A.; Majrashi, A.; Ali, E.F.; Seleiman, M.F. Influence of Nano Silicon and Nano Selenium on Root Characters, Growth, Ion Selectivity, Yield, and Yield Components of Rice (Oryza sativa L.) under Salinity Conditions. Plants 2021, 10, 1657. [Google Scholar] [CrossRef]
  11. Hussain, S.; Huang, J.; Huang, J.; Ahmad, S.; Nanda, S.; Anwar, S.; Shakoor, A.; Zhu, C.; Zhu, L.; Cao, X. Rice production under climate change: Adaptations and mitigating strategies. In Environment, Climate, Plant and Vegetation Growth; Springer: Berlin/Heidelberg, Germany, 2020; pp. 659–686. [Google Scholar]
  12. Madruga, D.G. Importance of air quality networks in controlling exposure to air pollution. In Environmental Emissions; IntechOpen: London, UK, 2020. [Google Scholar]
  13. Pachauri, R.K.; Allen, M.R.; Barros, V.R.; Broome, J.; Cramer, W.; Christ, R.; Church, J.A.; Clarke, L.; Dahe, Q.; Dasgupta, P. Climate Change 2014: Synthesis Report. Contribution of Working Groups I, II and III to the Fifth Assessment Report of the Intergovernmental Panel on Climate Change; IPCC: Geneva, Switzerland, 2014. [Google Scholar]
  14. Mohanty, S.; Wassmann, R.; Nelson, A.; Moya, P.; Jagadish, S. Rice and Climate Change: Significance for Food Security and Vulnerability; The International Rice Research Institute: Los Banos, Philippines, 2013; Volume 14, pp. 1–14. [Google Scholar]
  15. Kurita, K. Chitin and chitosan: Functional biopolymers from marine crustaceans. Mar. Biotechnol. 2006, 8, 203–226. [Google Scholar] [CrossRef]
  16. Malerba, M.; Cerana, R. Chitosan effects on plant systems. Int. J. Mol. Sci. 2016, 17, 996. [Google Scholar] [CrossRef] [PubMed]
  17. Seleiman, M.F.; Hafez, E.M. Optimizing inputs management for sustainable agricultural development. In Mitigating Environmental Stresses for Agricultural Sustainability in Egypt; Springer: Berlin/Heidelberg, Germany, 2021; pp. 487–507. [Google Scholar]
  18. Kumar, M.N.R. A review of chitin and chitosan applications. React. Funct. Polym. 2000, 46, 1–27. [Google Scholar] [CrossRef]
  19. Xia, W.; Liu, P.; Zhang, J.; Chen, J. Biological activities of chitosan and chitooligosaccharides. Food Hydrocoll. 2011, 25, 170–179. [Google Scholar] [CrossRef]
  20. Wang, M.; Chen, Y.; Zhang, R.; Wang, W.; Zhao, X.; Du, Y.; Yin, H. Effects of chitosan oligosaccharides on the yield components and production quality of different wheat cultivars (Triticum aestivum L.) in Northwest China. Field Crops Res. 2015, 172, 11–20. [Google Scholar] [CrossRef]
  21. Kumar, V.; Sangeetha, K.; Ajitha, P.; Aisverya, S.; Sashikala, S.; Sudha, P. Chitin and Chitosan: The Defense Booster in Agricultural Field. In Handbook of Biopolymers; Jenny Stanford Publishing: Dubai, United Arab Emirates, 2018; pp. 93–134. [Google Scholar]
  22. Guan, G.; Azad, M.; Kalam, A.; Lin, Y.; Kim, S.W.; Tian, Y.; Liu, G.; Wang, H. Biological effects and applications of chitosan and chito-oligosaccharides. Front. Physiol. 2019, 10, 516. [Google Scholar] [CrossRef] [Green Version]
  23. Elshayb, O.M.; Nada, A.M.; Sadek, A.H.; Ismail, S.H.; Shami, A.; Alharbi, B.M.; Alhammad, B.A.; Seleiman, M.F. The Integrative Effects of Biochar and ZnO Nanoparticles for Enhancing Rice Productivity and Water Use Efficiency under Irrigation Deficit Conditions. Plants 2022, 11, 1416. [Google Scholar] [CrossRef] [PubMed]
  24. Kalita, R.; Saha, O.; Rahman, N.; Tiwari, S.; Phukon, M. Nanotechnology in Agriculture. In Nanobiotechnology; Springer: Berlin/Heidelberg, Germany, 2021; pp. 101–116. [Google Scholar]
  25. Mahdavi, F.; Abdul, R.S.; Khanif, Y.M. Intercalation of urea into kaolinite for preparation of controlled release fertilizer. Chem. Ind. Chem. Eng. Q. 2014, 20, 207–213. [Google Scholar] [CrossRef]
  26. Roshanravan, B.; Soltani, S.M.; Rashid, S.A.; Mahdavi, F.; Yusop, M.K. Enhancement of nitrogen release properties of urea–kaolinite fertilizer with chitosan binder. Chem. Speciat. Bioavailab. 2015, 27, 44–51. [Google Scholar] [CrossRef]
  27. Kondal, R.; Kalia, A.; Krejcar, O.; Kuca, K.; Sharma, S.P.; Luthra, K.; Dheri, G.S.; Vikal, Y.; Taggar, M.S.; Abd-Elsalam, K.A. Chitosan-Urea Nanocomposite for Improved Fertilizer Applications: The Effect on the Soil Enzymatic Activities and Microflora Dynamics in N Cycle of Potatoes (Solanum tuberosum L.). Polymers 2021, 13, 2887. [Google Scholar] [CrossRef] [PubMed]
  28. Aziz, H.M.A.; Hasaneen, M.N.; Omer, A.M. Nano chitosan-NPK fertilizer enhances the growth and productivity of wheat plants grown in sandy soil. Span. J. Agric. Res. 2016, 14, 17. [Google Scholar]
  29. Modi, S.; Kumar, S.; Dubey, P. Dynamics of chitosan based NPK-nanofertilizers in greenhouse cucumber production system. J. Environ. Biol. 2021, 42, 162–168. [Google Scholar] [CrossRef]
  30. Elshamy, M.T.; Husseiny, S.M.; Farroh, K.Y. Application of nano-chitosan NPK fertilizer on growth and productivity of potato plant. J. Sci. Res. Sci. 2019, 36, 424–441. [Google Scholar] [CrossRef] [Green Version]
  31. Corradini, E.; De Moura, M.; Mattoso, L. A preliminary study of the incorparation of NPK fertilizer into chitosan nanoparticles. Express Polym. Lett. 2010, 4, 509–515. [Google Scholar] [CrossRef]
  32. Black, C.A.; Evans, D.D.; Dinauer, R.C. Methods of Soil Analysis; Madison: Madison, WI, USA, 1965. [Google Scholar]
  33. Radford, P. Growth analysis formulae-their use and abuse 1. Crop Sci. 1967, 7, 171–175. [Google Scholar] [CrossRef]
  34. Yoshida, S.; Forno, D.A.; Cock, J.H. Laboratory Manual for Physiological Studies of Rice; The International Rice Research Institute: Los Banos, Philippines, 1971; p. 61. [Google Scholar]
  35. Cock, J.; Yoshida, S.; Forno, D.A. Laboratory Manual for Physiological Studies of Rice; The International Rice Research Institute: Los Banos, Philippines, 1976. [Google Scholar]
  36. Yoshida, S. Fundamentals of Rice Crop Science; The International Rice Research Institute: Los Banos, Philippines, 1981. [Google Scholar]
  37. Gomez, K.A.; Gomez, A.A. Statistical Procedures for Agricultural Research; John Wiley & Sons: Hoboken, NJ, USA, 1984. [Google Scholar]
  38. Hsu, J. Multiple Comparisons: Theory and Methods; CRC: New York, NY, USA, 1996; p. 296. [Google Scholar]
  39. Jatav, G.; Nirmal, D. Application of nanotechnology in soil-plant system. J. Soil Sci. 2013, 8, 176–184. [Google Scholar]
  40. Mahil, E.; Kumar, B. Foliar application of nanofertilizers in agricultural crops—A review. J. Farm Sci. 2019, 32, 239–249. [Google Scholar]
  41. Hussain, M.R.; Devi, R.R.; Maji, T.K. Controlled release of urea from chitosan microspheres prepared by emulsification and cross-linking method. Iran. Polym. J. 2012, 21, 473–479. [Google Scholar] [CrossRef]
  42. Aslani, F.; Bagheri, S.; Muhd Julkapli, N.; Juraimi, A.S.; Hashemi, F.S.G.; Baghdadi, A. Effects of engineered nanomaterials on plants growth: An overview. Sci. World J. 2014, 2014, 641759. [Google Scholar] [CrossRef]
  43. Narayanan, A.; Dhamodharan, R. Super water-absorbing new material from chitosan, EDTA and urea. Carbohydr. Polym. 2015, 134, 337–343. [Google Scholar] [CrossRef]
  44. Chandrkrachang, S. The application of chitin and chitosan in agriculture in Thailand. Adv. Chitin Sci. 2002, 5, 458–462. [Google Scholar]
  45. Behboudi, F.; Tahmasebi-Sarvestani, Z.; Kassaee, M.Z.; Modarres-Sanavy, S.A.M.; Sorooshzadeh, A.; Mokhtassi-Bidgoli, A. Evaluation of chitosan nanoparticles effects with two application methods on wheat under drought stress. J. Plant Nutr. 2019, 42, 1439–1451. [Google Scholar] [CrossRef]
  46. Mae, T. Physiological nitrogen efficiency in rice: Nitrogen utilization, photosynthesis, and yield potential. Plant Soil 1997, 196, 201–210. [Google Scholar] [CrossRef]
  47. Chamnanmanoontham, N.; Pongprayoon, W.; Pichayangkura, R.; Roytrakul, S.; Chadchawan, S. Chitosan enhances rice seedling growth via gene expression network between nucleus and chloroplast. Plant Growth Regul. 2015, 75, 101–114. [Google Scholar] [CrossRef]
  48. Wu, L.; Liu, M.; Liang, R. Preparation and properties of a double-coated slow-release NPK compound fertilizer with superabsorbent and water-retention. Bioresour. Technol. 2008, 99, 547–554. [Google Scholar] [CrossRef]
  49. Fageria, N.K.; Baligar, V. Enhancing nitrogen use efficiency in crop plants. Adv. Agron. 2005, 88, 97–185. [Google Scholar]
  50. Fageria, N.; Santos, A.D.; Cutrim, V.A. Dry matter and yield of lowland rice genotypes as influence by nitrogen fertilization. J. Plant Nutr. 2008, 31, 788–795. [Google Scholar] [CrossRef]
  51. Qiao, J.; Yang, L.; Yan, T.; Xue, F.; Zhao, D. Rice dry matter and nitrogen accumulation, soil mineral N around root and N leaching, with increasing application rates of fertilizer. Eur. J. Agron. 2013, 49, 93–103. [Google Scholar] [CrossRef]
  52. Lough, T.J.; Lucas, W.J. Integrative plant biology: Role of phloem long-distance macromolecular trafficking. Annu. Rev. Plant Biol. 2006, 57, 203–232. [Google Scholar] [CrossRef] [Green Version]
  53. Wang, Z.; Xie, X.; Zhao, J.; Liu, X.; Feng, W.; White, J.C.; Xing, B. Xylem-and phloem-based transport of CuO nanoparticles in maize (Zea mays L.). Environ. Sci. Technol. 2012, 46, 4434–4441. [Google Scholar] [CrossRef]
  54. Seleiman, M.F.; Alotaibi, M.A.; Alhammad, B.A.; Alharbi, B.M.; Refay, Y.; Badawy, S.A. Effects of ZnO nanoparticles and biochar of rice straw and cow manure on characteristics of contaminated soil and sunflower productivity, oil quality, and heavy metals uptake. Agronomy 2020, 10, 790. [Google Scholar] [CrossRef]
  55. Hasaneen, M.; Abdel-Aziz, H.; El-Bialy, D.; Omer, A.M. Preparation of chitosan nanoparticles for loading with NPK fertilizer. Afr. J. Biotechnol. 2014, 13, 3158–3164. [Google Scholar] [CrossRef] [Green Version]
  56. Hasaneen, M.; Abdel-Aziz, H.M.M.; Omer, A.M. Effect of foliar application of engineered nanomaterials: Carbon nanotubes NPK and chitosan nanoparticles NPK fertilizer on the growth of French bean plant. Biochem. Biotechnol. Res. 2016, 4, 68–76. [Google Scholar]
  57. Martens, D.; Westermann, D. Fertilizer applications for correcting micronutrient deficiencies. Micronutr. Agric. 1991, 4, 549–592. [Google Scholar]
  58. Alloway, B.J. Micronutrients and crop production: An introduction. In Micronutrient Deficiencies in Global Crop Production; Springer: Berlin/Heidelberg, Germany, 2008; pp. 1–39. [Google Scholar]
  59. Hasegawa, H. High-yielding rice cultivars perform best even at reduced nitrogen fertilizer rate. Crop Sci. 2003, 43, 921–926. [Google Scholar] [CrossRef]
  60. Pal, R.; Mahajan, G.; Sardana, V.; Chauhan, B. Impact of sowing date on yield, dry matter and nitrogen accumulation, and nitrogen translocation in dry-seeded rice in North-West India. Field Crops Res. 2017, 206, 138–148. [Google Scholar] [CrossRef]
  61. Gewaily, E.; Hamad, H.S.; Arafat, E. Optimizing Sowing Date and Nitrogen Fertilizer Level for the New Rice Variety Sakha Super 300. J. Plant Prod. 2019, 10, 777–784. [Google Scholar] [CrossRef]
  62. Peng, J.; Feng, Y.; Wang, X.; Li, J.; Xu, G.; Phonenasay, S.; Luo, Q.; Han, Z.; Lu, W. Effects of nitrogen application rate on the photosynthetic pigment, leaf fluorescence characteristics, and yield of indica hybrid rice and their interrelations. Sci. Rep. 2021, 11, 1–10. [Google Scholar] [CrossRef]
  63. Masoni, A.; Ercoli, L.; Mariotti, M.; Arduini, I. Post-anthesis accumulation and remobilization of dry matter, nitrogen and phosphorus in durum wheat as affected by soil type. Eur. J. Agron. 2007, 26, 179–186. [Google Scholar] [CrossRef]
  64. Dordas, C. Dry matter, nitrogen and phosphorus accumulation, partitioning and remobilization as affected by N and P fertilization and source–sink relations. Eur. J. Agron. 2009, 30, 129–139. [Google Scholar] [CrossRef]
  65. Ntanos, D.A.; Koutroubas, S. Dry matter and N accumulation and translocation for Indica and Japonica rice under Mediterranean conditions. Field Crops Res. 2002, 74, 93–101. [Google Scholar] [CrossRef]
  66. Kamiji, Y.; Yoshida, H.; Palta, J.A.; Sakuratani, T.; Shiraiwa, T. N applications that increase plant N during panicle development are highly effective in increasing spikelet number in rice. Field Crops Res. 2011, 122, 242–247. [Google Scholar] [CrossRef]
  67. Xiong, J.; Ding, C.Q.; Wei, G.B.; Ding, Y.F.; Wang, S.H. Characteristic of dry-matter accumulation and nitrogen-uptake of super-high-yielding early rice in China. Agron. J. 2013, 105, 1142–1150. [Google Scholar] [CrossRef]
  68. Reddy, N.P.; Rao, C.B.B.; Surekha, K.; Hussain, S. Growth of Transplanted Rice as Influenced by Enriched Nitrogen Sources at Different Levels. Int. Res. J. Pure Appl. Chem. 2020, 21, 114–119. [Google Scholar] [CrossRef]
  69. Kim, H.-Y.; Lieffering, M.; Kobayashi, K.; Okada, M.; Mitchell, M.W.; Gumpertz, M. Effects of free-air CO2 enrichment and nitrogen supply on the yield of temperate paddy rice crops. Field Crops Res. 2003, 83, 261–270. [Google Scholar] [CrossRef]
  70. Harada, J.; Arima, S.; Shibayama, H.; Kabashima, R. Effect of chitosan application on growth and seed yield of soybean. Mar. Highl. Biosci. Cent. Rep. 1995, 2, 15–19. [Google Scholar]
  71. Sultanaa, S. Summaries of Country Reports on Radiation Processing and Application of Chitosan. Annex 2010, 4, 1. [Google Scholar]
  72. Wei, H.; Li, H.; Cheng, J.; Zhang, H.; Huo, Z.; Xu, K.; Guo, B.; Hu, Y.; Cui, P. Effects of slow/controlled release fertilizer types and their application regime on yield in rice with different types of panicle. Acta Agron. Sin. 2017, 43, 730–740. [Google Scholar] [CrossRef]
  73. Gharieb, A. NPK Compound Fertilizer Foliar Application Impacts Productivity and Grain Quality of Rice. Alex. J. Agric. Sci. 2021, 66, 13–21. [Google Scholar] [CrossRef]
Figure 1. X-ray diffraction patterns of CS–urea NC.
Agriculture 12 00944 g001
Figure 2. DLS analysis of CS–urea NC; particle size (A), and zeta potential (B).
Agriculture 12 00944 g002
Figure 3. (TEM image of CS–urea NC.
Agriculture 12 00944 g003
Table 1. The annual climatological datasets in the 2020 and 2021 seasons.
Minimum Temperature (°C)Maximum Temperature (°C)Relative Humidity (%)
first (2020) season
June23.832.056.7
July27.333.767.7
August28.234.667.5
September27.134.267.2
October24.631.565.9
second (2021) season
June25.033.160.0
July26.434.267.9
August28.834.366.8
September27.433.868.1
October23.831.266.4
Table 2. The initial physiochemical traits of the soil samples during the 2020 and 2021 seasons.
Character20202021
physical analysis
TextureClayClay
Sand (%)12.8012.60
Silt (%)32.0031.40
Clay (%)55.2056.00
Chemical analysis
pH (1:2.5 soil extract)8.308.11
EC (dSm−1)2.032.0
Organic matter %1.701.53
NH4 * (ppm)12.6015.70
NO3 * (ppm)11.5010.30
P * (ppm)12.6014.00
K * (ppm)351.20350.40
Zn * (ppm)0.900.95
Mn * (ppm)3.813.88
Fe * (ppm)2.962.94
* available.
Table 3. The details of the experimental treatments.
TreatmentsSoil Application Rate of Classical Urea (%)Exogenous Urea Chitosan Nanohybrid (mg N L−1)
CU0%0 mg N L−1
U1100% (165 Kg N ha−1)0 mg N L−1
U280% (132 Kg N ha−1)250 mg N L−1
U380% (132 Kg N ha−1)500 mg N L−1
U460% (99 Kg N ha−1)250 mg N L−1
U560% (99 Kg N ha−1)500 mg N L−1
U640% (66 Kg N ha−1)250 mg N L−1
U740% (66 Kg N ha−1)500 mg N L−1
The exogenous application of CS–Urea NH was applied twice at 20 and 40 days after transplanting of rice plants.
Table 4. Effects of different rates of classical urea fertilizer, urea chitosan nanohybrid, and their combinations as an exogenous application on chlorophyll content, leaf area index, and dry matter production of rice plants during the 2020 and 2021 seasons.
TraitsChlorophyll ContentLeaf Area IndexDry Matter Production (g/hill)
TreatmentsSeason 1Season 2Season 1Season 2Season 1Season 2
CU 36.11 c34.45 d5.64 d5.35 c26.36 d25.74 d
U145.76 a43.60 a7.54 a7.38 a51.84 a50.69 a
U244.51 a45.32 a7.11 ab6.93 ab49.31 a47.80 ab
U345.26 a44.20 a7.68 a7.71 a52.32 a51.04 a
U442.32 ab40.86 bc6.90 b6.64 ab43.63 ab42.36 bc
U544.25 a43.10 a7.22 ab7.10 ab48.86 a48.14 ab
U637.83 c 36.92 cd6.01 d5.45 c33.65 c33.47 cd
U738.64 bc39.62 bc6.63 b6.15 b38.23 b37.01 cd
F. test************
** indicates p < 0.01;.Means followed by the same letter in each factor were not significantly different for probability (p) < 0.05. CU: control treatment; U1: application of a full recommended dose of classical urea (165 kg N ha−1); U2: adding recommended dose of classical urea by 80% + exogenous urea–chitosan nanohybrid 250 mg N/L; U3: adding recommended dose of classical urea by 80% + exogenous urea–chitosan nanohybrid 500 mg N/L; U4: adding recommended dose of classical urea by 60% + exogenous urea–chitosan nanohybrid 250 mg N/L; U5: adding recommended dose of classical urea by 60% + exogenous urea–chitosan nanohybrid 500 mg N/L; U6: adding recommended dose of classical urea by 40% + exogenous urea–chitosan nanohybrid 250 mg N/L; U7: adding recommended dose of classical urea by 40% + exogenous urea–chitosan nanohybrid 500 mg N/L.
Table 5. Effects of different rates of classical urea fertilizer, urea chitosan nanohybrid and their combinations as exogenous application on plant height, number of panicles/hill, and panicle weight of rice plants during the 2020 and 2021 seasons.
TraitsPlant Height
(cm)
Number of Panicles per HillPanicle Weight
(gm)
TreatmentsSeason 1Season 2Season 1Season 2Season 1Season 2
CU 98.6 d96.9 d13.26 cd12.18 c2.51 c2.32 bc
U1123.8 ab124.9 a24.16 a24.77 a3.94 ab4.07 a
U2122.7 ab123.7 a 22.76 ab21.07 ab3.48 ab3.67 a
U3126.4 a123.7 a25.34 a22.16 ab4.31 a4.20 a
U4120.2 ab119.8 ab19.02 bc17.27 b3.22 b 3.13 ab
U5122.2 ab121.9 a22.40 ab20.57 ab3.68 ab3.60 a
U6107.6 c108.5 c15.10 cd13.24 c2.88 bc2.57 b
U7111.4 c113.7 c17.15 bc16.38 b3.01 bc2.91 b
F. test************
** indicates p < 0.05; Means followed by the same letter in each factor were not significantly different for probability (p) < 0.05. For abbreviations, see Table 4.
Table 6. Effects of different rates of classical urea fertilizer, urea chitosan nanohybrid and their combinations as an exogenous application on panicle length, number of filled grains/panicle, and number of empty grain/panicle of rice plants during the 2020 and 2021 seasons.
TraitsPanicle Length
(cm)
Number of Filled Grains/Panicle Number of Empty Grains/Panicle
TreatmentsSeason 1Season 2Season 1Season 2Season 1Season 2
CU17.10 c16.66 c110.6 c107.8 d17.0 a19.6 a
U122.84 a23.37 a 151.8 a150.1 a7.5 c8.3 c
U221.23 ab20.78 ab149.1 a146.5 a6.5 c7.4 c
U323.72 a23.48 a156.3 a150.7 a5.1 c6.0 cd
U419.38 b19.44 b132.2 c131.4 b9.2 bc10.8 bc
U521.08 ab21.35 ab148.1 a147.3 a8.3 bc8.7 c
U618.65 bc17.31 bc121.8 b119.6 c12.8 b14.2 b
U719.30 b17.92 bc130.6 b127.3 b11.6 b11.3 b
F. test************
** indicates p < 0.01. Means followed by the same letter in each factor were not significantly different for probability (p) < 0.05. For abbreviations, see Table 4.
Table 7. Effects of different rates of classical urea fertilizer, urea chitosan nanohybrid and their combinations as exogenous application on 1000-grain weight, grain productivity, and straw yield of rice plants during the 2020 and 2021 seasons.
Traits1000-Grain Weight (g) Grain Productivity
(t ha−1)
Straw Yield
(t ha−1)
TreatmentsSeason 1Season 2Season 1Season 2Season 1Season 2
CU28.23 c28.04 c8.10 c7.87 cd10.82 c9.91 c
UI31.08 a30.65 ab12.03 a12.40 a14.63 a15.10 a
U230.28 a30.41 ab11.78 ab11.40 ab13.92 ab13.61 ab
U330.94 a31.23 a12.58 a12.45 a15.45 a15.18 a
U429.43 b29.13 b10.84 b10.53 b13.34 b12.84 b
U530.12 ab30.10 ab11.34 ab11.23 ab14.10 ab13.65 ab
U628.87 c28.44 bc9.10 c8.79 c11.42 c11.18 bc
U729.21 b29.03 b 10.22 b9.95 b12.78 bc12.37 b
F. test************
** indicates p < 0.01. Means followed by the same letter in each factor were not significantly different for probability (p) < 0.05. For abbreviations, see Table 4.
Table 8. Effects of different rates of classical urea fertilizer, urea chitosan nanohybrid and their combinations as exogenous application on N content in both grain and straw of rice during the 2020 and 2021 seasons.
TraitsN Content in Grain Yield
(%)
N Content in Straw Yield
(%)
TreatmentsSeason 1Season 2Season 1Season 2
CU0.964 c0.927 d0.301 c0.283 c
UI1.397 a1.337 ab0.434 a0.416 ab
U21.348 ab1.328 ab0.410 ab0.393 ab
U31.421 a1.447 a0.484 a0.481 a
U41.226 bc1.203 bc0.378 b0.338 bc
U51.278 abc1.276 ab0.391 ab0.382 ab
U61.027 bc0.993 c0.336 bc0.296 c
U71.082 bc1.051 bc0.367 b 0.331 bc
F. test********
** indicates p < 0.01. Means followed by the same letter in each factor were not significantly different for probability (p) < 0.05. For abbreviations, see Table 4.
Table 9. Effects of different rates of classical urea fertilizer, urea chitosan nanohybrid, and their combinations as an exogenous application on N uptake in both grain and straw of rice during the 2020 and 2021 seasons.
TraitsN Uptake in Grain Yield
(kg ha−1)
N Uptake in Straw Yield
(kg ha−1)
TreatmentsSeason 1Season 2Season 1Season 2
CU78.1 c72.9 d32.5 c28.0 c
UI168.0 a 162.5 ab 63.4 ab62.8 ab
U2152.8 ab149.1 ab57.8 ab53.6 ab
U3178.8 a 180.1 a 74.7 a73.0 a
U4132.8 abc126.6 bc45.1 bc43.4 bc
U5144.9 ab143.2 ab55.2 ab52.1 ab
U693.5 bc87.2 c38.4 bc33.1 c
U7110.6 bc104.5 cd46.9 bc40.9 bc
F. test********
** indicates p < 0.01. Means followed by the same letter in each factor were not significantly different for probability (p) < 0.05. For abbreviations, see Table 4.
Publisher’s Note: MDPI stays neutral with regard to jurisdictional claims in published maps and institutional affiliations.

