Article

Pesticide Use and Associated Greenhouse Gas Emissions in Sugar Beet, Apples, and Viticulture in Austria from 2000 to 2019

1
Institute of Zoology, Department of Integrative Biology and Biodiversity Research, University of Natural Resources and Life Sciences Vienna, Gregor-Mendel Straße 33, 1180 Vienna, Austria
2
Institute of Statistics, Department of Landscape, Spatial and Infrastructure Sciences, University of Natural Resources and Life Sciences Vienna, Peter-Jordan- Straße 82/1, 1190 Vienna, Austria
*
Author to whom correspondence should be addressed.
Agriculture 2022, 12(6), 879; https://doi.org/10.3390/agriculture12060879
Submission received: 25 May 2022 / Revised: 11 June 2022 / Accepted: 14 June 2022 / Published: 17 June 2022

Abstract

:
The production of synthetic pesticides is energy intensive and can emit even more greenhouse gases (GHG) per kg than the production of synthetic fertilizers. However, this aspect is largely neglected when it comes to agriculture’s contribution to GHG emissions. Using official pesticide sales data from Austria from 2000 to 2019, we analyzed (i) trends in insecticide, fungicide, and herbicide use and calculated production-related GHG emissions, and (ii) the share of pesticide-related versus fertilizer-related GHG emissions in three agricultural crops with different pesticide intensities: sugar beets, apples, and grapevines. We found that between 2000 and 2019, insecticide amounts increased by 58%, fungicide amounts increased by 29%, and herbicide amounts decreased by 29%; associated GHG emissions showed similar patterns. During the same period, acreage under conventional arable crops, orchards, and vineyards decreased by an average of 19%, indicating an increase in management intensity. In intensive apple production, GHG emissions associated with pesticide production and application accounted for 51% of total GHG emissions, in viticulture 37%, and in sugar beets 12%. We have shown that GHG emissions due to pesticide production and application can be significant, especially for pesticide-intensive crops. We therefore recommend that these pesticide-derived GHG emissions should also be attributed to the agricultural sector.

1. Introduction

Human-induced climate change (and the overall decline in biodiversity) are among the most pressing environmental problems of our time [1]. In terms of climate change, agriculture plays an important role, contributing about 17% of global greenhouse gas (GHG) emissions [2]. Looking at the food system as a whole, it accounts for as much as 37% of global annual greenhouse gas emissions. [3]. Moreover, agriculture is significantly impacted by climate change, as crop performance, biological control in agroecosystems, occurrence of neobiota, and soil health are altered by climate change [4,5,6,7,8,9].
A large body of literature addresses the impacts of pesticides on non-target biodiversity [10,11,12,13,14,15]. However, there are very few studies linking pesticide use to climate change and GHG emissions [16,17]. This negligence is surprising considering that the production of pesticides emits on average much more GHG per kg (6.3 kg CO2 kg−1) than the production of synthetic nitrogen-fertilizers (1.3 kg CO2 kg−1), which is known to be very energy intensive [16].
In Europe, agriculture is responsible for about 10% of total GHG emissions (438,994 MtCO2 in the year 2017), after the energy, transport, residential, and commercial sectors [18]. Therefore, reducing agricultural emissions could play an important role in achieving GHG reduction targets [4,19]. Indeed, such efforts have already been made, and the EU agricultural sector has already reduced its GHG emissions by 19% between 1990 and 2017 [18]. Other plans envisage achieving carbon neutrality of the entire economy by 2050 [20] or even as early as 2040, as formulated by Austria [21]. However, the calculations on which these targets are based generally do not take into account production-related GHG emissions from pesticides.
It is generally assumed that only a small fraction of CO2 emissions comes directly from agricultural production. CO2 from agricultural activities such as fuel for machinery or embedded in inputs such as fertilizer production and transport are rarely accounted for as agricultural emissions [22]. For example, fuel consumption on agricultural land is usually considered as energy or transport emissions in the Intergovernmental Panel on Climate Change (IPCC) accounting framework [4]. In Austria’s national GHG inventory, where agriculture accounts for 9.2% of total GHG emissions, pesticide-related GHG emissions are not attributed to the agricultural sector [23]. Moreover, not all pesticides used in Austria were produced domestically, and consumption-related emissions from products produced abroad are not included in national GHG emission inventories anyway [24]. As for the chemical industry, total production-related GHG emissions of bulk chemicals, such as formaldehyde or maleic anhydride, are quantified [25,26], but no emission data are available that can be attributed to pesticide active ingredients [23].
The objective of this study was to (i) determine long-term trends in insecticide, fungicide and herbicide use and pesticide-production-related GHG emissions, and (ii) determine the proportion of pesticide-related versus fertilizer-related GHG emissions in different agricultural crops: sugar beets, apples, and grapevines. Because pesticide use varies widely among agricultural crops, we expected differences in associated GHG emissions among crops with different pesticide intensities. Long-term (2011–2020) pesticide treatment frequencies for Germany show 4.0 pesticide applications per season for sugar beets, 18.1 for grapevines, and 30.8 for apple production [27]. Long-term data (2009–2018) for Switzerland show pesticide use (based active ingredients) of 5.9 kg ha−1 for sugar beets, 26.4 kg ha−1 for grapevines, and 25.7 kg ha−1 for apple production [28]. We based our analysis on official pesticide sales data from Austria for the period 2000–2019, using energy consumption data from life-cycle assessments for the pesticide production, storage, and distribution [16].
The results of this research will (i) provide an overview of long-term trends in pesticide use in a country (Austria) where organic farming acreage has increased from 20% in 2010 to 26% in 2019 [29], (ii) contribute to the EU mission on soil health targeting the reduction of soil pollution [30], and (iii) contribute to the European Green Deal, which aims to achieve sustainable agriculture, climate resilience, biodiversity and zero-pollution [31].

2. Materials and Methods

All calculations were based on official sales data of pesticide active ingredients (AI) in the period 2000–2019 published in the Green Report 2020 of the Austrian Federal Ministry of Agriculture, Regions, and Tourism [32]. In the absence of data on the actual pesticide use in the fields, we assumed that the AI sold correspond to the amounts used in Austria over the years. We are aware that stockpiling may lead to higher sales than use in certain years, but over the years a balance between sales and actual stockpiling can be expected [33]. Therefore, in the following chapters the amounts of AI sold will be referred to as the amounts applied.

2.1. Calculating Conventional Agricultural Area

The agricultural area was taken from the Austrian INVEKOS data (Integriertes Verwaltung- und Kontrollsystem/Integrated Administration and Control System) from 2000 to 2019 for arable land, orchards, and viticulture [32]. The conventional area was calculated by subtracting the organic area of these sectors from the respective total areas.

2.2. Calculating of Greenhouse Gas Emissions from Pesticide Production

All values for GHG emissions in kg CO2-equivalent emissions per kg pesticide AI are from Lal (2004) [16]. Accordingly, the mean values for herbicides were 6.3 ± 2.7 kg CO2-eq kg-AI−1, for insecticides 5.1± 3.0 kg CO2-eq kg-AI−1, and for fungicides 3.9± 2.2 kg CO2-eq kg-AI−1. These values were multiplied with the total annual amounts of the respective pesticide from 2000 to 2019, as provided in the Green Report 2020 [32]. Total insecticide amounts included seed treatment agents, such as acaricides, molluscicides, nematicides, and synergists, but did not include inert gases, petroleum, or paraffin oil. The amounts of sulfur and copper Ais were added to the amounts of the total fungicides and included seed treatment products and bactericides according to the classification in Annex III of the EU Regulation on Pesticide Statistics (EC 2009). Total herbicide amounts were taken from the Green Report 2020 without changes [32].
The calculated emissions for each year were summed to obtain the total cumulative GHG emissions from 2000 to 2019.

2.3. Carbon Footprint Calculations of Pesticides

The carbon footprint was calculated based on a farm’s pesticide use per ha for sugar beet, apples, and grapevines. Detailed crop-specific data on pesticide amounts were derived only for the year 2017 from the pesticide use statistics published by the Austrian Agency for Food and Public Health AGES [34]. Therefore, the agency collected pesticide use records from 940 farms (with an area of 28,200 ha) for the cultivation of the selected crops. The average amount of pesticide per area (kg AI ha−1) and the total amount in kg of AI used for conventional cultivation of sugar beets, apples, and grapevines were divided by the conventional area of each crop.
For our calculations, the amounts of pesticides used per ha in these crops were multiplied by the production-related (index PR) GHG emission values derived from Lal (2004) [16] and summed across all pesticide chemical classes (nCHEM CLASS). These were added to the application-related (index AP) emissions per ha, multiplied by treatment frequency, and summed across all applications (nAP), to obtain the emissions per ha and season for each crop (Equation (1):
Pest ·   GHG   e m i s s c r o p   x ha   ·   season = [ n   c h e m   c l a s s A m o u n t c h e m .     c l a s s a r e a c r o p   x   * k g   C O 2   e q P R k g c h e m .   c l a s s ] + [ n   A P k g   C O 2   e q A P h a * T r e a t m e n t   f r e q u e n c y s e a s o n ]
Figure 1 provides an overview of the data sources and carbon footprint calculations used in the current study.
The data on pesticide emissions were again from Lal (2004) [16], but this time the more detailed kg CO2-equivalent emissions listed for specific herbicides, insecticides, and fungicides were also assigned to the respective chemical classes of pesticides used in 2017 for each crop according to the AGES use statistic. The chemical classes of pesticides listed in the AGES use statistic are listed in Table 1. The group “other insecticides and acaricides” in these use statistics may also include inert gases and was excluded in the current analysis. This may underestimate actual GHG emissions from insecticides. In addition, molluscicides were added to the insecticide group, as was done by AGES [32].
Unfortunately, AGES only provided us with detailed sales data for herbicides. Therefore, only for herbicides could we more precisely assign GHG emission values to individual AIs rather than chemical classes (Supplementary Table S1). However, in the per-crop use statistics, herbicide amounts are only reported at a more aggregated level. Table 1 provides an overview of the assigned emission values and average dosages per ha for each crop.

2.4. Carbon Footprint Calculations of Fertilizers

The production-related GHG emissions ha−1 of fertilizers were calculated using crop-specific amounts ha−1 multiplied by the average kg CO2-equivalent emissions per kg fertilizer [16]. The amounts per ha of nitrogen, phosphorus, potassium, and lime fertilizers for each of the three crops studied were derived from recommendations for Austrian farmers (Table 1; Equation (2)).
Fert ·   GHG   e m i s s c r o p   x ha   ·   season = [ n   f e r t A m o u n t f e r t h a   * k g   C O 2   e q P R k g f e r t ] + [ n   A P k g   C O 2   e q A P h a * T r e a t m e n t   f r e q u e n c y s e a s o n ]
For sugar beet cultivation, recommendations for maintenance fertilization were chosen (supply level C of soil nutrients) and medium yield expectations, with the dosage for N-fertilization averaging 110–140 kg ha−1. The N-, P-, and K-fertilization was taken from the official guidelines of the Federal Ministry of Agriculture, Forestry, Environment and Water resources (BMLFUW) [35], while the CaO ha−1 recommendation was taken from an agricultural consultant [36].
For apple production, the recommendations for maintenance fertilization (soil supply level C to achieve an average yield of 40–50 t ha−1) were taken from the BMLFUW guidelines [37]. For lime, maintenance fertilization is recommended every three years at a rate of 600–800 kg CaO ha−1 for light soils and 1000–1500 kg CaO ha−1 for heavy soils [37]. For these two soil types, a mean value of 1025 kg CaO ha−1 was calculated, which is recommended every three years, resulting in 341.7 kg CaO ha−1 year−1.
For grapevine, recommendations were chosen for topsoil maintenance fertilization (supply level C, open soil), medium shoot growth, and medium yields [38]. For liming, there are different recommendations depending on the soil type; the recommendations for CaO application every three years (for light soil: 1750 kg ha−1, medium soil: 1550 kg ha−1, heavy soil: 3750 kg ha−1) [38] were averaged to obtain the mean value of 2350 kg ha−1 for all soil types, giving 783.3 kg CaO ha−1.
The average production-related kg CO2-eq emissions per kg of fertilizer were taken from Lal (2004) [16] and are also shown in Table 1. Other GHG emissions such as nitrous oxide (N2O) from the applied N fertilizer or from liming (CO2 emissions when limestone is used) were not considered [23].

2.5. Carbon Footprint of Pesticide and Fertilizer Application

The data on average fuel consumption in liters per ha for the application of pesticides and fertilizers to sugar beets, apples, and grapevines were taken from a publication of the Austrian Trustees for Agricultural Technology and Rural Development [39] and converted into kg CO2-equivalents using the carbon emission coefficient according to Lal (2004) [16]. It was assumed that diesel fuel is used for the application.
According to Lal (2004) [16], one kg of diesel corresponds to 0.94 kg CO2-equivalent emissions. To obtain the kg CO2-equivalent emissions per liter of diesel, one liter of diesel was converted to kg using the arithmetic mean of the density range of diesel at 15 °C according to DIN EN 590 (820–845 kg m−3). One liter multiplied by an average density of 832.5 kg 1000 L−1 resulted in 0.8325 kg (equivalent to the mass of one liter of diesel). This kg value was then multiplied by the carbon emission coefficient of 0.94 kg CO2-eq kg−1 of diesel [16], which resulted in 0.78255 kg CO2-eq emissions released from the combustion of one liter diesel. The kg CO2-eq emissions L−1 of diesel were multiplied by the fuel consumption in L ha−1 for each relevant process step [39] to obtain the kg CO2-equivalent emissions per ha (Table 2).
No fuel consumption data were available for application methods other than spraying, so we assumed that all pesticides were applied by spraying. Granular application, seed treatments of fungicides, insecticides, and emissions from possible mechanical incorporation of herbicides into the soil [40] and foliar fertilization were not considered.
All these resulting application-related GHG emissions ha−1 were finally multiplied by the respective treatment frequency (number of applications) per season (Table 2) to obtain the final value of emissions per ha caused by annual application. It was assumed that all types of pesticides (insecticides, molluscicides, fungicides, and herbicides) were applied separately and all types of fertilizers were applied separately.
Treatment frequencies for crops in combination with each pesticide type have been published by the German Julius-Kühn-Institute based on several years of data collection in Germany [27]. Treatment frequency is defined as the number of applications of pesticides to produce a crop in relation to its respective acreage. A treatment frequency of 1 means that the entire cultivated area was treated once, while a treatment frequency <1 means that only parts of the total area were treated with the respective pesticide.
Since such data are not available for Austria, we assumed similar production conditions and treatment frequencies in Austria. These annual treatment frequencies were averaged over all years with uniform data collection for each crop and each type of pesticide.
The treatment frequencies of fertilizers per year was derived from the recommendations for the individual crops. Sugar beets are fertilized 2 times per season with N, 1–2 times (mean: 1.5 times) with P- and K- fertilizers and 2–3 times (mean: 2.5 times) with lime (Upper Austrian Sugar Beet Association, personal communication). The annual fertilization frequencies for apple cultivation are taken from the guidelines of the BMLFUW for N [37] and for all other fertilizer types from guidelines of Swiss and German orcharding institutions [41]. The treatment frequencies for grapevines were taken from the Austrian Winegrowers’ Association [42]. All treatment frequencies are also listed in Table 2.

2.6. Statistical Analysis

Simple linear regression models (LM) were run using R-Studio software (R 3.0.1+ and R-Studio Desktop 1.4.1717; The R Foundation for Statistical Computing; http://www.R-project.org, accessed on 20 May 2022) to determine if pesticide levels and associated production-related GHG emissions show significant trends over the years. The significance level was set at 0.05. For each LM, the homoscedasticity of the residuals was assessed using the “residuals vs. fitted”-plots, and the normal distribution of the residuals was checked using qq-plots.

3. Results

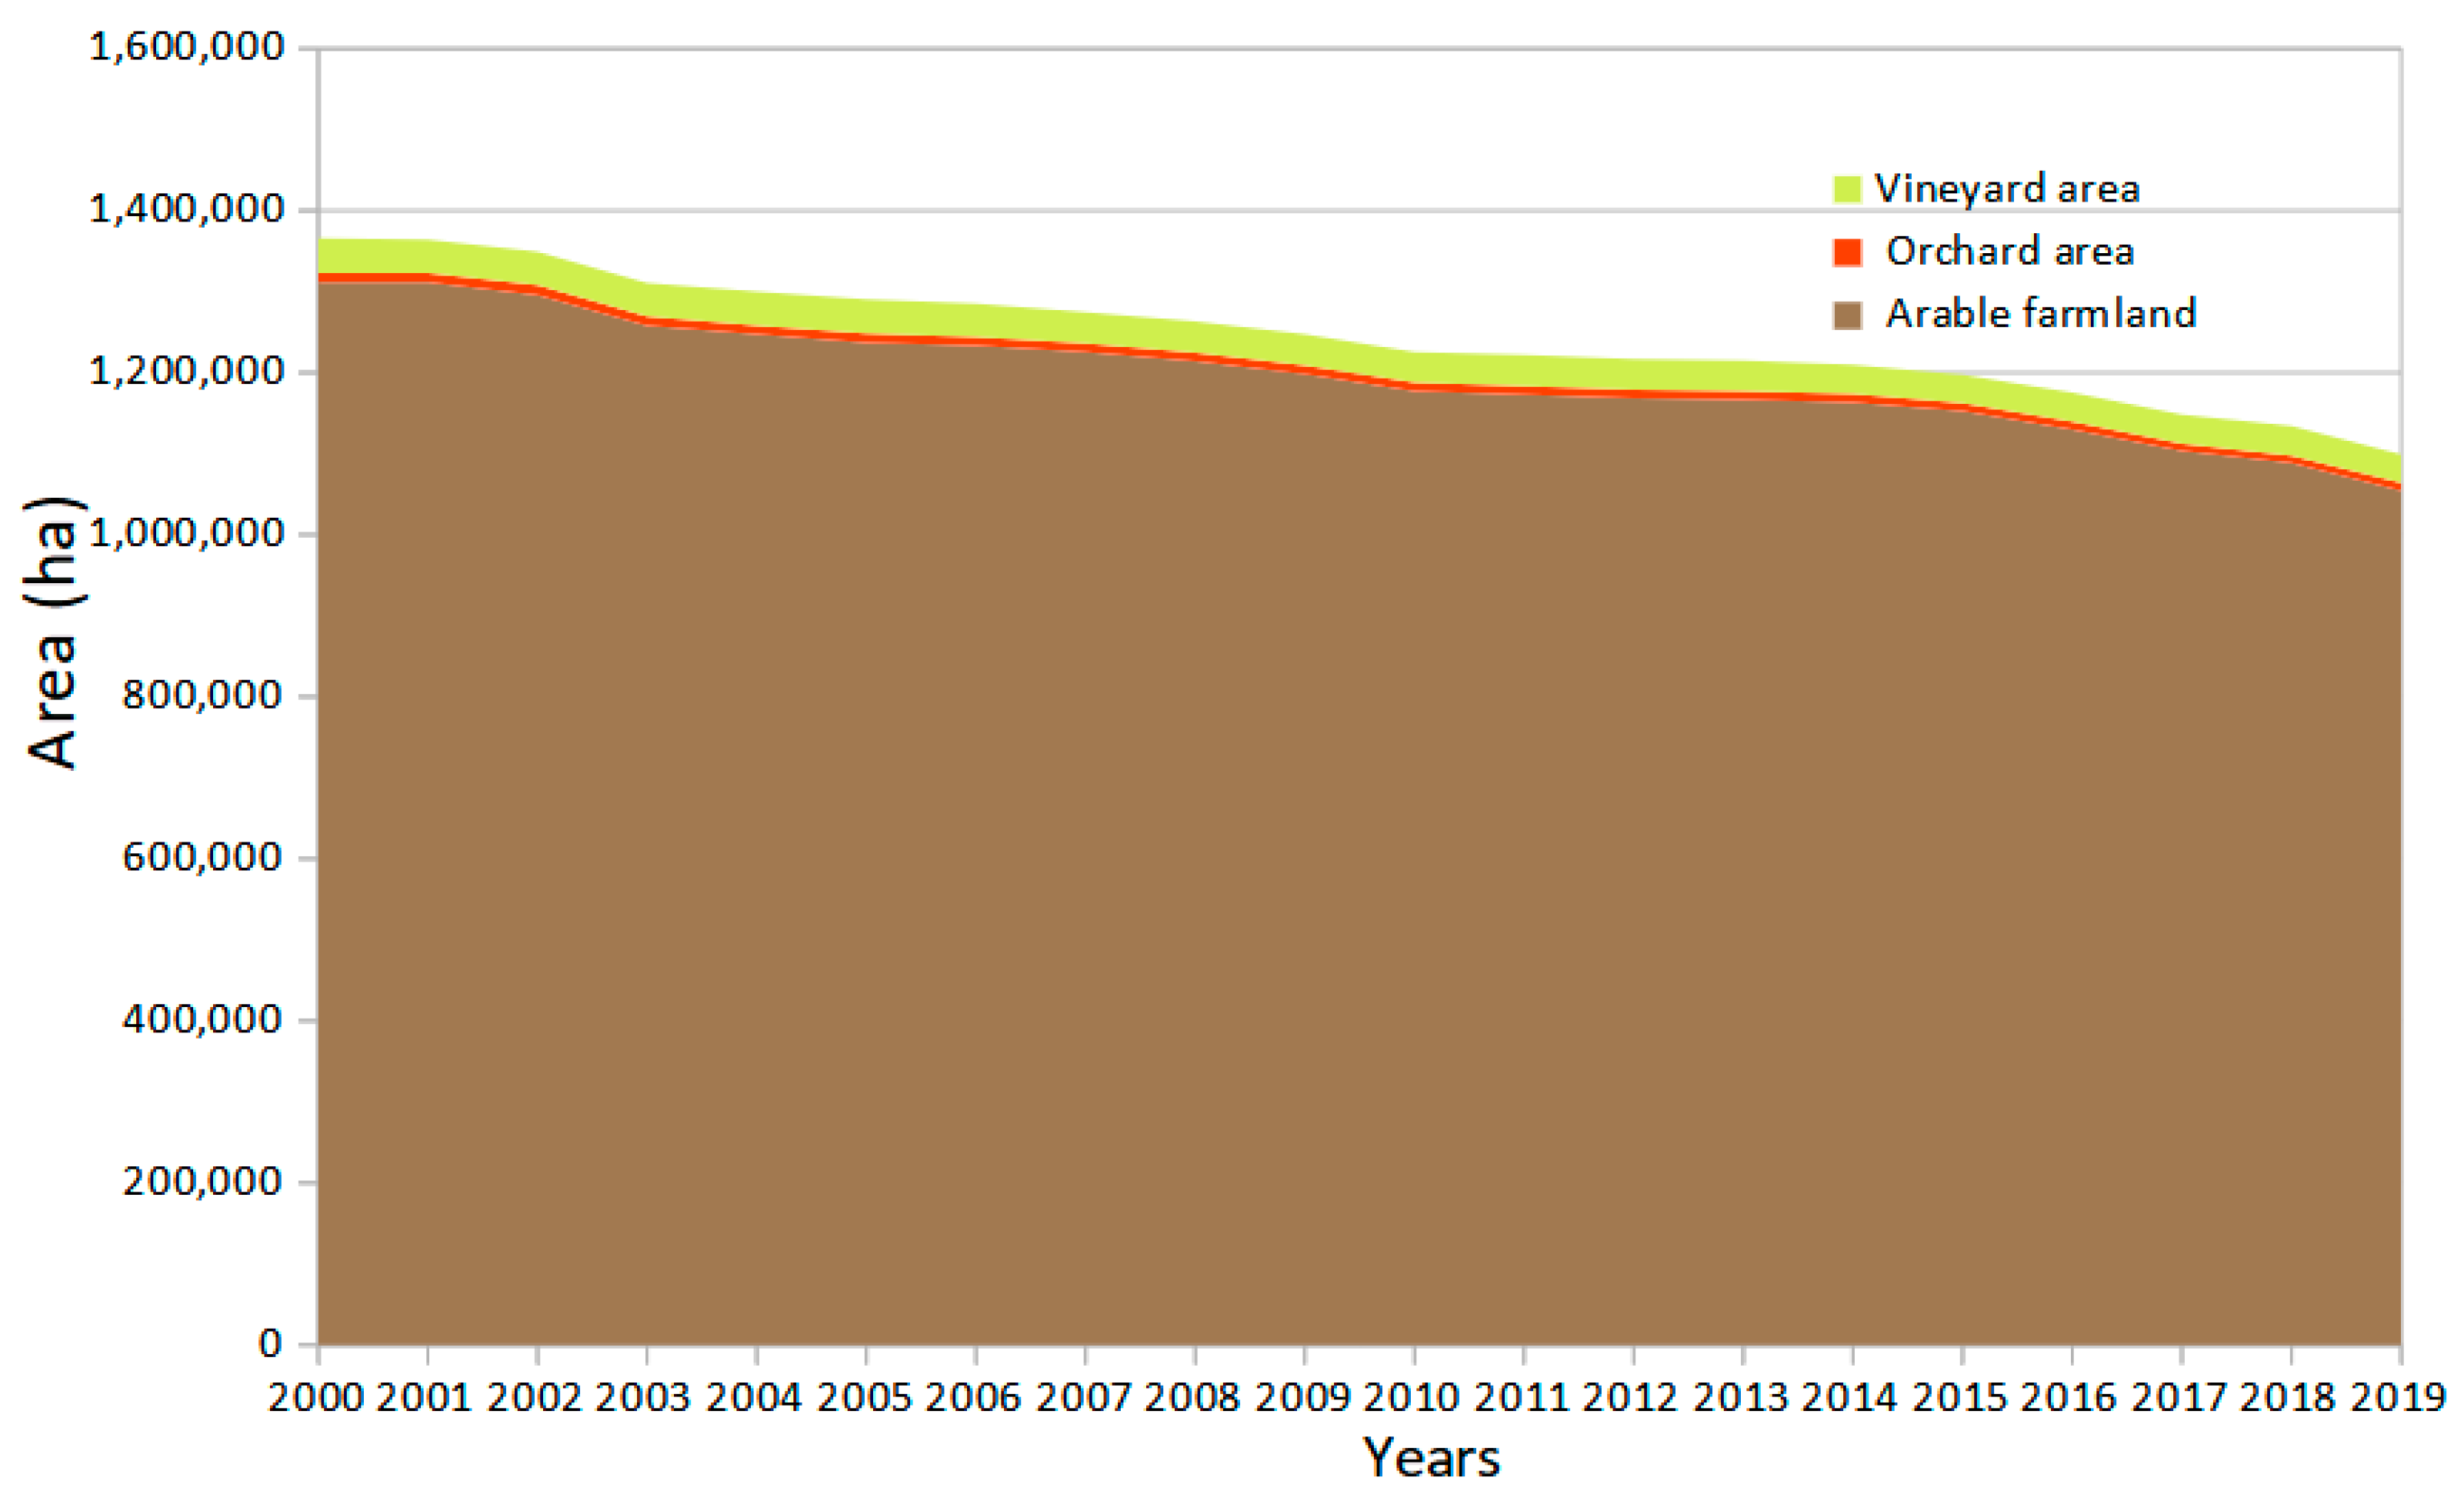
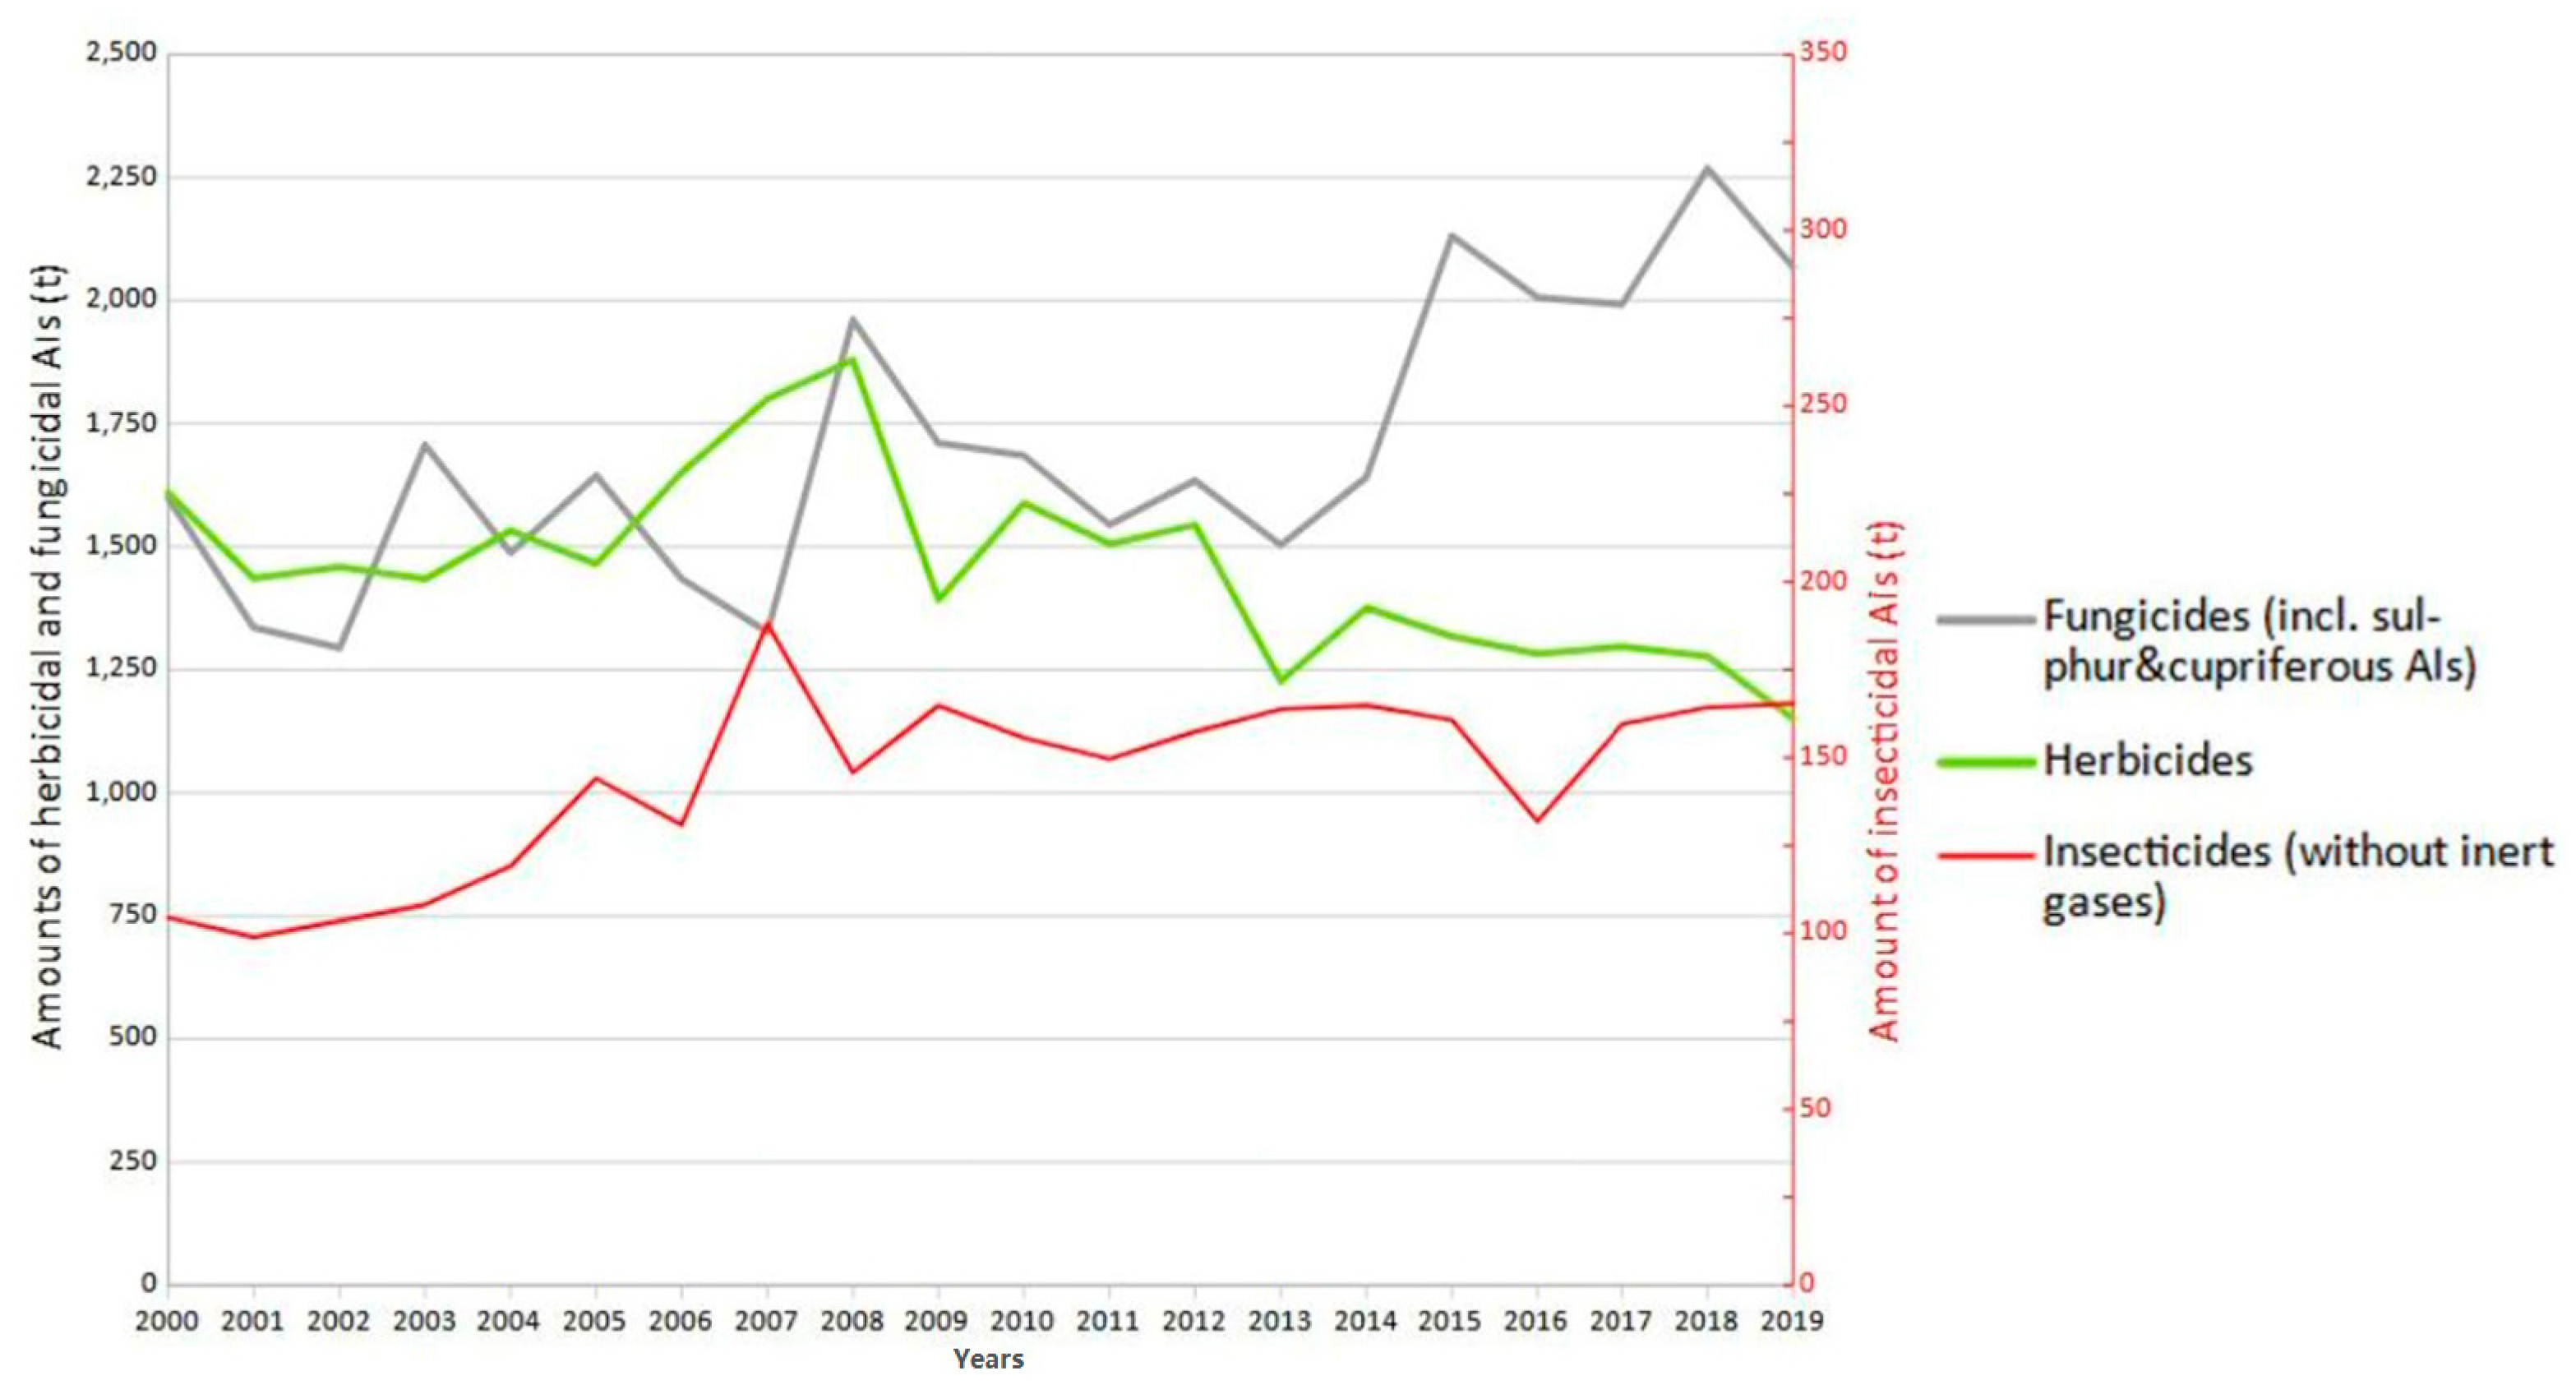
3.1. Trends in Farmland Area and Pesticide Use 2000–2019

Conventional arable, orchard and vineyard area decreased significantly between 2000 and 2019 (Figure 2, Table 3). The largest decreases were observed for orchards (−22%), followed by arable land (−20%) and viticulture (−16%).
Total pesticide use increased marginally significantly by 2.2%, with insecticide use increasing by 58%, fungicide use increasing by 29% and herbicide use increasing by 29% (Figure 3, Table 3).

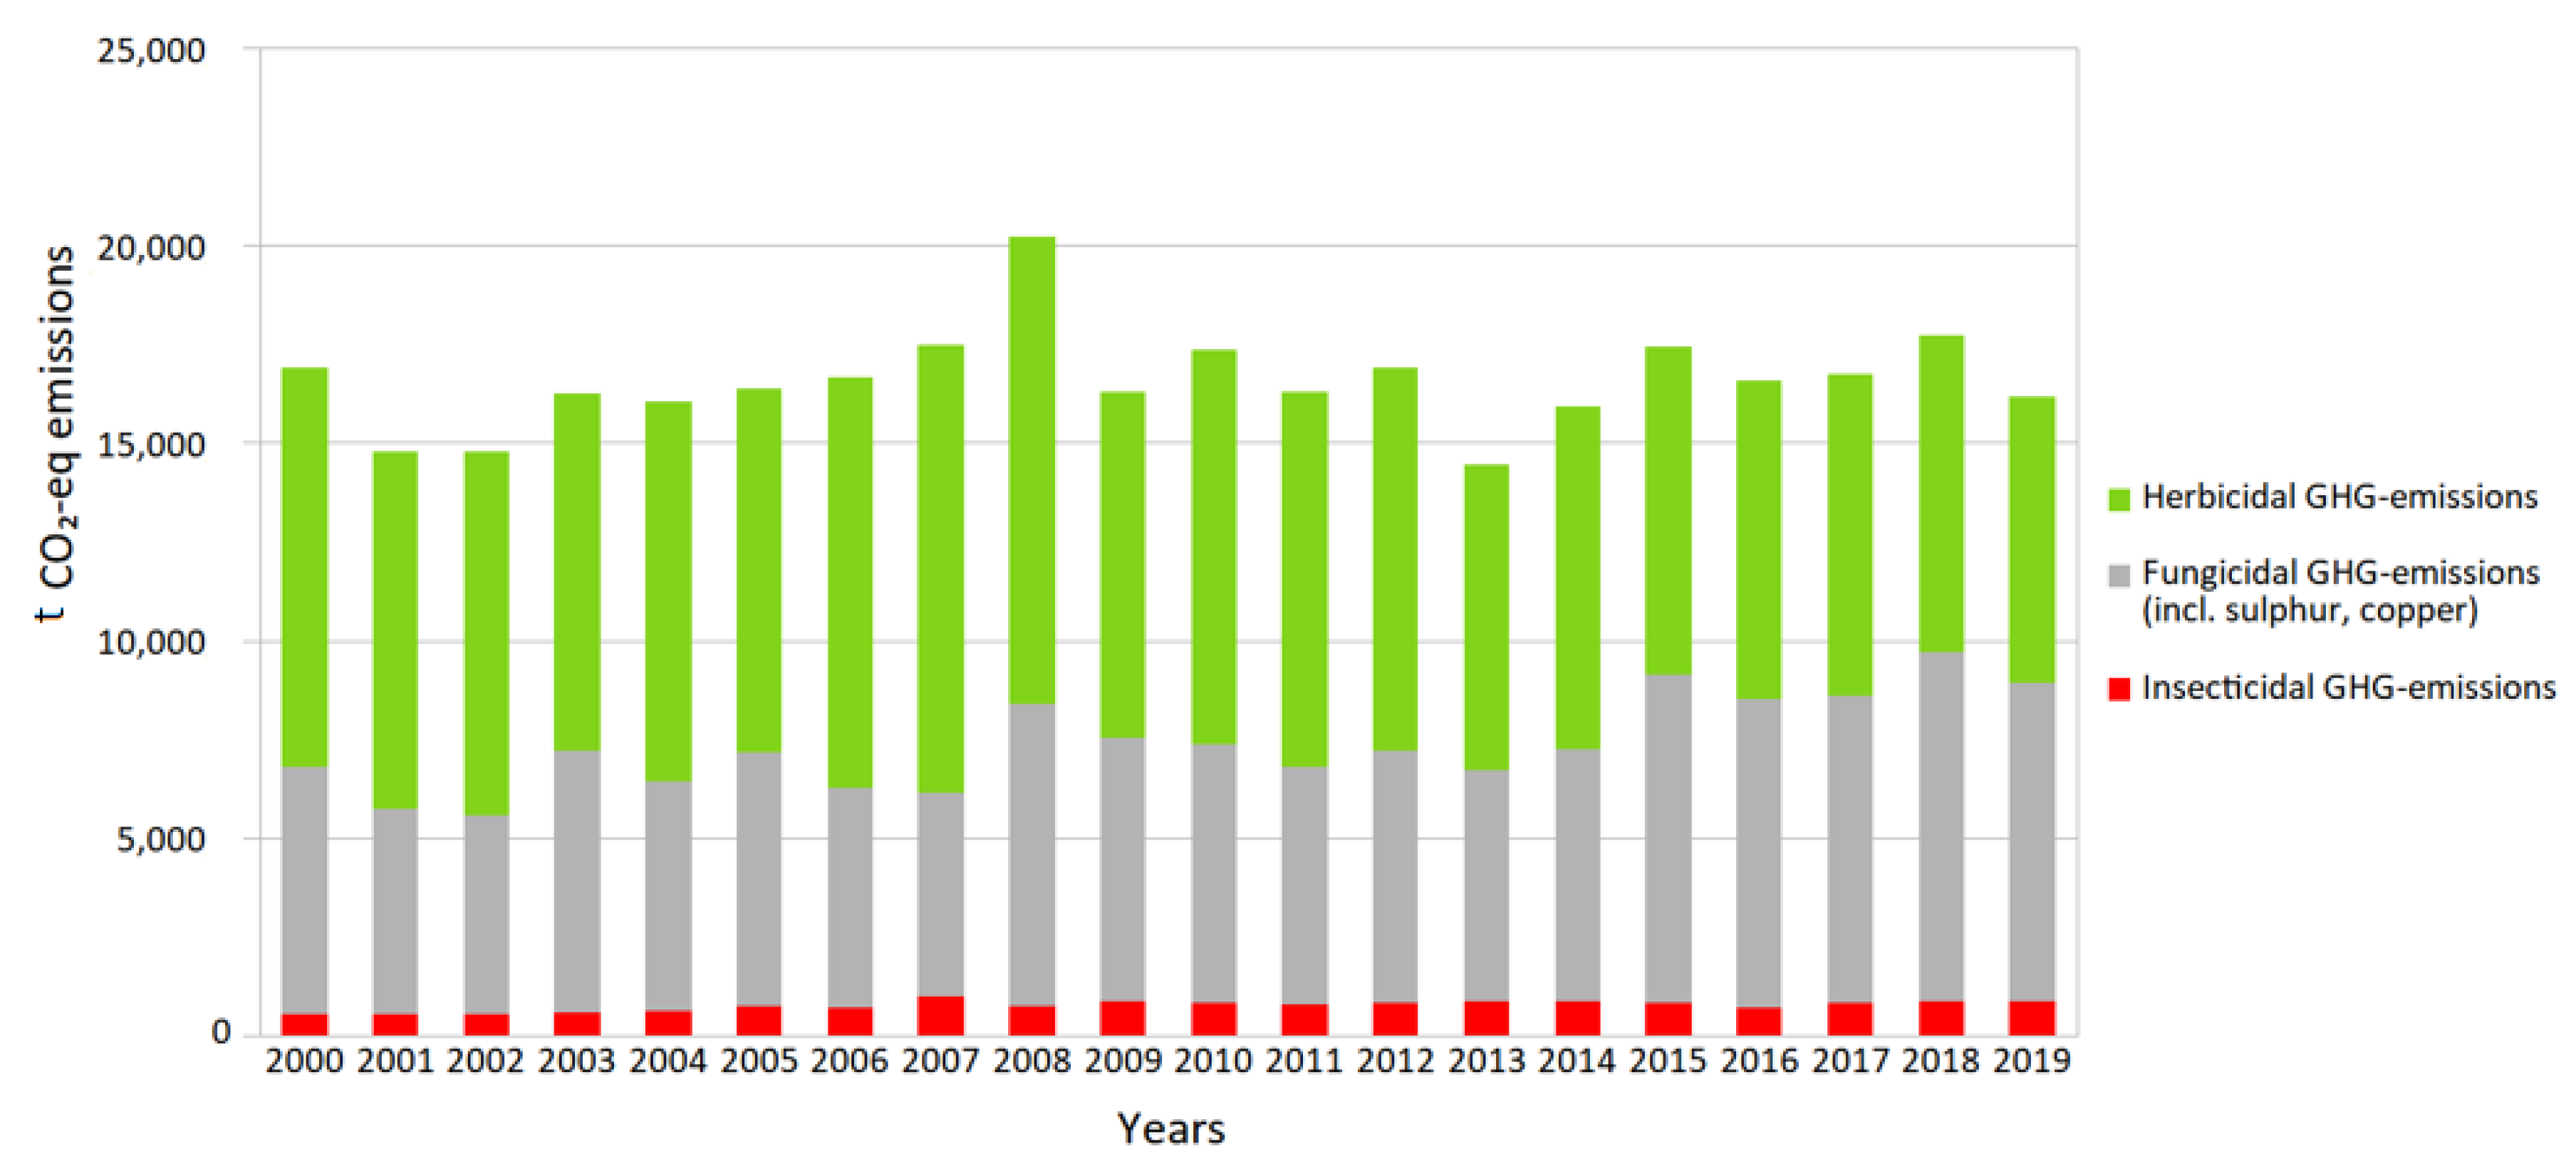
3.2. Production Related Pesticide GHG Emissions between 2000 and 2019

The average production-related GHG emissions of insecticide and fungicide AIs increased significantly from 2000 to 2019, as did their respective amounts, while those of herbicide AIs decreased significantly. Herbicide AIs dominated the total production-related GHG emissions from pesticide production in Austria until 2017 (except 2015), before being overtaken by fungicide AIs (Figure 4).
However, total pesticide GHG emissions did not show significant changes as herbicides, the group with the highest GHG-emissions, declined (Table 4).
The cumulative production-related GHG emissions from pesticides between 2000 and 2019 totaled 331,279,525 kg CO2-eq emissions (331.28 kt), of which herbicides accounted 55.6%, fungicides for 40.0%, and insecticides for 4.4%.

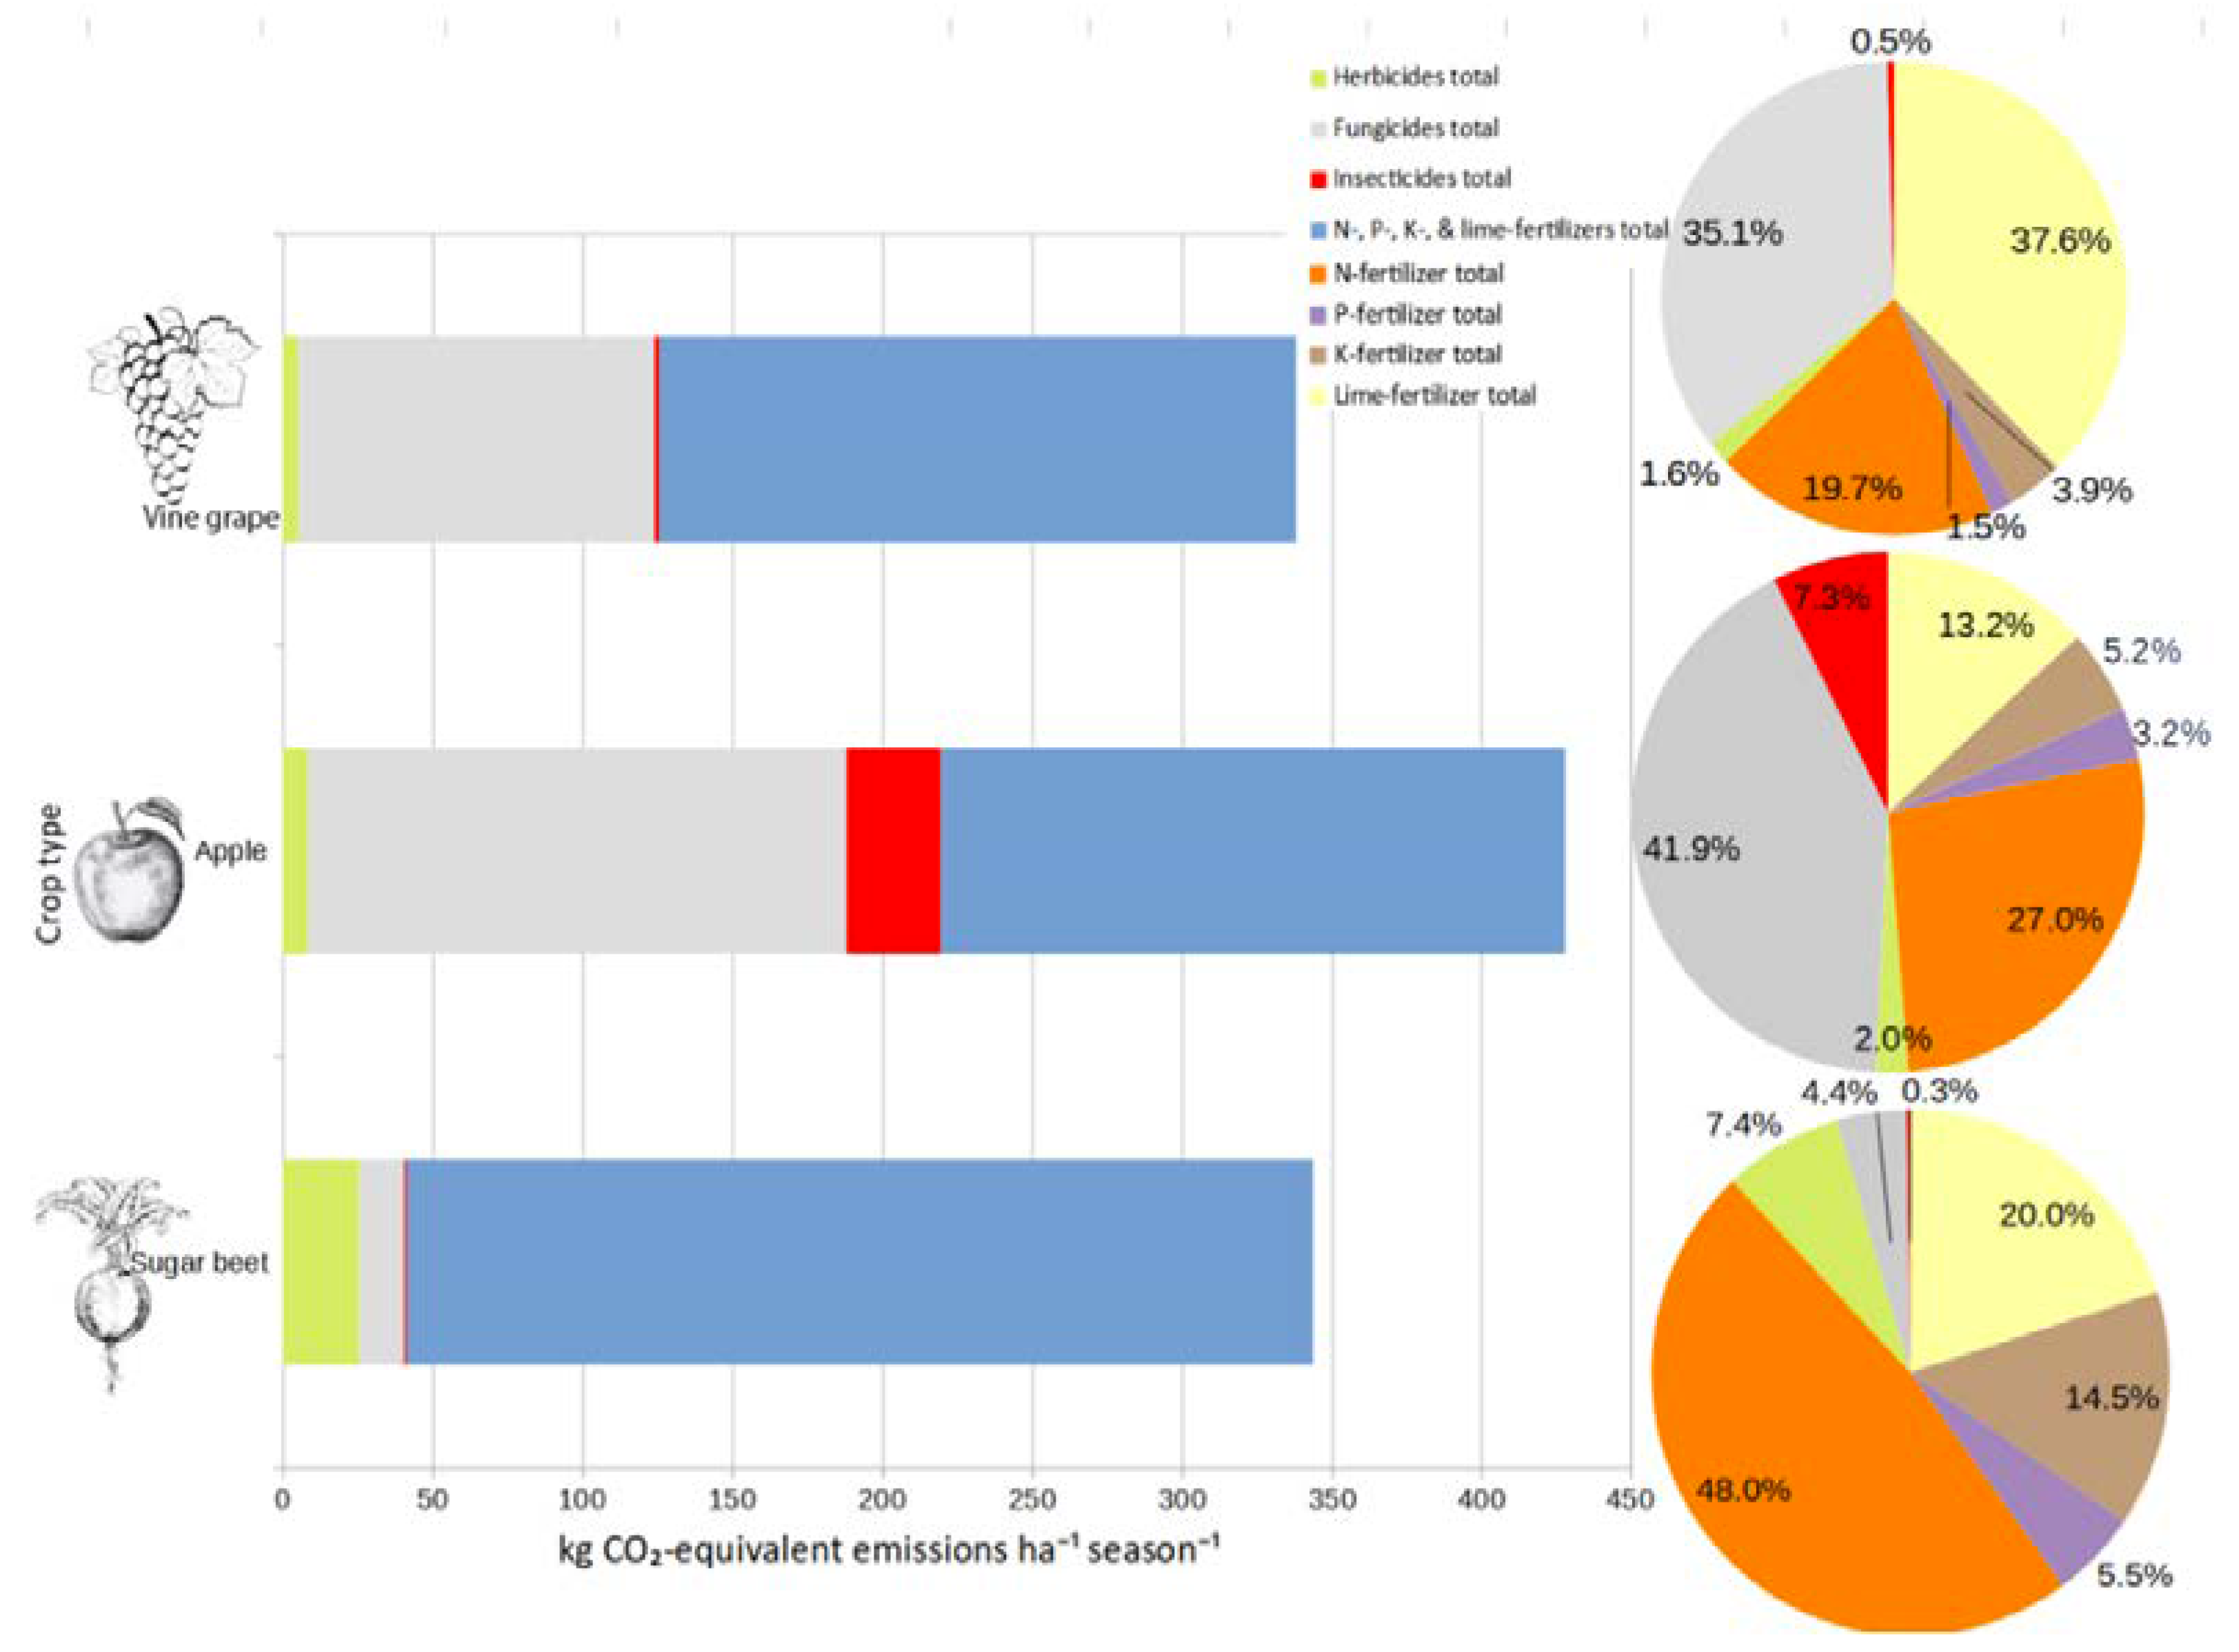
3.3. Carbon Footprint of Pesticide and Fertilizer Usage per ha

Total GHG emissions for 2017 were highest for apple production and lowest for sugar beet production (Figure 5). The highest average GHG emissions per ha resulting from fertilizer and pesticide use in apple production were about 428 kg CO2-eq ha−1 season−1 (dominated by fungicide use), followed by sugar beet production with 344 kg CO2-eq ha−1 season−1 (dominated by fertilizers) and grapevine production with 338 kg CO2-eq ha−1 season−1 (also dominated by fertilizers).
For apple production, total pesticide-related GHG emissions (production + application) accounted for 51% of the total emissions (including pesticides and fertilizers). For sugar beet, pesticide-related GHG emissions accounted for 12% of total GHG emissions, and for grapevines, 37%. Consequently, fertilizer-related emissions dominated sugar beets with 88% of total GHG emissions, followed by grapevines with 63% and apples with 49%. Total fertilizer-related emissions were highest in sugar beet production (about 302 kg CO2-eq ha−1 season−1), followed by grapevines (about 212 kg CO2-eq ha−1 season−1) and apples (about 209 kg CO2-eq ha−1 season−1).
In sugar beet production, GHG emissions from insecticide use dominated the average emissions in 2017, driven by GHG-intensive emissions from neonicotinoids and pyrethroids (Table 5). For fungicides, production-related emissions from inorganic fungicides dominated as significantly as their use, while more GHG-intensive classes such as the benzimidazoles were used to a lesser extent. Triazines and triazinones contributed the most to GHG emissions from herbicides due to their high use in sugar beets, followed by emissions from application due to the need for multiple treatments. The energy-intensive class of organophosphates accounted for the third largest share. In general, insecticides accounted for a fairly small proportion of total pesticide emissions in sugar beet, while herbicide emissions clearly dominated, followed by fungicides.
In apple production, total pesticide-related GHG emissions per ha were dominated by fungicides, followed by insecticides, while herbicides played only a minor role. Emissions from insecticides and fungicides were dominated by application-related emissions due to a high treatment frequency, while organophosphate production led emissions from herbicides, followed by application-related emissions. Emissions from inorganic and other organic fungicides ranked second and third, respectively, among fungicide emissions.
In viticulture, emissions of fungicides were also higher than those of insecticides and herbicides. Application-related emissions accounted for the largest share of insecticide emissions because relatively small amounts of organophosphates and pyrethroids were used. Commonly used inorganic fungicides were the largest contributor to fungicide GHG emissions, ahead of application-related emissions from other organic fungicides. For GHG emissions from herbicides, production- and application-related emissions from organophosphates accounted for the largest share.

4. Discussion

To our knowledge, this is one of the first long-term, nationwide assessments of pesticide-related GHG emissions for crops with different pesticide intensities. Our results showed that while GHG emissions per kg are much higher for pesticide production than for fertilizer production, the higher fertilizer application rates per ha result in higher GHG for the compared crops. This was also found in some other studies on this topic [16,17]. Nevertheless, the three crops differed significantly in terms of the share of pesticide-related GHG emissions: 51% of total GHG emissions in apple production resulted from pesticides, 37% in grapevines, and 12% in sugar beets. Other studies show a share of production-related pesticide emissions in the total emissions of 1.1% for silage maize and 9.3% for early potatoes [17]. The share of pesticide emissions is particularly high in apple and wine production, where many pesticides are used and frequently applied.
The highest average herbicide use was found in sugar beet, while fungicides dominated in viticulture and apple production, and insecticide use was highest in apple production. This is also consistent with the Swiss agricultural report [28]. Energy consumption per ha of herbicide production exceeded that for all other pesticide types in sugar beet production [17]. Reducing pesticide use would have the positive side effect of reducing toxic exposure not only in the field, but also in ambient air and non-agricultural areas [44,45,46,47,48,49]. We assume that the pesticide-related GHG emissions we reported for sugar beet are higher for wheat but lower for maize, because the corresponding mean pesticide treatment frequency indices are higher for wheat (5.3 vs. 4.0 for wheat vs. sugar beet, respectively) and lower for maize (1.9 vs. 4.0 for maize vs. sugar beet, respectively; mean values 2011–2020 for Germany [27]).
While average herbicide use and its production-related GHG-emissions decreased overall, insecticides and fungicides and their GHG emissions continued to increase in Austria between 2000 and 2019. Since both the agricultural production area for arable land, apple cultivation, and viticulture decreased and the area of organic farming increased, this indicates an intensification of pesticide use in the remaining areas [44]. Although GHG emissions from herbicide use are declining in Austria, the inherent high GHG intensity should motivate users to further reduce application rates, which may track both EU GHG emission and pesticide reduction targets under the Green Deal [31].
When it comes to replacing herbicides, weed control methods with low GHG intensity should be preferred. Comparing the carbon footprint of mechanical and chemical weed control is beyond the scope of this study and therefore an opportunity for future research. However, energy consumption is somewhat higher for some crops such as potatoes or winter wheat [50]. A life cycle assessment concludes that GHG emissions for mechanical weed control are slightly higher than chemical weeding [51]. The potentially increased soil CO2 emissions from soil respiration after mechanical weeding at shallow working depths (e.g., harrowing or hoeing at 2–3 cm depth) in sugar beets [52]), may be negligible, but this aspect has hardly been studied. Yet, organically managed soils with mechanical weed control are associated with lower emissions of GHG emissions [53]. Herbicides can alter soil GHG fluxes by affecting soil microorganisms [54], promoting CO2 emissions, and reducing N2O emissions [55]. Emissions from mechanical weed control can be reduced by choosing less GHG-intensive alternative inputs, shallower working depths, and more efficient tractor technology [56]. Mechanical lightweight weeding robots instead of herbicides can also reduce GHG emissions, benefit biodiversity, and prevent herbicide resistance [57]. There are several non-chemical, preventive weed control measures [58] such as a diversified crop rotation, which can reduce the need for herbicides [59], while cover crops and mulching can both suppress weed emergence and promote soil biota [60,61,62]. The environmental impacts of mechanical weed control compared to chemical weed control varies by crop type (mechanical weed control performs best in oilseed rape and maize) and herbicides used, but in every case it is superior in terms of toxic burden to humans and the environment [44,63]. In addition to a reduction in herbicide use, large annual GHG emissions can also be saved, e.g., in soybean production in the USA by biological pest control instead of insecticides [64].
Limitations to the GHG emission calculations in the present study include that the GHG-intensities of the extracted AIs are based on relatively old studies [16]. There is a possibility that production processes today are more efficient and less GHG intensive, which would lead to an overestimation of the calculated GHG emissions. New life-cycle assessments for current pesticide AI production could provide more up-to-date emissions data. Underestimation of actual GHG emissions due to pesticide use could result from considering only AI production, which is often only a small percentage of the formulated pesticide product [15,65], while neglecting the production of other components of commercial formulations. In any case, all calculated GHG emissions can only be interpreted as estimated average emissions because only average GHG intensities per pesticide type were used and average emissions from AIs were assigned to chemical classes in the absence of more accurate AI-specific use data in the carbon footprint calculation.
The carbon footprint calculations were made on the basis on many simplifications and averaged data. A life cycle assessment based on a real farm, for which all inputs are known, would provide more accurate results. However, we are not aware that such a comprehensive life cycle assessment has been conducted. Fertilizer dosages vary depending on the soil on site and its nutrient situation [35], so the associated emissions also vary greatly by site. Pesticide levels also change depending on pest and disease pressure, and weather conditions [8,9]. Because we assumed that pesticides and fertilizers were applied separately and not as mixtures [66], we overestimated application-related emissions. GHG emissions other than production- and application-related emission were not considered, so the actual proportion of N fertilizer emissions is likely to be higher due to N2O emissions in the field (high global warming potential), which would reduce the proportion of pesticides in total emissions. If limestone (CaCO3) is used for liming, CO2 emissions in the field are possible [23]. Potential soil emissions that change with the use of herbicides [55] were also not considered and need further investigation.
As in many European countries, the data situation and transparency of pesticide use in Austria is weak due to data and trade security issues of pesticide manufacturers [67]. Publicly available spatial information on pesticides is completely lacking in Austria. This is in contrast with, e.g., the UK and Ireland, where even the treated area for each applied AI is available via an online database [68]. Maps of the different toxic loads of pesticides on treated areas are also available in the USA [69].
Since climate change and warming in Austria have already increased about twice as much as the global average since 1880 [70], all feasible steps to further reduce GHG emission seem imperative. Reducing pesticide use would have numerous benefits in addition to reducing GHG emissions [71], including positive effects on biodiversity above and below ground [12,72,73] and reducing pesticide contamination of ambient air [47,48]. It should be noted, however, that focusing exclusively on reductions of pesticide amounts may overlook a shift to lighter but more toxic and more persistent substances [44,47,74,75,76].

5. Conclusions

Our analyses show that the total amount of pesticides and the associated GHG emission for fungicides and insecticides in Austria have increased over the last two decades. To achieve the European targets of reducing the use of pesticides, further consistent steps seem inevitable. Further reduction of GHG emissions could be achieved by combining working steps, by applying fertilizer and pesticide mixtures. However, such combinations could also lead to synergistic effects between pesticides and increase the toxic risk to non-target species [77,78,79]. A simple way to reduce GHG emissions would be to eliminate the use of herbicides, as organic farming successfully demonstrates that farming without herbicides is economically feasible [63]. In any case, more accurate production- and use-related data would be needed to allow for a more accurate calculation of GHG emissions [67].
Based on our findings, we recommend that production-related GHG emissions from pesticides also be allocated to the agricultural sector in official statistics and reported separately alongside other sources of GHG emissions such as manure management and enteric fermentation. This would raise public awareness of the often-neglected GHG intensity of pesticide production. In addition, farmers seeking to reduce their GHG emissions could be encouraged to consider pesticide reduction as a mitigation measure, with the side benefit of preserving biodiversity.
Although pesticides are a smaller contribution to GHG emissions compared to fertilizers, there is great potential for emissions savings, especially for pesticide intensive crops. Alternative crop protection measures, especially preventive measures such as diverse crop rotations, cover crops, and mixed crops, which benefit both climate change mitigation and biodiversity and increase soil carbon stocks, should be more widely used [80]. Climate change and biodiversity loss are interlinked and cannot be considered separate problems; solutions must address both issues simultaneously.

Supplementary Materials

The following supporting information can be downloaded at: https://www.mdpi.com/article/10.3390/agriculture12060879/s1.

Author Contributions

Conceptualization, R.C. and J.G.Z.; methodology, R.C.; validation, R.C., J.G.Z.; formal analysis, R.C., F.L.; investigation, R.C.; data curation, R.C.; writing—original draft preparation, R.C.; writing—review and editing, R.C. and J.G.Z.; visualization, R.C.; supervision, J.G.Z.; project administration, J.G.Z.; All authors have read and agreed to the published version of the manuscript.

Funding

This research received no external funding.

Institutional Review Board Statement

Not applicable.

Informed Consent Statement

Not applicable.

Data Availability Statement

The original data on pesticide sales on which the calculations are based cannot be provided for data protection reasons. All other data are listed in the Supplementary Materials to this paper.

Acknowledgments

We thank the Austrian Federal Agency of Food Safety and Health (AGES) for providing detailed sales data. Thanks also to Yoko Muraoka and Edith Gruber, Institute of Zoology, BOKU Vienna, for administrative and technical support.

Conflicts of Interest

The authors declare no conflict of interest.

References

  1. Bradshaw, C.J.A.; Ehrlich, P.R.; Beattie, A.; Ceballos, G.; Crist, E.; Diamond, J.; Dirzo, R.; Ehrlich, A.H.; Harte, J.; Harte, M.E.; et al. Underestimating the Challenges of Avoiding a Ghastly Future. Front. Conserv. Sci. 2021, 1, 615419. [Google Scholar] [CrossRef]
  2. FAO. Emissions due to Agriculture. Global, Regional and Country Trends 2000–2018. FAOSTAT Analytical Brief Series No 18. Rome. 2020. Available online: https://www.fao.org/3/cb3808en/cb3808en.pdf (accessed on 20 May 2022).
  3. IPCC. Climate Change and Land: An IPCC Special Report on Climate Change, Desertification, Land Degradation, Sustainable Land Management, Food Security, and Greenhouse Gas Fluxes in Terrestrial Ecosystems; IPCC: Geneva, Switzerland, 2019. [Google Scholar]
  4. Lynch, J.; Cain, M.; Frame, D.; Pierrehumbert, R. Agriculture’s Contribution to Climate Change and Role in Mitigation Is Distinct from Predominantly Fossil CO2-Emitting Sectors. Front. Sustain. Food Syst. 2021, 4, 518039. [Google Scholar] [CrossRef] [PubMed]
  5. Reidsma, P.; Ewert, F.; Lansink, A.O.; Leemans, R. Adaptation to climate change and climate variability in European agriculture: The importance of farm level responses. Eur. J. Agron. 2010, 32, 91–102. [Google Scholar] [CrossRef]
  6. Vries, G.E.D. Climate changes leads to unstable agriculture. Trends Plant Sci. 2000, 5, 367. [Google Scholar] [CrossRef]
  7. Piao, S.; Ciais, P.; Huang, Y.; Shen, Z.; Peng, S.; Li, J.; Zhou, L.; Liu, H.; Ma, Y.; Ding, Y.; et al. The impacts of climate change on water resources and agriculture in China. Nature 2010, 467, 43–51. [Google Scholar] [CrossRef]
  8. Tabi Tataw, J.; Baier, F.; Krottenthaler, F.; Pachler, B.; Schwaiger, E.; Wyhlidal, S.; Formayer, H.; Hösch, J.; Baumgarten, A.; Zaller, J.G. Climate change induced rainfall patterns affect wheat productivity and agroecosystem functioning dependent on soil types. Ecol. Res. 2016, 31, 203–212. [Google Scholar] [CrossRef]
  9. Zaller, J.G.; Simmer, L.; Santer, N.; Tabi Tataw, J.; Formayer, H.; Murer, E.; Hösch, J.; Baumgarten, A. Future rainfall variations reduce abundances of aboveground arthropods in model agroecosystems with different soil types. Front. Environ. Sci. 2014, 2, 44. [Google Scholar] [CrossRef] [Green Version]
  10. Anton, C.; Mengel, J.; Mupepele, A.C.; Steinicke, H. Biodiversität und Management von Agrarlandschaften: Umfassendes Handeln Ist Jetzt Wichtig. Statement. Available online: http://nbn-resolving.org/urn:nbn:de:gbv:3:2-127275 (accessed on 4 June 2021).
  11. Geiger, F.; Bengtsson, J.; Berendse, F.; Weisser, W.W.; Emmerson, M.; Morales, M.B.; Ceryngier, P.; Liira, J.; Tscharntke, T.; Winqvist, C.; et al. Persistent negative effects of pesticides on biodiversity and biological control potential on European farmland. Basic Appl. Ecol. 2010, 11, 97–105. [Google Scholar] [CrossRef]
  12. Brühl, C.A.; Zaller, J.G. Biodiversity Decline as a Consequence of an Inappropriate Environmental Risk Assessment of Pesticides. Front. Environ. Sci. 2019, 7, 177. [Google Scholar] [CrossRef] [Green Version]
  13. Sánchez-Bayo, F.; Wyckhuys, K.A.G. Worldwide decline of the entomofauna: A review of its drivers. Biol. Conserv. 2019, 232, 8–27. [Google Scholar] [CrossRef]
  14. Wagner, D.L.; Grames, E.M.; Forister, M.L.; Berenbaum, M.R.; Stopak, D. Insect decline in the Anthropocene: Death by a thousand cuts. Proc. Natl. Acad. Sci. USA 2021, 118, e2023989118. [Google Scholar] [CrossRef]
  15. Zaller, J.G. Daily Poison. In Pesticides—An Underestimated Danger; Springer Nature: Cham, Switzerland, 2020; p. 315. [Google Scholar]
  16. Lal, R. Carbon emission from farm operations. Environ. Int. 2004, 30, 981–990. [Google Scholar] [CrossRef] [PubMed]
  17. Audsley, E.; Stacey, K.; Parsons, D.; Williams, A. Estimation of the Greenhouse Gas Emissions from Agricultural Pesticide Manufacture and Use; Cranfield University: Bedford, UK, 2009; Available online: https://dspace.lib.cranfield.ac.uk/bitstream/handle/1826/3913/Estimation_of_the_greenhouse_gas_emissions_from_agricultural_pesticide_manufacture_and_use-2009.pdf (accessed on 20 May 2022).
  18. EC. Tackling Climate Change. Available online: https://ec.europa.eu/info/food-farming-fisheries/sustainability/environmental-sustainability/climate-change_en2021 (accessed on 20 May 2022).
  19. UN. Paris Agreement: COP 21, United Nations, United Framework Convention on Climate Change. 2015. Available online: https://unfccc.int/sites/default/files/english_paris_agreement.pdf (accessed on 20 May 2022).
  20. EP. European Parliament Resolution of 14 March 2019 on Climate Change—A European Strategic Long-Term Vision for a Prosperous, Modern, Competitive and Climate Neutral Economy in Accordance with the Paris Agreement. 2019. Available online: https://www.europarl.europa.eu/doceo/document/TA-8-2019-0217_EN.pdf (accessed on 20 May 2022).
  21. Bundeskanzleramt. Aus Verantwortung für Österreich. Regierungsprogramm 2020–2024. Bundesregierung Österreich, Die neue Volkspartei and Die Grünen-Die Grüne Alternative. 2020. Available online: https://www.bundeskanzleramt.gv.at/bundeskanzleramt/die-bundesregierung/regierungsdokumente.html (accessed on 20 May 2022).
  22. Vermeulen, S.J.; Campbell, B.M.; Ingram, J.S.I. Climate Change and Food Systems. Annu. Rev. Environ. Res. 2012, 37, 195–222. [Google Scholar] [CrossRef] [Green Version]
  23. Pazdernik, K.; Friedrich, A.; Gangl, M.; Haider, S.; Köther, T. Austria’s National Inventory Report 2020: Submission under the United Nations Framework Convention on Climate Change and under the Kyoto Protocol. Report/Umweltbundesamt REP-0724. 2020. Available online: https://www.umweltbundesamt.at/fileadmin/site/publikationen/rep0724.pdf (accessed on 20 May 2022).
  24. Giljum, S. Klimawandel Vermeidung und Anpassung—Die Notwendigkeit Einer Konsumbezogenen Betrachtung der Treibhausgasemissionen Österreichs: CCCA Factsheet #21. Climate Change Centre Austria, 2018. Available online: https://www.wu.ac.at/fileadmin/wu/d/i/ecolecon/PDF/CBA_Brief_final_20170818.pdf (accessed on 20 May 2022).
  25. EPA. Maleic Anhydride: 108-31-6; United States Environmental Protection Agency: Washington, DC, USA, 2000. Available online: https://www.epa.gov/sites/default/files/2016-09/documents/maleic-anhydride.pdf (accessed on 20 May 2022).
  26. EPA. Facts about Formaldehyde; US EPA: Washington, DC, USA, 2013. Available online: https://www.epa.gov/formaldehyde/facts-about-formaldehyde#whatisformaldehyde (accessed on 20 May 2022).
  27. JKI. Behandlungsindex, Behandlungshäufigkeit, Wirkstoffranking, Wirkstoffmengen und Behandlungsflächen. Available online: https://papa.julius-kuehn.de/index.php?menuid=43 (accessed on 31 August 2021).
  28. BLW. Agrarbericht 2020. Available online: https://2020.agrarbericht.ch/de/umwelt/wasser/verkauf-und-einsatz-von-pflanzenschutzmitteln.SchweizerischeEidgenossenschaftBundesamtfürLandwirtschaftBLW (accessed on 20 May 2022).
  29. FiBL. FiBL Statistics. Organic Area Share of Total Farmland (%). Forschungsinstitut für biologischen Landbau. Available online: https://statistics.fibl.org/europe/key-indicators.html?tx_statisticdata_pi1%5Bcontroller%5D=Element2Item&cHash=511759e872156740d7cfcbda7f290481 (accessed on 2 December 2021).
  30. EC. EU Mission: A Soil Deal for Europe. 2022. Available online: https://ec.europa.eu/info/research-and-innovation/funding/funding-opportunities/funding-programmes-and-open-calls/horizon-europe/eu-missions-horizon-europe/soil-health-and-food_en. (accessed on 20 May 2022).
  31. EC. The European Green Deal: Communication from the Commission to the European Parliament, The European Council, The Council, The European Economic and Social Committee and the Committee of the Regions. COM(2019) 640 Final 2019. Available online: https://eur-lex.europa.eu/resource.html?uri=cellar:b828d165-1c22-11ea-8c1f-01aa75ed71a1.0002.02/DOC_1&format=PDF (accessed on 20 May 2022).
  32. Grüner Bericht. Grüner Bericht 2020; Bundesministerium für Landwirtschaft und Regionen und Tourismus: Wien, Austria, 2020. [Google Scholar]
  33. Neumeister, L. Pestizideinsatz in Deutschland 2005–2017. Auswertung des Wirkstoffspezifischen Inlandsabsatzes und der PAPA Daten des Julius Kühn-Instituts (JKI). 2020. Available online: https://www.pestizidexperte.de/Publikationen/Pestizideinsatz_DE_2005_2017.pdf (accessed on 20 May 2022).
  34. AGES. Pflanzenschutzmittel-Verwendungsstatistik. 2020. Available online: https://www.ages.at/themen/landwirtschaft/pflanzenschutzmittel/forschung/pflanzenschutzmittel-verwendungsstatistik/ (accessed on 4 October 2021).
  35. Baumgarten, A.; Berthold, H.; Buchgraber, K.; Dersch, G.; Egger, H.; Egger, R.; Eigner, H.; Frank, P.; Gerzabek, M.; Hölzl, F.; et al. Richtlinie für Die Sachgerechte Düngung im Ackerbau und Grünland-Anleitung zur Interpretation von Bodenuntersuchungs-Ergebnissen in der Landwirtschaft. Bundesministerium für Land-und Forstwirtschaft, Umwelt und Wasserwirtschaft. 2017. Available online: https://ooe.lko.at/richtlinie-f%C3%BCr-die-sachgerechte-d%C3%BCngung-im-ackerbau-und-gr%C3%BCnland-7-auflage+2500+2559162 (accessed on 20 May 2022).
  36. Agriportal Consult. Bewusste Ernährung im Trend! Frühjahrsdüngung im Fokus. 2021. Available online: https://agriportal.nordzucker.de/irj/go/to/de/ruebenanbau/anbauleitfaden-zum-nachhaltigen-zuckerruebenanbau/duengung (accessed on 20 May 2022).
  37. Etz, H.; Stangl, M.; Wurm, L.; Baumgarten, A.; Lafer, G.; Modl, P. Richtlinien für die Sachgerechte Düngung im Obstbau. Bundesministerium für Land-und Forstwirtschaft, Umwelt und Wasserwirtschaft. 2008. Available online: https://info.bmlrt.gv.at/dam/jcr:59cdd8ba-a11c-4734-898d-a769c0a64759/Richtlinien%20für%20die%20sachgerechte%20Düngung%20im%20Obstbau.pdf (accessed on 20 May 2022).
  38. Baumgarten, A.; Bauer, K.; Fardossi, A.; Kneissl, G.; Kührer, E.; Mehofer, M.; Palz, M.; Regner, F.; Winkovitsch, C.; Wunderer, W. Sachgerechte Düngung im Weinbau. 2014. Available online: https://info.bmlrt.gv.at/dam/jcr:9a484899-b229-423d-a524-f5e0148ee91d/Sachgerechte%20Düngung%20im%20Weinbau.pdf (accessed on 20 May 2022).
  39. ÖKL. Kraftstoffverbrauch in der Land- und Forstwirtschaft. Vienna, Österreichisches Kuratorium für Landtechnik und Landentwicklung. 2012. Available online: https://oekl.at/wp-content/uploads/gems/KLRW2012Kraftstoffverbrauch.pdf (accessed on 20 May 2022).
  40. Curran, W. Persistence of herbicides in soil. Crops Soils 2016, 49, 16–21. [Google Scholar] [CrossRef]
  41. Bertschinger, L.; Gysi, C.; Häseli, A.; Neuweiler, R.; Pfammatter, W.; Ryser, J.; Schmid, A.; Weibel, F. Grundlagen für die Düngung der Obstkulturen—Kernobst, Steinobst, Kiwi, Strauchbeeren. Eidgenössische Forschungsanstalt für Obst-, Wein- und Gartenbau. 2003. Available online: https://orgprints.org/id/eprint/2880/ (accessed on 20 May 2022).
  42. Österreichischer Weinbauverband. Düngung: Pflegemaßnahmen, Vienna, Landwirtschaftskammer Österreich. 2021. Available online: https://www.lko.at/d%C3%BCngung+2500+3378950 (accessed on 20 May 2022).
  43. BMLRT. Grüner Bericht 2020. In Die Situation der österreichischen Land- und Forstwirtschaft; Austrian Ministry of Agriculture, Regions and Tourism: Vienna, Austria, 2020; p. 294. [Google Scholar]
  44. Heimpel, G.E.; Yang, Y.; Hill, J.D.; Ragsdale, D.W. Environmental Consequences of Invasive Species: Greenhouse Gas Emissions of Insecticide Use and the Role of Biological Control in Reducing Emissions. PLoS ONE 2013, 8, e72293. [Google Scholar] [CrossRef] [PubMed] [Green Version]
  45. Cech, R.M.; Jovanovic, S.; Kegley, S.; Hertoge, K.; Leisch, F.; Zaller, J.G. Reducing overall herbicide use may reduce risks to humans but increase toxic loads to honeybees, earthworms and birds. Environ. Sci. Eur. 2022, 34, 44. [Google Scholar] [CrossRef]
  46. Linhart, C.; Niedrist, G.H.; Nagler, M.; Nagrani, R.; Temml, V.; Bardelli, T.; Wilhalm, T.; Riedl, A.; Zaller, J.G.; Clausing, P.; et al. Pesticide contamination and associated risk factors at public playgrounds near intensively managed apple and wine orchards. Environ. Sci. Eur. 2019, 31, 28. [Google Scholar] [CrossRef] [Green Version]
  47. Linhart, C.; Panzacchi, S.; Belpoggi, F.; Clausing, P.; Zaller, J.G.; Hertoge, K. Year-round pesticide contamination of public sites near intensively managed agricultural areas in South Tyrol. Environ. Sci. Eur. 2021, 33, 1. [Google Scholar] [CrossRef]
  48. Zaller, J.G.; Kruse-Plaß, M.; Schlechtriemen, U.; Gruber, E.; Peer, M.; Nadeem, I.; Formayer, H.; Hutter, H.-P.; Landler, L. Pesticides in ambient air, influenced by surrounding land use and weather, pose a potential threat to biodiversity and humans. Sci. Total Environ. 2022, 838, 156012. [Google Scholar] [CrossRef]
  49. Kruse-Plaß, M.; Hofmann, F.; Wosniok, W.; Schlechtriemen, U.; Kohlschütter, N. Pesticides and pesticide-related products in ambient air in Germany. Environ. Sci. Eur. 2021, 33, 114. [Google Scholar] [CrossRef]
  50. Brühl, C.A.; Bakanov, N.; Köthe, S.; Eichler, L.; Sorg, M.; Hörren, T.; Mühlethaler, R.; Meinel, G.; Lehmann, G.U.C. Direct pesticide exposure of insects in nature conservation areas in Germany. Sci. Rep. 2021, 11, 24144. [Google Scholar] [CrossRef] [PubMed]
  51. Gaillard, G.; Irla, E. Ökobilanz der Unkrautregulierung im Ackerbau. Agrarforschung 1999, 6, 219–222. [Google Scholar]
  52. Ahlgren, S. Environmental Impact of Chemical and Mechanical Weed Control in Agriculture: A Comparing Study using LIFE Cycle Assessment (LCA) Methodology; SIK-Rapport: Göteborg, Sweden, 2004; Volume 719. [Google Scholar]
  53. Südzucker, A.G. Leitlinie zur effizienten und umweltverträglichen Erzeugung von Zuckerrüben, Thüringer Ministerium für Landwirtschaft, Naturschutz und Umwelt. 2008. Available online: http://www.tll.de/www/daten/publikationen/leitlinien/zuck0908.pdf (accessed on 20 May 2022).
  54. Skinner, C.; Gattinger, A.; Krauss, M.; Krause, H.-M.; Mayer, J.; van der Heijden, M.G.A.; Mäder, P. The impact of long-term organic farming on soil-derived greenhouse gas emissions. Sci. Rep. 2019, 9, 1702. [Google Scholar] [CrossRef]
  55. Mandl, K.; Cantelmo, C.; Gruber, E.; Faber, F.; Friedrich, B.; Zaller, J.G. Effects of Glyphosate-, Glufosinate- and Flazasulfuron-Based Herbicides on Soil Microorganisms in a Vineyard. Bull. Environ. Contam. Toxicol. 2018, 101, 562–569. [Google Scholar] [CrossRef] [PubMed] [Green Version]
  56. Shi, L.; Guo, Y.; Ning, J.; Lou, S.; Hou, F. Herbicide applications increase greenhouse gas emissions of alfalfa pasture in the inland arid region of northwest China. PeerJ 2020, 8, e9231. [Google Scholar] [CrossRef] [PubMed]
  57. Moreda, G.P.; Muñoz-García, M.A.; Barreiro, P. High voltage electrification of tractor and agricultural machinery—A review. Energy Convers. Manag. 2016, 115, 117–131. [Google Scholar] [CrossRef]
  58. Bručienė, I.; Aleliūnas, D.; Šarauskis, E.; Romaneckas, K. Influence of Mechanical and Intelligent Robotic Weed Control Methods on Energy Efficiency and Environment in Organic Sugar Beet Production. Agriculture 2021, 11, 449. [Google Scholar] [CrossRef]
  59. Jabran, K.; Chauhan, B. Overview and significance of non-chemical weed control. In Non-Chemical Weed Control; Jabran, K., Chauhan, B., Eds.; Elsevier Science: Saint Louis, MI, USA, 2018; pp. 1–8. [Google Scholar]
  60. Andert, S.; Bürger, J.; Stein, S.; Gerowitt, B. The influence of crop sequence on fungicide and herbicide use intensities in North German arable farming. Eur. J. Agron. 2016, 77, 81–89. [Google Scholar] [CrossRef]
  61. Roarty, S.; Hackett, R.A.; Schmidt, O. Earthworm populations in twelve cover crop and weed management combinations. Appl. Soil Ecol. 2017, 114, 142–151. [Google Scholar] [CrossRef]
  62. Andersen, L.; Kühn, B.F.; Bertelsen, M.; Bruus, M.; Larsen, S.E.; Strandberg, M. Alternatives to herbicides in an apple orchard, effects on yield, earthworms and plant diversity. Agric. Ecosyst. Environ. 2013, 172, 1–5. [Google Scholar] [CrossRef]
  63. Euteneuer, P.; Wagentristl, H.; Steinkellner, S.; Scheibreithner, C.; Zaller, J.G. Earthworms affect decomposition of soil-borne plant pathogen Sclerotinia sclerotiorum in a cover crop field experiment. Appl. Soil Ecol. 2019, 138, 88–93. [Google Scholar] [CrossRef]
  64. Mesnage, R.; Zaller, J.G. Herbicides: Chemistry, Efficacy, Toxicology, and Environmental Impacts. In Emerging Issues in Analytical Chemistry; Thomas, B.F., Ed.; Elsevier: Amsterdam, The Netherlands, 2021; 366p. [Google Scholar]
  65. BAES. Pflanzenschutzmittel-Register—Verzeichnis der in Österreich Zugelassenen/Genehmigten Pflanzenschutzmittel. Available online: https://psmregister.baes.gv.at/psmregister/faces/main?_afrLoop=4739298204069462&_afrWindowMode=0&_adf.ctrl-state=begqx7oro_4 (accessed on 20 May 2022).
  66. Scherer, H. Fertilizers and fertilization. In Encyclopedia of Soils in the Environment; Hillel, D., Hatfield, J., Eds.; Elsevier Academic Press: Amsterdam, The Netherlands, 2005; pp. 20–26. [Google Scholar] [CrossRef]
  67. Mesnage, R.; Straw, E.A.; Antoniou, M.N.; Benbrook, C.; Brown, M.J.F.; Chauzat, M.-P.; Finger, R.; Goulson, D.; Leadbeater, E.; López-Ballesteros, A.; et al. Improving pesticide-use data for the EU. Nat. Ecol. Evol. 2021, 5, 1560. [Google Scholar] [CrossRef]
  68. FERA. Pesticide Usage Statistics—PUS STATS. London. 2021. Available online: https://secure.fera.defra.gov.uk/pusstats/myindex.cfm (accessed on 20 May 2022).
  69. Douglas, M.R.; Sponsler, D.B.; Lonsdorf, E.V.; Grozinger, C.M. County-level analysis reveals a rapidly shifting landscape of insecticide hazard to honey bees (Apis mellifera) on US farmland. Sci. Rep. 2020, 10, 797. [Google Scholar] [CrossRef] [Green Version]
  70. APCC. Zusammenfassung für Entscheidungstragende (ZfE). In Österreichischer Sachstandsbericht Klimawandel 2014 (AAR14); Verlag der Österreichischen Akademie der Wissenschaften, Wien; Austrian Panel on Climate Change (APCC): Österreich, Austria, 2014; pp. 27–44. [Google Scholar]
  71. Brühl, C.A.; Zaller, J.G.; Liess, M.; Wogram, J. The rejection of synthetic pesticides in organic farming has multiple benefits. Trends Ecol. Evol. 2022, 37, 113–114. [Google Scholar] [CrossRef] [PubMed]
  72. Gunstone, T.; Cornelisse, T.; Klein, K.; Dubey, A.; Donley, N. Pesticides and Soil Invertebrates: A Hazard Assessment. Front. Environ. Sci. 2021, 9, 643847. [Google Scholar] [CrossRef]
  73. Liess, M.; Liebmann, L.; Vormeier, P.; Weisner, O.; Altenburger, R.; Borchardt, D.; Brack, W.; Chatzinotas, A.; Escher, B.; Foit, K.; et al. Pesticides are the dominant stressors for vulnerable insects in lowland streams. Water Res. 2021, 201, 117262. [Google Scholar] [CrossRef]
  74. Schulz, R.; Bub, S.; Petschick, L.L.; Stehle, S.; Wolfram, J. Applied pesticide toxicity shifts toward plants and invertebrates, even in GM crops. Science 2021, 372, 81–84. [Google Scholar] [CrossRef]
  75. DiBartolomeis, M.; Kegley, S.; Mineau, P.; Radford, R.; Klein, K. An assessment of acute insecticide toxicity loading (AITL) of chemical pesticides used on agricultural land in the United States. PLoS ONE 2019, 14, e0220029. [Google Scholar] [CrossRef] [Green Version]
  76. Goulson, D.; Thompson, J.; Croombs, A. Rapid rise in toxic load for bees revealed by analysis of pesticide use in Great Britain. PeerJ 2018, 6, e5255. [Google Scholar] [CrossRef]
  77. Niedobová, J.; Skalský, M.; Ouředníčková, J.; Michalko, R.; Bartošková, A. Synergistic effects of glyphosate formulation herbicide and tank-mixing adjuvants on Pardosa spiders. Environ. Pollut. 2019, 249, 338–344. [Google Scholar] [CrossRef]
  78. Siviter, H.; Bailes, E.J.; Martin, C.D.; Oliver, T.R.; Koricheva, J.; Leadbeater, E.; Brown, M.J.F. Agrochemicals interact synergistically to increase bee mortality. Nature 2021, 596, 389–392. [Google Scholar] [CrossRef] [PubMed]
  79. Van Hoesel, W.; Tiefenbacher, A.; König, N.; Dorn, V.M.; Hagenguth, J.F.; Prah, U.; Widhalm, T.; Wiklicky, V.; Koller, R.; Bonkowski, M.; et al. Single and Combined Effects of Pesticide Seed Dressings and Herbicides on Earthworms, Soil Microorganisms, and Litter Decomposition. Front. Plant Sci. 2017, 8, 215. [Google Scholar] [CrossRef] [PubMed] [Green Version]
  80. Patzel, N.; Wilhelm, B. Das Boden-Bulletin: Landbau in Zeiten der Erderhitzung; World Wildlife Fund for Nature: Berlin, Germany, 2018; p. 22. [Google Scholar]
Figure 1. Overview of data collection and carbon footprint calculations for pesticide and fertilizer use. Sources are shown in boxes, and the calculated final results are shown in bold.
Agriculture 12 00879 g001
Figure 2. Trends in conventional arable land, orchard, and vineyard area in Austria from 2000 to 2019 according to the Green Report 2020 [43].
Agriculture 12 00879 g002
Figure 3. Amounts of pesticide AIs sold in Austria from 2000 to 2019 according to the Green Report 2020 [43].
Agriculture 12 00879 g003
Figure 4. Average production-related GHG emissions of pesticides used in Austria from 2000 to 2019.
Agriculture 12 00879 g004
Figure 5. Average total (production- and application-related) GHG emissions of pesticides and fertilizers per ha for grapevine, apple, and sugar beet production. The pie charts on the right show the %-share of GHG-emission of different pesticide- and fertilizer types for each of the three analyzed crops.
Agriculture 12 00879 g005
Table 1. Overview of greenhouse gas (GHG) emissions of pesticide chemical classes and fertilizers and assumed average dosages for sugar beet, apple, and grapevine production in Austria in 2017. Categorization follows the Austrian Federal Agency of Food Safety and Health (AGES).
ParameterChemical ClassGHG
per Item
Dosage Sugar BeetsDosage ApplesDosage
Grapevines
kg CO2-eq kg−1kg
ha−1 yr−1
kg
ha−1 yr−1
kg
ha−1 yr−1
InsecticidesPyrethroid11.700.010.021.67 × 10-4
Carbamate + oximcarbamate6.100.000.040.00
Organophosphate3.700.020.230.04
Neonicotinoid15.100.060.060.00
Microbiological insect.5.100.000.000.00
Molluscicides5.101.18 × 10−30.000.00
Total 0.100.340.04
FungicidesBenzimidazole8.000.170.000.00
Carbamate + dithiocarbamates1.601.231.891.10
Imidazole + trizole3.900.270.090.22
Morpholine3.900.000.000.14
Other organic fungicides3.900.075.873.59
Inorganic fungicides3.902.2911.9916.74
Microbiol./vegetal origin3.900.000.000.02
Total 4.0319.8421.82
HerbicidesAmide + anilide5.630.110.010.00
Carbamate + biscarbamate3.000.350.000.00
Dinitroanilin3.000.000.000.00
Urea-, uracil-, sulphonylurea7.000.070.007.5 × 10−4
Organophosphate9.100.590.500.41
Phenoxy-phytohormones2.150.010.149.19 × 10−4
Triazine + triazinone3.902.260.000.00
Other organic herbicides6.950.480.004.93 × 10−3
Total 3.860.650.42
FertilizerMineral N1.30125.0080.0050.00
Phosphorus (P2O5)0.2085.0040.0020.00
Potassium (K2O)0.15320.00110.0080.00
Lime (CaO)0.16400.00341.67783.30
Table 2. Overview of treatment frequencies (TF) and application-related fuel consumption for pesticides and fertilizers used in Austria in 2017 [34].
Application ActivitySugar BeetAppleGrapes
TFFuel
Consum.
TFFuel
Consum.
TFFuel
Consum.
NumberL ha−1NumberL ha−1NumberL ha−1
Insecticides0.192.005.467.000.375.00
Molluscicides0.032.000.000.000.000.00
Fungicides0.932.0019.447.009.255.00
Herbicides3.762.000.687.000.405.00
N fertilization2.001.502.007.501.501.50
P fertilization1.501.501.007.501.001.50
K fertilization1.501.501.007.501.001.50
Liming2.502.501.002.501.002.50
Total application activity12.4115.0030.5846.0014.1222.00
Table 3. Percent change of pesticide amounts and conventional farmland area in Austria between 2000 and 2019 relevant to the current analysis. R2, F-values, p-values (in bold if trends are significant) of the LMs and the slope (β1) and intercept (β0) of the respective regression lines, the up- or downward arrows indicate the direction of the change.
Pesticide Amounts
Sold
%-Change
2000–2019
R2F-Valueβ1β0p-Value
Arable farmland, conv.−19.600.97531.00−1 × 1043 × 1078 × 10−15
Orchard area, conv.−21.760.8598.89−135.373 × 1051 × 10−8
Viticulture area, conv.−16.150.91182.50−397.978 × 1057 × 10−11
Insecticide amount+58.230.5219.483110.80−6 × 1063 × 10−4
Fungicide amount+29.380.5421.294 × 104−7 × 1072 × 10−4
Herbicide amount−28.470.339.02−2 × 1044 × 1070.008 ↓
Total pesticide amount+2.190.194.3420.26−4 × 1040.052
Table 4. Percent change of average production-related pesticide GHG emission from 2000 to 2019. R2, F-values, p-values (in bold if significant and arrow indicating direction of the trend) of the LMs and the slope (β1) and intercept (β0) of the respective regression lines, the up- or downward arrows indicate the direction of the change.
GHG Emissions%-Change
2000–2019
R2F-Valueβ1β0p-Value
Insecticides+58.230.5219.482 × 104−3 × 1073×10−4
Fungicides+29.380.5421.291 × 105−3 × 1082×10−4
Herbicides−28.470.339.02−1 × 1052 × 1080.008 ↓
Total−4.400.030.654 × 104−6 × 1070.432
Table 5. Production- and application-related pesticide GHG-emissions per ha for sugar beets, apples, and grapevines, by pesticide type and chemical classes per pesticide type. The %-share of the production of each chemical class and fuel consumption for application to total GHG emissions of each pesticide type is listed to the right of each crop column. The categorization follows the Austrian Federal Agency of Food Safety and Health (AGES).
Pesticide TypeGHG Emission during
Production and Application
of Chemical Class
Sugar BeetApplesGrapes
GHG
Emissions
Emission
Share
GHG
Emissions
Emission
Share
GHG
Emissions
Emission
Share
kg CO2-eq ha−1 season−1%kg CO2-eq ha−1 season−1%kg CO2-eq ha−1 season−1%
InsecticidesPyrethroid0.1315.140.210.661.96 × 10−30.12
Carbamate + oximcarbam.0.000.000.220.690.000.00
Organophosphate0.089.760.842.670.159.50
Neonicotinoid0.3135.560.280.890.000.00
Microbiological insect.0.000.000.000.000.000.00
Molluscicides0.010.700.000.000.000.00
Fuel consum. for applic.0.3338.3329.9095.091.4590.38
Total0.86 31.45 1.60
FungicidesBenzimidazole1.389.140.000.000.000.00
Carbamate + dithiocarbam.1.9613.063.031.691.761.48
Imidazole + trizole1.067.040.340.190.880.74
Morpholine0.000.000.000.000.560.47
Other organic fungicides0.261.7522.8912.7514.0011.79
Inorganic fungicides8.9259.3046.7726.0565.3054.98
Microbiological/veg. origin0.000.000.000.000.020.00
Fuel consum. for applic.1.469.72106.4959.3236.2030.48
Total15.40 179.52 118.76
HerbicidesAmide + anilide0.602.353.39 × 10−20.390.000.00
Carbamate + biscarbamate1.064.130.000.000.000.00
Dinitroanilin0.000.000.000.000.000.00
Urea-, uracil-, sulphonylurea0.491.922.34 × 10−30.030.010.10
Organophosphate5.3921.094.5652.993.7469.70
Phenoxy-phytohormones0.010.050.313.621.98 × 10−30.04
Triazine + triazinone8.8134.461.30 × 10−30.020.000.00
Other organic herbicides3.3212.982.32 × 10−30.030.030.64
Fuel consum. for applic.5.8823.023.7042.931.5829.53
Total25.56 8.61 5.36
Publisher’s Note: MDPI stays neutral with regard to jurisdictional claims in published maps and institutional affiliations.

