Article

Biostimulants Application on Olea europaea L. in Mediterranean Conditions Increase the Production and Bioactive Compounds of Drupes and Oil

1
Department of Agricultural Sciences, University of Naples Federico II, Via Università 100, 80055 Portici, Italy
2
Department of Pharmacy, University of Naples Federico II, Via Domenico Montesano 49, 80131 Naples, Italy
*
Authors to whom correspondence should be addressed.
Agriculture 2022, 12(12), 2173; https://doi.org/10.3390/agriculture12122173
Submission received: 9 November 2022 / Revised: 4 December 2022 / Accepted: 16 December 2022 / Published: 18 December 2022
(This article belongs to the Section Crop Production)

Abstract

:
Over the years, the use of biostimulants has become increasingly widespread due to their proven efficiency in improving plant productivity and quality of fruits and mitigating the effects related to environmental stress. The aim of the present study was to evaluate the effect of three biostimulants on oil yield, production of drupes per plant, and nutraceutical components of olive drupes and oil (total polyphenols, anthocyanins, and fatty acids %) for “Racioppella” cultivar trees growing in South Italy (May–October 2021). The biostimulants used were: a tropical plants extract (A) containing amino acids, vitamins, enzymes, phytochelatins, macro- and microelements, a glycine betaine-based product (B), and a Trichoderma spp.-based biostimulant (T). The three biostimulants were compared with a control thesis (C) treated only with water. T treatment increased the polyphenols content of olive drupes by 41.04% compared to C. A and B treatments increased polyphenols content by 21.87% on average compared to C. All three biostimulants showed positive effect by increasing the amount of polyphenols in olive oil compared to C:T showed an increase of 32.19%, B 7.76%, and A 19.78%. Biostimulant application proved useful in boosting fundamental parameters that determine better drupe and oil in terms of antioxidant capacity and nutraceutical potential, other than an increased production.

1. Introduction

Global warming is predicted to have a generally negative effect on plant growth due to the damaging effect of high temperatures on their development. The increasing threat of extreme climatic events, including high temperatures might lead to lower crop productivity and quality loss [1]. Abiotic stresses cause morphological, physiological, biochemical, and molecular changes that negatively impact plant growth and yield. The rising threat of climate change is already having a substantial impact on agricultural production worldwide, as heat waves can cause significant yield losses threatening future global food security [2]. Moreover, the environmental conditions of the Mediterranean basin are expected to change soon [3]. In particular, the mean air temperature is projected to rise drastically in the range of 2–5 °C in the next 30 years [3,4,5].
Olive trees are considered one of the most suitable and best-adapted species to the Mediterranean-type climate [6], characterized with long, warm, and dry summers, with mild and wet winters [7]. In addition, olive orchards in the Mediterranean basin are normally subjected to high levels of solar radiation, especially in spring and summer seasons. Nowadays, olive trees face new challenges and threats, namely related to climate change. In fact, increased temperatures and drought and a frequent occurrence of extreme weather events such as heatwaves, are among the problems that growers will have to deal with in the upcoming decades [8], as high temperatures influence some parameters such as olive oil and fatty acid content [9]. To mitigate the damages caused by high temperatures, it is important to adopt agronomic practices that allow a better adaptability for drought and high temperature, and therefore the capacity to integrate both tolerance and recovery of olive orchards capacity [10].
The plants defense strategies can be enhanced using various approaches such as the use of biostimulants [11,12]. The effect of biostimulant stems from a variety of factors, starting from the source materials and the production methods [13]. Several studies highlighted the vital role of biostimulants in improving the efficiency of plant’s metabolism, increasing plant tolerance and recovery from abiotic stresses, facilitating nutrient assimilation, translocation and use, and enhancing quality attributes of the produce; by including sugar content, color, phenols, antioxidant activity and particularly by fostering the development of complementary soil micro-organisms [14]. In the literature, various studies about the effect of biostimulants on plant growth and production are present [15,16,17,18], but very few studies have evaluated the use of biostimulants on olive trees [17,19,20,21].
The bioactive compounds/secondary metabolites in plants are a wide range of molecules that are generated in suboptimal growing conditions. The biosynthesis of these molecules is intended to enhance crop tolerance to abiotic and biotic stresses and other stressful conditions or avoid attacks from pathogens or animals [22]. Olives and oil are an important valuable source of natural phenolic antioxidants [23] and fatty acids content that have a benefic role on human health [24]. In fact, an increasing number of epidemiologic and experimental studies report that olive oil may have a role in the prevention of different pathology [25,26].
Several studies demonstrated the effect of various biostimulants based on protein hydrolysates, tropical plants extract, and Trichoderma strains in increasing the content of secondary metabolites, improving fruit yield components and fruit qualitative traits in different crops [27], fruit trees [28], and on olive drupes [29]. In this respect, the aim of our study was to evaluate the effect of these different categories of biostimulants on agronomic parameters and on bioactive compounds and fatty acids of Olea europaea L. drupes and oil, in a scenario of Mediterranean temperatures. Therefore, based on the above mentioned, this study was designed to better understand and broaden our knowledge on the effect of different categories of biostimulants in modulating the yield of olive trees and the bioactive compounds of olive drupes and oil in Mediterranean conditions.

2. Materials and Methods

2.1. Plant Material, Biostimulants Treatments, and Experimental Design

The trial was conducted in an olive orchard in Castelvenere, in the province of Benevento, Southern Italy (41.23488° N. 14.547609° E) at an altitude of 140 m msl, during the growing season from May to October 2021. The experiment was carried out on sixteen years old olive trees in production belonging to the cultivar “Racioppella”. The plants were trained to open vase system and planted with an inter-row spacing of 6 m, and an intra-row spacing of 3 m. The olive field received standard horticultural cares, and the treatments against the main parasites were applied according to the regulation of integrated production.
The experiment set up was organized as a completely randomized block design with ten trees/replicates per treatment. Ten untreated trees were adopted between the different treatments to avoid any interference from the foliar treatments. The trees were selected according to the uniformity of vegetative and productive status. For foliar treatments, an atomizer was used, and for the radical treatment a ground injector was used. The experimental design was based on three commercial biostimulants treatments compared with a control:
(1)
Auxym (A) product derived from tropical plants extracts by Hello Nature® (Rivoli Veronese, VR, Italy). The product was used as foliar application at the dose of 1.5 L ha−1.
(2)
Biohelp (B) glycine betaine-based product by Biolchim SPA (Bologna, Italy), a bio-promoter of resistance to environmental stress. The product was used as foliar application at the dose of 10 kg ha−1.
(3)
Trianum-P (T) a product based on Trichoderma by Koppert Biological Systems (Bussolengo, Italy), with active ingredient Trichoderma harzianum Rifai strain T-22 (also known as KRL-AG2*). The product was used both as foliar application and radical application at the dose of 2.5 kg ha−1.
(4)
Control (C) plants were only treated with water.
All biostimulants were applied five times during the growing season at 30 days intervals, at the phenological stage 53, 55, 71, 79, and 81 according to the BBCH scale [30]. The biostimulants were applied adopting a concentration recommended by the producers.
The minimum, maximum, and average temperature data recorded during the growing season were downloaded from the meteorological station of Castelvenere (BN) Italy, where the study was conducted.

2.2. Harvest Time, Production Plants−1, Maturation Index and Oil Extraction

The evaluation of the ripening of drupes was done according to the pigmentation of the olives (Jaen index 0–7). The olive trees cv. “Racioppella” were harvested on 26 October 2021 by a vibrating comb, when 50% of the drupes reached a red-mahogany or darker skin color, with a Jaen index of about 3. Fruits were weighed to determine the yield per plant by a digital dynamometer (Kern & Sohn, Balingen, Germany). Immediately after harvesting, the olives were transported to a crusher where they were processed with a 3-phase continuous malaxing machine (Pieralisi F.lli S.p.A., Ancona, Italy).

2.3. Carotenoids Determination of the Drupes

The carotenoids determination of drupes was done based on a spectrophotometric method described by Aiello et al. [31], with slight modifications. The sample (100 mg) was dissolved in 5 mL of ethyl ether, then placed in an ultrasonic bath for 1 min and vortexed for 30 s. The absorbance measurement was carried out using a Shimadzu UV-1601 spectrophotometer (Shimadzu, Kyoto, Japan) at a wavelength of 470 nm. The results were expressed as mg kg−1.

2.4. Anthocyanins Determination of the Drupes

The anthocyanins determination of drupes was done based on the method of Raj and Ahmad [32], with slight modifications. Briefly, 2 g of fruit epicarp was macerated in 20 mL of 5% acidified methanol using a mortar and pestle. The extraction was repeated three times. The extracts were collected and centrifuged at 6500 rpm for 10 min. The supernatant was kept at dark overnight. Finally, the absorbance was measured at 520 nm using a Shimadzu UV-1601 spectrophotometer (Shimadzu, Kyoto, Japan). The anthocyanins content was expressed as cyanidin-3-glucoside equivalent since that is the most abundant anthocyanin in nature [33]. The total anthocyanin was reported as mg cyanidin-3-glucoside equivalent kg−1.

2.5. Fat Extraction by Drupes

The fat content of drupes was assessed based on the method of Gonçalves et al. [34], with slight modifications. Briefly, 4 g of olive was added to 100 mL solution of chloroform/methanol (2:1; v/v)  (Carlo Erba reagents, Milan, Italy) and 100 mg L−1 of butylated hydroxytoluene (BHT) (Sigma-Aldrich, St. Louis, MO, USA), then a mechanical homogenization was performed using an ultra-turrax (Janke and Kunkel, Germany, type TP 18/10) for 6 min on ice. The extract was filtered and added to a separating funnel and the procedure was repeated twice. The obtained volume was adjusted to 150 mL with chloroform/methanol (2:1; v/v), and then 37.5 mL of sodium chloride (0.73%) was added. After mixing, it was left to rest for 20 min. Then the lipidic extract was recovered and filtered with sodium sulphate anhydrous (Na2SO4) (Sigma-Aldrich, St. Louis, MO, USA). The lower phase was collected to previously weighted glass flasks and the solvent was evaporated using a rotary evaporator.

2.6. Chemicals, Reagents, and Material

Phenolic standards were purchased from Sigma Aldrich (St. Louis, MO, USA), whereas hydroxytyrosol was obtained from Indofine (Hillsborough, NJ, USA), secologanoside from ChemFaces Biochemical Co., Ltd. (Wuhan, China) and oleuropein form Extrasynthese (Lyon, France). The standard stock solutions at 1 mg mL−1 in methanol were stored at −20 °C for a period of 1 month. Mix stock solution was prepared using the individual stock solutions, then working mix solutions were prepared by diluting the stocks in methanol in order to build calibration curves in the range of 0.02–5 mg mL−1. Methanol, hexane, and formic acid (LC-MS grade) were obtained from Carlo Erba reagents (Milan, Italy), while acetic acid (98–100%) was acquired from Fluka (Milan, Italy).

2.7. Ultrasound-Assisted Extraction of Polyphenolic Compounds of the Drupes

Based on the method of Talhaoui et al. [35], the extraction of the lyophilized samples was done with few modifications. About 0.2 g of lyophilized sample was extracted and centrifuged at 4000 rpm. The supernatants were collected and filtered (0.45 mm nylon syringe membranes). Finally, the extract was dried under nitrogen flow and then solubilized in 1 mL of methanol before high-resolution mass spectrometry analysis and antioxidant activity tests.

2.8. UHPLC-HRMS Analysis of Polyphenolic Compounds of the Drupes

Polyphenolic compounds were quantified and separated using an UHPLC system (Thermo Fisher Scientific, Waltham, MA, USA). Mass spectrometry analysis was performed by a Q Exactive Orbitrap LC-MS/MS (Thermo Fisher Scientific, Waltham, MA, USA). According to Dini et al. [36], where the analytical method is fully detailed, the polyphenolic compounds were acquired.

2.9. Antioxidant Activity Evaluation of the Drupes

The free radical scavenging activity was carried out with a 2,2-diphenyl-1-picrylhydrazyl (DPPH)-based assay using the procedure reported by Brand-Williams et al. [37]. The ferric reducing antioxidant activity was measured using the FRAP assay [38], with few adaptations. The ABTS-scavenging activity was evaluated according to the previously published procedures with minor modifications [39]. All the determinations were performed in triplicates, and the values were expressed as mmol Trolox equi. kg−1 dw.

2.10. Quality Indices of Olive Oil

Acidity (% oleic acid 100 g−1 oil), peroxide value (meq O2 kg−1 oil), and spectrophotometric indices (K232, K270, and ΔK) were determined according to the official method (EC Reg. 2568/1991 and International Olive Council (IOC) methods). The sensory analysis was carried out by eight well-trained assessors for the evaluation of extra-virgin olive oil (EVOO) according to the official methods of the IOC (1996) and EC Reg. 1604/2019. The panel test was performed using the evaluation form regulated by EC Reg. 640/2008.

2.11. Fatty Acid Profile of Olive Oil

The determination of fatty acid profile was determined by analyzing the fatty acid methyl esters (FAMEs) obtained after trans-esterification as mentioned in detail by Di Vaio et al. [15]. The results were expressed as % w/w.

2.12. Total Polyphenols Content of the Oil

The total phenolic compounds (TPC) quantification was carried out according to the Folin–Ciocalteau colorimetric method. The phenolic compounds extraction was performed according to Genovese et al. [40], with modifications. The oil (300 mg) was added to 300 µL of hexane, and the mixture was vortexed for 30 s. Subsequently, 1.5 mL of methanol:water (60/40 v/v) was added to the sample and the obtained mixture was vortexed for 1 min, then the sample was centrifuged at 4000 rpm for 10 min. This procedure was repeated twice. The extract (100 µL) was added to 400 µL of water, 800 μL of 7.5% sodium carbonate (Na2CO3), and 100 µL of Folin–Ciocalteau (2 N). The samples were left for 30 min in the dark at room temperature. For each extraction, the analyses were executed in triplicates.

2.13. Polyphenols Determination by HPLC of Olive Oil

To determine the individual polyphenols concentration, 150 mg of sample was dissolved with 3  mL of methanol. The mixture was shaken for 30 s and it was sonicated for 20 min and filtered with a 0.22-µm PES filter before injection into the HPLC system. HPLC analysis was performed following the method of Romano et al. [41]. The results were expressed as mg kg−1 of oil.

2.14. Statistical Analysis

Analysis of variance (two-way ANOVA) was applied to analyze the group means. Duncan’s multiple range test (DMRT) was performed for means separation of each of the significant (p < 0.05) measured variables. Principal component analyses (PCA) was executed with a custom python script using scikit-learn 1.1.3, matplotlib, and pandas dataframe libraries.

3. Results and Discussion

3.1. Effects of Biostimulants on Production/Plant and Drupe Characteristics

Data of minimum, maximum, and mean air temperature (°C) were recorded throughout the experimental period at the agro-meteorological station located at the “Castelvenere” (BN) city (Figure 1). The maximum temperature was recorded in August (41.7 °C), while the minimum temperature was recorded in October (6.5 °C). On the other hand, higher average temperatures were recorded in August with values of around 30 °C.
The “Racioppella” olives were harvested when the Jaen index conditions were between 2.87 and 2.99. As shown in Table 1, there are no major differences between the various treatments in determining the fruit epicarp color. The maturation stage of collected olive fruits samples is a very important parameter, as it sets olive oil quality, stability, and composition [42]; even if further parameters are needed to determine the exact ripening period of the olives [43]. Several studies were reported on the efficiency of biostimulants in increasing production especially in horticultural plants [44]. Instead, a smaller number of studies have been conducted on fruit plants demonstrating the efficiency of biostimulants in increasing production, for example as reported in our previous study on “Annurca” apple [45], and on other species as reported by Colla et al. [46]. Table 1 shows the production values of olive trees, and an increase is highlighted following the application of biostimulants. In particular, T treatment recorded an increase in the production by 71%, compared to the control, while the other two biostimulants A and B reported a significant increase of 37.76% and 28% respectively. It is well-known that Trichoderma strains can improve plant fitness especially in suboptimal growth conditions in the field, where the fungus has a direct positive influence on plant growth other than alleviating the effects of biotic or abiotic stresses that may naturally occur [47,48]. Our findings are comparable to those of Harman et al. [47], which reported an enhancement of corn yield in several trials. The plant growth promotion induced by Trichoderma can be explained by an upregulation of photosynthesis-related proteins and a higher photosynthetic efficiency, as well as a direct effect of an increased root and foliar systems [48]. In the literature, it was reported that glycine betaine enhances the endogenous levels of both GB and proline in many plant species, suggesting the positive role of this chemical compound in enhancing drought stress tolerance by upregulating the mechanisms involved in growth and yield production under stress conditions [49]. The positive effect of Auxym (A) was also demonstrated by Carillo et al. [50] in a study on jute plants, where weekly foliar application of the commercial tropical plants extract, improved fresh yield under sub-optimal nutrient regimens, compared to control treatment. In Table 1, the oil (%), anthocyanins, and carotenoids contents of drupes are shown. The oil content of fruit ranged between 14.11% in B treatment and 14.64% in T treatment, showing a positive effect on oil content, such as reported by Ahmad et al. [51] in seeds of Indian mustard. The anthocyanins content ranged from 407.96 mg kg−1 in T treatment to 451.16 mg kg−1 in A treatment. These values were higher than those showed by Di Vaio et al. [15], which reported a concentration of 116.10 mg kg−1 in drupes of “Oliva Bianca” cultivar, while they were similar to those of Fourati et al. [52], which reported values ranging from 331 mg kg−1 to 660 mg kg−1, depending on sampling time and treatment. Furthermore, the use of Trichoderma reduced the anthocyanins content of drupes, similar to do Rêgo Meneses et al. [53], who showed a reduction of these compounds in maize treated with Trichoderma asperelloides.
The carotenoids concentration ranged between 5.42 mg kg−1 in B and 7.57 in T. All values were higher than that reported by Di Vaio et al. [15], that showed a concentration of 2.10 mg kg−1 in drupes of “Oliva Bianca” cultivar, while Motilva and Romero [54] showed a concentration that ranged between 1.8 mg kg−1 dw and 70 mg kg−1 dw, depending on the maturity time. Yorulmaz et al. [55] showed a carotenoids concentration in the range of 1.19 mg kg−1 to 12.87 mg kg−1 in olive oil, depending on the cultivar and maturation time. As well, a positive effect of Trichoderma on carotenoids was shown by Ahmad et al. [51] in Indian mustard.

3.2. Polyphenolic Compounds Analysis by UHPLC-Q-Orbitrap HRMS of Olive Drupes

The influence of three different commercially available biostimulants, including Auxym, Biohelp, and Trichoderma on the qualitative and quantitative profile of polyphenolic compounds of olive drupes is included in Table 2. Olive drupes were collected from the control and treated plants and a polyphenolic profiling was performed by UHPLC-HRMS Orbitrap. A total of 16 metabolites were detected and identified by high resolution mass spectrometry comprising phenolic acids, flavonoids, phenolic alcohols, and secoiridoids. Some authors reported the use of the foliar product and its effect on olive oil quality [56,57]. Some authors have reported that foliar sprays of biostimulants on olive tree improved oil quality characteristics [21], mineral content [58], and fruit yield [21].
The content of polyphenolic compounds is an important parameter in olive oil quality due to their high antioxidant effects. In our research, the studied biostimulant treatments, showed significant differences in phenolic compounds content, with Trichoderma treatment having the highest total phenolic content and reaching a value of 11,612.85 µg g−1 dw. The treatment with Trichoderma influenced the metabolic response in drupes, in terms of polyphenol biosynthesis, compared to the control, showing a significant increase in the concentration of these compounds of about 41.04%. On the other hand, the treatment with Auxym and Biohelp also had a positive effect on the content of polyphenols in the olive drupes reaching in both cases an increase of about 21%, but not significantly different from the Control and T treatment.
Our results are consistent with those reported previously by Dini et al. [29], who mentioned that the treatment of olive plants with Trichoderma strains promoted the activation of plant defense mechanisms, including the production of secondary metabolites such as phenolic compounds. In addition, in our previous work [20] it was reported the effect of some agronomic practices such as the application of antitranspirants on biometric, eco-physiological, and nutraceutical parameters in young olive trees. Rouphael et al. [59] highlighted the importance of biostimulants in increasing biosynthesis of primary and secondary metabolites, including carotenoids, polyphenols, and ascorbic acid, thus improving the nutritional and nutraceutical quality of the edible products. As for olives, in line with our results, Lobianco and Massenti [60] reported that the foliar application of SUNRED® Biostimulant containing phenylalanine, methionine, monosaccharides, and oxylipins, lead to an increase in oleocanthal and 3,4-DHPEA-EDA in olives.

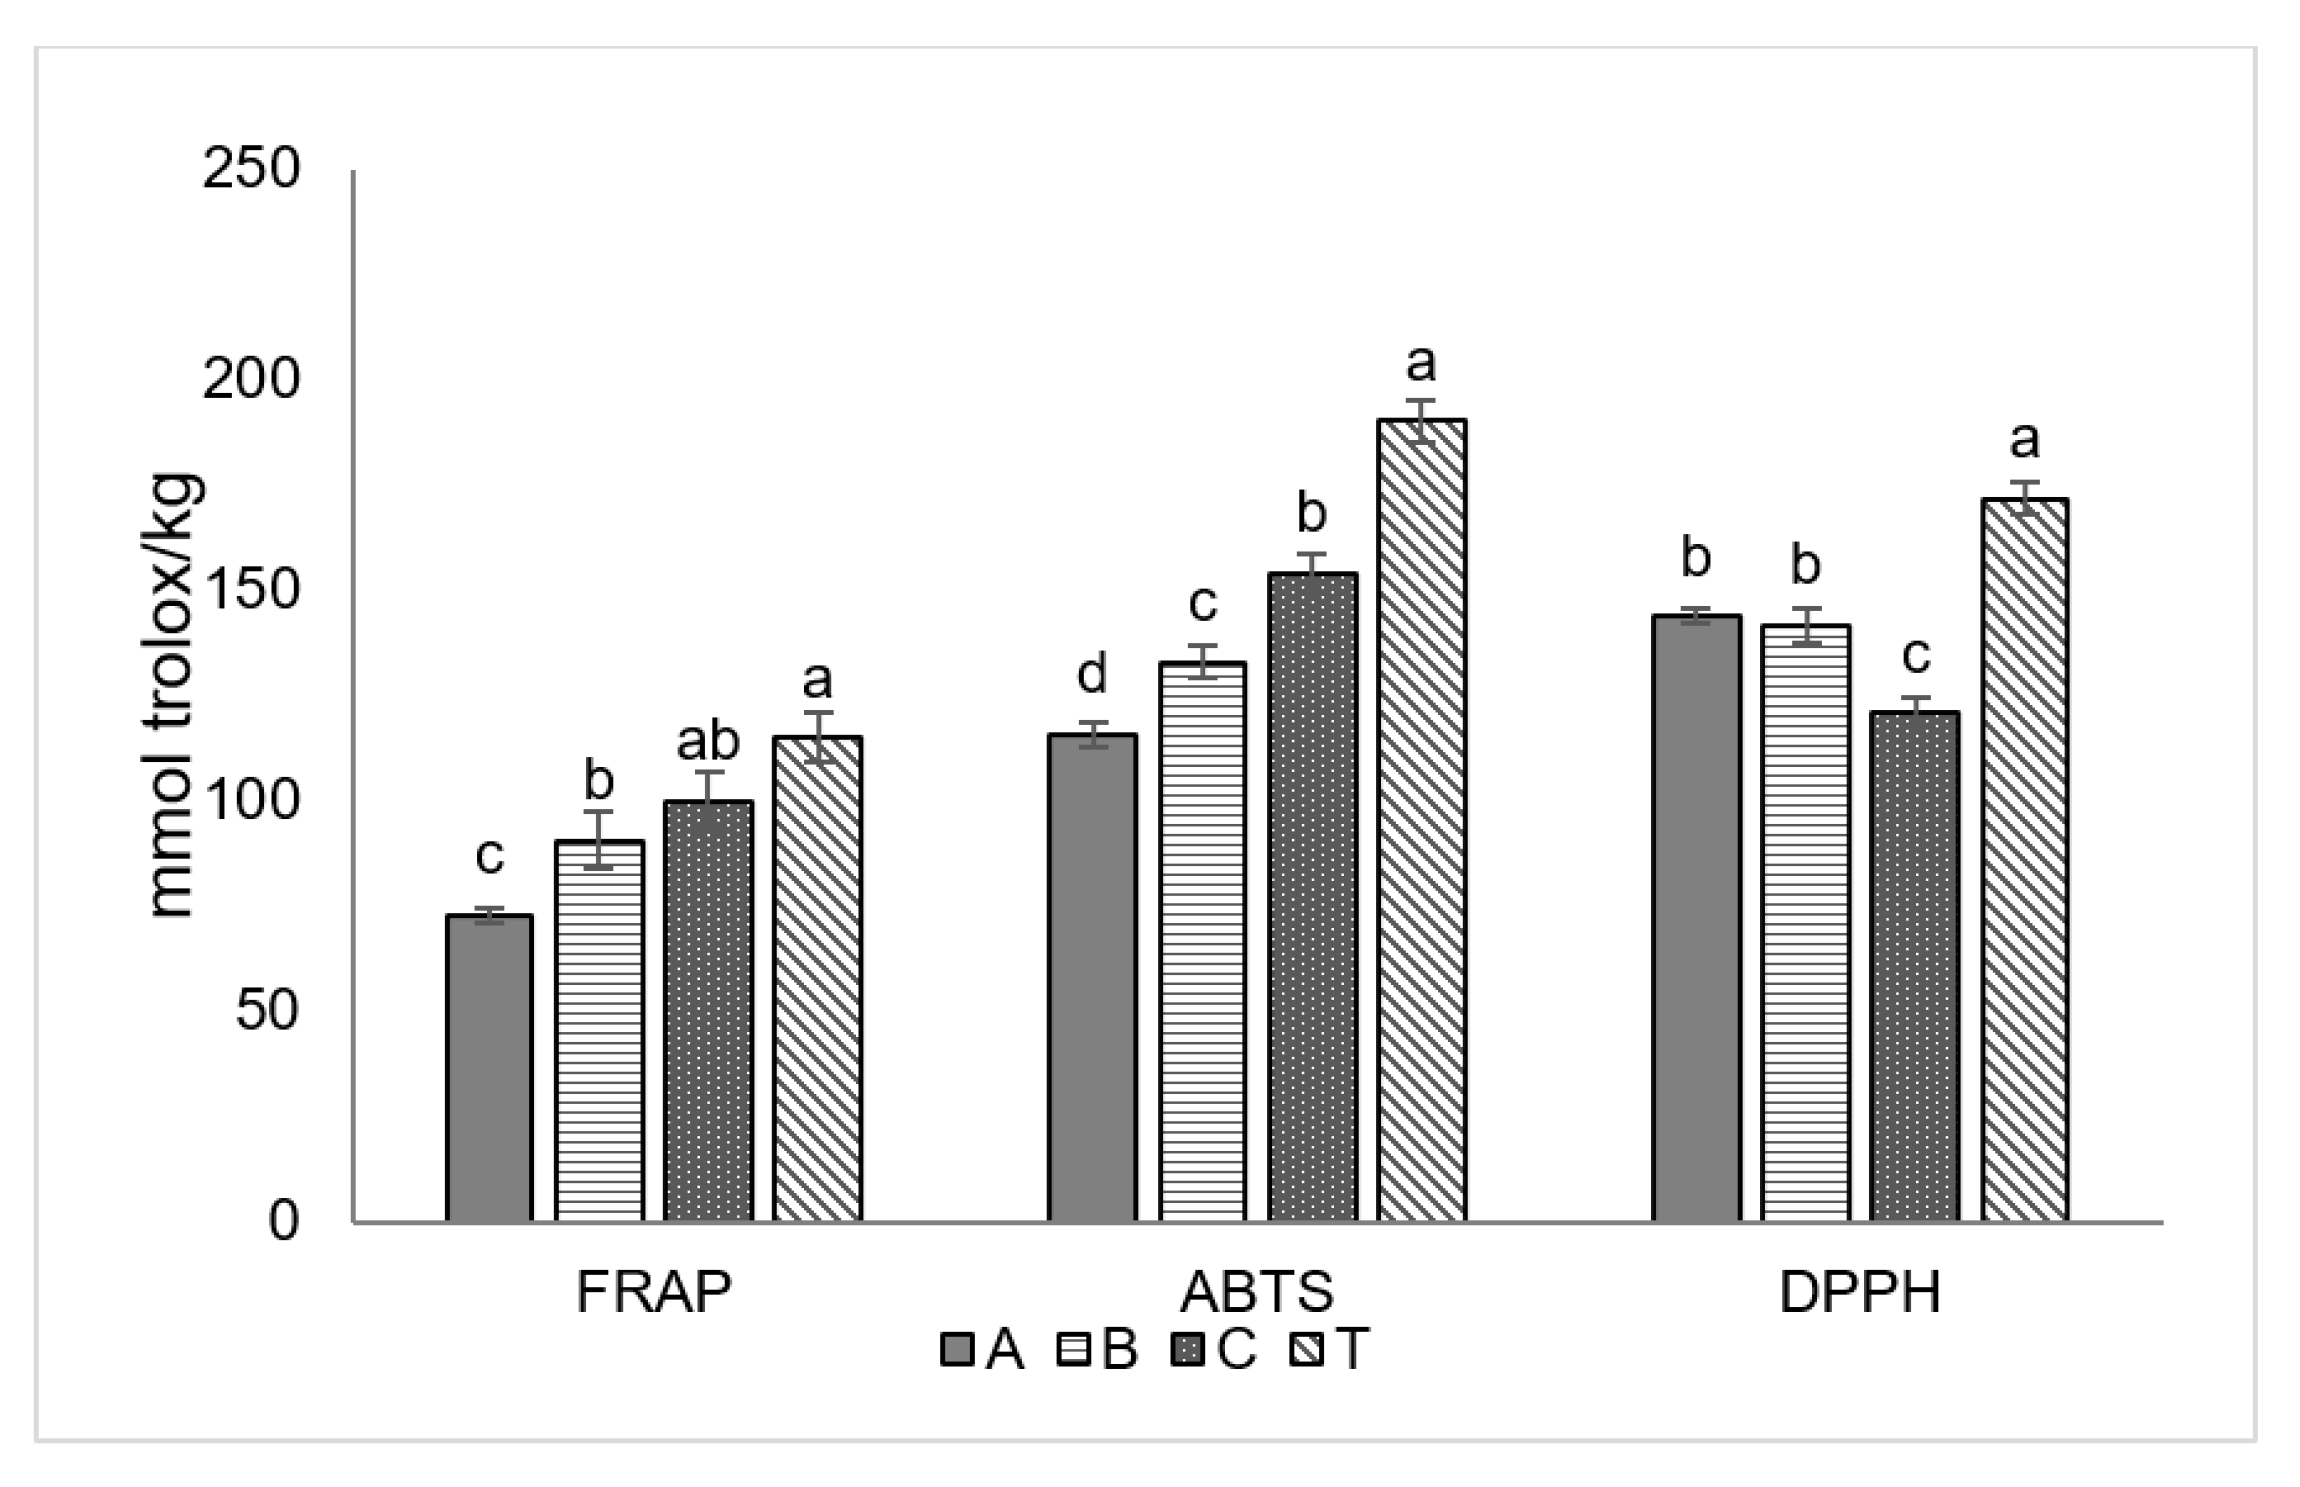
3.3. Antioxidant Activity of Extracts of Olive Drupes

The antioxidant activity of the drupes is illustrated in Figure 2. FRAP and ABTS showed a similar trend, where A treatment engendered a lower antioxidant activity compared to C. B treatment engendered significantly lower antioxidant activity based on the ABTS assay, whereas T treatment caused the opposite trend. Instead, the DPPH method highlighted the efficiency of all biostmulants in significantly increasing the antioxidant activity of olive drupes. Once again, better results were obtained with T application, which caused an increase of 42.23% compared to the control, while A and B showed an increase of 18.95% and 17.17% respectively. In literature, Dini et al. [36] reported a similar trend for antioxidant activity measured with DPPH assay, highlighting that the Biostimulant treatment on olive trees had a positive effect on the antioxidant activity of the olive leaf samples and of the EVOO samples obtained from the olive trees treated with Trichoderma harzianum (strain M10). On the other hand, Del Buono et al. [61] reported that the application of Megafol, a commercial plant biostimulant, on olive plants subjected to severe saline stress caused an increase of the activity of some key antioxidant enzymes, thus avoiding the accumulation of hydrogen peroxide and lipid peroxidation.

3.4. Quality Indices of Olive Oil

In Table 3, the quality indices of olive oil are presented. Free acidity ranged from 0.28% in C to 0.31% oleic acid 100 g−1 both in A and in B, while peroxide value ranged from 5.34 meq O2/kg oil in C to 9.08 meq O2/kg in A. K232 ranged from 1.30 in B to 1.76 in T, while ΔK was less than 0.01 in all analyzed sample and K270 ranged from 0.17 both in A and B to 0.25 in T. So, all the analyzed samples of olive oil quality indices (free acidity, peroxide value and K232, K270 and ΔK index), were within the range for characterizing the oil as “extra virgin” (EEC regulation no. 2019/1604). Furthermore, among the used biostimulants, the treatment with Trichoderma resulted more similar to control and so the value of acidity and peroxide both resulted lower than the treatment used with the other biostimulants.

3.5. Oil Sensorial Analysis

In Table 4, the results about the panel test are presented. The sensory analysis carried out by the panel did not report defects in all analyzed oil. The oil obtained with Trichoderma treatment resulted the most pungent and the less fruity with value pungency of 6.2, while the most bitter oil was the oil obtained by drupes treated with biostimulant of tropical plants extract (sample A) with a value of 6.4. The taste of bitterness and pungency was reported to be related to the phenols content [62] and in this way, both T and A had shown a higher TPC compared to C (529.81 mg GAE 100 g−1 in A and 584.69 mg GAE 100 g−1 in T). Furthermore, Servili et al. [63] reported that both bitterness and pungency of Italian oils were correlated with TPC, and in particular low perception was found with 50–200 mg GAE kg−1, medium with 200–500 mg GAE kg−1, and high with 500–1000 mg GAE kg−1.

3.6. Fatty Acids Composition of Oil

In Table 5, the fatty acids composition of different oils is presented. The most present fatty acids in olive oil were palmitic, oleic acid, linoleic, and stearic acid, similar to what is reported by Noorali et al. [64] and Di Vaio et al. [15]. The fatty acids composition was influenced by plant treatments, except for behenic acid. In particular, the concentration of palmitic acid was the lowest in T (12.66%) and the highest in A (14.00%). The palmitic acid content, in all analyzed samples, was in line with Noorali et al. [64] findings, that reported a range from 7.5% to 20% depending on the analyzed cultivar. Interestingly, the use of biostimulants increased the oleic acid content with the highest concentration under T treatment (71.53%) suggesting an 8% increase compared to C. Moreover, the linoleic acid concentration decreased in samples treated with biostimulants compared to C, with the highest decrease in T (−4%). A similar result was obtained by Marra et al. [65] on soybean seeds that under Trichoderma (T22) treatment produced soybean seeds richer in oleic acid (C18:1) and a reduced content of linoleic acid (C18:2) compared to the control. Furthermore, Chouliaras et al. [21] found an increase in oleic acid and a reduction in linoleic acid in olive oil sample treated with seaweed extract applied foliarly, in addition to soil application of nitrogen and boron fertilizers. On the other hand, Hernández-Hernandez et al. [66] did not find any significant difference in fatty acids composition of olive oil obtained from plants treated with biostimulants, maybe due to the high density growing of olive plants. So, the environmental conditions such as soil type and climate as well as the use of biostimulants may have influenced the results. Anyway, to the best of our knowledge, this is the first study reporting the ability of Trichoderma strains to influence lipid content of drupes and modify the fatty acid profile of olive oil.
The oleic/linoleic ratio ranged from 4.71 in C to 6.73 in T, and this value increased with biostimulant treatment, as well as total MUFA; whereas total PUFA was reduced. The oleic/linoleic acid ratio was similar to that obtained in “Oblica” cultivar that ranged from 4.17 to 4.96 depending on the production year. While it was lower than the olive oil obtained by “Leccino” cultivar that ranged from 9.66 to 11.59 depending on the production year [67].
The MUFA/PUFA ratio ranged from 4.38 in C to 6.16 in T. This ratio increased equally under all the other biostimulants, indicating a possible reduction of oxidative susceptibility of oil [68]. The value was similar to that stated by El Qarnifa et al. [69], which showed a range from 4.36 to 10.82. Similarly, the ratio MUFA/SFA increased with biostimulants treatments, and this ratio ranged from 3.78 in C to 4.46 in T treatment. These values are similar to those obtained in “Oblica” and “Leccino” cultivars in different production years (range 4.17–4.96 and 4.14–4.41, respectively) [67]. Finally, the MUFA/SFA ratio and the MUFA/PUFA ratio were relatively low; but the high phenol content could indicate that oil quality was preserved without lipid deterioration, in harmony with the report of Pinelli et al. [70].

3.7. Polyphenols Content of Olive Oil

In Table 6, the individual polyphenol content and total polyphenol content are presented. Regarding the phenolic compounds, tyrosol, p-coumaric, ferulic, and vanillic acid were found in all the analyzed samples. The tyrosol content ranged from 8.17 mg kg−1 in C to 9.43 in B mg kg−1. The tyrosol content was in harmony with Toric et al.’s [71] study which showed a range from 4.57 mg kg−1 to 9.26 mg kg−1 depending on the analyzed cultivar, and with Palla et al.’s [72] study, which showed a concentration that ranged from 4.1 mg kg−1 to 86.7 mg kg−1 depending on the storage time. The use of biostimulants increased the phenols content in olive oil. In particular, tyrosol and vanillic acid concentrations were the highest in T, while p-coumaric and ferulic acid were highest in B. The tyrosol concentration was higher than that stated by Tovar et al. [73], who showed a concentration ranging between 0.23 mg kg−1 and 0.37 mg kg−1 depending on the irrigation method. Similarly, Gomez-Alonso et al. [74] showed a concentration ranging from 0.2 mg kg−1 to 6.1 mg kg−1. The results are partially in accordance with Dini et al.’s [75], which showed a positive effect of the biostimulants on vanillic, ferulic, and p-coumaric contents, while the tyrosol concentration was reduced in their case. While Dini et al. [75] showed an increase of tyrosol concentration in olive oil of “Leccino” and “Carolea” cultivar after the treatment with Trichoderma.
The second most present compound was p-coumaric acid with a concentration ranging between 4.31 mg kg−1 with C treatment and 4.70 mg kg−1 with B treatment. The concentration was in line with El Riachy et al.’s [75] study, that showed a range between 1.87 mg kg−1 and 6.04 mg kg−1, depending on progenies from crosses of olive. Ferulic and vanillic acid were present at concentrations <1.0 mg kg−1. The polyphenols content of oil is influenced also by region growth, olive tree age, olive maturation, and processing of olive fruit and oil [76].
The TPC ranged from 442.31 mg kg−1 in C to 584.69 mg kg−1 in T. These values were higher than that of Baiano et al.’s [73] study, that showed a range from 26.53 mg GAE kg−1 to 322.18 mg GAE kg−1 depending on both the cultivation zone and storage time, and higher than those showed by Mafrica et al.’s [77] that reported a maximum concentration of 457.90 mg GAE kg−1. The use of biostimulants increased the TPC in all sample compared to the control and the increase was in the range of 7.76% in B to 32.19% in T samples. Moreover, Dini et al. [78] and Leogrande et al. [79] showed an increase in TPC in oil obtained by olive treated with biostimulants. The increase of TPC with biostimulants treatment and the reduction of linoleic acid could increase the oxidative stability of oil.

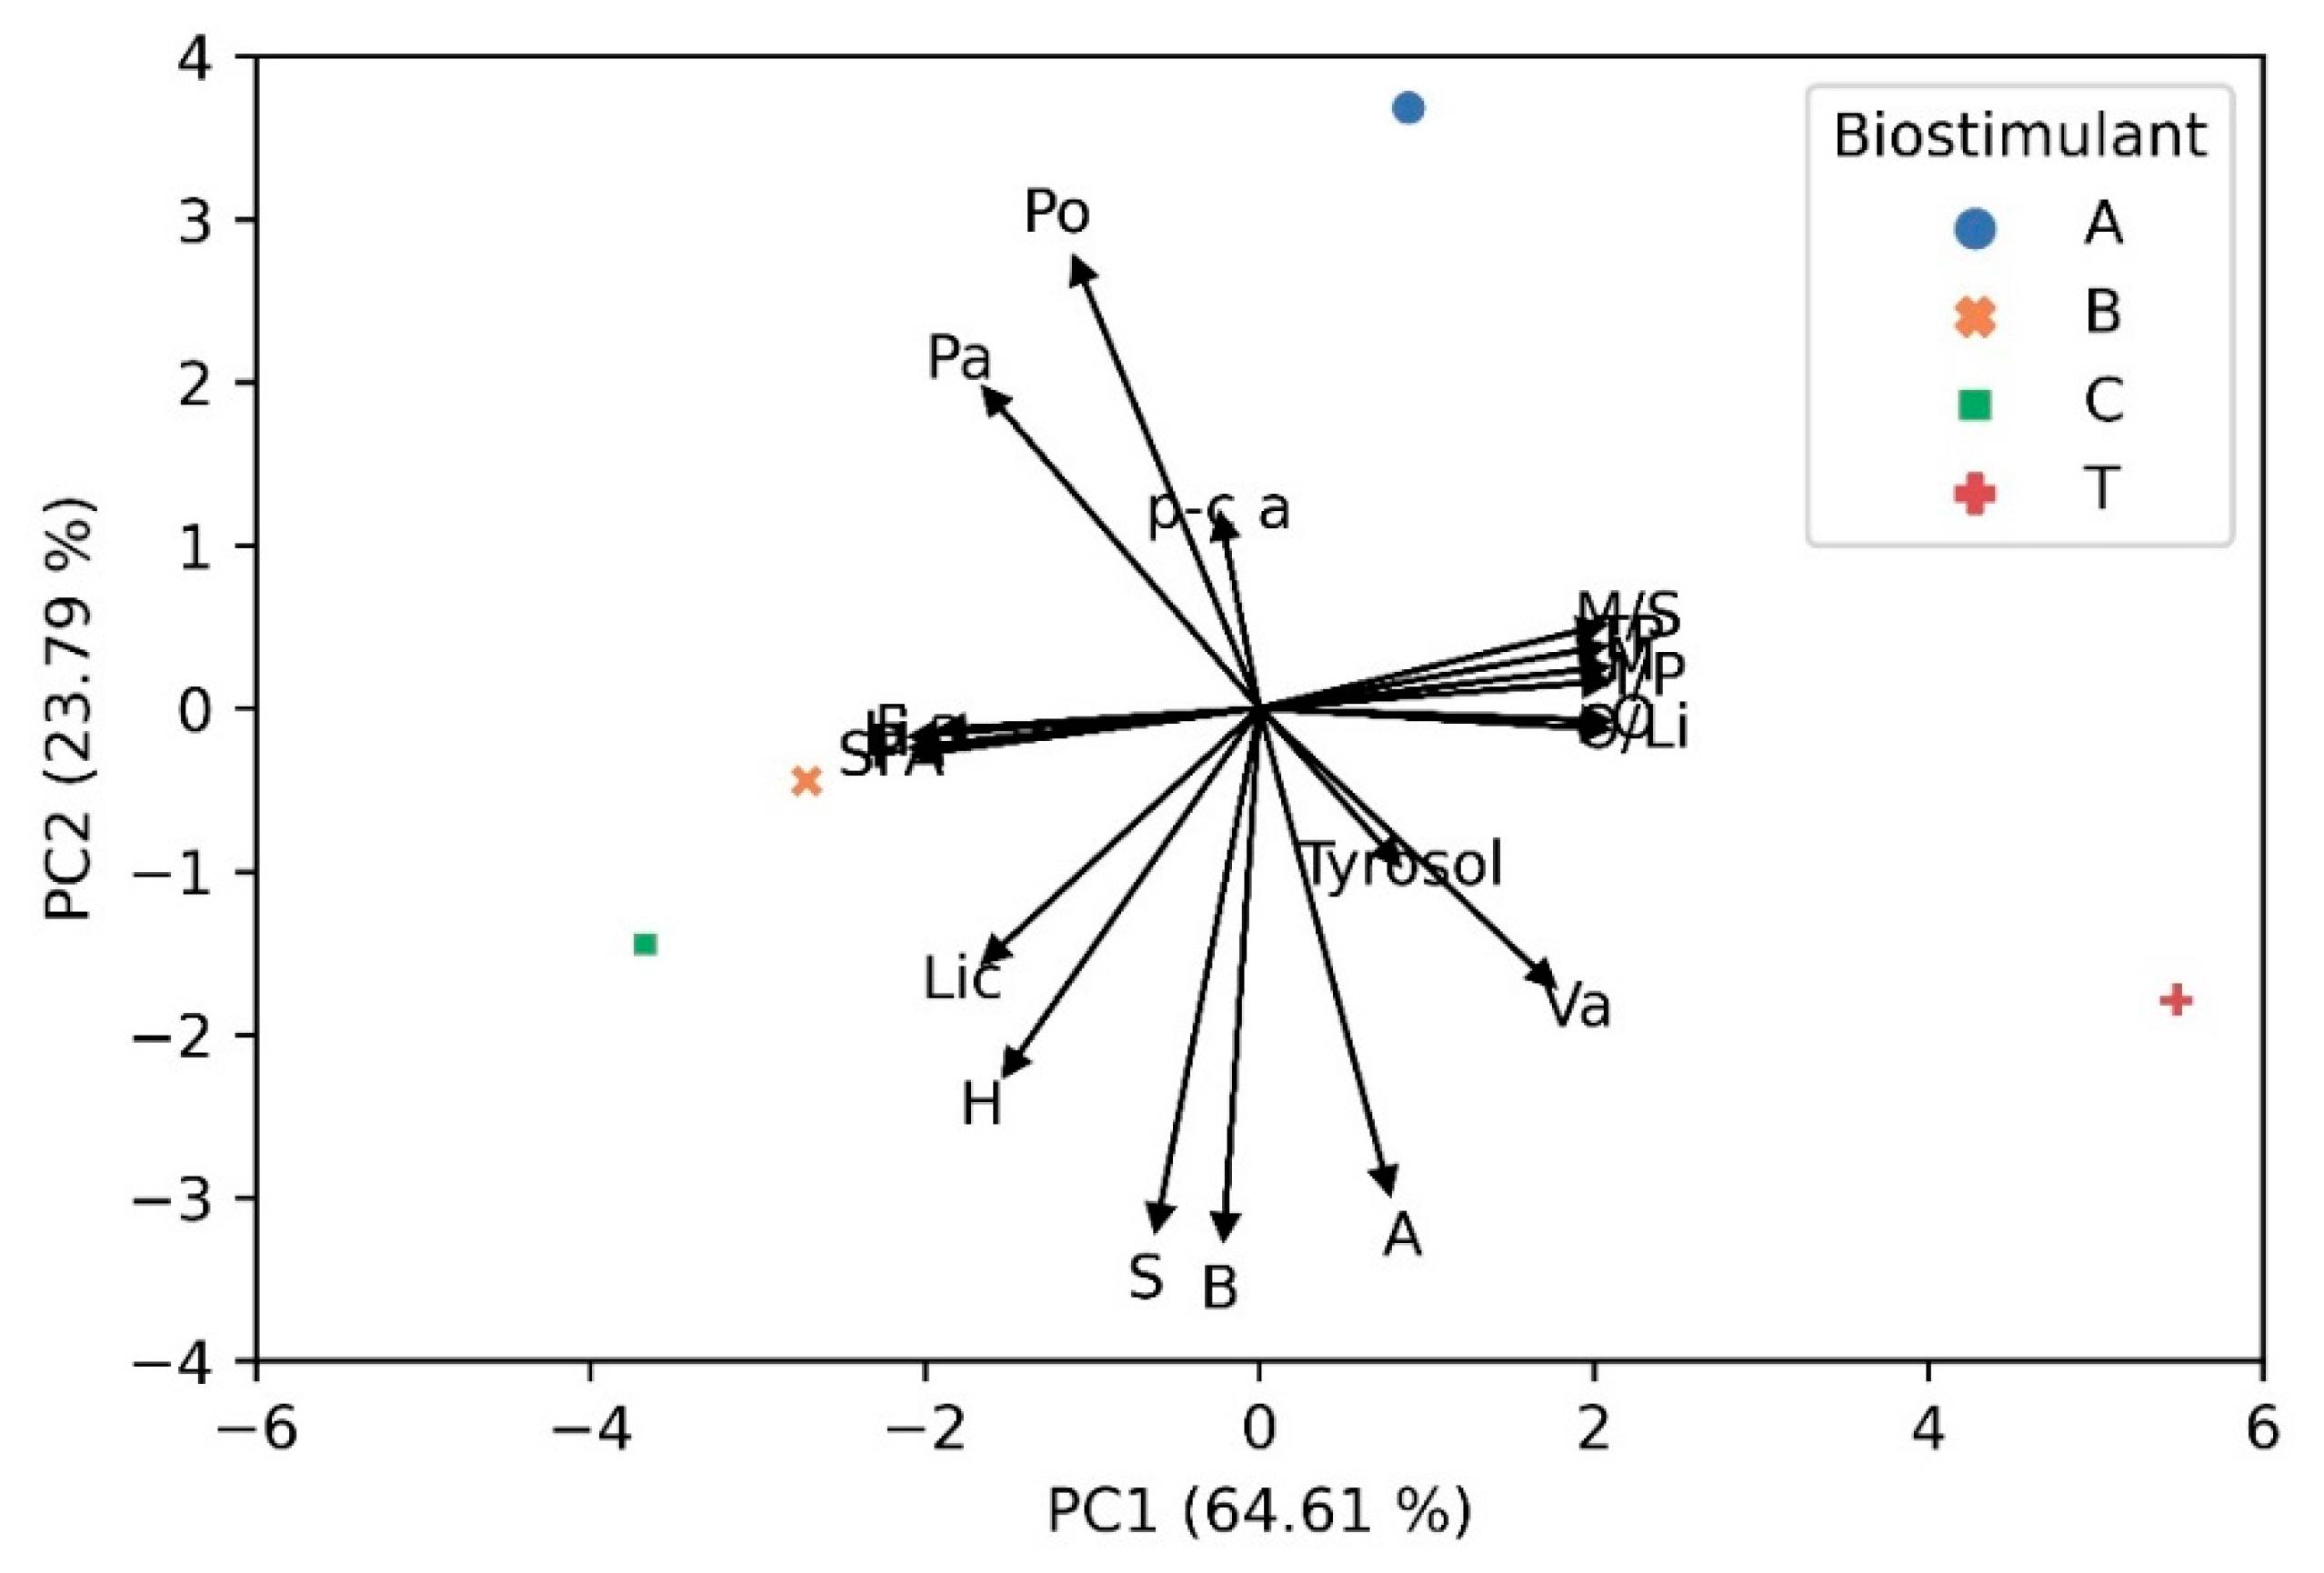
3.8. Principal Component Analysis (PCA)

To obtain a broad overview of the drupes and oil parameters characterizing “Racioppella” cultivar following the biostimulants treatments, two principal component analyses were conducted.
The Figure 3 shows a principal component analysis of all the analyzed parameters of the drupes. The first two principal components (PCs) disclosed 88.56% of the cumulative variance, with PC1 detailing for 59.82% and PC2 for 28.74%. The figure clearly shows the correlation between the three biostimulants and the individual parameters analyzed. PC1 was positively correlated with hydroxytyrosol glucoside, hydroxytyrosol (3,4-DHPEA), tyrosol (4-HPEA), vanillic acid, rutin, elenolic acid, verbascoside, DHPEA-EDA, ligstroside, oleuropeina, p HPEA-EDA, hydroxy-oleuropein-aglycon, luteolin, 3,4-DHPEA-AC, DHPEA-EA, p-HPEA-EA, and total polyphenols, while it was negatively correlated with ligstroside, it instead shows a positive correlation with PC2. The control is placed in the upper left quadrant, and it is correlated only with ligstroside, T is placed in the upper right quadrant and it is correlated with verbascoside,l uteolin, tyrosol, 3,4-DHPEA-EDA, Hydroxytyrosol (3.4-DHPEA),DHPEA-EA, p HPEA-EDA, 3.4 DHPEA-AC; while A and B are in the same lower right quadrant and they are correlated with elenolic acid, rutin, oleuropeina, p-HPEA-EA, vanillic acid, hydroxytyrosol glucoside, hydroxy-oleuropein-aglycon.
Figure 4 shows the principal component analysis of all the analyzed parameters of the oil. PCA was performed on all the analytical data to examine differences between oils. These two principal components account for 88.4% of the variance among the four oil samples, with PC1 and PC2 accounting for 64.61% and 23.79%, respectively. The differences between oil samples suggested that the type of biostimulant treatment has significant influence on oil composition. Indeed, the T sample, showed the highest content of oleic acid, arachidic acid (Table 5), tyrosol, vanillic acid, and total polyphenols (Table 6). C and B samples were present in the same quadrant and C was positively correlated with heptadecanoic, stearic and behenic, linolenic, linoleic acids, PUFA, and SFA (Table 5), while sample B was positively correlated also with ferulic acid (Table 6). In addition, samples belonging to A treatment, forms a distinct cluster in the lower right quadrant.

4. Conclusions

The Mediterranean area is increasingly affected by a climate change scenario where high temperatures compromise the yield and quality of agricultural products, including olives and olive oil. In our study we evaluated the impact of different biostimulants to reduce climate damage and improve the performance of plants and the quality of the derived product. In this study, the biostimulants increased the production per plant, in particular the Trichoderma by about 70%, which positively influenced the carotenoids content and polyphenols biosynthesis in the drupes as well. All the oils analyzed showed quality parameters that fell within the parameters of an extra virgin olive oil. Biostimulants based on tropical plant extracts and trichoderma reported changes to the flavor (bitter and spicy), due to an increase in the total polyphenol content in the oil by 32.1% and 19.8% respectively. All biostimulants influenced the oil fatty acid content. In conclusion, our study demonstrated that it is possible to state that biostimulants affect some qualitative-quantitative aspects of both the oil and the drupes, improving, in some cases, fundamental parameters that determine the consumer satisfaction of a good product, as well as their antioxidant capacity and nutraceutical potential. A second year of testing is currently underway in order to confirm the results obtained in the first year.

Author Contributions

Conceptualization, C.D.V., A.R., Y.R. and R.R.; methodology, G.G., L.D.L. and C.E.-N.; software, A.C.; validation, C.D.V., A.R., Y.R. and R.R.; formal analysis, M.G., M.C. and A.C.; investigation, L.D.L., G.G., C.E.-N. and A.C.; resources, C.D.V., R.R., A.R. and Y.R.; data curation, A.C., M.C. and M.G.; writing—original draft preparation, A.C., L.D.L. and G.G.; writing—review and editing, C.E.-N. and M.G.; supervision, C.D.V., A.R., Y.R. and R.R. All authors have read and agreed to the published version of the manuscript.

Funding

The trial was funded by a PhD scholarship in sustainable agriculture, forestry systems and food security.

Institutional Review Board Statement

Not applicable.

Data Availability Statement

Not applicable.

Acknowledgments

We would like to thank Biolchim, Koppert, and Hello Nature for providing the biostimulant products. The authors are grateful to Andrea Ciervo for her technical support in the laboratory and in field and Giuseppe Carlo Modarelli for the preparation of the PCA.

Conflicts of Interest

The authors declare no conflict of interest.

References

  1. Bita, C.E.; Gerats, T. Plant Tolerance to High Temperature in a Changing Environment: Scientific Fundamentals and Production of Heat Stress-Tolerant Crops. Front. Plant Sci. 2013, 4, 273. [Google Scholar] [CrossRef] [PubMed] [Green Version]
  2. Christensen, J.H.; Christensen, O.B. A Summary of the PRUDENCE Model Projections of Changes in European Climate by the End of This Century. Clim. Chang. 2007, 81, 7–30. [Google Scholar] [CrossRef]
  3. Giorgi, F. Climate Change Hot-Spots. Geophys. Res. Lett. 2006, 33, L08707. [Google Scholar] [CrossRef]
  4. Giannakopoulos, C.; Le Sager, P.; Bindi, M.; Moriondo, M.; Kostopoulou, E.; Goodess, C.M. Climatic Changes and Associated Impacts in the Mediterranean Resulting from a 2 °C Global Warming. Glob. Planet. Chang. 2009, 68, 209–224. [Google Scholar] [CrossRef]
  5. Gualdi, S.; Somot, S.; Li, L.; Artale, V.; Adani, M.; Bellucci, A.; Braun, A.; Calmanti, S.; Carillo, A.; Dell’Aquila, A.; et al. The CIRCE Simulations: Regional Climate Change Projections with Realistic Representation of the Mediterranean Sea. Bull. Am. Meteorol. Soc. 2013, 94, 65–81. [Google Scholar] [CrossRef]
  6. Orlandi, F.; Avolio, E.; Bonofiglio, T.; Federico, S.; Romano, B.; Fornaciari, M. Potential Shifts in Olive Flowering According to Climate Variations in Southern Italy. Meteorol. Appl. 2012, 7, 497–503. [Google Scholar] [CrossRef]
  7. Kottek, M.; Grieser, J.; Beck, C.; Rudolf, B.; Rubel, F. World Map of the Köppen-Geiger Climate Classification Updated. Metz 2006, 15, 259–263. [Google Scholar] [CrossRef]
  8. Fraga, H.; Pinto, J.G.; Viola, F.; Santos, J.A. Climate Change Projections for Olive Yields in the Mediterranean Basin. Int. J. Climatol. 2020, 40, 769–781. [Google Scholar] [CrossRef] [Green Version]
  9. García-Inza, G.P.; Castro, D.N.; Hall, A.J.; Rousseaux, M.C. Opposite Oleic Acid Responses to Temperature in Oils from the Seed and Mesocarp of the Olive Fruit. Eur. J. Agron. 2016, 76, 138–147. [Google Scholar] [CrossRef]
  10. Wang, S. Genotypic Variation in Growth and Physiological Response to Drought Stress and Re-Watering Reveals the Critical Role of Recovery in Drought Adaptation in Maize Seedlings. Front. Plant Sci. 2016, 6, 15. [Google Scholar]
  11. Graziani, G.; Cirillo, A.; Giannini, P.; Conti, S.; El-Nakhel, C.; Rouphael, Y.; Ritieni, A.; Di Vaio, C. Biostimulants Improve Plant Growth and Bioactive Compounds of Young Olive Trees under Abiotic Stress Conditions. Agriculture 2022, 12, 227. [Google Scholar] [CrossRef]
  12. Mazeh, M.; Almadi, L.; Paoletti, A.; Cinosi, N.; Daher, E.; Tucci, M.; Lodolini, E.M.; Rosati, A.; Famiani, F. Use of an Organic Fertilizer Also Having a Biostimulant Action to Promote the Growth of Young Olive Trees. Agriculture 2021, 11, 593. [Google Scholar] [CrossRef]
  13. Cristofano, F.; El-Nakhel, C.; Rouphael, Y. Biostimulant Substances for Sustainable Agriculture: Origin, Operating Mechanisms and Effects on Cucurbits, Leafy Greens, and Nightshade Vegetables Species. Biomolecules 2021, 11, 1103. [Google Scholar] [CrossRef] [PubMed]
  14. Graziani, G.; Ritieni, A.; Cirillo, A.; Cice, D.; Di Vaio, C. Effects of Biostimulants on Annurca Fruit Quality and Potential Nutraceutical Compounds at Harvest and during Storage. Plants 2020, 9, 775. [Google Scholar] [CrossRef] [PubMed]
  15. Di Vaio, C.; Graziani, G.; Gaspari, A.; De Luca, L.; Aiello, A.; Cirillo, A.; Bruno, A.; Romano, R.; Ritieni, A. Drupe Characters, Fatty Acids, Polyphenolic and Aromatic Profile of Olive Oil Obtained from “Oliva Bianca”, Minor Autochthonous Cultivar of Campania. Plants 2021, 10, 1119. [Google Scholar] [CrossRef]
  16. Brown, P.; Saa, S. Biostimulants in Agriculture. Front. Plant Sci. 2015, 6, 671. [Google Scholar] [CrossRef] [Green Version]
  17. Ali, E.F.; Hassan, F.A.S.; Elgimabi, M. Improving the Growth, Yield and Volatile Oil Content of Pelargonium graveolens L. Herit by Foliar Application with Moringa Leaf Extract through Motivating Physiological and Biochemical Parameters. S. Afr. J. Bot. 2018, 119, 383–389. [Google Scholar] [CrossRef]
  18. Fleming, T.R.; Fleming, C.C.; Levy, C.C.B.; Repiso, C.; Hennequart, F.; Nolasco, J.B.; Liu, F. Biostimulants Enhance Growth and Drought Tolerance in Arabidopsis Thaliana and Exhibit Chemical Priming Action. Ann. Appl. Biol. 2019, 174, 153–165. [Google Scholar] [CrossRef]
  19. Almadi, L.; Paoletti, A.; Cinosi, N.; Daher, E.; Rosati, A.; Di Vaio, C.; Famiani, F. A Biostimulant Based on Protein Hydrolysates Promotes the Growth of Young Olive Trees. Agriculture 2020, 10, 618. [Google Scholar] [CrossRef]
  20. Cirillo, A.; Conti, S.; Graziani, G.; El-Nakhel, C.; Rouphael, Y.; Ritieni, A.; Di Vaio, C. Mitigation of High-Temperature Damage by Application of Kaolin and Pinolene on Young Olive Trees (Olea europaea L.): A Preliminary Experiment to Assess Biometric, Eco-Physiological and Nutraceutical Parameters. Agronomy 2021, 11, 1884. [Google Scholar] [CrossRef]
  21. Chouliaras, V.; Therios, I.; Chatzissavvidis, C.; Kouropalatis, T.; Μantzoutsos, Ι. Organic farming fertilization treatments on productivity, skin carotenoids and nutritional status of ‘kalamon’ table olives. Olivebioteq 2011, 2, 465–470. [Google Scholar]
  22. Franzoni, G.; Trivellini, A.; Bulgari, R.; Cocetta, G.; Ferrante, A. Bioactive Molecul es as Regulatory Signals in Plant Responses to Abiotic Stresses. In Plant Signaling Molecules; Elsevier: Amsterdam, The Netherlands, 2019; pp. 169–182. ISBN 978-0-12-816451-8. [Google Scholar]
  23. Briante, R.; Febbraio, F.; Nucci, R. Antioxidant Properties of Low Molecular Weight Phenols Present in the Mediterranean Diet. J. Agric. Food Chem. 2003, 51, 6975–6981. [Google Scholar] [CrossRef] [PubMed]
  24. Calder, P.C. Functional Roles of Fatty Acids and Their Effects on Human Health. JPEN J. Parenter Enter. Nutr. 2015, 39, 18S–32S. [Google Scholar] [CrossRef] [PubMed]
  25. Scarmeas, N.; Stern, Y.; Tang, M.-X.; Mayeux, R.; Luchsinger, J.A. Mediterranean Diet and Risk for Alzheimer’s Disease. Ann. Neurol. 2006, 59, 912–921. [Google Scholar] [CrossRef] [Green Version]
  26. Braga, C.; Vecchia, C.L.; Franceschi, S.; Negri, E.; Parpinel, M.; Decarli, A.; Giacosa, A.; Trichopoulos, D. Olive Oil, Other Seasoning Fats, and the Risk of Colorectal Carcinoma. Cancer Interdiscip. Int. J. Am. Cancer Soc. 1998, 82, 448–453. [Google Scholar] [CrossRef]
  27. Giordano, M.; El-Nakhel, C.; Carillo, P.; Colla, G.; Graziani, G.; Di Mola, I.; Mori, M.; Kyriacou, M.C.; Rouphael, Y.; Soteriou, G.A.; et al. Plant-Derived Biostimulants Differentially Modulate Primary and Secondary Metabolites and Improve the Yield Potential of Red and Green Lettuce Cultivars. Agronomy 2022, 12, 1361. [Google Scholar] [CrossRef]
  28. Woo, S.L.; Ruocco, M.; Vinale, F.; Nigro, M.; Marra, R.; Lombardi, N.; Pascale, A.; Lanzuise, S.; Manganiello, G.; Lorito, M. Trichoderma-based products and their widespread use in agriculture. Open Mycol. J. 2014, 8, 71–126. [Google Scholar] [CrossRef] [Green Version]
  29. Dini, I.; Pascale, M.; Staropoli, A.; Marra, R.; Vinale, F. Effect of Selected Trichoderma Strains and Metabolites on Olive Drupes. Appl. Sci. 2021, 11, 8710. [Google Scholar] [CrossRef]
  30. Sanz-Cortes, F.; Martinez-Calvo, J.; Badenes, M.L.; Bleiholder, H.; Hack, H.; Llacer, G.; Meier, U. Phenological Growth Stages of Olive Trees (Olea europaea). Ann. Appl. Biol. 2002, 140, 151–157. [Google Scholar] [CrossRef]
  31. Aiello, A.; Pizzolongo, F.; Scognamiglio, G.; Romano, A.; Masi, P.; Romano, R. Effects of Supercritical and Liquid Carbon Dioxide Extraction on Hemp (Cannabis Sativa L.) Seed Oil. Int. J. Food Sci. Technol. 2020, 55, 2472–2480. [Google Scholar] [CrossRef]
  32. Khan, W.; Rayirath, U.P.; Subramanian, S.; Jithesh, M.N.; Rayorath, P.; Hodges, D.M.; Critchley, A.T.; Craigie, J.S.; Norrie, J.; Prithiviraj, B. Seaweed Extracts as Biostimulants of Plant Growth and Development. J. Plant Growth Regul. 2009, 28, 386–399. [Google Scholar] [CrossRef]
  33. Francis, F.J.; Markakis, P.C. Food Colorants: Anthocyanins. Crit. Rev. Food Sci. Nutr. 1989, 28, 273–314. [Google Scholar] [CrossRef] [PubMed]
  34. Gonçalves, A.; Silva, E.; Brito, C.; Martins, S.; Pinto, L.; Dinis, L.; Luzio, A.; Martins-Gomes, C.; Fernandes-Silva, A.; Ribeiro, C.; et al. Olive Tree Physiology and Chemical Composition of Fruits Are Modulated by Different Deficit Irrigation Strategies. J. Sci. Food Agric. 2020, 100, 682–694. [Google Scholar] [CrossRef] [PubMed] [Green Version]
  35. Talhaoui, N.; Taamalli, A.; Gómez-Caravaca, A.M.; Fernández-Gutiérrez, A.; Segura-Carretero, A. Phenolic Compounds in Olive Leaves: Analytical Determination, Biotic and Abiotic Influence, and Health Benefits. Food Res. Int. 2015, 77, 92–108. [Google Scholar] [CrossRef]
  36. Dini, I.; Graziani, G.; Fedele, F.L.; Sicari, A.; Vinale, F.; Castaldo, L.; Ritieni, A. Effects of Trichoderma Biostimulation on the Phenolic Profile of Extra-Virgin Olive Oil and Olive Oil By-Products. Antioxidants 2020, 9, 284. [Google Scholar] [CrossRef] [Green Version]
  37. Brand-Williams, W.; Cuvelier, M.E.; Berset, C. Use of a Free Radical Method to Evaluate Antioxidant Activity. LWT Food Sci. Technol. 1995, 28, 25–30. [Google Scholar] [CrossRef]
  38. Benzie, I.F.F.; Strain, J.J. The Ferric Reducing Ability of Plasma (FRAP) as a Measure of “Antioxidant Power”: The FRAP Assay. Anal. Biochem. 1996, 239, 70–76. [Google Scholar] [CrossRef] [Green Version]
  39. Re, R.; Pellegrini, N.; Proteggente, A.; Pannala, A.; Yang, M.; Rice-Evans, C. Antioxidant Activity Applying an Improved ABTS Radical Cation Decolorization Assay. Free Radic. Biol. Med. 1999, 26, 1231–1237. [Google Scholar] [CrossRef]
  40. Genovese, A.; Caporaso, N.; De Luca, L.; Paduano, A.; Sacchi, R. Influence of Olive Oil Phenolic Compounds on Headspace Aroma Release by Interaction with Whey Proteins. J. Agric. Food Chem. 2015, 63, 3838–3850. [Google Scholar] [CrossRef]
  41. Romano, R.; De Luca, L.; Aiello, A.; Rossi, D.; Pizzolongo, F.; Masi, P. Bioactive Compounds Extracted by Liquid and Supercritical Carbon Dioxide from Citrus Peels. Int. J. Food Sci. Technol. 2022, 57, 3826–3837. [Google Scholar] [CrossRef]
  42. Bajoub, A.; Hurtado-Fernández, E.; Ajal, E.A.; Fernández-Gutiérrez, A.; Carrasco-Pancorbo, A.; Ouazzani, N. Quality and Chemical Profiles of Monovarietal North Moroccan Olive Oils from “Picholine marocaine” Cultivar: Registration Database Development and Geographical Discrimination. Food Chem. 2015, 179, 127–136. [Google Scholar] [CrossRef]
  43. Bouaziz, M.; Jemai, H.; Khabou, W.; Sayadi, S. Oil Content, Phenolic Profiling and Antioxidant Potential of Tunisian Olive Drupes. J. Sci. Food Agric. 2010, 90, 1750–1758. [Google Scholar] [CrossRef] [PubMed]
  44. Drobek, M.; Frąc, M.; Cybulska, J. Plant Biostimulants: Importance of the Quality and Yield of Horticultural Crops and the Improvement of Plant Tolerance to Abiotic Stress—A Review. Agronomy 2019, 9, 335. [Google Scholar] [CrossRef] [Green Version]
  45. Di-Vaio, C.; Cirillo, A.; Cice, D.; El-Nakhel, C.; Rouphael, Y. Biostimulant Application Improves Yield Parameters and Accentuates Fruit Color of Annurca Apples. Agronomy 2021, 11, 715. [Google Scholar] [CrossRef]
  46. Colla, G.; Nardi, S.; Cardarelli, M.; Ertani, A.; Lucini, L.; Canaguier, R.; Rouphael, Y. Protein Hydrolysates as Biostimulants in Horticulture. Sci. Hortic. 2015, 196, 28–38. [Google Scholar] [CrossRef]
  47. Harman, G.E. Myths and Dogmas of Biocontrol Changes in Perceptions Derived from Research on Trichoderma harzinum T-22. Plant Dis. 2000, 84, 377–393. [Google Scholar] [CrossRef] [Green Version]
  48. Shoresh, M.; Harman, G.E.; Mastouri, F. Induced Systemic Resistance and Plant Responses to Fungal Biocontrol Agents. Annu. Rev. Phytopathol. 2010, 48, 21–43. [Google Scholar] [CrossRef] [Green Version]
  49. Shafiq, S.; Akram, N.A.; Ashraf, M.; García-Caparrós, P.; Ali, O.M.; Latef, A.A.H.A. Influence of Glycine Betaine (Natural and Synthetic) on Growth, Metabolism and Yield Production of Drought-Stressed Maize (Zea mays L.) Plants. Plants 2021, 10, 2540. [Google Scholar] [CrossRef]
  50. Carillo, P.; Colla, G.; El-Nakhel, C.; Bonini, P.; D’Amelia, L.; Dell’Aversana, E.; Pannico, A.; Giordano, M.; Sifola, M.; Kyriacou, M.; et al. Biostimulant Application with a Tropical Plant Extract Enhances Corchorus Olitorius Adaptation to Sub-Optimal Nutrient Regimens by Improving Physiological Parameters. Agronomy 2019, 9, 249. [Google Scholar] [CrossRef] [Green Version]
  51. Ahmad, P.; Hashem, A.; Abd-Allah, E.F.; Alqarawi, A.A.; John, R.; Egamberdieva, D.; Gucel, S. Role of Trichoderma harzianum in Mitigating NaCl Stress in Indian Mustard (Brassica juncea L.) through Antioxidative Defense System. Front. Plant Sci. 2015, 6, 868. [Google Scholar] [CrossRef] [Green Version]
  52. Fourati, R.; Scopa, A.; Ben Ahmed, C.; Ben Abdallah, F.; Terzano, R.; Gattullo, C.E.; Allegretta, I.; Galgano, F.; Caruso, M.C.; Sofo, A. Leaf Biochemical Responses and Fruit Oil Quality Parameters in Olive Plants Subjected to Airborne Metal Pollution. Chemosphere 2017, 168, 514–522. [Google Scholar] [CrossRef] [PubMed]
  53. do Rêgo Meneses, F.J.; de Oliveira Lopes, Á.L.; Setubal, I.S.; da Costa Neto, V.P.; Bonifácio, A. Inoculation of Trichoderma asperelloides Ameliorates Aluminum Stress-Induced Damages by Improving Growth, Photosynthetic Pigments and Organic Solutes in Maize. 3 Biotech 2022, 12, 246. [Google Scholar] [CrossRef] [PubMed]
  54. Motilva, M.-J.; Romero, M.-P. The Effect of the Ripening Process of the Olive Fruit on the Chlorophyll and Carotenoid Fractions of Drupes and Virgin Oils. In Olives and Olive Oil in Health and Disease Prevention; Elsevier: Amsterdam, The Netherlands, 2010; pp. 59–68. ISBN 978-0-12-374420-3. [Google Scholar]
  55. Yorulmaz, A.; Erinc, H.; Tekin, A. Changes in Olive and Olive Oil Characteristics During Maturation. J. Am. Oil Chem. Soc. 2013, 90, 647–658. [Google Scholar] [CrossRef]
  56. Tekaya, M.; Mechri, B.; Mbarki, N.; Cheheb, H.; Hammami, M.; Attia, F. Arbuscular Mycorrhizal Fungus Rhizophagus irregularis Influences Key Physiological Parameters of Olive Trees (Olea europaea L.) and Mineral Nutrient Profile. Photosynthetica 2017, 55, 308–316. [Google Scholar] [CrossRef]
  57. Rizwan, M.; Ali, S.; Zaheer Akbar, M.; Shakoor, M.B.; Mahmood, A.; Ishaque, W.; Hussain, A. Foliar Application of Aspartic Acid Lowers Cadmium Uptake and Cd-Induced Oxidative Stress in Rice under Cd Stress. Environ. Sci. Pollut. Res. 2017, 24, 21938–21947. [Google Scholar] [CrossRef] [PubMed]
  58. Zouari, I.; Mechri, B.; Tekaya, M.; Dabbaghi, O.; Cheraief, I.; Mguidiche, A.; Annabi, K.; Laabidi, F.; Attia, F.; Hammami, M.; et al. Olive Oil Quality Influenced by Biostimulant Foliar Fertilizers. Braz. J. Biol. Sci. 2020, 7, 3–18. [Google Scholar] [CrossRef] [Green Version]
  59. Rouphael, Y.; Carillo, P.; Cristofano, F.; Cardarelli, M.; Colla, G. Effects of Vegetal- versus Animal-Derived Protein Hydrolysate on Sweet Basil Morpho-Physiological and Metabolic Traits. Sci. Hortic. 2021, 284, 110123. [Google Scholar] [CrossRef]
  60. Massenti, R.; Ciaccio, V.; Bianco, R.L. Foliar applications with sunred® biostimulant advance and uniform fruit ripening in orange and olive. Int. J. Plant Anim. Environ. Sci. 2015, 5, 227–232. [Google Scholar]
  61. Del Buono, D.; Regni, L.; Del Pino, A.M.; Bartucca, M.L.; Palmerini, C.A.; Proietti, P. Effects of Megafol on the Olive Cultivar ‘Arbequina’ Grown Under Severe Saline Stress in Terms of Physiological Traits, Oxidative Stress, Antioxidant Defenses, and Cytosolic Ca2+. Front. Plant Sci. 2021, 11, 603576. [Google Scholar] [CrossRef]
  62. Bendini, A. Phenolic Molecules in Virgin Olive Oils: A Survey of Their Sensory Properties, Health Effects, Antioxidant Activity and Analytical Methods. An Overview of the Last Decade. Molecules 2007, 12, 1679–1719. [Google Scholar] [CrossRef] [Green Version]
  63. Servili, M.; Selvaggini, R.; Esposto, S.; Taticchi, A.; Montedoro, G.; Morozzi, G. Health and Sensory Properties of Virgin Olive Oil Hydrophilic Phenols: Agronomic and Technological Aspects of Production That Affect Their Occurrence in the Oil. J. Chromatogr. A 2004, 1054, 113–127. [Google Scholar] [CrossRef] [PubMed]
  64. Noorali, M.; Barzegar, M.; Sahari, M.A. Sterol and Fatty Acid Compositions of Olive Oil as an Indicator of Cultivar and Growing Area. J. Am. Oil Chem. Soc. 2014, 91, 1571–1581. [Google Scholar] [CrossRef]
  65. Marra, F.P.; Caruso, T.; Costa, F.; Di Vaio, C.; Mafrica, R.; Marchese, A. Genetic Relationships, Structure and Parentage Simulation among the Olive Tree (Olea europaea L. Subsp. europaea) Cultivated in Southern Italy Revealed by SSR Markers. Tree Genet. Genomes 2013, 9, 961–973. [Google Scholar] [CrossRef]
  66. Hernández-Hernandez, G.; Salazar, D.M.; Martínez-Tomé, J.; López-Cortés, I. The Use of Biostimulants in High-Density Olive Growing: Quality and Production. AJAAR 2019, 10, 1–14. [Google Scholar] [CrossRef] [Green Version]
  67. Jukić Špika, M.; Perica, S.; Žanetić, M.; Škevin, D. Virgin Olive Oil Phenols, Fatty Acid Composition and Sensory Profile: Can Cultivar Overpower Environmental and Ripening Effect? Antioxidants 2021, 10, 689. [Google Scholar] [CrossRef] [PubMed]
  68. Bengana, M.; Bakhouche, A.; Lozano-Sánchez, J.; Amir, Y.; Youyou, A.; Segura-Carretero, A.; Fernández-Gutiérrez, A. Influence of Olive Ripeness on Chemical Properties and Phenolic Composition of Chemlal Extra-Virgin Olive Oil. Food Res. Int. 2013, 54, 1868–1875. [Google Scholar] [CrossRef]
  69. El Qarnifa, S.; El Antari, A.; Hafidi, A. Effect of Maturity and Environmental Conditions on Chemical Composition of Olive Oils of Introduced Cultivars in Morocco. J. Food Qual. 2019, 2019, 1854539. [Google Scholar] [CrossRef] [Green Version]
  70. Pinelli, P.; Galardi, C.; Mulinacci, N.; Vincieri, F.F.; Cimato, A.; Romani, A. Minor Polar Compound and Fatty Acid Analyses in Monocultivar Virgin Olive Oils from Tuscany. Food Chem. 2003, 80, 331–336. [Google Scholar] [CrossRef]
  71. Torić, J.; Brozovic, A.; Baus Lončar, M.; Jakobušić Brala, C.; Karković Marković, A.; Benčić, Đ.; Barbarić, M. Biological Activity of Phenolic Compounds in Extra Virgin Olive Oils through Their Phenolic Profile and Their Combination with Anticancer Drugs Observed in Human Cervical Carcinoma and Colon Adenocarcinoma Cells. Antioxidants 2020, 9, 453. [Google Scholar] [CrossRef]
  72. Palla, M.; Digiacomo, M.; Cristani, C.; Bertini, S.; Giovannetti, M.; Macchia, M.; Manera, C.; Agnolucci, M. Composition of Health-Promoting Phenolic Compounds in Two Extra Virgin Olive Oils and Diversity of Associated Yeasts. J. Food Compos. Anal. 2018, 74, 27–33. [Google Scholar] [CrossRef]
  73. Tovar, M.J.; Motilva, M.J.; Romero, M.P. Changes in the Phenolic Composition of Virgin Olive Oil from Young Trees (Olea europaea L. cv. Arbequina) Grown under Linear Irrigation Strategies. J. Agric. Food Chem. 2001, 49, 5502–5508. [Google Scholar] [CrossRef] [PubMed]
  74. Gómez-Alonso, S.; Salvador, M.D.; Fregapane, G. Phenolic Compounds Profile of Cornicabra Virgin Olive Oil. J. Agric. Food Chem. 2002, 50, 6812–6817. [Google Scholar] [CrossRef] [PubMed]
  75. El Riachy, M.; Priego-Capote, F.; León, L.; Luque de Castro, M.D.; Rallo, L. Virgin Olive Oil Phenolic Profile and Variability in Progenies from Olive Crosses. J. Sci. Food Agric. 2012, 92, 2524–2533. [Google Scholar] [CrossRef] [PubMed]
  76. Cicerale, S.; Lucas, L.; Keast, R. Biological Activities of Phenolic Compounds Present in Virgin Olive Oil. Int. J. Mol. Sci. 2010, 11, 458–479. [Google Scholar] [CrossRef] [Green Version]
  77. Mafrica, R.; Piscopo, A.; De Bruno, A.; Poiana, M. Effects of Climate on Fruit Growth and Development on Olive Oil Quality in Cultivar Carolea. Agriculture 2021, 11, 147. [Google Scholar] [CrossRef]
  78. Dini, I.; Graziani, G.; Gaspari, A.; Fedele, F.L.; Sicari, A.; Vinale, F.; Cavallo, P.; Lorito, M.; Ritieni, A. New Strategies in the Cultivation of Olive Trees and Repercussions on the Nutritional Value of the Extra Virgin Olive Oil. Molecules 2020, 25, 2345. [Google Scholar] [CrossRef]
  79. Leogrande, R.; El Chami, D.; Fumarola, G.; Di Carolo, M.; Piegari, G.; Elefante, M.; Perrelli, D.; Dongiovanni, C. Biostimulants for Resilient Agriculture: A Preliminary Assessment in Italy. Sustainability 2022, 14, 6816. [Google Scholar] [CrossRef]
Figure 1. Temperature trend: maximum, minimum, and mean temperature (°C) recorded during the growing season in the open field. The vertical red lines indicate the start and end of the trial period.
Agriculture 12 02173 g001
Figure 2. Antioxidant activity (FRAP, ABTS, and DPPH) of olive drupe treated with three biostimulants: A (tropical plants extract), B (glycine betaine), and T (Trichoderma) all compared with C (control). Values are mean ± standard error and different letters indicate significant differences based on Duncan’s test (p = 0.05).
Agriculture 12 02173 g002
Figure 3. Principal component analysis (PCA) of drupe parameters: hydroxytyrosol glucoside (HG), hydroxytyrosol (3,4-DHPEA) (H), tyrosol (4-HPEA) (T), vanillic acid (VA), rutin (R), elenolic acid (EA), verbascoside (V), DHPEA-EDA (DE), ligstroside (L), oleuropeina (O), p HPEA-EDA (pH-E), hydroxy-oleuropein-aglycon (H-O-A), luteolin (LU), 3,4-DHPEA-AC (3,4-D-A), DHPEA-EA (D-E), p-HPEA-EA (p-H-E), and total polyphenols (TP). C = control, T = trichoderma, B = glycine betaine, A = tropical plants extract.
Agriculture 12 02173 g003
Figure 4. Principal component analysis (PCA) of oil parameters: linolenic (Lic), PUFA (P), SFA, linoleic (Li), ferulic acid (Fa), behenic (B), stearic (S), heptadecanoic (H), p-coumaric acid (p-c a), palmitic (Pa), palmitoleic (Po), arachidic (A), vanillic acid (Va), tyrosol, oleic acid, oleic/linoleic (O/Li), MUFA (M), MUFA/SFA (M/S), MUFA/PUFA (M/P), total polyphenols (TP). C = control, T = trichoderma, B = glycine betaine, A = tropical plants extract.
Agriculture 12 02173 g004
Table 1. Production/plant, Jaen index, oil content, anthocyanins, and carotenoids at the time of drupe harvest of olive “Racioppella” cv. treated with three biostimulants: A (tropical plants extract), B (glycine betaine) and T (Trichoderma), all compared with C (control).
ABCTSignificance
Jaen index 2.992.892.872.9
Production plant−1 (kg)34.44 ± 2.51 b32.00 ± 1.96 b25.00 ± 0.95 c42.73 ± 2.43 a***
Oil content drupe (%)14.3 ± 0.10 b14.1 ± 0.07 b14.3 ± 0.14 b14.7 ± 0.10 a*
Anthocyanins (mgCGE/kg)451.16 ± 1.35 a445.65 ± 2.47 a428.03 ± 4.57 b407.96 ± 2.72 c***
Carotenoids (mg/kg)5.97 ± 0.09 c5.42 ± 0.14 d6.78 ± 0.08 b7.57 ± 0.16 a***
Values are mean ± standard error. Different letters indicate significant differences according to Duncan’s multiple-range test (p = 0.05). Asterisks indicate significant effect of biostimulants treatments according to ANOVA (ns = not significant; * = p < 0.05; *** = p < 0.001).
Table 2. Phenolic profiles and total phenolic composition in drupes treated with three biostimulants: A (tropical plants extract), B (glycine betaine), and T (Trichoderma) all compared with C (control). Concentrations were expressed as µg g−1 dw.
ABCTSignificance
Hydroxytyrosol glucoside17.10 ± 2.29 a12.42 ± 1.31 b4.85 ± 0.47 c5.92 ± 0.96 c***
Hydroxytyrosol (3,4-DHPEA)119.88 ± 52.19 a116.97 ± 35.11 a73.18 ± 7.10 b148.30 ± 22.15 a***
Tyrosol (4-HPEA)13.63 ± 0.88 bc17.76 ± 1.39 b8.26 ± 1.12 c49.16 ± 3.95 a***
Vanillic acid17.68 ± 0.61 a18.21 ± 2.08 a7.52 ± 1.03 b11.82 ± 2.75 b**
Rutin81.62 ± 32.27 a91.88 ± 33.00 a77.36 ± 15.82 a88.65 ± 23.75 ans
Elenolic acid25.69 ± 1.92 a19.33 ± 1.40 a20.25 ± 2.17 a22.17 ± 3.68 ans
Verbascoside8274.50 ± 708.05 ab8486.11 ± 468.73 ab7078.61 ± 618.05 b9420.64 ± 477.80 ans
3,4-DHPEA-EDA518.22 ± 148.5 a308.79 ± 124.3 a391.49 ± 181.3 a615.32 ± 38.6 ans
Ligstroside13.31 ± 12.39 c20.54 ± 16.86 bc47.00 ± 23.97 ab66.00 ± 31.76 a**
Oleuropein473.92 ± 80.91 a610.51 ± 119.94 b582.78 ± 64.24 b532.67 ± 122.40 ab*
p HPEA-EDA10.10 ± 0.95 b14.09 ± 0.73 a10.51 ± 1.35 b15.04 ± 4.83 ans
Hydroxy-Oleuropein-aglycon8.57 ± 2.45 ab9.73 ± 1.77 a5.52 ± 1.66 b8.50 ± 4.52 abns
Luteolin20.49 ± 1.61 bc31.31 ± 10.39 b14.92 ± 2.23 c67.20 ± 22.79 a***
3,4-DHPEA-AC56.59 ± 44.83 a42.92 ± 33.15 ab12.27 ± 1.84 b65.38 ± 33.09 a*
DHPEA-EA412.82 ± 147.25 bc225.98 ± 94.42 ab193.58 ± 109.45 a478.94 ± 89.65 c**
p-HPEA-EA17.04 ± 3.16 a17.84 ± 5.95 a8.37 ± 0.95 b17.14 ± 1.57 a*
Total polyphenols10,081.16 ± 812.41 ab10,044.36 ± 544.34 ab8535.46 ± 698.45 b11,612.85 ± 534.10 a**
Values are mean ± standard error. Different letters indicate significant differences according to Duncan’s multiple-range test (p = 0.05). Asterisks indicate significant effect of biostimulants treatments according to ANOVA (ns = not significant; * = p < 0.05; ** = p < 0.01; *** = p < 0.001).
Table 3. Quality indices of analyzed oils treated with three biostimulants: A (tropical plants extract), B (glycine betaine), and T (Trichoderma) all compared with C (control).
Oil Quality IndexABCT
Acidity (% oleic acid 100 g−1 oil)0.31 ± 0.01 a0.31 ± 0.01 a0.28 ± 0.01 b0.29 ± 0.01 b
Peroxide value (meqO2 kg−1)9.08 ± 0.04 a7.4 ± 0.04 b5.34 ± 0.03 d7.01 ± 0.03 c
K2700.17 ± 0.00 c0.17 ± 0.00 c0.20 ± 0.00 b0.25 ± 0.00 a
K2321.61 ± 0.01 b1.30 ± 0.01 d1.46 ± 0.00 c1.76 ± 0.00 a
Delta K−0.01 ± 0.00 b0.00 ± 0.00 a0.00 ± 0.00 a−0.01 ± 0.00 b
Values are mean ± standard error. Different letters indicate significant differences according to Duncan’s multiple-range test (p = 0.05).
Table 4. Panel test of oils treated with three biostimulants: A (tropical plants extract), B (glycine betaine), and T (Trichoderma) all compared with C (control).
Panel TestABCT
Fruity6.65.47.23.6
Bitterness65.43.65.8
Pungency6.444.66.2
Heating/Sludge0000
Winey/Acid/acidic/sour0000
Rancid0000
Mold/moisture/ground0000
Frozen olive0000
Table 5. Fatty acid composition of analyzed oils treated with three biostimulants: A (tropical plants extract), B (glycine betaine), and T (Trichoderma) all compared with C (control).
% Fatty AcidsABCTSignificance
Palimitic (C16)14.00 ± 0.04 a13.67 ± 0.03 b13.90 ± 0.06 a12.66 ± 0.02 c***
Palmitoleic (C16:1)1.43 ± 0.01 a1.28 ± 0.02 b1.10 ± 0.01 c0.82 ± 0.00 d***
Heptadecanoic (C17)0.06 ± 0.00 c0.19 ± 0.01 a0.20 ± 0.00 a0.11 ± 0.00 b***
Stearic (C18)2.14 ± 0.01 c2.77 ± 0.02 b2.90 ± 0.02 a2.72 ± 0.01 b***
Oleic (C18.1n9c)68.81 ± 0.04 b67.15 ± 0.01 c66.23 ± 0.00 d71.53 ± 0.03 a***
Linoleic (C18:2 Z 9, 12)12.15 ± 0.04 c13.34 ± 0.05 b14.06 ± 0.04 a10.63 ± 0.01 d***
Arachidic (C20)0.33 ± 0.01 d0.36 ± 0.01 c0.39 ± 0.00 b0.41 ± 0.00 a***
Linolenic (C18:3n3)0.96 ± 0.02 b1.12 ± 0.02 a1.08 ± 0.00 a0.98 ± 0.01 b***
Behenic (C22)0.11 ± 0.00 a0.14 ± 0.00 a0.14 ± 0.00 a0.14 ± 0.01 ans
MUFA70.24 ± 0.03 b68.43 ± 0.03 c67.34 ± 0.01 d72.35 ± 0.03 a***
PUFA13.12 ± 0.02 c14.46 ± 0.03 b15.14 ± 0.04 a11.61 ± 0.01 d***
SFA16.65 ± 0.05 c17.11 ± 0.00 b17.53 ± 0.04 a16.04 ± 0.03 d***
MUFA/PUFA5.35 ± 0.01 b4.64 ± 0.01 c4.38 ± 0.01 d6.16 ± 0.00 a***
MUFA/SFA4.22 ± 0.01 b3.92 ± 0.00 c3.78 ± 0.01 d4.46 ± 0.01 a***
Oleic/linoleic5.66 ± 0.01 b5.03 ± 0.02 c4.71 ± 0.01 d6.73 ± 0.00 a***
Values are mean ± standard error. Different letters indicate significant differences according to Duncan’s multiple-range test (p = 0.05). Asterisks indicate significant effect of biostimulant treatments according to ANOVA (ns = not significant; *** = p < 0.001).
Table 6. Polyphenols content of analyzed oils treated with three biostimulants: A (tropical plants extract), B (glycine betaine), and T (Trichoderma) all compared with C (control).
Compounds (mg/kg)ABCTSignificance
Tyrosol8.52 ± 0.06 b9.43 ± 0.13 a8.17 ± 0.11 c9.25 ± 0.09 a***
p-coumaric acid4.53 ± 0.00 b4.70 ± 0.01 a4.31 ± 0.01 d4.43 ± 0.01 c***
Ferulic acid0.76 ± 0.01 c0.87 ± 0.01 a0.81 ± 0.01 b0.70 ± 0.00 d***
Vanillic acid0.40 ± 0.00 bc0.38 ± 0.00 c0.42 ± 0.01 b0.58 ± 0.00 a***
Oleuropein<LOD<LOD<LOD<LOD
Total polyphenols529.81 ± 7.52 b476.64 ± 11.93 c442.31 ± 10.77 d584.69 ± 3.93 a***
Values are mean ± standard error. Different letters indicate significant differences according to Duncan’s multiple-range test (p = 0.05). Asterisks indicate significant effect of biostimulants treatments according to ANOVA (ns = not significant; *** = p < 0.001). LOD: limit of detection.
Publisher’s Note: MDPI stays neutral with regard to jurisdictional claims in published maps and institutional affiliations.

