Article

Economic Resilience of EU Dairy Farms: An Evaluation of Economic Viability

Faculty of Economics, West Pomeranian University of Technology in Szczecin, al. Piastów 17, 70-310 Szczecin, Poland
*
Author to whom correspondence should be addressed.
Agriculture 2021, 11(6), 510; https://doi.org/10.3390/agriculture11060510
Submission received: 23 April 2021 / Revised: 21 May 2021 / Accepted: 29 May 2021 / Published: 31 May 2021
(This article belongs to the Section Agricultural Economics, Policies and Rural Management)

Abstract

:
The economic viability of dairy farms is a measure of their ability to survive and grow. Its measurement is particularly important in periods of changes taking place in the environment of these entities. The last decade of the European dairy market was characterized by significant changes in regulations, which resulted in fluctuations in farm gate milk prices and, consequently, impacts on farm income. The main objective of the research was to assess the economic viability of dairy farms located in the European Union. The research area covered the countries that have the most raw cows’ milk delivered to dairies in the EU, and FADN data from 2009 to 2018. A comparative analysis was carried out on the level of temporal viability and permanent viability of farms classified by economic size. The research results showed that better temporal viability was achieved by farms with a larger production scale. On the other hand, the permanent economic viability was lower on farms belonging to a higher economic size class. Most of the analyzed groups of farms were in the survival phase. This means that dairy farms struggled to meet the costs of unpaid labor. Including direct payments in the calculation resulted in an improvement in temporal viability only in farms with the lowest economic size classes.

1. Introduction

The European Union itself has a 20% share in the world’s milk production and is the largest exporter of milk and dairy products in the world. In 2019, these exports amounted to over 22 million tonnes, which accounted for 30% of the world’s exports of milk and dairy products. Eurostat data show that in EU countries about 95% of the raw milk is produced by dairy cows.
There are two types of changes occurring on dairy farms in the European Union: concentration and intensification of production [1]. Their consequence is a continuous decrease in the number of farms, biological and technical progress changing the production system, and increasing specialization combined with increasing herds of dairy cows. The described trends cause many problems related to environmental protection, ensuring animal welfare, increasing risk of farming and eliminating family farms from the dairy sector [2]. Therefore, an important aspect of dairy farms economics is to identify their economic viability. Economic viability is closely related to the farm’s ability to cover operating costs and liabilities, development and achieving economic sustainability [3]. The study of economic viability allows diagnosing the condition of farms and their development potential. Determining its level allows us to determine whether farms have resilience to the changes occurring in the farm environment. The economic viability survey provides feedback on how agricultural policy ensures that family farms continue to stay at the heart of the European agricultural model [4].
The economic viability of farms based on its measurement or factors determining its level. The literature of agriculture economics often uses the definition of viability by J. P. Frawley and P. Commins. According to these authors, economic viability is the farm’s ability to cover the costs of unpaid family labor at the level of the average wage in the agricultural sector (in many publications it is minimal wage) and the ability to provide additional return from assets other than land (in many publications it is a minimum of 5%) [3,5,6,7,8,9]. The review of the definition of farm economic viability prepared by O’Donoghue et al. [10] shows that it is associated with the following: (a) the security of providing the farmer and his family with a livelihood in the long term; (b) the possibility of making an investment in farms; (c) earning a long-term remuneration comparable to the remuneration that can be obtained as a result of alternative employment; (d) the ability to survive, operate a business (life) and develop a farm. Scientific publications highlight the separation of the concepts of economic viability and the economic dimension of sustainable agriculture. Many authors recognize that a farm can be sustainable if it is not economically viable. They indicate that economic sustainability can be achieved through off-farm income [5,6,10,11].
The measurement of economic viability is most often based on the calculation of a set of indicators determining whether a farm is viable or non-viable. For this purpose, profitability, liquidity, solvency, stability and productivity indicators are used [12,13,14]. However, the base is the income of the family farm or the farm net income [7,10,11,15,16,17,18]. Most researchers classify farms and define the type of economic viability. Barnes et al. [3] divide the economic viability in agriculture into short-term and long-term. Short-term life is calculated using annual net cash income. On the other hand, the measurement of long-term viability is based on the average farm income from three years, taking into calculation the opportunity costs of farm-owned production factors. A similar approach is used by Coppola et al. [18].
O’Donoghue et al. [10] indicate three basic criteria for building economic viability models:
  • Opportunity cost allowing to determine whether it would be more profitable for the farmer and his family to provide work outside the farm and invest the capital in other projects,
  • Cost of own capital (COC) reflecting the farm’s ability to cover opportunity costs of capital, which means that the farm has the funds to invest,
  • Viability threshold, defined as the average wage in the economy or in agriculture (as research shows, it can be adopted as the minimum wage in agriculture).
The results of studies on economic viability have shown that the opportunity costs of labour and capital are fundamental in its measurement. Therefore, great attention is paid to the cost valuation method, especially in international comparisons. Choosing the wrong approach may lead to the inclusion of low-income group farms with high economic viability, as they have low opportunity labor costs [10]. When calculating the costs of unpaid labor, one of the three types of wages is most often assumed: the minimum wage, the average wage in agriculture or the national average wage [15,19]. The use of the minimum national wage raises questions: do farms that are considered viable have development opportunities and does the minimum wage support the farmer and his family [20]? According to Spicka et al. [11], the adoption of the average wage in agriculture in the calculation of the opportunity cost does not reflect the idea of choosing the best variant in the decision-making process. Therefore, it is justified to use the national average wage as a measure of the opportunity cost of labor In turn, the valuation of the equity capital is based on two approaches: opportunity cost or the value of assets and liabilities. The opportunity cost of own capital is estimated using the interest rate on long-term government bonds as a low-risk alternative return [10,18,21] or a fixed 5% return [15,22]. In the second approach, the value of fixed and current assets and the total amount of liabilities are used [23].
The review of the literature shows that there is consistency among definitions of economic viability. As more and more studies appear, previously developed definitions are used, which gives grounds to conclude that the problem of ambiguous terminology does not arise. The situation is different when it comes to methods of measuring economic viability. The methods used to determine its level are diverse. Special attention can be paid to approaches related to the valuation of opportunity costs. This applies to the determination of the value of the cost of equity and family labor force. Often we can see that there are repeated attempts to find the best way to value these costs. International comparisons of farm economic viability should seek to consider the specific economic conditions of the countries included in the analysis. Hence, in recent years, approaches based on the use of average gross wages in the national economy for the stock of family labor and, in the case of equity, the return on long-term government bonds have prevailed. The main objective of the research was to measure the economic viability of farms specializing in dairy, carrying out farming activities in the countries that are the largest milk producers in the European Union. The objective was achieved by comparing the results in groups of farms with the same economic size class in 2009–2018. The source of the data was the FADN database for groups of farms specializing in dairy.

2. Materials and Methods

2.1. Conception of Comparative Analysis

The object of the research was groups of farms specializing in dairy located in the field of observation of the European Farm Accountancy Data Network (FADN). It is a network for collecting accounting data on the income and economic activity of farms in the EU. The research area was limited to producers operating in the ten countries with the largest milk producers in the European Union. In 2018, these were the following: Germany, France, the United Kingdom, the Netherlands, Poland, Italy, Ireland, Spain, Denmark and Belgium. These countries collectively, approximately, produced 90% of the milk in the EU. Groups of farms were classified to six economic size classes (classification according to FADN: ES6). It is based on the value of Standard Output (SO), calculated as the average monetary value of the agricultural output at farm-gate price of each agricultural product (crop or livestock) in a given region. The SO was calculated by Member States per hectare or per head of livestock, by using basic data for a reference period of 5 successive years [24].
Table 1 shows the heterogeneity of dairy farms in the analyzed countries. There are three situations worth noting. Firstly, a small number of countries with low scale farms (medium–small) have a significant share in the structure of farms specializing in dairy. Secondly, there are countries, such as Belgium and Denmark, for which the FADN only collects data from farms in the highest economic classes. This means that these countries are dominated by farms with large herds of dairy cows. Third, only in the SO ranging from EUR 100,000 to 500,000 (large farms) there is a situation where farms from all countries can be subjected to comparative analysis.
The economic viability was assessed with two type synthetic economic indices developed by Savickiene et al. [13]:
  • Temporal viability index (short-term viability);
  • Permanent viability index (long-term viability).
In view of the importance of direct payments in farms’ economic situations [25], the calculations were made in two variants: pure economic viability (excluding total direct payments) and subsidized economic viability (including total direct payments).
The index of the temporal viability of a farm was used for an assessment of short-term economic viability. Its value depends on the components farm financial result, i.e., on the level of production in basic prices, intermediate consumption, depreciation, taxes and costs of external factors, and in the case of the subsidized index, also on direct payments. Short-term economic viability allows to identify the phase (stage) of the farm life cycle. There are three phases [13,26,27]:
  • The survival phase occurs when the farm generates an income that is lower than the potential income from outside the farm business. This phase is indicated by a value of the farm temporal viability index below 1.0. The results of Glover and Reay [28] show that family dairy farms are able to continue farming despite minimal economic returns by implementing different strategic behaviors (diversifying the business, debt maximizing, sacrificing family needs and compromising). The choice of behavior is determined by the needs of the family and the business to ensure the survival of the farm for future generations and the maintenance of socioemotional wealth.
  • In the life phase there are farms where the level of net value added makes it possible to meet the needs of the farmer and his family. In addition, the farmer can develop needs and decide how to satisfy them. This means that farmers will not necessarily focus their activities on growth or development, as meeting the needs of the family may take priority. The farm in the life phase achieves the temporal viability index in the range of 1.0–1.2.
  • The development phase occurs when, after meeting the needs of the farmer and his family, some of the income allows to increase the farm’s potential remains. This means that farmers can allocate resources for farm development. The development phase is confirmed by the value of viability index exceeding 1.2.
The pure temporal viability index and the subsidized temporal viability index (including total direct payments) are calculated according to Formulas (1) and (2):
P T V I = T O ( I N T C o n s + D + T + E X T F a c + U L a b )
S T V I = T O + D P ( I N T C o n s + D + T + E X T F a c + U L a b )
where PTVI—pure temporal viability index, STVI—subsidized temporal viability index, TO—total output at basic prices, DP—total direct payments, INTCons—intermediate consumption, D—depreciation, T—taxes, EXTFac—external factors, and ULab—value of unpaid labor (farmer and family members).
From the perspective of the measure of economic viability, an important activity is the assessment of the property and capital situation of a farm. Adding total assets and total liabilities to the temporal viability index allows the calculation of the durable life ratio. Its level determines the long-term potential and signals changes in the financial situation of a farm. The value of the permanent viability index below 1.0 (also subsidized) should be interpreted as a situation in which a farm can only maintain the level of the current potential. However, exceeding this value means the ability to increase the potential. The method of calculating the indices of sustainable economic viability (3) and (4) is presented below:
P P V I = T O + A T o t ( I N T C o n s + D + T + E X T F a c + U L a b + L T o t )
S P V I = T O + D P + A T o t ( I N T C o n s + D + T + E X T F a c + U L a b + L T o t )
where PPVI—pure permanent viability index, SPVI—subsidized permanent viability index, TO—total output at basic prices, DP—total direct payments, INTCons—intermediate consumption, D—depreciation, T—taxes, EXTFac—external factors, ULab—value of unpaid labour (farmer and family members), ATot—total farm assets, and LTot—total liabilities.
The calculation of unpaid labor costs was important in the estimation of individual indicators. Based on the analysis of the literature, it was decided that their level would be determined using the national average wages. For this purpose, data published by OECD were used [29].

2.2. Descriptions of Farm Groups and Their Economic Viability Components in 2009–2018

All groups of farms were described with financial and organizational variable data characteristic for dairy farms. Table 2 shows that the average number of cows increases with the next group of farms. The difference between medium–large and medium–small classes is doubled. Comparing higher classes with each other, it increases. An example may be the groups of Spanish and German farms, where the average number of dairy cows on very large farms was four times higher than on large farms. Another characteristic feature is the high differentiation of milk yield. In 2009–2018, this ranged from 4500 to 9500 kg and increased with the average size of the dairy herd. The most homogenous group in milk yield were Spanish farms, where very large farms achieved, on average, about 25% higher milk yield than medium–small farms. For comparison, in German or Italian farms, the difference was over 50%.
The concentration of production and the balance between the demand for the feed produced on the farm and the demand for purchased feed were determined by the ratio of the number of animals expressed in livestock unit (LU) per hectare of forage area (stocking density). The values of this indicator make it possible to divide the researched groups into two sets. The first set with stocking density lower than 2.0 LU/ha included all groups of farms located in Germany, France and Poland. This means a high share of feed produced on farms in the cattle nutrition. In the second set, where the stocking rate exceeded 2.0 LU/ha, there were groups of Belgian and Dutch farms, which proves a high concentration of milk production.
In Table 2, we can also observe the increased importance of hired labor in groups with a large production scale. This situation occurred in German, Danish, Spanish, British or Italian farms. In group with the highest economic size class, the average share of the family labor in the total labor input ranged from 17 to 47%. At the opposite end, there are medium–small and medium–large farms, where this share exceeded 90%. A unique situation has arisen in Belgian farms, although there are only large and very large farms and the share of contract work is below 10%.
The economic situation of dairy farms is described by two indicators: the value of total production per labor input (labor productivity) and production profitability, calculated as the quotient of production value and total costs. The group with labor productivity up to EUR 75 per AWU includes medium–small class, medium–large class, and large Polish farms. The second group are farms with labor productivity in the range of EUR 76–150 per AWU. It includes large farms from seven countries (except Denmark, the Netherlands and Poland). The last group includes farms with labor productivity exceeding EUR 150 per AWU, farms with the largest production scale. It should be noted that the highest labor productivity of almost EUR 300 per AWU was achieved by Danish and Dutch farms. The results indicated that high profitability of production was observed on Polish and Italian farms, which is confirmed by the profitability index exceeding 130%. Only in four cases there was a situation where production was unprofitable (index lower than 100%). It concerned very large dairy farms (three out of four cases) in Denmark, Germany and France.
Table 3 includes the values of the economic viability index components. These parameters show high variability both within and between economic size classes. The highest total production was usually characterized by Italian and Danish farms, and its lowest level was in farms from Poland, Spain and Belgium. There are large differences in direct payments between countries, which appear to be higher with the economic size of the farms. Among all the surveyed countries, Italian, Polish and Belgian farms received the lowest value of direct payments. Another feature of the Polish and Belgian dairy farms was the low level of intermediate consumption, especially compared with Danish and German farms (medium–small and very large classes).
Analysis of the cost structure showed that the share of depreciation ranged from 5% to 25% and decreased with the economic size of the researched groups of farms. Spanish, Irish and Italian farms (excluding medium–small farms) were characterized by the lowest depreciation value compared to the same economic size class from France, Germany and Denmark. Significant differences were also observed in the amount of tax burdens; their share in total costs did not exceed 3%. Italian, Danish and Dutch farmers paid higher taxes than dairy farmers in the same economic size group from Poland, Ireland or the United Kingdom.
The costs of external factors include the aggregate costs of remuneration and the costs of interest paid. Polish and Spanish farms belonged to the least indebted and smallest use of hired labor. The huge disparities in the costs of external factors were observed in the two highest economic size classes. An analysis of the engagement of own labor and capital resources showed high disproportions within and between the groups. Despite the highest labor input of family labor, the lowest unpaid labor costs were among Polish farms. This situation resulted from the level of the Polish national average wage, which was the lowest among the analyzed countries (Figure 1). The relatively high input of family labor and the national average wage resulted in one of the highest opportunity costs of labor on Belgian, Dutch and Irish farms. Table 3 also shows that the French and Danish farms were the most heavily debt-financed, with a debt to assets ratio of more than 50%. In the remaining groups of farms, external financing activities were less important, and in medium–small and medium–large farms, their share did not exceed 10% of the value of total assets.
The level of economic viability of farms was also determined by the size and dynamics of wage changes (Figure 1). The OECD data show that in 2018, the average wage in Denmark amounted to EUR 60,000. Employees in Italy and Spain received half of this salary. However, the average wage in Poland was five times lower than in Denmark and more than two times lower than in Spain and Italy. In 2009–2018, all national wages were in an upward trend. Figure 1 shows uneven growth, which exacerbated the differences between the countries. For comparison, the ten-year wage change in Spain was 3.5% and in Germany, 26.7%. However, the greatest change was in Poland, with a 47% wage increase between 2009 and 2018.

3. Results

3.1. The Short-Term Economic Viability

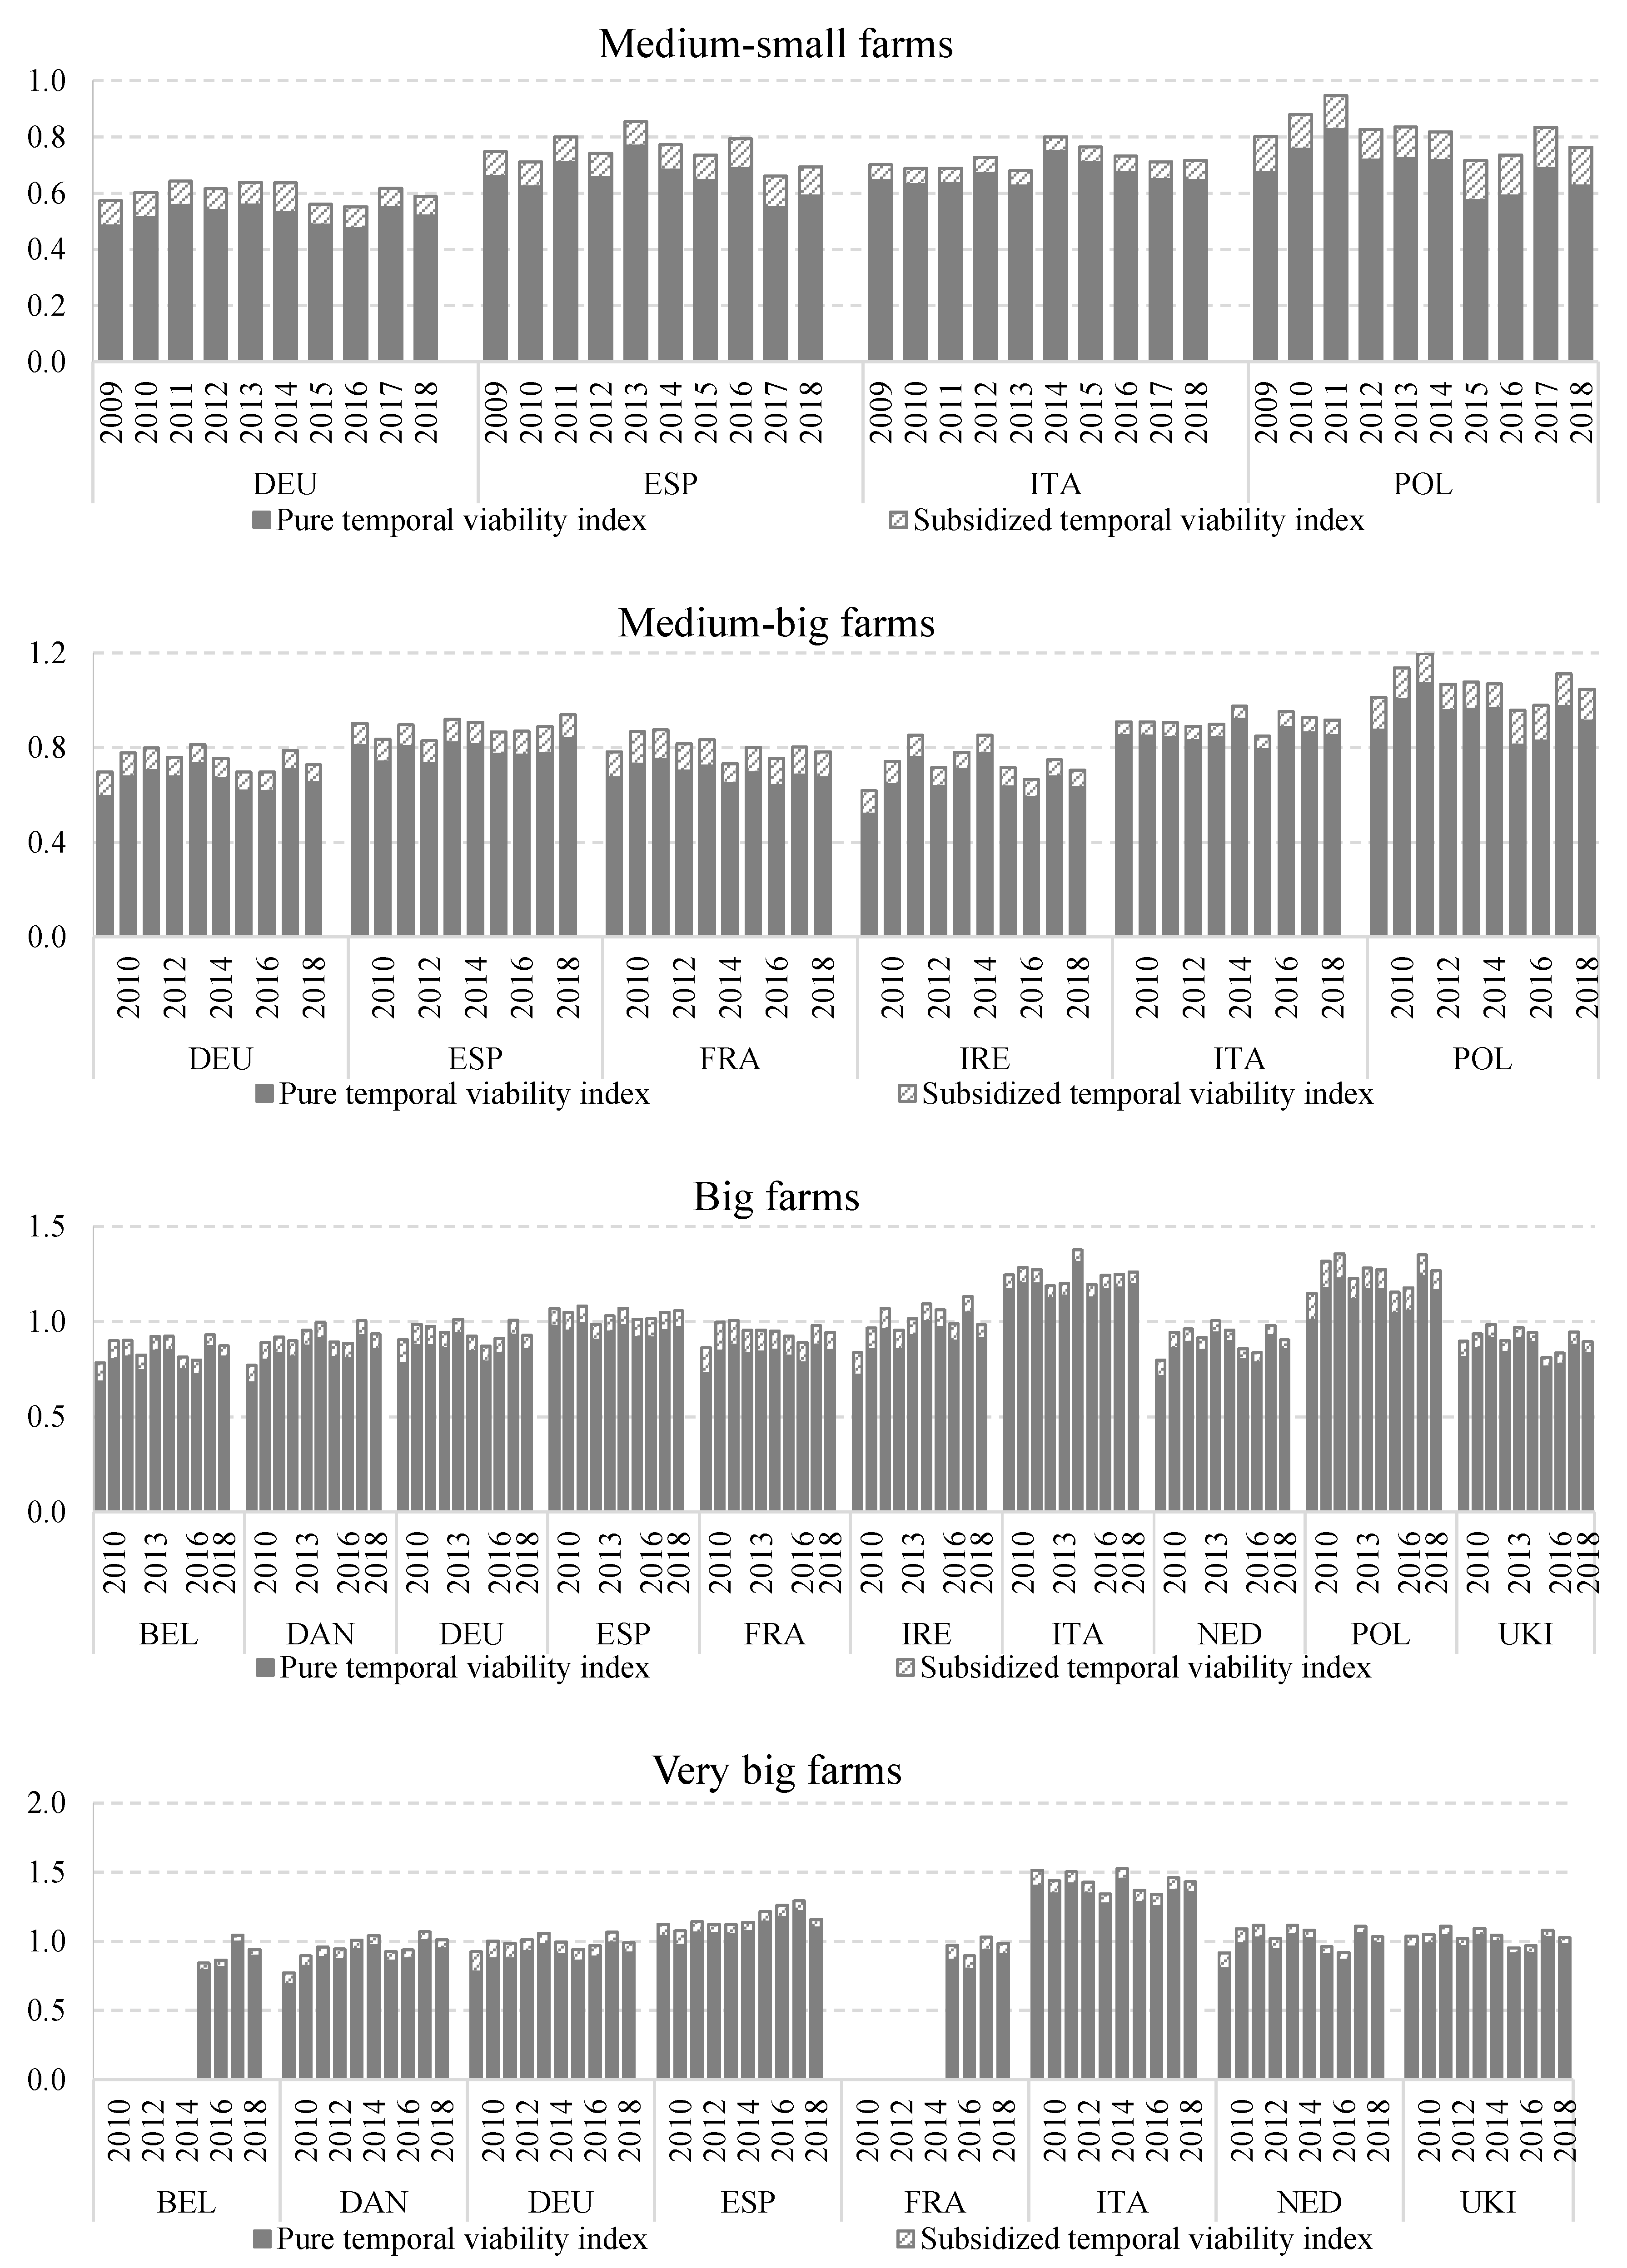
The values of temporal viability indices inform that in 2009–2018, without direct payments included, 4/5 of the analyzed farm groups remained in the survival phase of the life cycle. After including direct subsidies, this ratio dropped to 2/3 (Figure 2). This means that farmers and their families were unable to earn the national average wage. Only a few groups reached the phases of life and development, and it involved farms with a larger production scale.
The analysis of the performance of medium–small farms showed that even with income including direct subsidies, none of them was able to cover the cost of unpaid family labor (survival phase). The lowest short-term viability was characteristic of German farms, where the STVI value ranged from 0.55 to 0.64. Such a low value of the index was mainly due to the highest level of total costs compared to groups of medium–small farms from other countries.
In the medium–large class, Polish dairy farms stood out. They were in the life phase, showing the ability to earn an income including direct payments and labor opportunity costs. In the other groups of medium–large farms, STVI indices ranged from 0.62 (Irish farms) to 0.98 (Italian farms). The main determinants of the low value of the temporal index were high production costs (French farms), high costs of external factors of production (German farms) and high unpaid labor costs (Irish farms).
The level of the PTVI index calculated for large farms indicated that 8 of the 10 farm groups were in the survival phase. Only Italian and Polish dairy farms reached the phase of life. Several factors contributed to their good economic condition. The main one was the low opportunity costs of labor. In addition, Polish farms in the large class were characterized by the lowest total costs, particularly of intermediate consumption, which, despite the low production value, allowed them to cover the costs of unpaid labor. On the other hand, Italian farms were characterized by a high production value and low total costs. The inclusion of direct payments in the calculation of temporal viability index (STVI index) made it possible to qualify only Spanish and Irish farms to the life phase. In the remaining groups, the total output still did not cover the costs of the family labor.
Dairy farms with the largest production scale (very large class) were distinguished from all the analyzed groups. In this group, we dealt with farms in the development phase. This included Italian farms which were the most viable in the short term, with a PTVI index of between 1.25 and 1.45. It was mainly due to the relatively low opportunity labor costs and high total output with a moderate level of intermediate consumption and low costs of external factors. Spanish farms were also in the life phase. Dairy farms from other six countries were in the survival phase, occasionally reaching STVI values appropriate for the life phase.
The following analysis showed a relationship between the size of the economy class and an increase in the temporal economic viability indices (PTVI and STVI). This means that in 2009–2018, farms with a larger scale of production achieved, or were close to achieving short-term viability.

3.2. The Long-Term Economic Viability

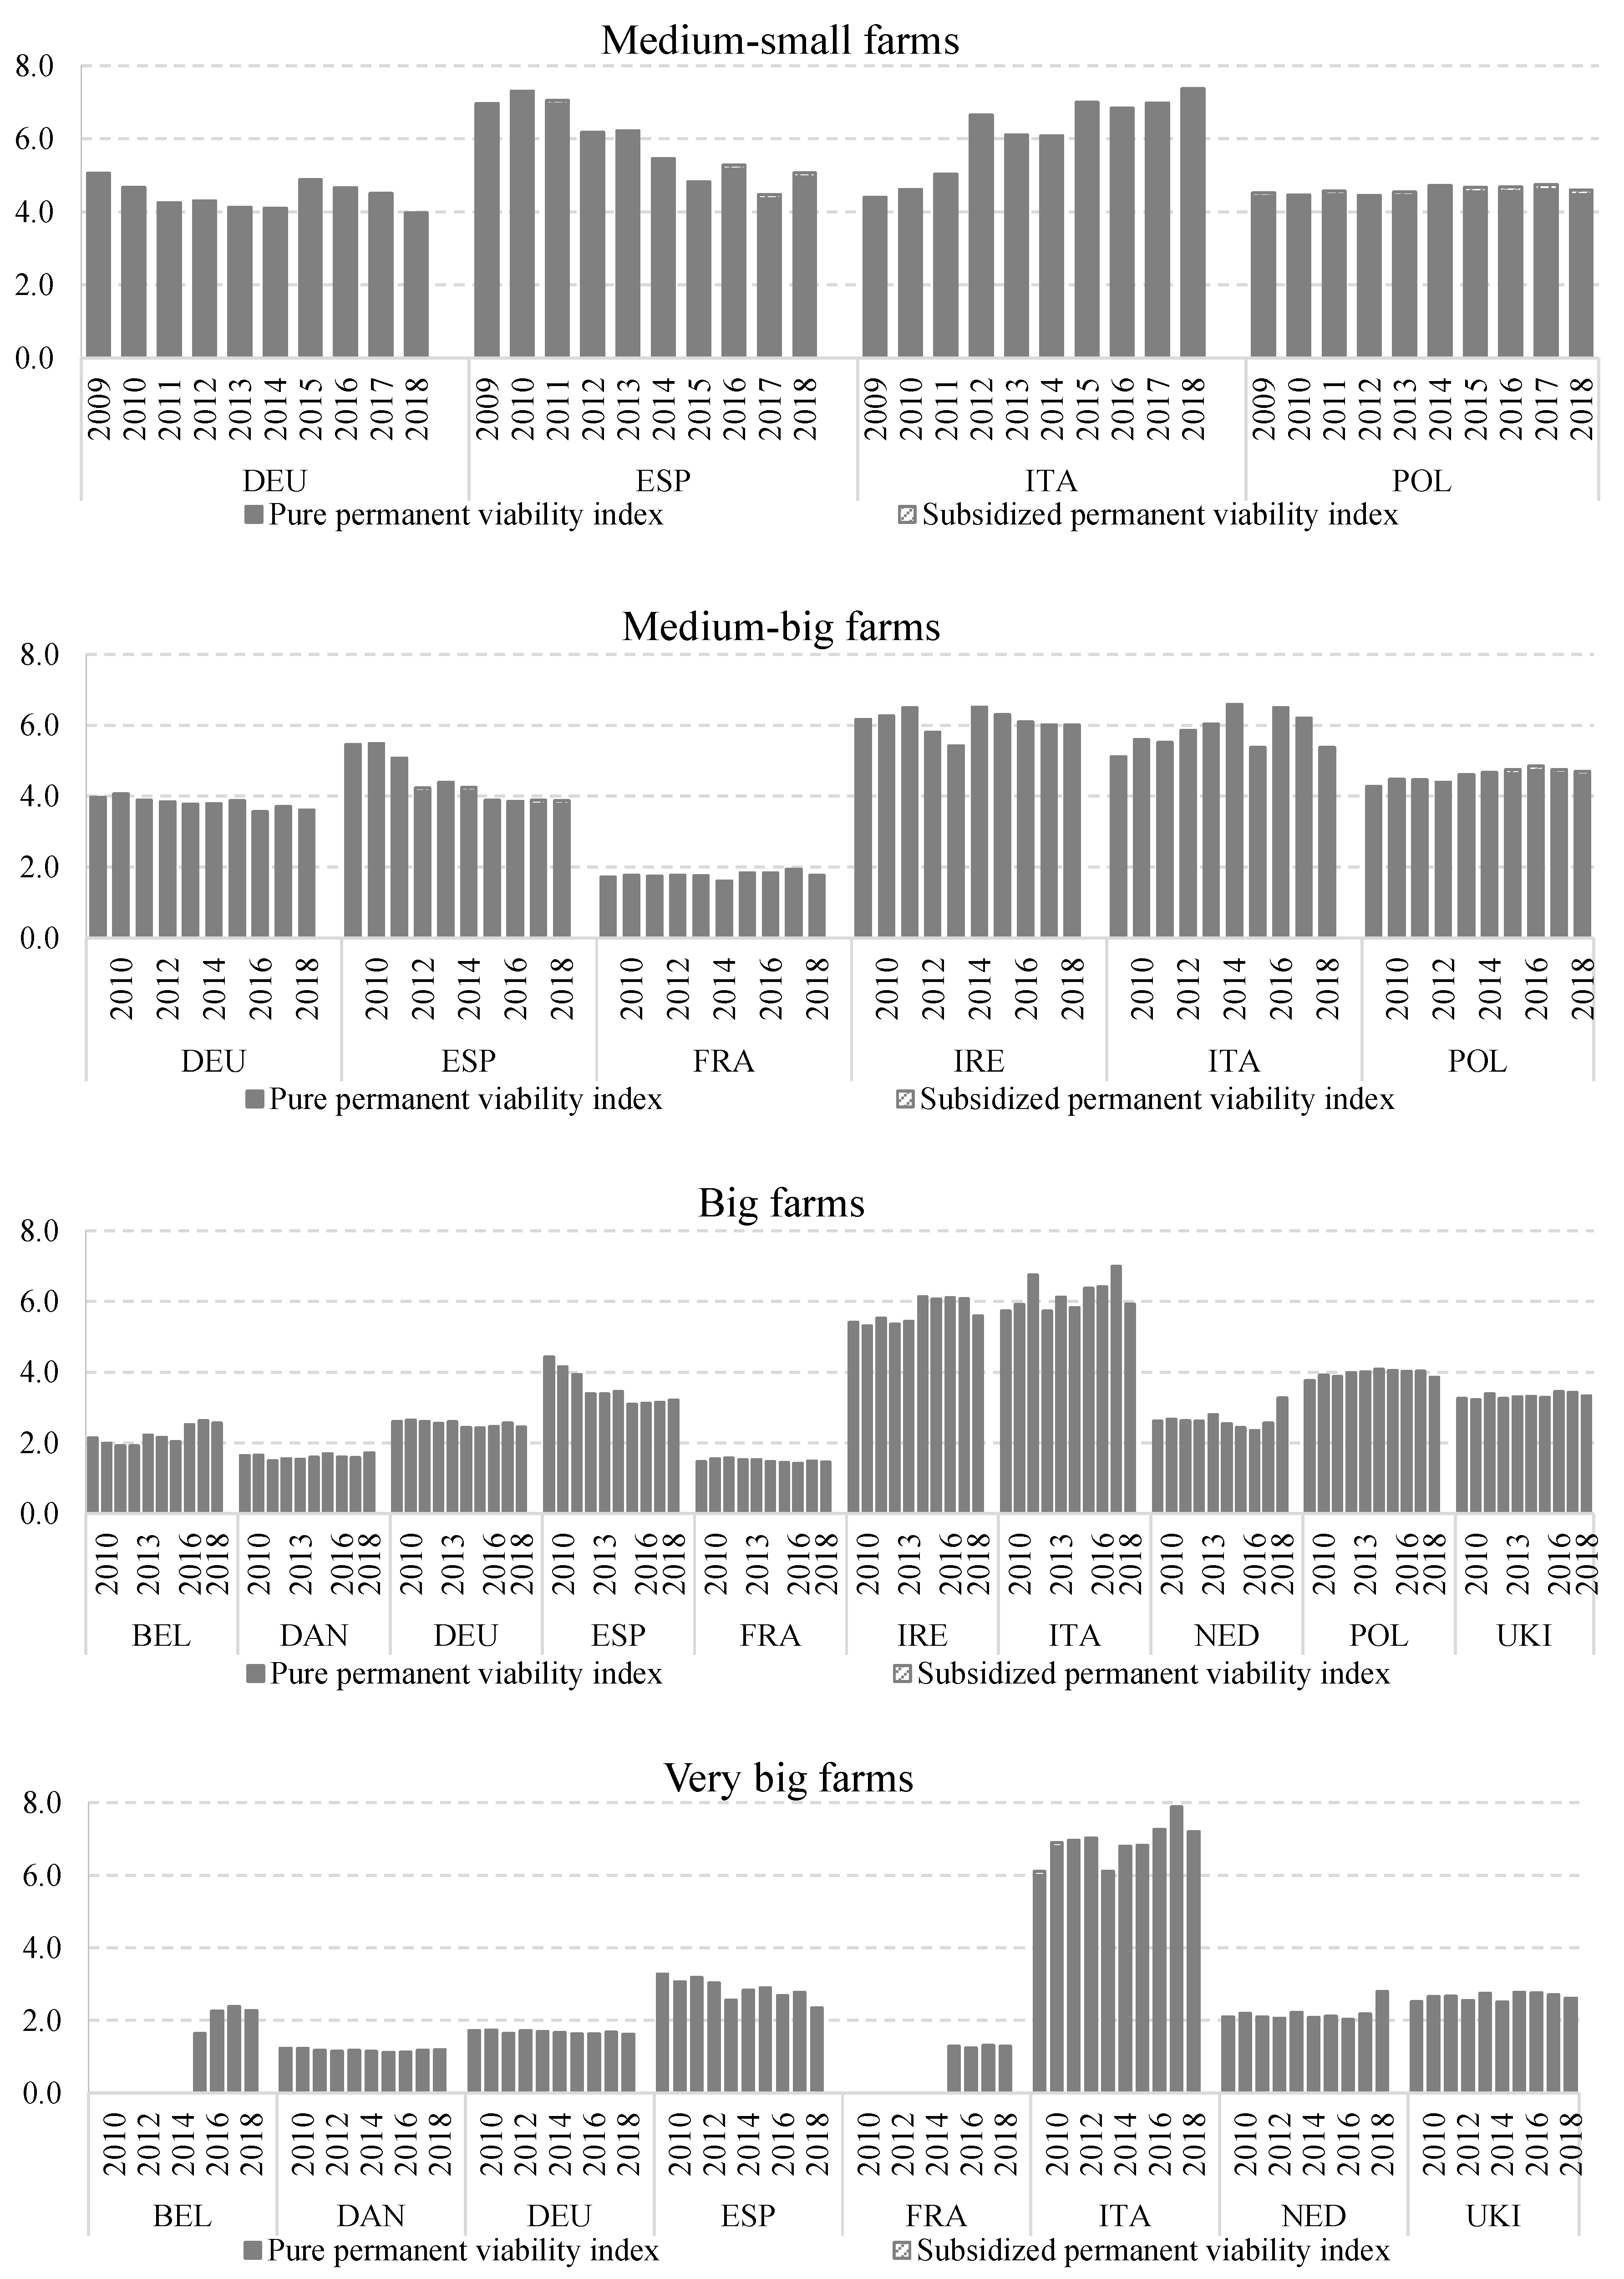
The results of the calculation of permanent economic viability showed the different relation between its indices (PPVI, SPVI) and the economic size class with comparison to the temporal viability. Excluding Italian and Polish farms from the analysis, a decrease in the value of permanent viability indices was observed along the following higher classes (Figure 3). The second important information obtained in the research was the qualification of all groups of farms into the permanently viable category. This proved that there was a development potential, which was diverse in terms of size and trends in 2009–2018.
The highest indices of permanent economic viability were observed in the medium-small farms, mainly in Spanish and Italian farms. However, despite reaching a PPVI value exceeding 7.0, in Spanish farms there was an observed decrease in viability, which meant that the development potential was not realized. This is confirmed by the value of fixed assets, which decreased by 25% and the lower value of current assets by approximately 70%. On German farms, the value of permanent economic viability indices also decreased, and these changes mainly resulted from an increase in the level of liabilities. Polish farms were characterized by a stable level of viability; however, similar to Spanish farms, their development potential was not fully used. The level of indebtedness of medium–small Polish farms declined at a faster pace than the value of assets, which partly explains the balanced value of the viability indices in the examined period. In the analyzed decade, there was a significant increase in PPVI and SPVI indices on Italian farms. This was due to the change in the value of total assets, which increased by 2/3 in 2009–2018.
In the medium–large class, Italian and Irish farms had the highest development potential. On Italian farms, it was resulted from an approx. 33% increase in the value of assets with an almost three-fold increase in debt belonging to one of the lowest in this economic size class. The observed amount of liabilities was only 1/3 of the debt of French and 56% of German dairy farms. Figure 3 shows the decline in the development potential of Irish farms. This situation was related to an approximately 25% decrease in the value of assets and debt. Medium–large German, Spanish and Polish farms were characterized by a lower, but more stable, level of economic viability in relation to Italian and Irish farms. The slight volatility was the result of a gradual decrease in debt, while maintaining the similar value of total assets. The exception was Spanish farms, where the decrease in the value of total assets (by more than 20%) was accompanied by a two-fold increase in debt, which contributed to a systematic decline in the indices of permanent viability. The lowest viability was characteristic for medium–large French dairy farms. They were distinguished by the highest value of liabilities and the lowest and stable value of total assets. Farms classified, by economic size class, as large have slightly lower economic viability indices than those of medium–large class. Italian and Irish farms were among the most viable. In both, the value of assets was stable with a decline in debt, which fell by 27% for Irish farms and 15% for Italian farms. Large dairy farms located in France and Denmark had the lowest development potential. This situation was mainly due to the high level of liabilities; Danish farms had an average liability-to-asset ratio of 53% and French farms, 47%. In other countries, the permanent economic viability was at a stable level and ranged from 2 to 4.
Very large farms were permanently viable. However, a special feature of this group was the significantly lower value of the permanent economic viability indices compared to bottom economic size classes. The exception was the very large Italian farms, where the level of viability was similar to farms with a lower production scale in that country. In addition, Italian farms achieved the highest values of economic viability indices. The analysis shows that they were about 2.5 times higher than the next ranked in the value of indices, occurring on Spanish farms. Likewise, as large farms, the lowest viability was achieved by Danish and French farms. They were the most indebted in this class, with liability-to-asset ratios as high as 81%.
The comparison of the pure and subsidized viability indices shows a much smaller impact of direct payments on the level of permanent viability than on the value of temporal viability. The significance of this type of subsidy in creating the economic viability index was low during the whole analysis period and at a similar level in each economic size class.
The abolition of the quota system in the EU has not significantly changed the permanent economic viability. In the first year of the cancellation of quotas (2015), increases in the viability index occurred far less frequently than decreases. The impact of changes in the milk market regulations was not important in farms with the largest milk production scale from Denmark, Germany, the Netherlands, the United Kingdom or Poland.

4. Discussion

The research focused on determining the temporal and permanent economic viability of dairy farms in EU countries, which are the main raw material base for European milk processors. A comparative analysis of economic viability was carried out in the ten-year period, both from the national perspective and for groups of farms with a similar production scale.
The results of the survey showed that farms with a large volume of milk production were in better condition and achieved short-term economic viability. This is a confirmation of the studies that proved that larger dairy farms are characterized by higher economic profitability [30,31]. They also show that farms with a small scale of milk production can continue business for a long time without covering full production costs. This situation may exist when their incomes cover cash expenses and ensure an acceptable return for the farmer’s family [32]. It also means continuing farming activity without a return on the invested capital and a satisfactory payment for the own work of the farmer and his family [33].
The levels of permanent viability indices that included the costs of unpaid labor costs and the solvency of farms proved that the analyzed groups of farms had development potential. The analysis also showed a relationship between the increase in the economic size of specialist dairy farms and the decrease in the level of permanent viability. The research has shown the development potential of farms that are not able to secure remuneration for the farmer and his family (e.g., Italian farms).Firstly, it may be related to adopting one of the strategies to keep the business. Glover and Reay [28] identified four directions used to maintain farms: diversifying the business, maximizing debt, sacrificing family needs, and compromising. Each of these allows farmers to continue their farming activity, at least in the short term. Secondly, it may prove that some farmers had non-farm income and financed farm development with them [18]. These incomes can be a source of economic sustainability of farms, and therefore can be an incentive to continue farming [10,11].
The results confirmed the strong influence on the temporal viability index of the adopted wage level used to estimate opportunity costs of labor. The impact of the wages on vitality is reported by O’Donoghue et al. [10]. The authors emphasize that farms from “poorer countries” have a high viability index, which is determined by low wages in these countries.
The unique value of the research provided the analysis period, which allowed for capturing the impact of key changes in the EU dairy sector on trends of viability. The milk quota abolition and the implementation of the milk package aimed at strengthening the position of producers in the supply chain and preparing the dairy sector for a stronger market orientation [34]. The analysis period included two price crises in the global dairy market in 2009 and in 2015–2016 [35,36,37]. They strongly influenced the organization of production and the economic condition of farms [38]. The abolition of production limits and price fluctuations had an ambiguous reflection in the research results. Their effects were different with both the studied countries and the groups of farms with a similar production scale.

5. Conclusions

The research objective was to study the changes in the short-term and long-term economic viability of dairy farms in the EU countries. A ten-year comparative analysis of economic viability indices allowed to observe the evolution both from the perspective of individual countries and groups of farms with a similar production scale.
The results of the research showed that medium–small and medium–large dairy farms have little potential to generate income at a level that guarantees an average national wage for a farmer and his family. In the short term, most of the analyzed groups of farms remained in the survival phase of the farm life cycle. The only group for which the level of the temporal viability index in 2009–2018 may conclude that it is under the development phase is a group of very large Italian farms.
The analysis of the indices of permanent economic viability showed that all researched groups of farms had development potential. A characteristic feature of the calculated indices was their heterogeneity and the decreasing value with the higher economic size class of farms. The Italian and Irish dairy farms were characterized by the highest long-term viability, while the farms from France and Denmark were the least viable. The Italian, Dutch, Belgian and British farms formed a group with a tendency to improve permanent viability and increase the value of total assets. The inclusion of direct payments in the calculation showed a high impact of this type of subsidy only on short-term economic viability. The direct payments were more important in smaller farms, but nevertheless did not guarantee covering the costs of unpaid labor. Furthermore, the analysis did not provide grounds for establishing a relationship between the abolition of the milk production quota system and the related decrease in farm-gate prices, and the level of permanent economic viability.
In conclusion, the results provided an opportunity to observe changes in one of the basic parameters of resistance of dairy farms, i.e., economic viability. The used method of combined viability index allowed for the assessment of farming activity in the short term (temporal viability) and long term (permanent viability). The analysis indicates a possible empowerment of the position of milk producers, using their development potential. The next research steps should focus on the analysis of strategies implemented by producers whose farms achieve permanent economic viability. Undoubtedly, the challenge is to identify indices that confirm the socio-economic justification for farming in the survival phase of the farm life cycle. In addition, there is a need to continue searching for a synthetic index of viability, covering many aspects of agricultural activity and eliminating the weakness of already-existing approaches.

Author Contributions

Conceptualization, A.W. and E.K.; methodology, A.W. and E.K.; formal analysis, A.W. and E.K.; investigation, A.W. and E.K.; data curation, A.W. and E.K.; writing—original draft preparation, A.W. and E.K.; writing—review and editing, A.W. and E.K.; visualization, A.W. and E.K.; supervision, A.W. and E.K. All authors have read and agreed to the published version of the manuscript.

Funding

This research received no external funding.

Institutional Review Board Statement

Not applicable.

Informed Consent Statement

Not applicable.

Data Availability Statement

The data are available from the corresponding author, at reasonable request.

Conflicts of Interest

The authors declare no conflict of interest.

References

  1. Clay, N.; Garnett, T.; Lorimer, J. Dairy Intensification: Drivers, Impacts and Alternatives. Ambio 2020, 49, 35–48. [Google Scholar] [CrossRef] [PubMed] [Green Version]
  2. Davidson, A. Globalisation, Uneven Development and Marginalisation: Dairy Restructuring in New South Wales. Aust. J. Soc. Issues 2002, 37, 85–102. [Google Scholar] [CrossRef]
  3. Barnes, A.P.; Hansson, H.; Manevska-Tasevska, G.; Shrestha, S.S.; Thomson, S.G. The influence of diversification on long-term viability of the agricultural sector. Land Use Policy 2015, 49, 404–412. [Google Scholar] [CrossRef]
  4. Hennessy, T. CAP 2014–2020 Tools to Enhance Family Farming: Opportunities and Limits in-Depth Analysis. (IP/B/AGRI/CEI/2011-097/E026/SC1); Policy Department B: Structural and Cohesion Policies European Parliament. 2014. Available online: https://www.europarl.europa.eu/RegData/etudes/note/join/2014/529051/IPOL-AGRI_NT(2014)529051_EN.pdf (accessed on 16 February 2021).
  5. Loughrey, J.; Hennessy, T. Farm Income Variability and Off-Farm Employment in Ireland. AFR 2016, 76, 378–401. [Google Scholar] [CrossRef]
  6. Nurmet, M.; Omel, R. ECONOMIC VIABILITY BY FARM SIZE OF ESTONIAN FAMILY FARMS. Zagadnienia Ekon. Rolnej/Probl. Agric. Econ. 2020, 362, 14–28. [Google Scholar] [CrossRef]
  7. Barnes, A.P.; Thomson, S.G.; Ferreira, J. Disadvantage and Economic Viability: Characterising Vulnerabilities and Resilience in Upland Farming Systems. Land Use Policy 2020, 96, 104698. [Google Scholar] [CrossRef]
  8. Christensen, L.; Limbach, L. Finding Common Ground: Defining Agricultural Viability and Streamlining Multi-Organization Data Collection. J. Agric. Food Syst. Community Dev. 2019, 8, 137–152. [Google Scholar] [CrossRef]
  9. O’Donoghue, C.; Hennessy, T. Policy and Economic Change in the Agri-Food Sector in Ireland. Econ. Soc. Rev. 2015, 46, 315–337. Available online: https://www.esr.ie/article/view/344/112 (accessed on 16 February 2021).
  10. O’Donoghue, C.; Devisme, S.; Ryan, M.; Conneely, R.; Gillespie, P.; Vrolijk, H. Farm Economic Sustainability in the European Union: A Pilot Study. Stud. Agric. Econ. 2016, 118, 163–171. [Google Scholar] [CrossRef] [Green Version]
  11. Spicka, J.; Hlavsa, T.; Soukupova, K.; Stolbova, M. Approaches to Estimation the Farm-Level Economic Viability and Sustainability in Agriculture: A Literature Review. Agric. Econ. 2019, 65, 289–297. [Google Scholar] [CrossRef] [Green Version]
  12. Latruffe, L.; Diazabakana, A.; Bockstaller, C.; Desjeux, Y.; Finn, J.; Kelly, E.; Ryan, M.; Uthes, S. Measurement of Sustainability in Agriculture: A Review of Indicators. Stud. Agr. Econ. 2016, 118, 123–130. [Google Scholar] [CrossRef]
  13. Savickiene, J.; Miceikiene, A.; Jurgelaitiene, L. Assessment of economic viability in agriculture. In Strategic Approaches in Economy, Governance and Business, 2nd ed.; Zbuchea, A., Pînzaru, F., Eds.; Tritonic: Bucharest, Romania, 2016; pp. 101–118. [Google Scholar]
  14. Zorn, A.; Esteves, M.; Baur, I.; Lips, M. Financial Ratios as Indicators of Economic Sustainability: A Quantitative Analysis for Swiss Dairy Farms. Sustainability 2018, 10, 2942. [Google Scholar] [CrossRef] [Green Version]
  15. Ryan, M.; Hennessy, T.; Buckley, C.; Dillon, E.J.; Donnellan, T.; Hanrahan, K.; Moran, B. Developing Farm-Level Sustainability Indicators for Ireland Using the Teagasc National Farm Survey. Ir. J. Agric. Food Res. 2016, 55, 112–125. [Google Scholar] [CrossRef] [Green Version]
  16. Hooks, T.; Macken-Walsh, Á.; McCarthy, O.; Power, C. Farm-Level Viability, Sustainability and Resilience: A Focus on Cooperative Action and Values-Based Supply Chains. Stud. Agric. Econ. 2017, 119, 123–129. [Google Scholar] [CrossRef] [Green Version]
  17. Miceikiene, A.; Girdžiute, L. Farmers’ Economic Viability Assessment in the Context of Taxation and Support. In International Scientific Days 2016: The Agri-Food Value Chain: Challenges for Natural Resources Management and Society: Proceedings; Slovak University of Agriculture in Nitra: Nitra, Slovakia, 2016; pp. 350–360. [Google Scholar] [CrossRef]
  18. Coppola, A.; Scardera, A.; Amato, M.; Verneau, F. Income Levels and Farm Economic Viability in Italian Farms: An Analysis of FADN Data. Sustainability 2020, 12, 4898. [Google Scholar] [CrossRef]
  19. Esteves, M.; Zorn, A.; Baur, I.; Lips, M. Financial ratios as indicators of economic sustainability: Synergies and trade-offs for Swiss dairy farms. In Proceedings of the 21st International Farm Management Congress, John McIntyre Conference Centre, Edinburgh, Scotland, UK, 2–7 July 2017; pp. 1–15. Available online: https://ifmaonline.org/contents/financial-ratios-as-indicators-of-economic-sustainability-synergies-and-trade-offs-for-swiss-dairy-farms/ (accessed on 16 February 2021).
  20. Benidir, M.; Ghozlane, F.; Bousbia, A.; Belkheir, B. The Use of a Critical Analysis of a Multicriterion Method (IDEA) for Assessing the Sustainability of Sedentary Sheep Rearing Systems in the Algerian Steppe Areas. AJAR 2013, 8, 804–811. [Google Scholar] [CrossRef]
  21. Vrolijk, H.C.; De Bont, C.J.; Blokland, P.W.; Soboh, R.A. Farm Viability in the European Union: Assessment of the Impact of Changes in Farm Paymen; LEI Wageningen UR: The Hague, The Netherlands, 2010. [Google Scholar]
  22. Barnes, A.P.; Rutherford, K.M.D.; Langford, F.M.; Haskell, M.J. The Effect of Lameness Prevalence on Technical Efficiency at the Dairy Farm Level: An Adjusted Data Envelopment Analysis Approach. J. Dairy Sci. 2011, 94, 5449–5457. [Google Scholar] [CrossRef]
  23. Savickienė, J.; Miceikienė, A. Sustainable Economic Development Assessment Model for Family Farms. Agric. Econ. 2018, 64, 527–535. [Google Scholar] [CrossRef] [Green Version]
  24. European Commission. Farm Accounting Data—An A to Z of Methodology. Version 02/07/2018. Available online: http://ec.europa.eu/agriculture/rica//pdf/site_en.pdf (accessed on 18 February 2021).
  25. Scotti, E.; Bergmann, H.; Henke, R.; Hovorka, G. Evaluation of Income Effects of Direct Support: Final Report. EEIG AGROSYNERGIE, 261. 2011, p. 184. Available online: https://op.europa.eu/en/publication-detail/-/publication/1ab836ce-38f1-4bed-873e-fe2a3477b0d2 (accessed on 18 February 2021).
  26. Bossel, H. Assessing Viability and Sustainability: A Systems-Based Approach for Deriving Comprehensive Indicator Sets. Conserv. Ecol. 2001, 5. [Google Scholar] [CrossRef]
  27. Scott, J. Farm and Community Viability. Report on Interview Results. GPI Atlantic. 2003, pp. 26–37. Available online: http://www.gpiatlantic.org/pdf/agriculture/farmviab.pdf (accessed on 20 April 2021).
  28. Glover, J.L.; Reay, T. Sustaining the Family Business with Minimal Financial Rewards: How Do Family Farms Continue? Fam. Bus. Rev. 2015, 28, 163–177. [Google Scholar] [CrossRef]
  29. OECD.Stat. Available online: https://www.oecd-ilibrary.org/economics/data/oecd-stat/data-warehouse_data-00900-en (accessed on 15 December 2020).
  30. Krpalkova, L.; Cabrera, V.E.; Kvapilik, J.; Burdych, J. Dairy Farm Profit According to the Herd Size, Milk Yield, and Number of Cows per Worker. Agric. Econ. Czech 2016, 62, 225–234. [Google Scholar] [CrossRef] [Green Version]
  31. Wilson, P. Decomposing Variation in Dairy Profitability: The Impact of Output, Inputs, Prices, Labour and Management. J. Agric. Sci. 2011, 149, 507–517. [Google Scholar] [CrossRef] [Green Version]
  32. MacDonald, J.; Newton, D.; MacDonald, J.; Newton, D. Milk Production Continues Shifting to Large-Scale Farms. 2014. Available online: https://ageconsearch.umn.edu/record/210017 (accessed on 20 April 2021). [CrossRef]
  33. Coppola, A.; Scalera, D.; Tosco, D. Economic Profitability and Long-Term Viability in Italian Agriculture. Politica Agric. Internazionale Int. Agric. Policy 2013. [Google Scholar] [CrossRef]
  34. Augère-Granier, M.-L. The EU Dairy Sector. Main Features, Challenges and Prospects. Briefing European Parliament; European Parliament: Brussels, Belgium, 2018; Available online: https://www.europarl.europa.eu/thinktank/en/document.html?reference=EPRS_BRI(2018)630345 (accessed on 20 April 2021).
  35. Bergmann, D.; O’Connor, D.; Thümmel, A. An Evaluation of Point and Density Forecasts for Selected eu Farm Gate Milk Prices. Int. J. Food Agric. Econ. (IJFAEC) 2019, 6, 23–53. [Google Scholar] [CrossRef]
  36. Klopčič, M.; Kuipers, A.; Malak-Rawlikowska, A.; Stalgiene, A.; Ule, A.; Erjavec, K. Dairy Farmers’ Strategies in Four European Countries before and after Abolition of the Milk Quota. Land Use Policy 2019, 88, 104169. [Google Scholar] [CrossRef]
  37. Popescu, A.; Stoian, E.; Șerban, V. The EU-28 milk sector trends in the period 2009–2018. Sci. Pap. Manag. Econ. Eng. Agric. Rural Dev. 2019, 19, 249–263. [Google Scholar]
  38. Koloszycz, E. The Economic Impact of Crisis on Milk Market in Selected Dairy Farms in Europe. In Proceedings of the 2018 International Conference “Economic Science for Rural Development”, Jelgava, Latvia, 9–11 May 2018; pp. 460–467. [Google Scholar] [CrossRef]
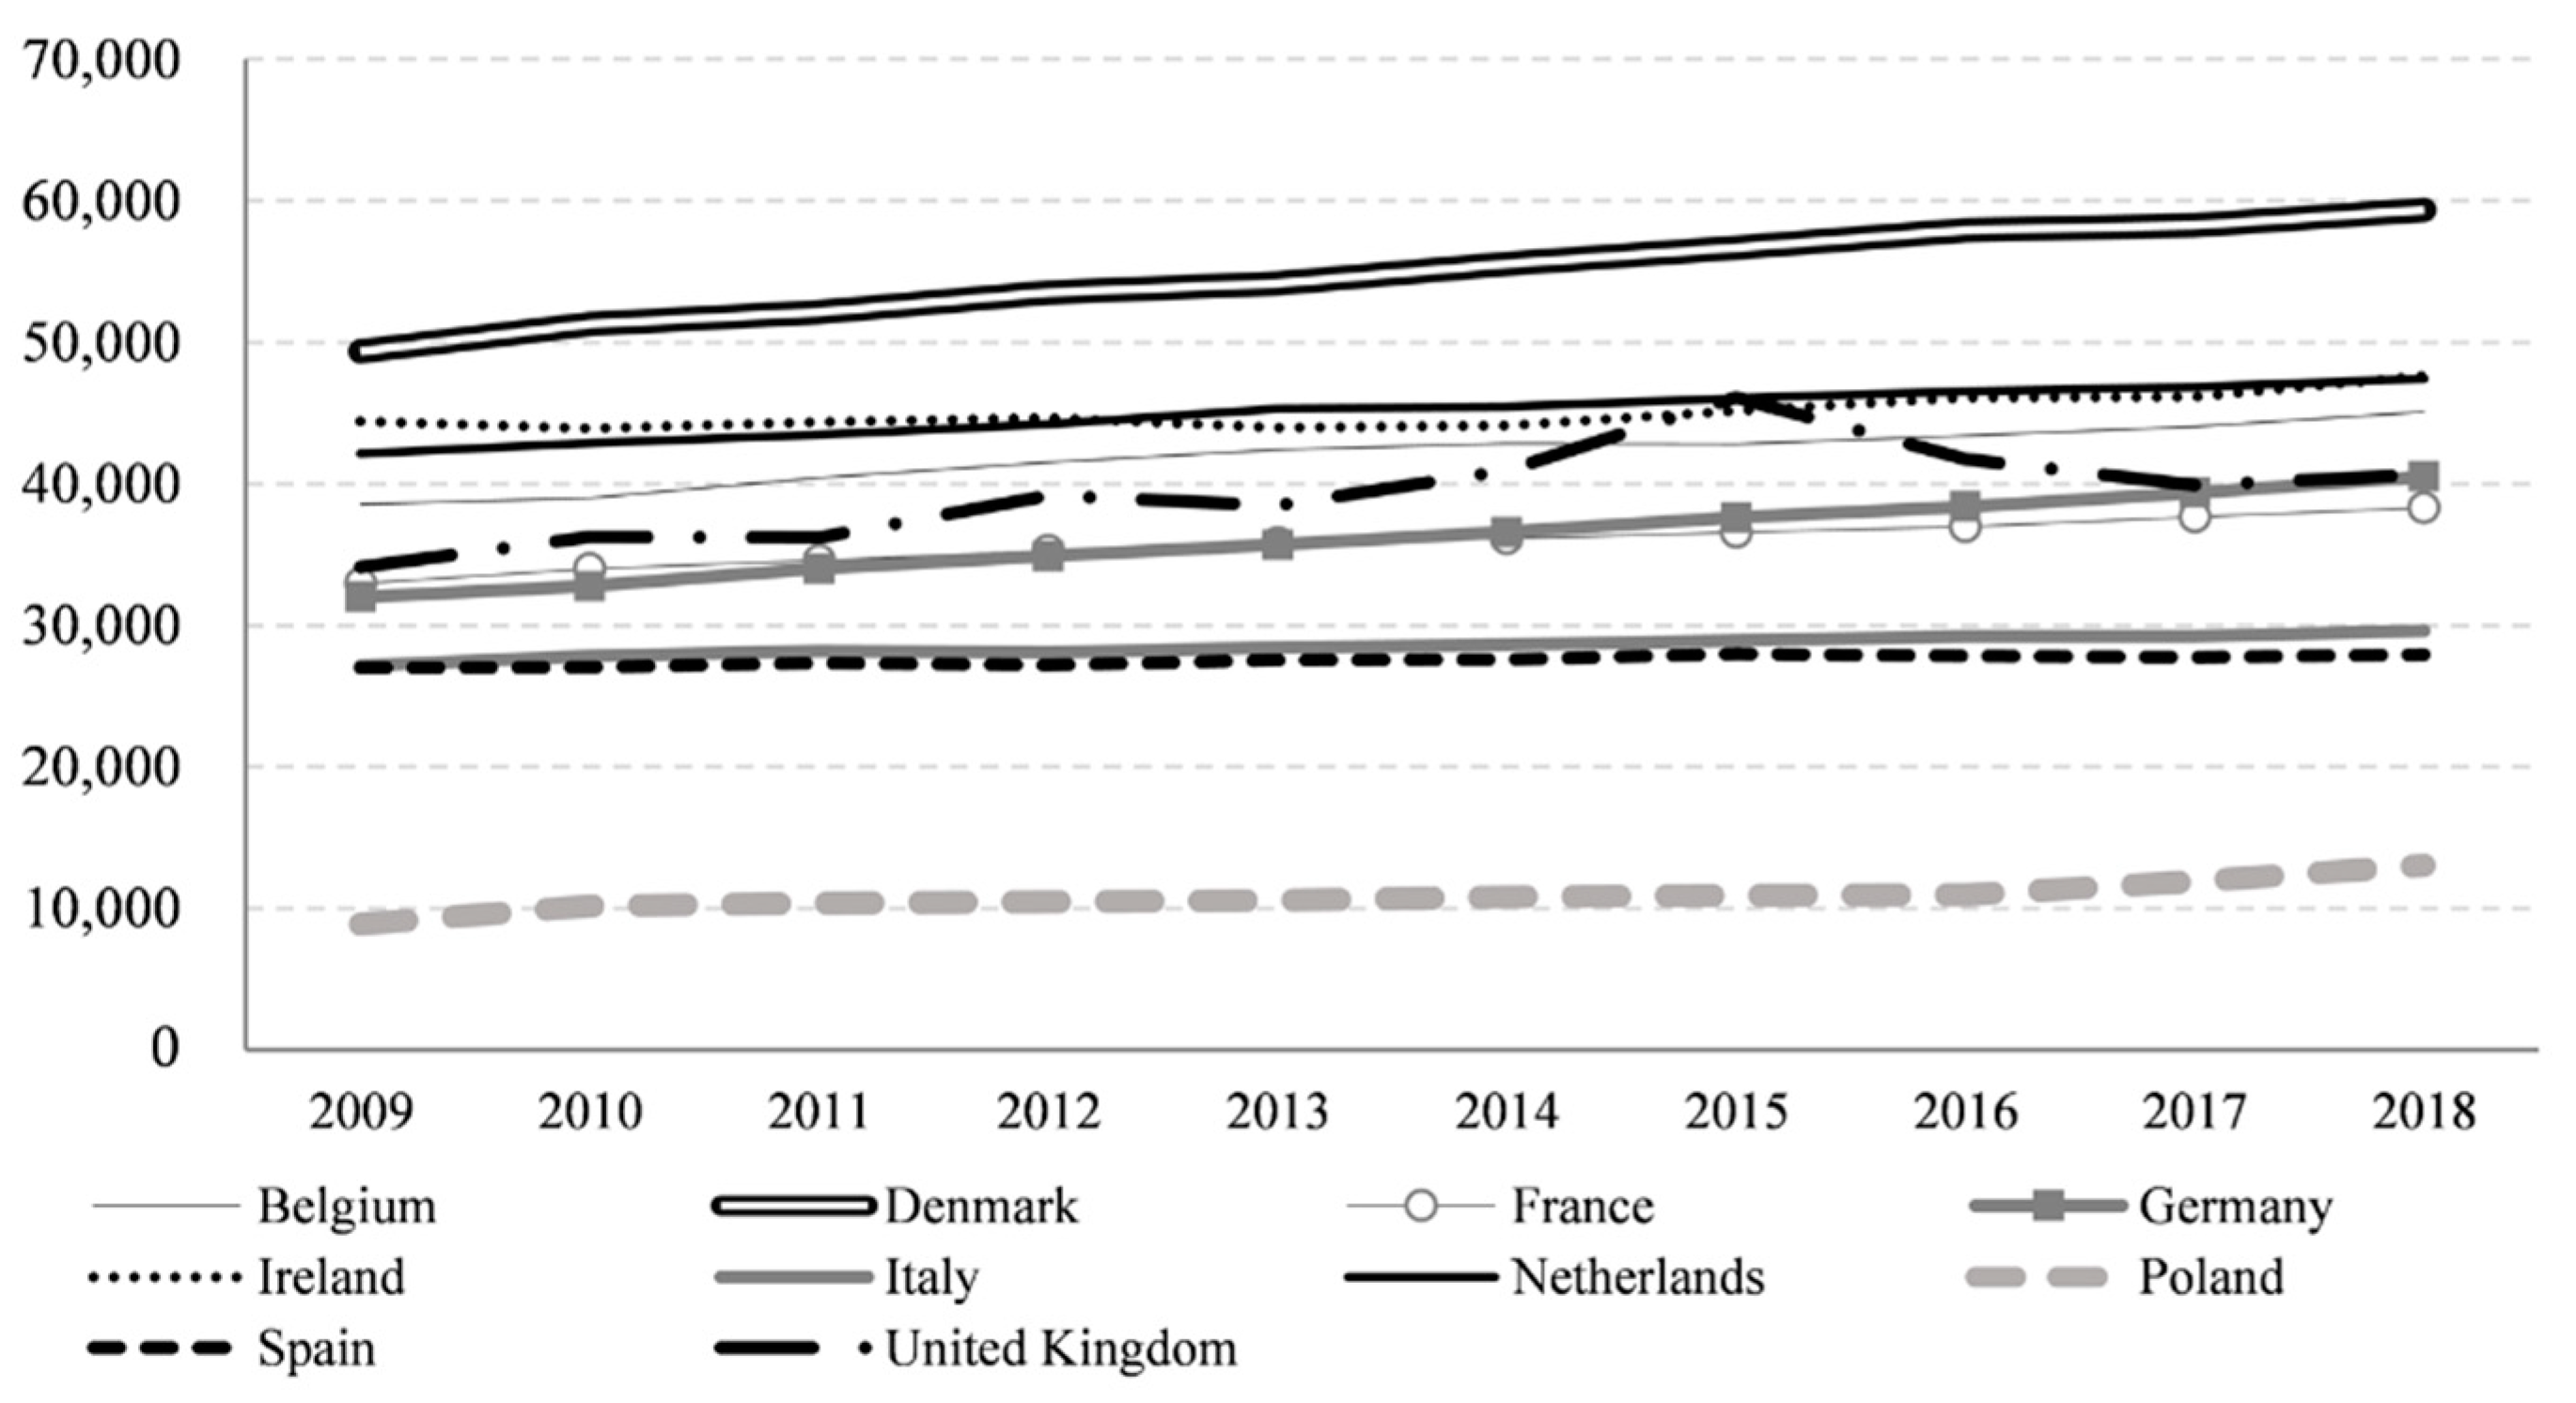
Figure 1. National average wages per employee (EUR).
Agriculture 11 00510 g001
Figure 2. Temporal economic viability in groups of dairy farms.
Agriculture 11 00510 g002
Figure 3. Permanent economic viability in groups of dairy farms.
Agriculture 11 00510 g003
Table 1. The way of comparing results.
Medium-Small Farms)
25,000 EUR ≤ SO < 50,000 EUR
Medium-Large Farms
50,000 EUR ≤ SO < 100,000 EUR
Large Farms
100,000 EUR ≤ SO < 500,000 EUR
Very Large Farms
SO ≥ 500,000 EUR
Germany, Poland, Italy, SpainGermany, France, Poland, Italy, Ireland, SpainGermany, France, United Kingdom, Netherlands, Poland, Italy, Ireland, Spain, Denmark, BelgiumGermany, France, United Kingdom, Netherlands, Italy, Spain, Denmark, Belgium
Table 2. General characteristics of the group farms (mean 2009–2018).
Economic Size Classes (ES6)CountryDairy Cows (Heads)Milk Yield (tons)Total Utilised Agricultural Area (ha)Total Output per AWU (1000 EUR/AWU)Share of Unpaid Labor Input in Total Labor Input (%)Stocking Density (LU/ha Forage Area)Output/input Ratio (%)
Medium-small farms DEU13.05.319.238.198.91.2107.9
ESP15.26.713.733.599.81.6127.3
ITA13.84.813.739.396.81.7134.9
POL16.44.822.016.898.71.8128.9
Medium-large farms (4)DEU23.95.530.131.298.01.6115.1
ESP27.56.820.350.696.32.0126.3
FRA31.65.853.464.996.51.196.2
IRE38.55.139.664.096.81.7123.8
ITA28.15.024.158.888.52.0143.9
POL30.35.937.733.395.61.9136.5
Large farms BEL67.37.253.5114.198.12.3121.6
DEN76.58.383.8206.274.52.1100.0
DEU66.07.573.4128.885.52.0109.8
ESP70.77.241.393.083.62.9121.9
FRA65.97.0104.0106.788.11.5102.1
IRE91.25.674.4126.980.92.1128.4
ITA78.65.844.,1120.978.93.2157.3
NED77.28.046.3167.089.12.4111.1
POL63.57.077.862.179.61.9137.8
UKI97.77.088.1133.771.61.9108.4
Very large farms BEL154.88.2101.8184.092.52.8116.2
DEN231.09.2215.1299.633.32.294.4
DEU298.38.6422.5135.917.31.994.7
ESP298.38.497.1153.240.95.6117.5
FRA175.17.9237.4154.174.92.099.5
ITA260.47.2110.8221.947.05.1150.9
NED201.08.3107.0275.675.22.8112.6
UKI255.87.6201.4188.541.02.3109.4
BEL—Belgium, DEU—Germany, DEN—Denmark, ESP—Spain, FRA—France, IRE—Ireland, ITA—Italy, NED—the Netherlands, POL—Poland, UKI—the United Kingdom.
Table 3. Average values of the components of economic viability in 2009-2018 (in EUR 1000 per farm).
Economic Size Classes (ES6)CountryTotal OutputTotal Direct PaymentsTotal Intermediate ConsumptionDepreciationTaxesTotal External FactorsTotal Unpaid Labor WagesTotal AssetsTotal Liabilities
Medium-small farms DEU41.86.629.27.60.61.941.1380.215.4
ESP39.05.627.62.80.20.228.7309.71.4
ITA49.44.327.07.81.41.636.3428.35.3
POL31.35.718.15.50.30.821.1211.27.9
Medium-large farms DEU79.010.351.313.00.74.849.2510.938.4
ESP70.58.850.73.60.21.633.3332.33.9
FRA83.513.661.118.81.16.933.1247.973.8
IRE86.910.959.37.20.23.862.2837.820.0
ITA98.07.052.310.62.25.044.4634.411.4
POL69.49.638.110.50.42.223.0390.127.2
Large farms BEL201.719.9117.629.62.018.688.3765.9193.8
DEN361.837.3270.633.54.066.461.22100.91128.7
DEU237.024.7155.535.81.724.759.4922.4190.3
ESP197.519.3142.810.30.39.145.4601.225.7
FRA238.227.1164.542.32.124.563.6510.2251.2
IRE228.723.9139.818.90.319.872.11776.7104.6
ITA294.818.0152.816.13.718.058.71362.820.5
NED280.821.0171.937.44.243.473.32536.4745.0
POL172.018.194.422.10.88.625.8797.197.3
UKI299.723.1218.031.30.527.477.41450.9179.3
Very large farms BEL519.631.1324.474.43.849.8140.32002.6607.3
DEN1127.691.5784.4113.410.7298.768.85516.14465.9
DEU1272.6133.2879.9146.410.9320.158.23025.61222.9
ESP957.367.8676.644.51.892.263.61966.3168.4
FRA644.670.8435.8126.15.186.881.81450.2945.3
ITA1148.474.4616.841.818.6102.172.14833.117.2
NED764.555.8444.4104.59.4128.5106.36215.32428.7
UKI856.049.8594.671.00.7117.189.92998.8599.9
BEL—Belgium, DEU—Germany, DEN—Denmark, ESP—Spain, FRA—France, IRE—Ireland, ITA—Italy, NED—the Netherlands, POL—Poland, UKI—the United Kingdom.
Publisher’s Note: MDPI stays neutral with regard to jurisdictional claims in published maps and institutional affiliations.