Article

Socioeconomic Determinants of Crop Diversity and Its Effect on Farmer Income in Guangxi, Southern China

1
Key Laboratory of Forest Ecology and Conservation, College of Forestry, Guangxi University, 100 Daxue Rd., Nanning 530004, China
2
School of Business, Guangxi University, 100 Daxue Rd., Nanning 530004, China
3
Guangdong Key Laboratory of Animal Conservation and Resource Utilization, Guangdong Public Laboratory of Wild Animal Conservation and Utilization, Institute of Zoology, Guangdong Academy of Science, Guangzhou 510260, China
*
Authors to whom correspondence should be addressed.
Agriculture 2021, 11(4), 336; https://doi.org/10.3390/agriculture11040336
Submission received: 26 March 2021 / Revised: 4 April 2021 / Accepted: 5 April 2021 / Published: 8 April 2021
(This article belongs to the Section Agricultural Economics, Policies and Rural Management)

Abstract

:
Encouraging crop diversity could be a “win–win” for farmers and biodiversity conservation, if having a variety of crops produces the heterogeneity that supports biodiversity, and if multiple crops decrease the risk of farmers to losses due to pests, climatic events or market fluctuations, without strongly reducing their incomes. However, data on the factors that influence the decision to plant multiple crops, and how that affects profit, are needed, especially for East Asia, where these questions have been little studied. We distributed a questionnaire on these issues to 301 farmers in 35 villages in an agricultural area close to the city of Nanning in Guangxi, south China. Crop diversity increased with land size and closeness to the city. We detected no relationship between profit variability and crop diversity, but farmers with greater crop diversity and more land were more profitable, a result driven by several rarely planted but lucrative types of crops. Crop diversity can be a focus for policy to improve farmers’ livelihoods; these policies need to encourage farmers with little land to form cooperatives. Further research is needed to understand the effect of crop diversity on profit variability, and in areas closer to protected areas where biodiversity is higher.

1. Introduction

As the world population increases towards 9 billion people, there is an urgent need to expand agricultural production [1]. In the past 50 years, agricultural intensification has greatly increased yields; however, it has also exasperated habitat loss and produced pollution from fertilizers and pesticides, threatening natural biodiversity [2,3,4]. Yet such biodiversity is useful for farmers, particularly because of the ecological services they provide such as pollination and pest control [5,6,7]. One way of increasing biodiversity is keeping natural or semi-natural vegetation in agricultural landscapes [8,9,10]. However, this comes at opportunity cost for the farmer who cannot plant in those areas. Instead, if spatial and temporal heterogeneity itself underlies biodiversity [11], crop diversification might be a way to improve biodiversity [10,12]. This crop diversity could come through crop heterogeneity (adjacent crop fields of different types), polyculture, intercropping, or having multiple crops over time through crop rotation [13,14,15]. This has led to calls for diversified, small-scale agriculture to be a part of a “land-sharing” paradigm, in which biodiversity is retained in agricultural landscapes [16,17].
However, like other biodiversity conservation strategies, crop diversity can only be widely adopted by farmers if it also helps to improve their livelihoods. Fortunately, there are a variety of reasons why crop diversity increases farmer profit and decreases income variability. Some benefits may come from the ecosystem services provided by biodiversity as mentioned before: crop yield is improved when there are more wild pollinators and pest predators (e.g., [5,18,19]), which are in turn supported by more diversified fields [20,21,22]. Additionally, crop diversity can reduce pest and weed outbreaks because smaller patches of different crops diminish the ability for a pest/weed to build-up its numbers as high as it can in a monoculture [23,24]. Another type of benefit of crop diversity comes from the different characteristics of the crops: a diverse group of crops might have a longer growing season, for example [25]. Additionally, each crop type has a particular set of responses to adverse climatic conditions, so having multiple crops can help farmers avoid different kinds of climatically driven disasters (flood, drought, hurricane, etc.; [26]). Indeed, farmers in different areas have already started using crop diversification to deal with climate change and random agricultural shocks [27,28,29,30]. A final class of benefits of crop diversity that lowers farmer risk is economic and related to market forces. Farmers who sell only one or a few types of crops are vulnerable to market fluctuations in the income they can obtain from the crops [31].
Due to these many benefits, crop diversity is seen as a major strategy to decrease farmer risk [26]. Additionally, in some conditions it has been shown that farmers who plant more crops, particularly those that are high-value commodities, such as fruits and vegetables, can accrue higher incomes [13,32]. In a review of 66 studies on crop interspecific, varietal or genetic diversity, we found 12 papers that reported an increase in profit related to crop diversity, and only two a decrease in profit (Table S1). Lower profit associated with crop diversity may be because each crop is planted at a smaller scale, thereby losing scale-dependent efficiencies [33]. In addition to income, crop diversity may also affect other aspects of poverty such as food security [13,34]. Hence, the relationship between crop diversity, farmer livelihood and risk needs to be studied in a variety of ecological and societal conditions, and particularly in biodiverse areas in which crop diversity may also play a role in natural biodiversity conservation.
In order to encourage crop diversity, it is also necessary to understand what socioeconomic and demographic variables affect farmers’ decisions to plant multiple crops (see review by [13]). The size of the farmers’ land has been seen to positively influence crop heterogeneity throughout the world, as a larger planted area gives a greater opportunity to plant more crops [13]. In our literature review, this factor was the one found to be significant most often (found in 37 studies, 29 times as a completely positive factor). Other factors that were common significant and positive influences on crop diversity were education (25 studies significant, 19 positive; the mechanism may be that education increases awareness of risk and risk-mitigation strategies), and income (15 studies significant, 13 positive; this may be a bi-directional relationship, see above). Other factors may be context-specific. For example, distance to the market can increase crop diversity if households need to rely on their own crops to meet their needs [35,36]; alternatively, access to a market such as in a city might provide an impetus to diversify [37,38]. Findings for this factor in our literature were mixed (18 studies significant, seven positive).
Crop diversity has been an important subject of Chinese agricultural studies in terms of how it affects crop yield and disease/pest abundance [18,39,40,41]. However, fewer studies have looked at how the decision of individual farmers to plant multiple crops is influenced by socioeconomic factors (but see [42]) or affects their profit. Indeed, of the 66 reviewed papers on crop diversity, only two were from East Asia (the sample is particularly rich for Africa [34 studies] and South Asia [25 studies]). To address this gap in knowledge, here we present a study on the crop diversity of small-holder farmers near the city of Nanning, the capital of Guangxi Zhuang Autonomous Region, one of the most important agricultural regions in China [43]. Guangxi is also part of the Indo-Burma biodiversity hotspot, and so conservation is also a priority [44]. Our earlier work in this region has shown that increased crop heterogeneity leads to greater species diversity of birds (in one of two seasons studied, Lee and Goodale [45]), higher richness of native and animal-dispersed plants [46] and higher diversity of beneficial insects, including predators and pollinators (Tharaka S. Priyadarshana et al., unpublished manuscript). Yet we need to also know more about the human side of the equation: what affects farmers’ decision to plant multiple crops and how it affects them.
This study aimed to answer three basic questions. First, what demographic and socioeconomic factors affect the adoption of crop diversity by farmers? Second, how does crop diversity or risk aversion influence their profit? Third, how does crop diversity or risk aversion affect their variability in profit, as a measure of farmer risk? As for the first question, we hypothesized that farmers with more land, who were better educated and had higher incomes would have higher levels of crop diversity, consistent with the literature. Due to our proximity to the large city of Nanning, we were particularly interested in distance to the city and hypothesized that farmers who were closer to Nanning would grow more crops for the city fruit and vegetable markets [37,38,47,48]. We also wanted to investigate risk aversion as a possible factor influencing crop diversity, as more risk-averse farmers were shown to plant more diverse crops in another recent study [49]. For the question of profit, we expected that crop diversity, and associated risk aversion, might result in less profit, as advantages of large-scale agriculture were lost. However, we expected people with higher crop diversity and risk aversion to have less variable results [50].

2. Materials and Methods
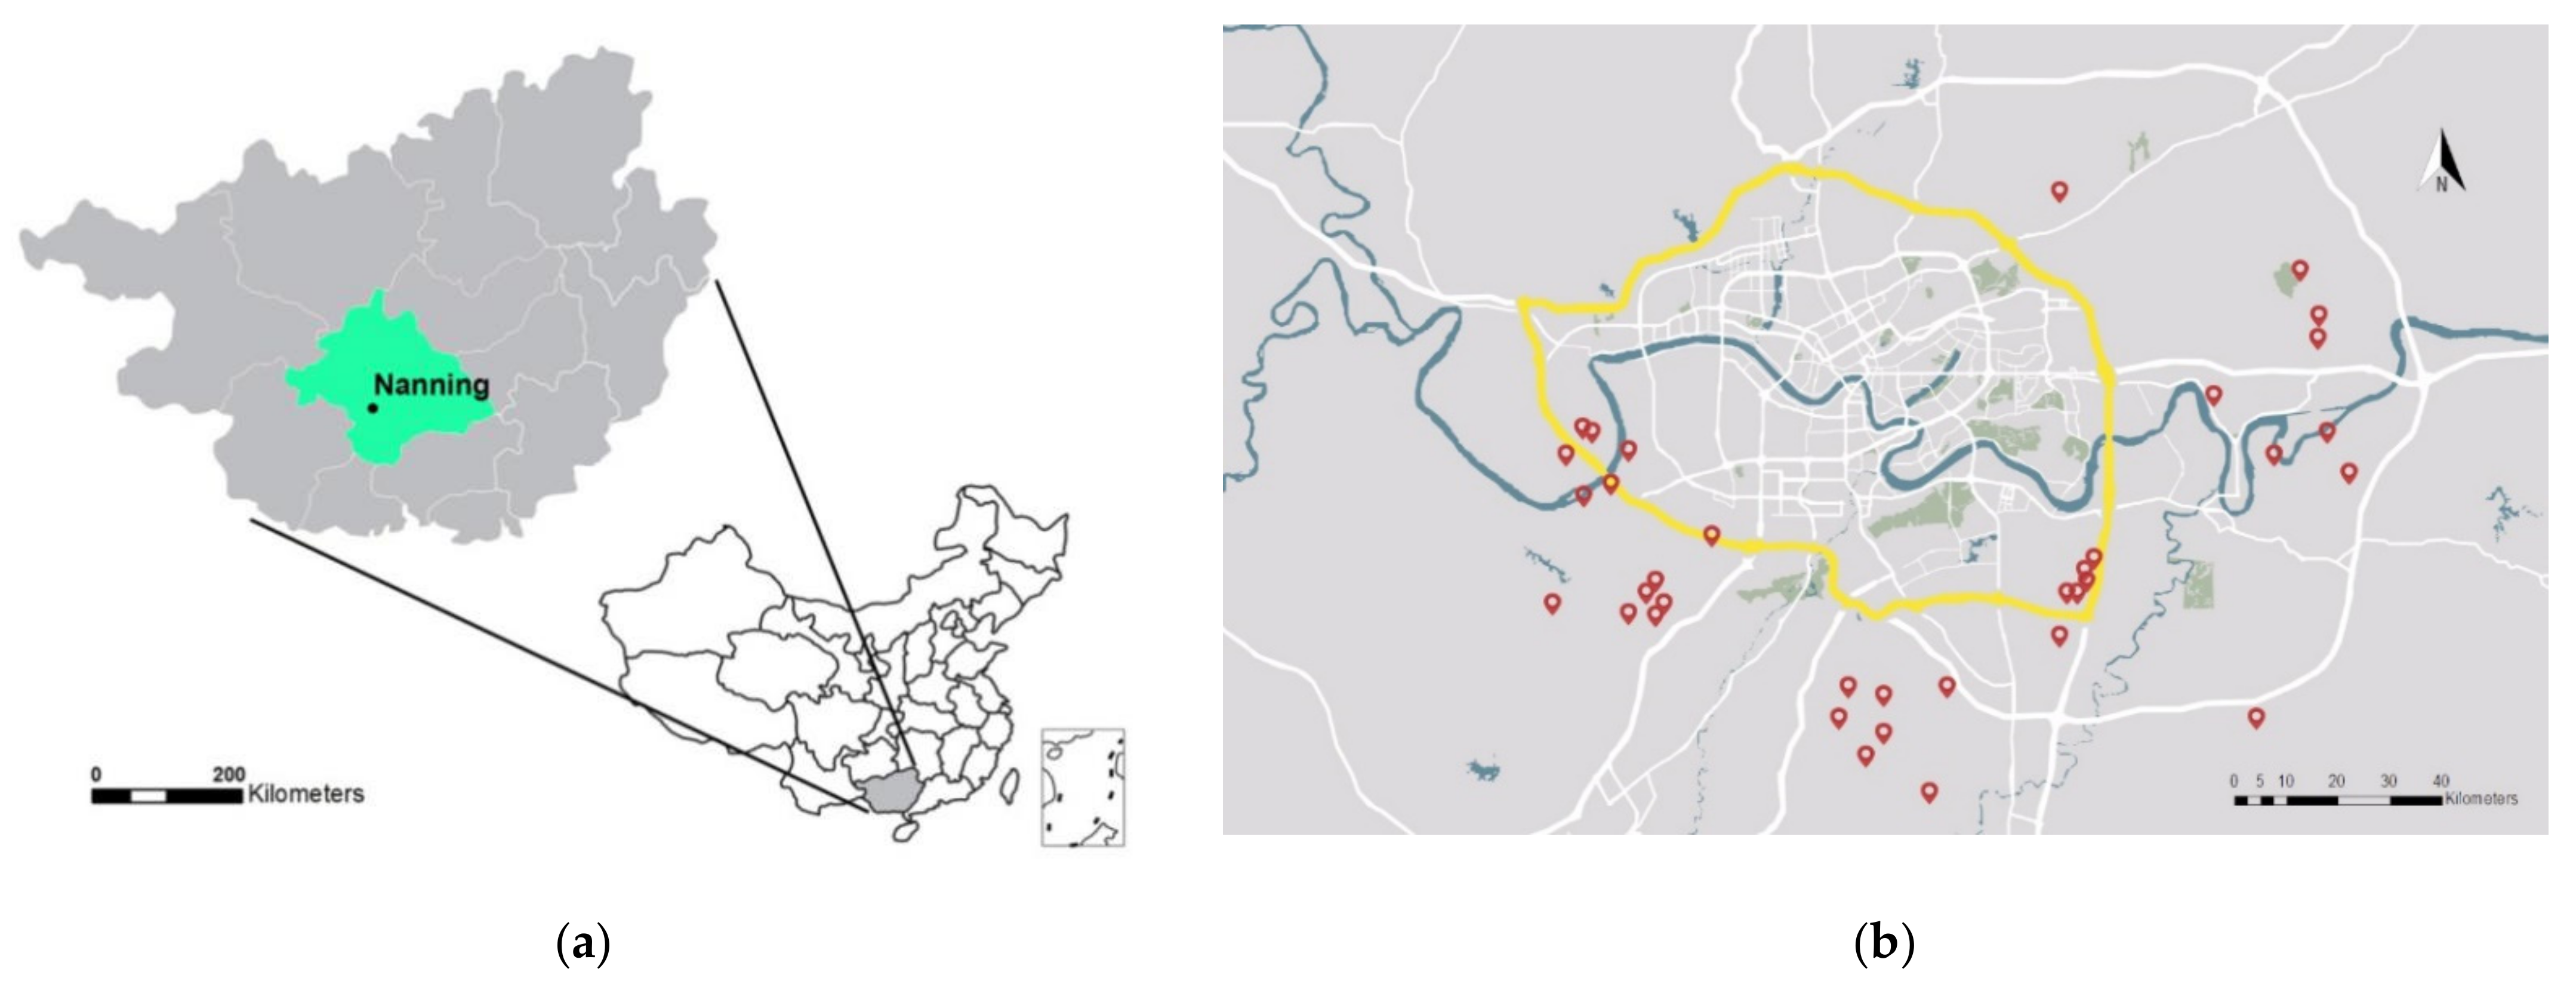
2.1. Research Area

We distributed the survey to farmers who lived within 20 km of the boundary of Nanning, the capital city of Guangxi Zhuang Autonomous Region, in an area where we previously sampled biodiversity [45,46]. The climate is subtropical, with an annual precipitation of 1200 to 1700 mm per year, and midday temperatures that range from 12.8 to 28.2 °C. Fruit orchards and eucalyptus are major industries, but we worked in areas where these were not common, and instead, the dominant crops were rice (planted in two seasons) and sugarcane, with small farms also often including a variety of vegetables.

2.2. Sample Selection

We conducted preliminary surveys to test whether farmers would understand the questions and to gauge the time it took them to complete the questionnaire. In January 2019, we interviewed 49 farmers in two villages, and in October 2019, we interviewed 45 farmers in three villages. From this experience, we decided to limit the questionnaire to less than twenty minutes. These villages were not sampled thereafter.
The main survey was conducted between the end of May and the end of July 2020. To decrease the risk of aggregation bias, we sampled 35 villages in the south, east and west of Nanning (Figure 1). We followed systematic sampling’ method [51], asking villagers where the center of the village was, and then starting from that place, walking in a random direction, and seeking to interview people from every other household. The person who we interviewed was not necessarily the head of the household, but was the family member who was in charge of agricultural production [42]. We ensured that each village had at least five interviewees. The response rate was 80%. We gave a gift of RMB 15 as a token of appreciation, which was small enough that we think it did not strongly influence the sample of interviewees; the preliminary studies without such a gift had similar levels of participation. As we suspected that the distance of the village from the urban center would be an important factor in explaining crop diversity, we measured the distance from the village to the highway that circles the city (yellow line on Figure 1b).

2.3. Questionnaire Design

Our questionnaire was composed of six parts:
(I)
Demographic variables: (1) age and (2) gender of the interviewee.
(II)
Socio-economic variables: (3) education (personal educated years); (4) personal total income (in bins of RMB <10,000, 10,000–25,000, 25,000–50,000, 50,000–100,000); (5) non-agricultural income (0, <25, 25–50, 50–75, 75–100%); (6) amount of land that farmer plants (in the traditional Chinese measurement of mu, which is 0.067 ha); (7) whether the farmer buys leafy vegetables or rice at the market, or whether (s)he is self-sufficient. To get at another measure of self-sustainability, we also asked whether the farmers’ crops satisfy their nutritional needs.
(III)
Environmental attitude: two questions were posed to evaluate farmers’ environmental attitude: (8) What proportion of non-crop land would you leave to increase beneficial biodiversity, such as pollinators or pest-controlling predators (0, 2.5, 5, 10, >10%)? (9) How much more proportionally would you pay for healthier food without agrochemicals (0, 2.5, 5, 10, >10%)?
(IV)
Risk aversion: To investigate farmers’ attitude about risk, we used a multiple price list (MPL) design [52]. Farmers were asked to pick one of two crops: crop A, for which there was 100% probability of getting a certain price (ranging from RMB 2000 to 200 in eight different scenarios), and crop B, for which there was 50% chance of getting 2000 RMB, and 50% chance of getting nothing (see Table S2). We measured the price for crop A at which the farmers changed to selecting crop B.
(V)
Crop information: In this part of the questionnaire, there were two tables to fill out, one for the 2018 year and one for the 2019 year, asking the farmers to list all the kinds of crops that they had planted in these two years. For each crop in each year, the farmers were asked to write down the area planted, the income generated and the cost expended, and if there was any loss of crop from climatic disaster or disease/pest outbreak.
The survey design and implementation were approved by the Research Department of Guangxi University. The survey, originally conceived in both Mandarin and English, was conducted verbally in Mandarin, with CL or field assistant Ying Liang noting down the information. The questionnaire took most respondents between 10–20 min and was conducted outside their dwellings.

2.4. Analysis and Empirical Model

As a measure of crop diversity, we used the Shannon–Wiener diversity index (H) on the number and relative extent (planted area) of the crop types:
H = ∑(Pi) × (ln Pi)
where Pi means the proportion of all planted fields in one year that consisted of one particular crop. Shannon–Wiener is used extensively in ecological applications [53,54].
We then calculated profit (income minus expenses) per crop per year, and then profit for the whole farm, per year. We calculated average crop diversity and farm profit across years. We also calculated the variation in profit as the absolute difference in profit between 2018 and 2019, divided by the average profit across years. For farmers who did not provide the income or expenses for a crop in a year (n = 29), we estimated income/expenses by using the income/mu or expenses/mu figures averaged across other farmers in the same village.
To understand the factors that influenced the crop diversity of farms, we constructed an ordinary least squares (OLS) model:
CD = α0 + α1L + α2X + ε,
where CD is each farmer’s crop diversity, L represents each farmer’s planted land size, and X represents a set of control variables that may affect farmer’s crop diversity (all variables in Table 1 other than land size and risk). The environmental attitudes questions were found not to influence CD in preliminary analyses, and not used in any subsequent analysis. Total income and non-agricultural income were coded as dummy variables (similar to [55]), as the different levels represented answers with differing amounts of uncertainty (e.g., RMB 10,000–25,000 vs. RMB 50,000–100,000). Village was also added as a fixed effect. As an additional analysis, we added risk aversion as another control variable, using a smaller dataset (n = 198) that excluded 59 farmers who did not answer the risk assessment question. Likewise, we did a second additional analysis in which nutritional satisfaction was the added control variable, using another smaller dataset (n = 221) that excluded 36 farmers who did not answer this question.
We then set out to understand the effect of crop diversity on profit and the variability of profit. Variability of profit was log transformed to better fit parametric assumptions. These OLS models could be represented as:
P = β0 + β1CD + β2L + β3X + ε,
Pv = γ0 + γ1CD + γ2L + γ3X + ε,
where P is each farmer’s profit each year, Pv is farmer’s profit variability between 2018 and 2019, other symbols are as in Equation (2). Again, village was a fixed effect, and additional sub-analyses included risk aversion and nutritional satisfaction.
To better explain an unexpected strong relationship between profit and crop diversity, we conducted further OLS models, analogous to the above, including as explanatory variables the 12 different crop types that farmers mentioned planting (specifically, the proportion of all land the farmer planted that had that particular crop).

2.5. Endogeneity

In models (3) and (4), crop diversity could be an endogenous variable, as the relationship between farmers’ agricultural profit and their crop diversity could be bidirectional. In other words, crop diversity could have a positive effect on profit and/or the farmers’ decision to use a diversified strategy could be influenced by its high profit. To solve the potential endogeneity problems, we used an instrumental variable (IV) regression. It is important to identify an appropriate instrumental variable that affects farmers’ crop diversity directly but does not influence farmers’ agricultural profit. We choose as the IV the average crop diversity of the other farmers in the same village, as farmers may plant crops similar to their neighbors [56], but their neighbors’ profit would not affect theirs. The first stage regression of instrumental variable regression was:
CD’ = δ0 + δ1IV + δ2L + δ3X + ε,
where IV is the instrumental variable. In the second stage of the regression, Equation (6) was combined with Equation (3), or analogously Equation (4), to produce:
P’ = β0 + β1δ0 + β1δ1IV + β1δ2L +β1δ3X + β1ε + β2L + β3X + ε,
All statistics were performed in STATA version 16 (StataCorp LLC, College Station, TX, USA). We consider p-values < 0.05 to be significant, but we report on results with 0.05 > p < 0.10 as non-significant tendencies.

3. Results

3.1. Features of Interviewees

We first removed 44 responses (of a total of 301), in which the respondent did not plant any crops in either 2018 or 2019. Mean values of the responses to the demographic and socio-economic control variables are shown in Table 1. The most common crops were: corn (87% of farmers planted in one or both years, average area 1.54 ± 0.75 [SD]mu), rice (86% of farmers planted in one or both years, average area 3.05 ± 1.57 mu) and peanut (83% of farmers planted in one or both years, average area 1.44 ± 0.76 mu). No other crop was planted by more than 35% of farmers. Rarely planted crops included different kinds of fruits and vegetables such as cabbage, watermelon, sugarcane, towelgourd (luffa), perilla, dragon fruit, green bean, sweet potato (for leaves) and banana (Table S4). Average costs and incomes for these different crops are shown in Table S5. The average profit per year was 2396 ± 3359 [SD] RMB, and the unitless variability mean value was 4.46 ± 14.95. Only 14 farmers reported the loss of a crop due to climatic disaster or disease/pest outbreak.

3.2. Factors That Influenced Crop Diversity of Farms

The crop diversity model had good model fit (R2 = 0.58, R2adj = 0.49, Table 2). Land was the most significant predictor of crop diversity, with H increasing by 0.03 for each additional 1 mu of planted area. Distance to urban area was inversely related to crop diversity, with H decreasing by 0.04 with an increase of 1 km from the urban area. Non-agricultural income (specifically the 75–100% dummy variable) was significant, with farmers who had high non-agricultural income having less crop diversity. In the additional analysis that included risk (or an equivalent analysis without risk but also n = 197), land size was the only significant influence on crop diversity, and distance had a non-significant tendency to be a negative influence (Table S6). A similar result was found for the additional analysis that included farmers’ nutritional satisfaction (Table S7): again, only land size was significant.

3.3. Factors That Influenced Profit and Variability in Profit

The first stage results of IV regression indicated that the average neighbors’ crop diversity significantly affected crop diversity (Table S8; R2 = 0.38, R2adj = 0.25) and, hence, is an appropriate IV. Table 2 indicates that the results of the OLS profitability model (Equation (3)) were similar to those of the second stage IV regression (Equation (6)). The endogeneity test results showed crop diversity to be exogenous, since neither the Durbin χ2 score (p = 0.75) nor the Wu-Hausman F was significant (p = 0.77).
Models that related profitability to crop diversity and land showed both factors to be positive and significantly influential, with an increase of 0.1 in the Shannon–Wiener index increasing profit by ~300 RMB per year (Table 3), as well as profit being linked to total income (specifically the dummy variable of RMB 50,000–100,000). Models that included risk aversion (Tables S8 and S9) and nutrition satisfaction (Tables S10 and S11) were qualitatively similar.
In models that predicted profit variability, neither crop diversity nor land size were significant (Tables S10 and S11). In these models, people with lower percentages of non-agricultural income had lower variation in profit, although the overall model had poor fit (R2 = 0.22, R2adj = 0.04).
The models that looked at the contribution of different crop types to profit showed convincingly (R2 = 0.50, R2adj = 0.39) that there were more crops that positively contributed to profit than ones that were negative influences, consistent with the idea that crop diversity promotes profit. Sugarcane, perilla, dragon fruit and banana were all significant positive influences on profit (Table 4). Only corn had a significant negative effect on profit.

4. Discussion

Our survey revealed that higher crop diversity led to higher profitability in a peri-urban agricultural area around Nanning, China. This effect was strong: with an increase of 1 in crop diversity, as measured by the Shannon–Wiener index, profit increased by ~3250 RMB, even as farmers’ average profit was ~2400 RMB. To make this more interpretable, an increase in the Shannon–Wiener index is approximately the difference between two crops planted evenly (0.69 SWI) and five crops planted evenly (1.61 SWI). The result was contrary to our hypotheses, in which we expected that crop diversity might decrease overall profits but would lead to less variability in profit. We found instead no detectable relationship between variability and crop diversity. Results also suggested that farmers farther away from the urban area had less crop diversity. This implies that those closer to the urban area could get more access to urban markets where demand for diverse crops is high. Here, we discuss some limitations of our study dataset and then look more in depth at how the evidence supports our three major hypotheses.

4.1. Limitations and Special Circumstances of the Survey Region

This project was set-up to match the location of our previous biodiversity surveys, also located in the surroundings of the city of Nanning [45]. In those surveys, we excluded areas of tree-based agriculture (i.e., eucalyptus, citric orchards), for the reason that the tree structure might influence the presence of biodiversity. Hence, our results may not be applicable to all farmers around Nanning and do not apply to agricultural companies that may plant fruits or vegetables at larger scales. Additionally, due to Nanning’s special status as the capital city of Guangxi Zhuang Autonomous Region, this study area may be quite different from other regions in Guangxi. Nanning is rapidly expanding, and urban development is now affecting the surrounding villages. Other studies have shown that peri-urban areas may have large markets for fruit/vegetables that could influence profit [37,47]. The close distance of the region to the city and such a market may also explain why few (12%) farmers planted sugarcane in the area, normally one of Guangxi’s dominant crops [43].
Apart from these particularities of our region, our questionnaire also had some limitations. Many farmers, especially elders, stated that some of the questions were challenging for them to understand, even after verbal explanation. In particular, the risk aversion question was not answered by 59 farmers, requiring us to analyze only a subsample of the dataset for this question. Farmers also found it difficult to remember specific information of crops in 2018, compared to 2019. For the reason that differences between the years may have been driven by this problem, we decided not do analyses on the two years separately. Finally, in hindsight, there were some further questions that might have been helpful to include. As to socio-economic factors, the amount of labor that a household has would have been useful in further understanding the patterns we examine below. It would also have been interesting to obtain information during different seasons; the number of crops grown in one season is more exactly connected to crop heterogeneity (number of crops grown at one time in adjacent crop fields), the subject of our earlier work on biodiversity. However, in preliminary surveys we found that farmers were reluctant to answer questionnaires of greater than 20 min length, and therefore, we kept the tables of crops restricted to the yearly totals from the last two years.
To stress the strengths rather than the weaknesses of the project, farmers’ comprehension of the major factors studied (crop diversity, profit) was high, and we believe our information on these variables was gathered in an unbiased way. Further, our result should be generalizable to the peri-urban areas of expanding large cities in agricultural provinces of southern and southwestern China.

4.2. Factors Influencing Crop Diversity

Our results showed that land size and distance to urban area were the two most important factors influencing crop diversity. It is reasonable that farmers who have a greater extent of land would plant more types of crop to meet their daily nutrition need or to sell surplus to the market [57]. We found this positive affect of land size on crop diversity in the majority of our papers in our literature review (see Introduction), as did the review of Feliciano [13]. A few papers have highlighted some contexts in which land size might not be a positive influence on crop diversity. For example, in Kasem and Thapa’s study in Thailand, larger landholders were more likely to use monocultures, as they could use agricultural machinery to reduce labor [25]. More generally, crop heterogeneity could be associated with small-scale agriculture and can reduce technical efficiency, as recently shown in the study by Mzyece and Ng’ombe [50], since large-scale monocultures may be able to maximize profit margins [33]. However, large-scale agriculture with extensive machinery is not practiced in our study villages. Our results suggest increasing land size is an important factor to increase crop diversity in our study area, and our literature review (Table S1) suggests that this result is found widely for small-holders across the world.
As summarized in the Introduction, distance to markets can be a negative (as distance increases, there is less demand and information about that demand) or a positive (need for self-sufficiency in inaccessible areas) influence on crop diversity. In our peri-urban area with a dense network of roads, self-sufficiency is not required, and thus, we see our result as related to the proximity to a large market of city dwellers unable to produce their own vegetables [37,48,58].
Farmers with a high percentage of non-agricultural income had less crop diversity. People who have jobs away from the farm have less time to farm themselves, and planting multiple crops demands more time—especially without machinery [25]—since there are a wider variety of farming activities (e.g., more variable weeding and pest treatments), and a longer growing season. In our literature review, nine studies found a negative impact of non-agricultural income on crop diversity, compared to one showing a positive effect (see Table S1). We had hypothesized that, consistent with the literature, education would be a positive effect on crop diversity. However, education was not a significant influence in this study. It is possible that, in our peri-urban area, higher education allows more opportunities for jobs in the city and, thus, higher non-agricultural income (we found a fairly high correlation, r = 0.40, p < 0.0001, between education and non-agricultural income).

4.3. Relationship between Crop Diversity, Profit and Profit Variability

As reviewed in the introduction, crop diversity is widely acclaimed as a strategy to reduce risk to farmers. Hence, individual farmers’ risk aversion has been postulated to be an important factor in predicting crop diversity [59]. Bezabih and Sarr [49] measured risk aversion in a similar way to our methods and then found weak evidence that more risk-aversive farmers are more likely to have diverse crops. Yet, not only did we not find this result, we also could not detect any effect of crop diversity on profit variability. This may illuminate a weakness of our one-year survey (with questions asked about two years, but with some doubt as to whether farmers’ memories were as accurate in the previous year as the current one). Information on a longer time period could more robustly measure variability in profit. At this point, we can only point out that like farmers in other parts of China, the small holders in our study practice small-scale, diversified agriculture [60,61], and that they tend on average to be risk-averse (5.8 out of 8 pt scale).
In our hypotheses, we expected that higher crop diversity would lead to less profit as scale-dependent efficiencies were lost [33]. On the contrary, we found that farmers’ crop profit increased with crop diversity, and the model with all their planted crops (Table 2B) showed that several crops that were rarely planted—vegetables, fruits and sugarcane were more profitable compared to staples such as corn, rice and peanuts. These results are consistent with our literature review and that of Feliciano [13]. A particularly strong study on this issue is that of Pellegrini and Tasciotti [32], who showed positive correlations between crop diversity and profit in their studies in eight countries, particularly when “high-value commodities such as fruits and vegetables are … produced”.
This result raises the question of why most farms concentrate on the less-profitable but widely planted crops of rice, corn and peanut. To some extent, beyond the profit derived from these farms, they are also used for the families’ own food security. Only 26.9% farmers reported that they bought rice from market. As for corn/maize varieties, these may be used to feed the families livestock. For example, in Poland, crop diversity is influenced by the amount and type of livestock [62]. Peanuts may be used to increase nitrogen-fixation in rice-based ecosystems [63] and can also be important as edible oil for the family’s consumption. Nevertheless, we found no connection between self-sufficiency (whether farmers’ planting satisfied their nutritional needs) and crop diversity.

4.4. Implications for Policy-Makers and Farmers of the Study Region

Our finding that farmers who were planting many types of crops, and particularly fruits and vegetables, were more profitable, suggests that the agricultural policies of China aimed at encouraging small-holders to grow a variety of high-profit crops, as opposed to grain staples, should be continued and expanded. Urbanization over the past four decades has occurred in China at a more rapid rate than almost any other country [64], and this development has also resulted in a loss of arable lands [65,66]. Therefore, there is a large demand for diverse kinds of vegetables in the cities, which farmers in peri-urban areas are well suited to supply [37,48]. In particular, China has an existing agricultural policy tool known as the “Vegetable Basket” program, started in the 1980s, which aims to provide the infrastructure and capabilities (e.g., wholesale markets, vegetable specialist producers) to increase the production of diverse varieties of vegetable crops [47]. This program’s objectives are to help farmers switch from farming staples to more high-profit crops desired in urban areas and, by so doing, increase rural residents’ income sources. The program has been seen as successful in achieving many of its objectives, for example increasing the number of varieties of vegetables four-fold between 1995 and 2001 [58].
One of the largest impediments towards diversifying farmers’ crops will be the small size of the land that they plant on. The mean planted land per year per farmer in this study was 5.4 ± 2.2 mu (0.36 ± 0.15 ha), and there were no interviewees who planted more than 1 ha per year. The importance of land size as an influence on crop diversity means that many of the smallest holders are limited in the number of crops they plant by the amount of land they are able to plant. Policy makers aiming to encourage crop diversity should consider ways for small-holder farmers to be involved in different kinds of collective organizations that allow more area and more labor to plant a larger area that can then include a higher diversity of crop types.
For farmers of our study region, our results indicate that there are a number of lucrative crops that they should consider as replacements to grain staples. In particular, farmers should consider replacing corn (which had a statistically significantly negative coefficient in our models) and rice (the crop that has the largest size of planted land, Table S4), with various kinds of fruits and vegetables (especially those with significantly positive coefficients in Table 4). Of course, our data are just a snapshot of two years, and profits could vary significantly over time. Fortunately, annually updated data on the income and expenses of many crops at the provincial level, collected by the National Committee for Compilation of Cost–Benefit Data of Agricultural Products, can be freely accessed at yearbookchina.com (accessed on 30 March 2021). We hope that agricultural extension officers, and the farmers themselves, will use this information to increase incomes in this area. Farmers who add more crops within one season might also be able to obtain greater ecosystem services from higher levels of biodiversity such as pollinators and pest predators [21,22].

5. Conclusions

This study addresses a lack of knowledge about what factors influence crop diversity in East Asia, and specifically in southern China, and about the economic consequences of planting more crops for farmers in this region. We show that crop diversity is profitable in the same region where other studies have shown that crop heterogeneity is associated with increased biodiversity [45,46]. There is now strong worldwide evidence that biodiversity can provide ecosystem services to farmers, specifically through pollination and pest control (e.g., [7,67]), and that, thus, biodiversity and small-scale agriculture can be compatible [17]. Hence, we suggest that increasing crop diversity in this region may be a win–win for biodiversity conservation and farmer livelihoods. We suggest that policy to improve crop diversity focus on easing the limitations imposed by the small size of the farmers’ planted lands.
More research is required to determine whether our findings of increased profit are found year after year, and how crop diversity affects variability in profit. Further, our results may be specific to peri-urban areas around a large city [48], so it is important to see whether the same result could be found in more rural areas near protected areas, where biodiversity is higher.

Supplementary Materials

The following are available online at https://www.mdpi.com/article/10.3390/agriculture11040336/s1, Table S1: Literature review of studies that investigated (1) factors that affect crop diversification, and/or (2) how crop diversity affects farmers profit or profit variability. Table S2: The measurement of risk aversion used in the study, a multiple price list design. Table S3: Response of interviewees about their total income and non-agricultural income. Table S4: Information about which crops were planted by farmers in 2018 and 2019. Table S5: The average income and expenses for each crop. Table S6: OLS model that tested the factors that influenced crop diversity, run on the subsample of farmers that answered the risk aversion question, with risk aversion not included, and then included in the list of control variables. Table S7: OLS model that tested the factors that influenced crop diversity run on the subsample of farmers that answered the nutritional satisfaction question, with satisfaction not included, and then included in the list of control variables. Table S8: First stage regression of models of profitability, including an additional analysis for the subsample of farmers that answered the risk aversion question (with and without the inclusion of that data). Table S9: Results of OLS model and 2SLS of models for the subsample of farmers that answered the risk aversion question. Analyses shown with and without inclusion of the factor of risk aversion. Table S10: First stage regression of models for the subsample of farmers that answered the nutritional satisfaction question. Analyses shown with and without inclusion of the factor of nutritional satisfaction. Table S11: Results of OLS model and 2SLS of models for the subsample of farmers that answered the nutritional satisfaction question. Analyses shown with and without inclusion of nutritional satisfaction as a factor. Table S12: First stage regression for a model that explained profit variability. Table S13: Results of OLS model and 2SLS for the profit variability model. Questionnaire in English: Questionnaire about Environmentally-Friendly Agricultural Practices. Separate document including all data (worksheet): the full responses of all interviewees.

Author Contributions

Conceptualization, C.L., A.J., M.-B.L., X.C. and E.G.; field investigation, C.L.; formal analysis, C.L., X.C., C.M. and E.G.; writing—original draft preparation, C.L. and E.G.; writing—review and editing, all authors. All authors have read and agreed to the published version of the manuscript.

Funding

This research was funded by National Natural Sciences Foundation of China (Grant No. 72063002) to X.C. and a Special Talents Recruitment Grant of Guangxi University to E.G.

Institutional Review Board Statement

The study was approved by the Research Department of Guangxi University (date of approval, 5/30/2020).

Informed Consent Statement

Informed consent was obtained from all subjects involved in the study.

Data Availability Statement

Data are contained within the Supplementary Materials.

Acknowledgments

We thank Ying Liang for help in the field, and the College of Forestry and the Research Department of Guangxi University for arranging permission to do the study. We are grateful to all the people who took part in the interviews. We appreciate the comments of three reviewers, which helped to substantially improve earlier versions of the manuscript.

Conflicts of Interest

The authors declare no conflict of interest.

References

  1. Godfray, H.C.J.; Beddington, J.R.; Crute, I.R.; Haddad, L.; Lawrence, D.; Muir, J.F.; Pretty, J.; Robinson, S.; Thomas, S.M.; Toulmin, C. Food security: The challenge of feeding 9 billion people. Science 2010, 327, 812–818. [Google Scholar] [CrossRef] [PubMed] [Green Version]
  2. Tilman, D.; Balzer, C.; Hill, J.; Befort, B.L. Global food demand and the sustainable intensification of agriculture. Proc. Natl. Acad. Sci. USA 2011, 108, 20260–20264. [Google Scholar] [CrossRef] [PubMed] [Green Version]
  3. Laurance, W.F.; Sayer, J.; Cassman, K.G. Agricultural expansion and its impacts on tropical nature. Trends Ecol. Evol. 2014, 29, 107–116. [Google Scholar] [CrossRef] [PubMed]
  4. Tilman, D.; Fargione, J.; Wolff, B.; D’Antonio, C.; Dobson, A.; Howarth, R.; Schindler, D.; Schlesinger, W.H.; Simberloff, D.; Swackhamer, D. Forecasting agriculturally driven global environmental change. Science 2001, 292, 281–284. [Google Scholar] [CrossRef] [PubMed] [Green Version]
  5. Garibaldi, L.A.; Steffan-Dewenter, I.; Winfree, R.; Aizen, M.A.; Bommarco, R.; Cunningham, S.A.; Kremen, C.; Carvalheiro, L.G.; Harder, L.D.; Afik, O.; et al. Wild pollinators enhance fruit set of crops regardless of honey bee abundance. Science 2013, 339, 1608–1611. [Google Scholar] [CrossRef]
  6. Pywell, R.F.; Heard, M.S.; Woodcock, B.A.; Hinsley, S.; Ridding, L.; Nowakowski, M.; Bullock, J.M. Wildlife-friendly farming increases crop yield: Evidence for ecological intensification. Proc. R. Soc. B 2015, 282, 20151740. [Google Scholar] [CrossRef] [Green Version]
  7. Redlich, S.; Martin, E.A.; Steffan-Dewenter, I. Landscape-level crop diversity benefits biological pest control. J. Appl. Ecol. 2018, 55, 2419–2428. [Google Scholar] [CrossRef]
  8. Benton, T.G.; Vickery, J.A.; Wilson, J.D. Farmland biodiversity: Is habitat heterogeneity the key? Trends Ecol. Evol. 2003, 18, 182–188. [Google Scholar] [CrossRef]
  9. Tews, J.; Brose, U.; Grimm, V.; Tielborger, K.; Wichmann, M.C.; Schwager, M.; Jeltsch, F. Animal species diversity driven by habitat heterogeneity/diversity: The importance of keystone structures. J. Biogeogr. 2004, 31, 79–92. [Google Scholar] [CrossRef] [Green Version]
  10. Fahrig, L.; Baudry, J.; Brotons, L.; Burel, F.G.; Crist, T.O.; Fuller, R.J.; Sirami, C.; Siriwardena, G.M.; Martin, J.-L. Functional landscape heterogeneity and animal biodiversity in agricultural landscapes. Ecol. Lett. 2011, 14, 101–112. [Google Scholar] [CrossRef]
  11. Stein, A.; Gerstner, K.; Kreft, H.; Arita, H. Environmental heterogeneity as a universal driver of species richness across taxa, biomes and spatial scales. Ecol. Lett. 2014, 17, 866–880. [Google Scholar] [CrossRef]
  12. Fahrig, L.; Girard, J.; Duro, D.; Pasher, J.; Smith, A.; Javorek, S.; King, D.; Lindsay, K.F.; Mitchell, S.; Tischendorf, L. Farmlands with smaller crop fields have higher within-field biodiversity. Agric. Ecosyst. Environ. 2015, 200, 219–234. [Google Scholar] [CrossRef]
  13. Feliciano, D. A review on the contribution of crop diversification to Sustainable Development Goal 1 “No poverty” in different world regions. Sustain. Dev. 2019, 27, 795–808. [Google Scholar] [CrossRef] [Green Version]
  14. Malezieux, E.; Crozat, Y.; Dupraz, C.; Laurans, M.; Makowski, D.; Ozier-Lafontaine, H.; Rapidel, B.; Tourdonnet, S.; Valantin-Morison, M. Mixing plant species in cropping systems: Concepts, tools and models. A review. Agron. Sustain. Dev. 2009, 29, 43–62. [Google Scholar] [CrossRef] [Green Version]
  15. Thrupp, L.A. The importance of biodiversity in agroecosystems. J. Crop. Improv. 2004, 12, 315–337. [Google Scholar] [CrossRef]
  16. Fischer, J.; Brosi, B.; Daily, G.C.; Ehrlich, P.R.; Goldman, R.; Goldstein, J.; Lindenmayer, D.B.; Manning, A.D.; Mooney, H.A.; Pejchar, L.; et al. Should agricultural policies encourage land sparing or wildlife-friendly farming? Front. Ecol. Environ. 2008, 6, 380–385. [Google Scholar] [CrossRef]
  17. Tscharntke, T.; Clough, Y.; Wanger, T.C.; Jackson, L.; Motzke, I.; Perfecto, I.; Vandermeer, J.; Whitbread, A. Global food security, biodiversity conservation and the future of agricultural intensification. Biol. Conserv. 2012, 151, 53–59. [Google Scholar] [CrossRef]
  18. Li, C.; Fuller, D.Q.; He, X.; Zhu, S.; Zhou, H.; Wang, Y.; Li, Y.; Yang, J.; Fan, J.; Yang, J.; et al. Crop diversity for yield increase. PLoS ONE 2009, 4, e8049. [Google Scholar] [CrossRef] [PubMed] [Green Version]
  19. Karp, D.S.; Mendenhall, C.D.; Sandi, R.F.; Chaumont, N.; Ehrlich, P.R.; Hadly, E.A.; Daily, G.C. Forest bolsters bird abundance, pest control and coffee yield. Ecol. Lett. 2013, 16, 1339–1347. [Google Scholar] [CrossRef]
  20. Zhao, H.; Li, J.; Guo, L.; Wang, K. Crop diversity at the landscape level affects the composition and structure of the vegetation-dwelling arthropod communities in naked oat (Avena chinensis) fields. Int. J. Environ. Res. Public Health 2020, 18, 30. [Google Scholar] [CrossRef] [PubMed]
  21. Sirami, C.; Gross, N.; Baillod, A.B.; Bertrand, C.; Carrié, R.; Hass, A.; Henckel, L.; Miguet, P.; Vuillot, C.; Alignier, A.; et al. Increasing crop heterogeneity enhances multitrophic diversity across agricultural regions. Proc. Natl. Acad. Sci. USA 2019, 116, 16442–16447. [Google Scholar] [CrossRef] [PubMed] [Green Version]
  22. Martin, A.E.; Collins, S.J.; Crowe, S.; Girard, J.; Naujokaitis-Lewis, I.; Smith, A.C.; Lindsay, K.; Mitchell, S.; Fahrig, L. Effects of farmland heterogeneity on biodiversity are similar to—or even larger than—the effects of farming practices. Agric. Ecosyst. Environ. 2020, 288, 106698. [Google Scholar] [CrossRef]
  23. Tonhasca, A.J.; Byrne, D.N. The effects of crop diversification on herbivorous insects: A meta-analysis approach. Ecol. Entomol. 1994, 19, 239–244. [Google Scholar] [CrossRef]
  24. Gurr, G.M.; Wratten, S.D.; Luna, J.M. Multi-function agricultural biodiversity: Pest management and other benefits. Basic Appl. Ecol. 2003, 4, 107–116. [Google Scholar] [CrossRef]
  25. Kasem, S.; Thapa, G.B. Crop diversification in Thailand: Status, determinants, and effects on income and use of inputs. Land Use Policy 2011, 28, 618–628. [Google Scholar] [CrossRef]
  26. Lin, B.B. Resilience in agriculture through crop diversification: Adaptive management for environmental change. Bioscience 2011, 61, 183–193. [Google Scholar] [CrossRef] [Green Version]
  27. Seo, S.N.; Mendelsohn, R. An analysis of crop choice: Adapting to climate change in South American farms. Ecol. Econ. 2008, 67, 109–116. [Google Scholar] [CrossRef]
  28. Coromaldi, M.; Pallante, G.; Savastano, S. Adoption of modern varieties, farmers’ welfare and crop biodiversity: Evidence from Uganda. Ecol. Econ. 2015, 119, 346–358. [Google Scholar] [CrossRef]
  29. Arslan, A.; Cavatassi, R.; Alfani, F.; McCarthy, N.; Lipper, L.; Kokwe, M. Diversification under climate variability as part of a CSA strategy in rural Zambia. J. Dev. Stud. 2017, 54, 457–480. [Google Scholar] [CrossRef]
  30. Huang, J.; Jiang, J.; Wang, J.; Hou, L. Crop diversification in coping with extreme weather events in China. J. Integr. Agric. 2014, 13, 677–686. [Google Scholar] [CrossRef]
  31. Schneider, L. Bearing risk is hard to do: Crop price risk transfer for poor farmers and low-income countries. Dev. Pract. 2011, 21, 536–549. [Google Scholar] [CrossRef]
  32. Pellegrini, L.; Tasciotti, L. Crop diversification, dietary diversity and agricultural income: Empirical evidence from eight developing countries. Rev. Can. Etudes. Dev. 2014, 35, 211–227. [Google Scholar] [CrossRef]
  33. Duffy, M. Economies of size in production agriculture. J. Hunger. Environ. Nutr. 2009, 4, 375–392. [Google Scholar] [CrossRef]
  34. Gotor, E.; Usman, M.A.; Occelli, M.; Fantahun, B.; Fadda, C.; Kidane, Y.G.; Mengistu, D.; Kiros, A.Y.; Mohammed, J.N.; Assefa, M.; et al. Wheat varietal diversification increases Ethiopian smallholders’ food security: Evidence from a participatory development initiative. Sustainability 2021, 13, 1029. [Google Scholar] [CrossRef]
  35. Dessie, A.B.; Abate, T.M.; Mekie, T.M.; Liyew, Y.M. Crop diversification analysis on red pepper dominated smallholder farming system: Evidence from northwest Ethiopia. Ecol. Process. 2019, 8, 1–11. [Google Scholar] [CrossRef] [Green Version]
  36. Tesfaye, W.; Tirivayi, N. Crop diversity, household welfare and consumption smoothing under risk: Evidence from rural Uganda. World Dev. 2020, 125, 104686. [Google Scholar] [CrossRef]
  37. Dinham, B. Growing vegetables in developing countries for local urban populations and export markets: Problems confronting small-scale producers. Pest. Manag. Sci. 2003, 59, 575–582. [Google Scholar] [CrossRef]
  38. Makate, C.; Wang, R.; Makate, M.; Mango, N. Crop diversification and livelihoods of smallholder farmers in Zimbabwe: Adaptive management for environmental change. SpringerPlus 2016, 5, 1–18. [Google Scholar] [CrossRef] [PubMed] [Green Version]
  39. Chen, L.-L.; Yuan, P.; You, M.-S.; Pozsgai, G.; Ma, X.; Zhu, H.; Yang, G. Cover crops enhance natural enemies while help suppressing pests in a tea plantation. Ann. Entomol. Soc. Am. 2019, 112, 348–355. [Google Scholar] [CrossRef]
  40. He, H.; Liu, L.; Munir, S.; Bashir, N.H.; Wang, Y.; Yang, J.; Li, C. Crop diversity and pest management in sustainable agriculture. J. Integr. Agric. 2019, 18, 1945–1952. [Google Scholar] [CrossRef]
  41. Ju, Q.; Ouyang, F.; Gu, S.; Qiao, F.; Yang, Q.; Qu, M.; Ge, F. Strip intercropping peanut with maize for peanut aphid biological control and yield enhancement. Agric. Ecosyst. Environ. 2019, 286, 106682. [Google Scholar] [CrossRef]
  42. Zhong, T.; Huang, X. Impact of off-farm employment on the diversity of crop choices: A case study of Taixing city and Suyu district in Jiangsu Province, China. J. Nat. Res. 2012, 27, 187–195. [Google Scholar]
  43. Li, Y.-R.; Yang, L.-T. Sugarcane agriculture and sugar industry in China. Sugar Tech. 2014, 17, 1–8. [Google Scholar] [CrossRef]
  44. Myers, N.; Mittermeier, R.A.; Mittermeier, C.G.; Fonseca, G.A.B.d.; Kent, J. Biodiversity hotspots for conservation priorities. Nature 2000, 403, 853–858. [Google Scholar] [CrossRef] [PubMed]
  45. Lee, M.-B.; Goodale, E. Crop heterogeneity and non-crop vegetation can enhance avian diversity in a tropical agricultural landscape in southern China. Agric. Ecosyst. Environ. 2018, 265, 254–263. [Google Scholar] [CrossRef]
  46. Zhou, W.; Lee, M.-B.; Goodale, E. The relationship between the diversity of herbaceous plants and the extent and heterogeneity of croplands in noncrop vegetation in an agricultural landscape of south China. Glob. Ecol. Conserv. 2018, 14, 14. [Google Scholar] [CrossRef]
  47. Gu, S. The emergence and development of the vegetable sector in China. Ind. Innov. 2009, 16, 499–524. [Google Scholar] [CrossRef]
  48. Zasada, I. Multifunctional peri-urban agriculture—A review of societal demands and the provision of goods and services by farming. Land Use Policy 2011, 28, 639–648. [Google Scholar] [CrossRef]
  49. Bezabih, M.; Sarr, M. Risk preferences and environmental uncertainty: Implications for crop diversification decisions in Ethiopia. Environ. Resour. Econ. 2012, 53, 483–505. [Google Scholar] [CrossRef]
  50. Mzyece, A.; Ng’ombe, J.N. Does crop diversification involve a trade-off between technical efficiency and income stability for rural farmers? Evidence from Zambia. Agronomy 2020, 10, 1875. [Google Scholar] [CrossRef]
  51. Puri, R.K.; Watson, C.W.; Newing, H. Conducting Research in Conservation—A Social Science Perspective. Taylor Francis e-Library 2011, 68–70. Available online: https://books.google.com/books/about/Conducting_Research_in_Conservation.html?id=ZgbHBQAAQBAJ (accessed on 1 November 2010).
  52. Andersen, S.; Harrison, G.W.; Lau, M.I.; Rutström, E.E. Elicitation using multiple price list formats. Exp. Econ. 2006, 9, 383–405. [Google Scholar] [CrossRef]
  53. Oksanen, J. Vegan: Ecological Diversity. Available online: https://cran.r-project.org/web/packages/vegan/vignettes/diversity-vegan.pdf (accessed on 1 December 2020).
  54. Peet, R.K. The measurement of species diversity. Annu. Rev. Ecol. Evol. Syst. 1974, 5, 285–307. [Google Scholar] [CrossRef]
  55. Malaiarasan, U.; Paramasivam, R.; Thomas Felix, K. Crop diversifcation: Determinants and efects under paddy-dominated cropping system. Paddy Water Environ. 2021. [Google Scholar] [CrossRef]
  56. Birthal, P.S.; Roy, D.; Negi, D.S. Assessing the impact of crop diversification on farm poverty in India. World Dev. 2015, 72, 70–92. [Google Scholar] [CrossRef]
  57. Joshi, G.R.; Bauer, S. Determinants of rice variety diversity on household farms in the Terai region of Nepal. In Proceedings of the International Association of Agricultural Economists Conference, Gold Coast, Australia, 12–18 August 2006; pp. 12–18. [Google Scholar] [CrossRef]
  58. Liu, Y.M.; Chen, J.S.; Zhang, X.Y.; Kamphuis, B.M. The Vegetable Industry in China; Developments in Policies, Production, Marketing and International Trade; Report 6.04.14; Agricultural Economics Research Institute (LEI): The Hague, The Netherlands, 2004. [Google Scholar]
  59. Falco, S.D.; Perrings, C. Crop biodiversity, risk management and the implications of agricultural assistance. Ecol. Econ. 2005, 55, 459–466. [Google Scholar] [CrossRef] [Green Version]
  60. Cui, Z.; Zhang, H.; Chen, X.; Zhang, C.; Ma, W.; Huang, C.; Zhang, W.; Mi, G.; Miao, Y.; Li, X.; et al. Pursuing sustainable productivity with millions of smallholder farmers. Nature 2018, 555, 363–366. [Google Scholar] [CrossRef]
  61. Zou, Y.; Bianchi, F.J.J.A.; Jauker, F.; Xiao, H.; Chen, J.; Cresswell, J.; Luo, S.; Huang, J.; Deng, X.; Hou, L.; et al. Landscape effects on pollinator communities and pollination services in small-holder agroecosystems. Agric. Ecosyst. Environ. 2017, 246, 109–116. [Google Scholar] [CrossRef]
  62. Gozdowski, D.; Roszkowska-Mądra, B.; Mądry, W. Crop diversity at the gmina level and its causes in the Podlasie district of Poland. Commun. Biometry Crop. Sci. 2008, 3, 72–79. [Google Scholar]
  63. Chu, G.X.; Shen, Q.R.; Cao, J.L. Nitrogen fixation and N transfer from peanut to rice cultivated in aerobic soil in an intercropping system and its effect on soil N fertility. Plant Soil 2004, 263, 17–27. [Google Scholar] [CrossRef]
  64. Seto, K.C.; Fragkias, M.; Guneralp, B.; Reilly, M.K. A meta-analysis of global urban land expansion. PLoS ONE 2011, 6, e23777. [Google Scholar] [CrossRef]
  65. Lichtenberg, E.; Ding, C. Assessing farmland protection policy in China. Land Use Policy 2008, 25, 59–68. [Google Scholar] [CrossRef]
  66. d’Amour, C.B.; Reitsma, F.; Baiocchi, G.; Barthel, S.; Güneralp, B.; Erb, K.-H.; Haberl, H.; Creutzig, F.; Seto, K.C. Future urban land expansion and implications for global croplands. Proc. Natl. Acad. Sci. USA 2017, 114, 8939–8944. [Google Scholar] [CrossRef] [Green Version]
  67. Hass, A.L.; Kormann, U.G.; Tscharntke, T.; Clough, Y.; Baillod, A.B.; Sirami, C.; Fahrig, L.; Martin, J.-L.; Baudry, J.; Bertrand, C.; et al. Landscape configurational heterogeneity by small-scale agriculture, not crop diversity, maintains pollinators and plant reproduction in western Europe. Proc. R. Soc. B 2018, 285. [Google Scholar] [CrossRef] [PubMed]
Figure 1. The research area in southern China: (a) The position of Nanning in Guangxi Zhuang Autonomous Region; (b) sampled villages position (red flags) around the first highway that circles the city (yellow line). Most villages were distributed to the east, west and south of the city. Panel (a) was downloaded from www.d-maps.com (accessed on 1 September 2020) and modified in Adobe Photoshop by C. Li. Panel (b) was downloaded from www.guihuayun.com (accessed on 1 September 2020) and also modified in Photoshop by C. Li.
Agriculture 11 00336 g001
Table 1. Different variables that included in the questionnaire and subsequent modeling process. Total income and non-agricultural income were coded as dummy variables. Raw data for TotalIncome and NonAgIncome is shown in Supplemental Table S3.
VariablesType of VariableExplanationMeanStandard Deviation
AgeContinuousAge of interviewee48.579.56
GenderDummyBinary variable = 1 if farmer is male; 0 otherwise0.560.50
LandContinuousThe total area planted per year (mu)5.422.16
BFMarketDummyBinary variable = 1 if farmer buys leafy vegetables from market; 0 otherwise0.190.39
DistanceContinuousThe distance of village to urban area (km)4.243.83
RiskContinuousThe index of interviewees’ risk attitude5.741.76
AverageCDContinuousFarmers’ average crop diversity in 2018 and 20191.110.28
NutritionContinuousWhether self-production satisfied nutritional need, in five categories, with 5 being fully satisfied. 3.591.24
EducationContinuousThe number of years the interviewee attended school8.592.55
TotalIncomeDummyInterviewees’ total income range in 5 categories.
NonAgIncomeDummyThe percentage of farmers’ non-agricultural income in 5 categories
Data source: based on the authors’ research.
Table 2. Model results explaining factors that affected farmers’ crop diversity.
VariablesCoefficientStandard Error
Age0.000710.0017
Gender−0.00610.028
Land0.032 ***0.0065
Distance−0.042 **0.015
BFMarket0.00230.044
Education−0.00430.0071
NonAgIncome_2−0.0380.039
NonAgIncome_3−0.0330.046
NonAgIncome_4−0.10°0.054
NonAgIncome_5−0.23 *0.10
TotalIncome_2−0.0410.042
TotalIncome_30.0000110.051
TotalIncome_4−0.0260.076
Constant1.08 ***0.20
Fixed effect35 villages
Observations257
Levels of significance are shown by: (°0.05 < p < 0.10; * p < 0.05; ** p < 0.01; *** p < 0.001). Data source: based on the authors’ research and modeling in STATA.
Table 3. Results of ordinary least squares (OLS) model and second IV regression result incorporating the average neighbor’s crop diversity (2SLS) showing how a farmer’s profit per year (a mean of 2018 and 2019) was affected by planted land size and the control factors.
VariablesOLS2SLS
CoefficientStandard ErrorCoefficientStandard Error
AverageCD3254.06 **1018.333085.88 ***1059.12
Age−12.0524.87−11.9422.49
Gender407.64413.48406.62373.81
Land308.63 **99.45314.04 ***91.46
Distance183.35232.26176.35211.09
Education−81.96103.80−82.6793.86
Non-AgIncome_295.04580.0388.70524.72
Non-AgIncome_3−12.40677.53−17.89612.73
Non-AgIncome_4703.47791.88686.56717.80
Non-AgIncome_5−730.441481.48−768.981344.63
TotalIncome_2173.82623.97167.01564.47
TotalIncome_3443.42746.52443.44674.86
TotalIncome_43183.32 **1100.483179.10 ***994.93
Constant−3687.873092.46−3506.072852.35
Fixed effect35 villages35 villages
Observations257257
Levels of significance are shown by: (** p < 0.01; *** p < 0.001). Data source: based on the authors’ research and modeling in STATA.
Table 4. Model results from a full model that included the proportion of the farm covered by 12 different crop types.
CropsCoefficientStandard Error
Rice−1519.12°831.05
Corn−3842.62 **1243.50
Peanut−1402.181220.69
Melon2469.602655.65
Cane11,161.65 ***3189.42
Cabbage−734.341512.63
Towelgourd3801.68°1944.89
Perilla9293.35 ***2385.51
Dragon Fruit17,527.42 ***2727.39
Green Bean−758.255326.89
Sweet Potato Leaves4617.345074.83
Banana6131.85 **2082.99
Constant2810.261484.38
Fixed effect35 villages
Observations257
Levels of significance are shown by: (°0.05 < p < 0.10; ** p < 0.01; *** p < 0.001). Data source: based on the authors’ research and modeling in STATA.
Publisher’s Note: MDPI stays neutral with regard to jurisdictional claims in published maps and institutional affiliations.

