
The Role of Engineering Thermodynamics in Explaining the Inverse Correlation between Surface Temperature and Supplied Nitrogen Rate in Corn Plants: A Greenhouse Case Study


Abstract
:1. Introduction
1.1. The Exergy Destruction Principle (EDP) Applied to Corn Plants
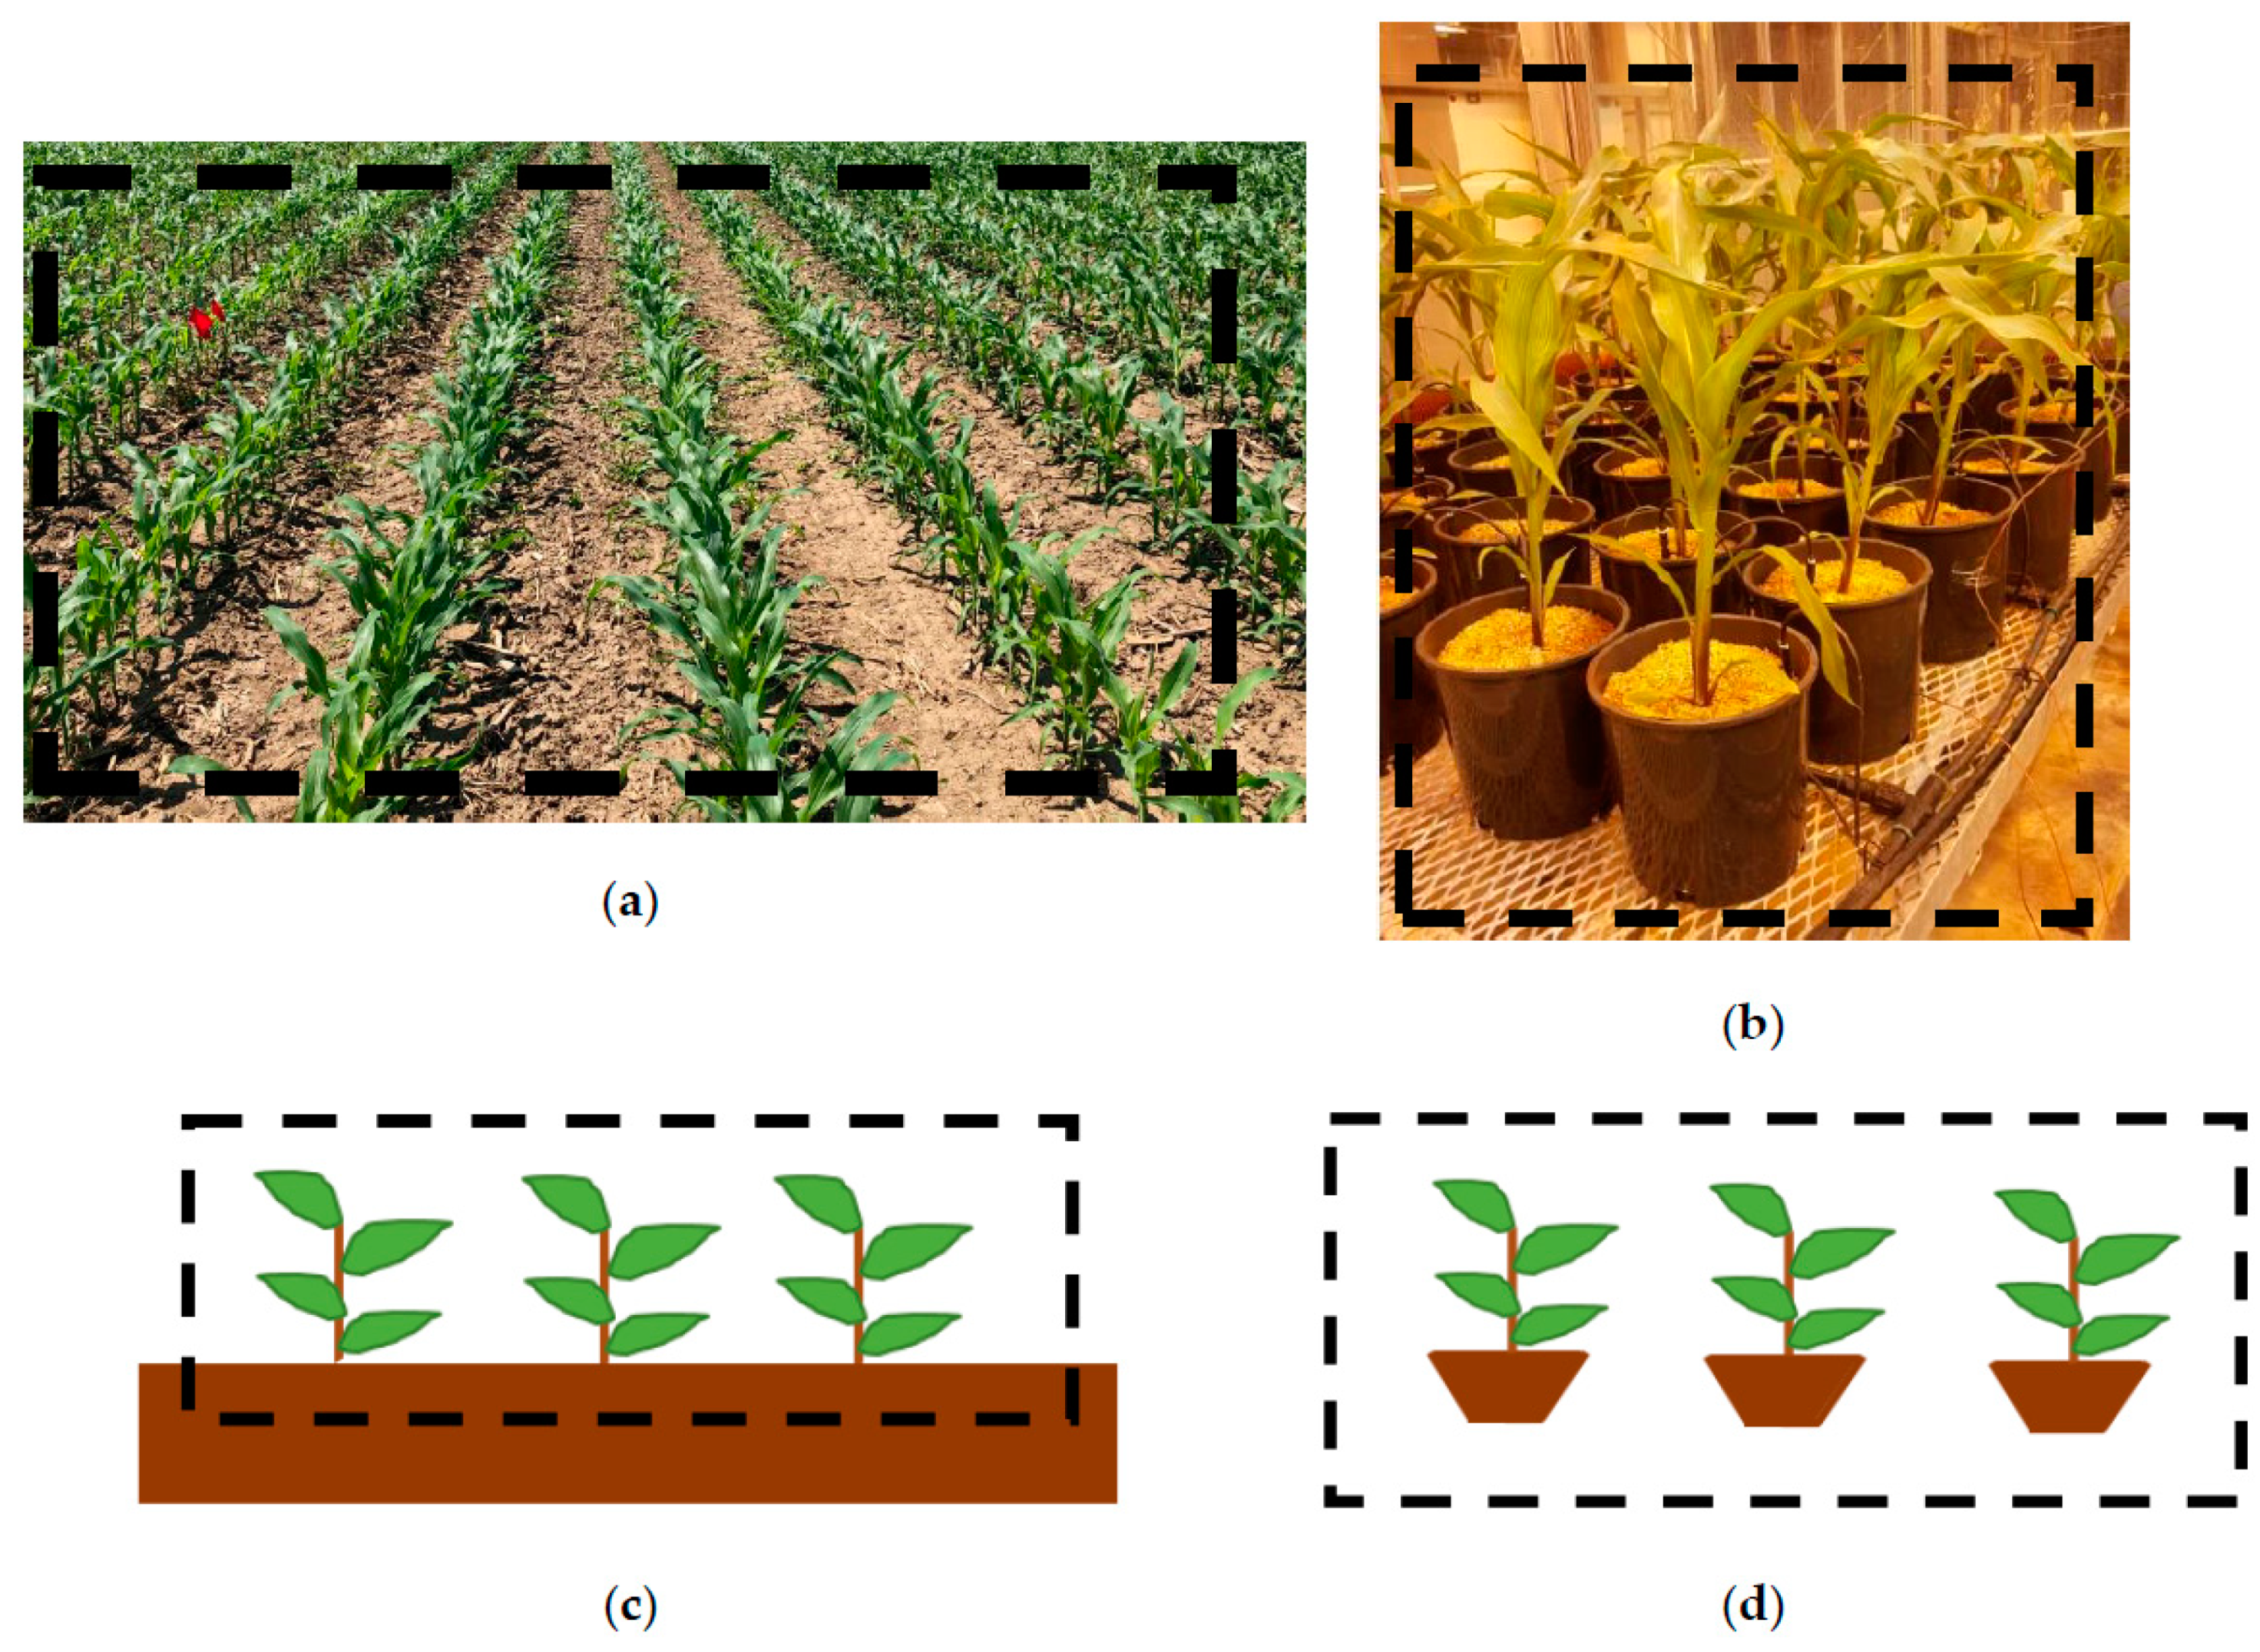
1.2. Greenhouse as a Proxy for the Field: Leaf Temperature as a Proxy for Canopy Temperature
- (i)
- Potted soil versus field soil temperature: Leaf surface temperature measurements were made around solar noon. At this time of the day, soil temperature at some depth (e.g., 15 cm) would be lower than the surrounding air temperature, whether the plants are growing in the greenhouse or the field. However, there will be a difference in field versus greenhouse soil temperature for a given air temperature, due to the lower thermal mass of the greenhouse soil, and due to a larger contact surface area with air. Specifically, greenhouse soil, for a given air temperature around noon time, will be warmer compared to field soil. The first reason is because the greenhouse does not experience as cold temperatures as the soil in the field, assuming night temperatures are cooler compared to the day temperatures; therefore, the greenhouse soil is warmer in the morning. The second reason is because the thermal mass in the greenhouse soil per plant is less, so it will warm up more quickly for a given energy input.
- (ii)
- Potted soil versus field soil canopy temperature impact: With the greenhouse soil being warmer than the field soil, there are two possible scenarios for the plant temperature: Either the greenhouse plants will be at the same temperature as the field plants or they will be warmer. Around the noon hour, greenhouse-plant temperatures may be the same as field-plant temperatures if the plant biology manages, possibly through changes in transpiration rate, to operate in a manner that stabilizes plant temperature for the possible purpose of optimizing photosynthesis. Alternatively, near the noon hour, greenhouse-plant temperatures may be shifted to a higher temperature, due to the warmer greenhouse soil. Either way, there is no known plant-cooling mechanism that would change the relative order of plant temperatures. Therefore, any difference between greenhouse- and field-soil temperatures is not expected to change the trend of the results observed in plant surface temperature measurements, and therefore, the potted plants and soil surface temperatures in the greenhouse can be used as a proxy for field crop surface temperatures.
- (iii)
- Exclusion of soil temperature from the average crop temperature: Whether crop temperature measurements are conducted in the greenhouse or the field, it is desirable to only measure plant surface temperature, to improve the signal-to-noise ratio. For early growth stages, canopy temperature (defined as the spatial average temperature of a grouping of multiple plants + soil) would be dominated by soil temperature. However, the temperature differences between stressed and less stressed corn plants, predicted by the EDP, should be dominated by development/growth, with the soil acting as a noise background signal that would swamp early growth averages of canopy temperature, thus possibly obscuring in the noise EDP predicted temperature trends between stressed and less stressed crop plants. Therefore, for signal-to-noise purposes, it was desirable to exclude soil surface temperatures when measuring crop average temperature, provided that this exclusion would affect observed temperature trends between stressed and less stressed crops. If it is considered that less stressed plants are predicted to develop and grow faster compared to stressed plants, the effect is to shade more soil quickly, which can only serve to magnify the expected EDP cooling trend, not to change the trend. Soil surface temperature measurements confirmed this expected cooling. Therefore, it was concluded that soil surface temperature could be excluded from the measured canopy temperature, with only averages of plant surface temperatures being used, in order to improve the signal-to-noise ratio. As a corollary, in the late growth stage, the soil becomes obscured, and we therefore only measuring plant surface temperature for late growth stages (assuming a typical corn crop planting that seeks to optimize the land use). Finally, plant surface temperatures that cannot be viewed from the top are, by definition, not part of the crop canopy temperature.
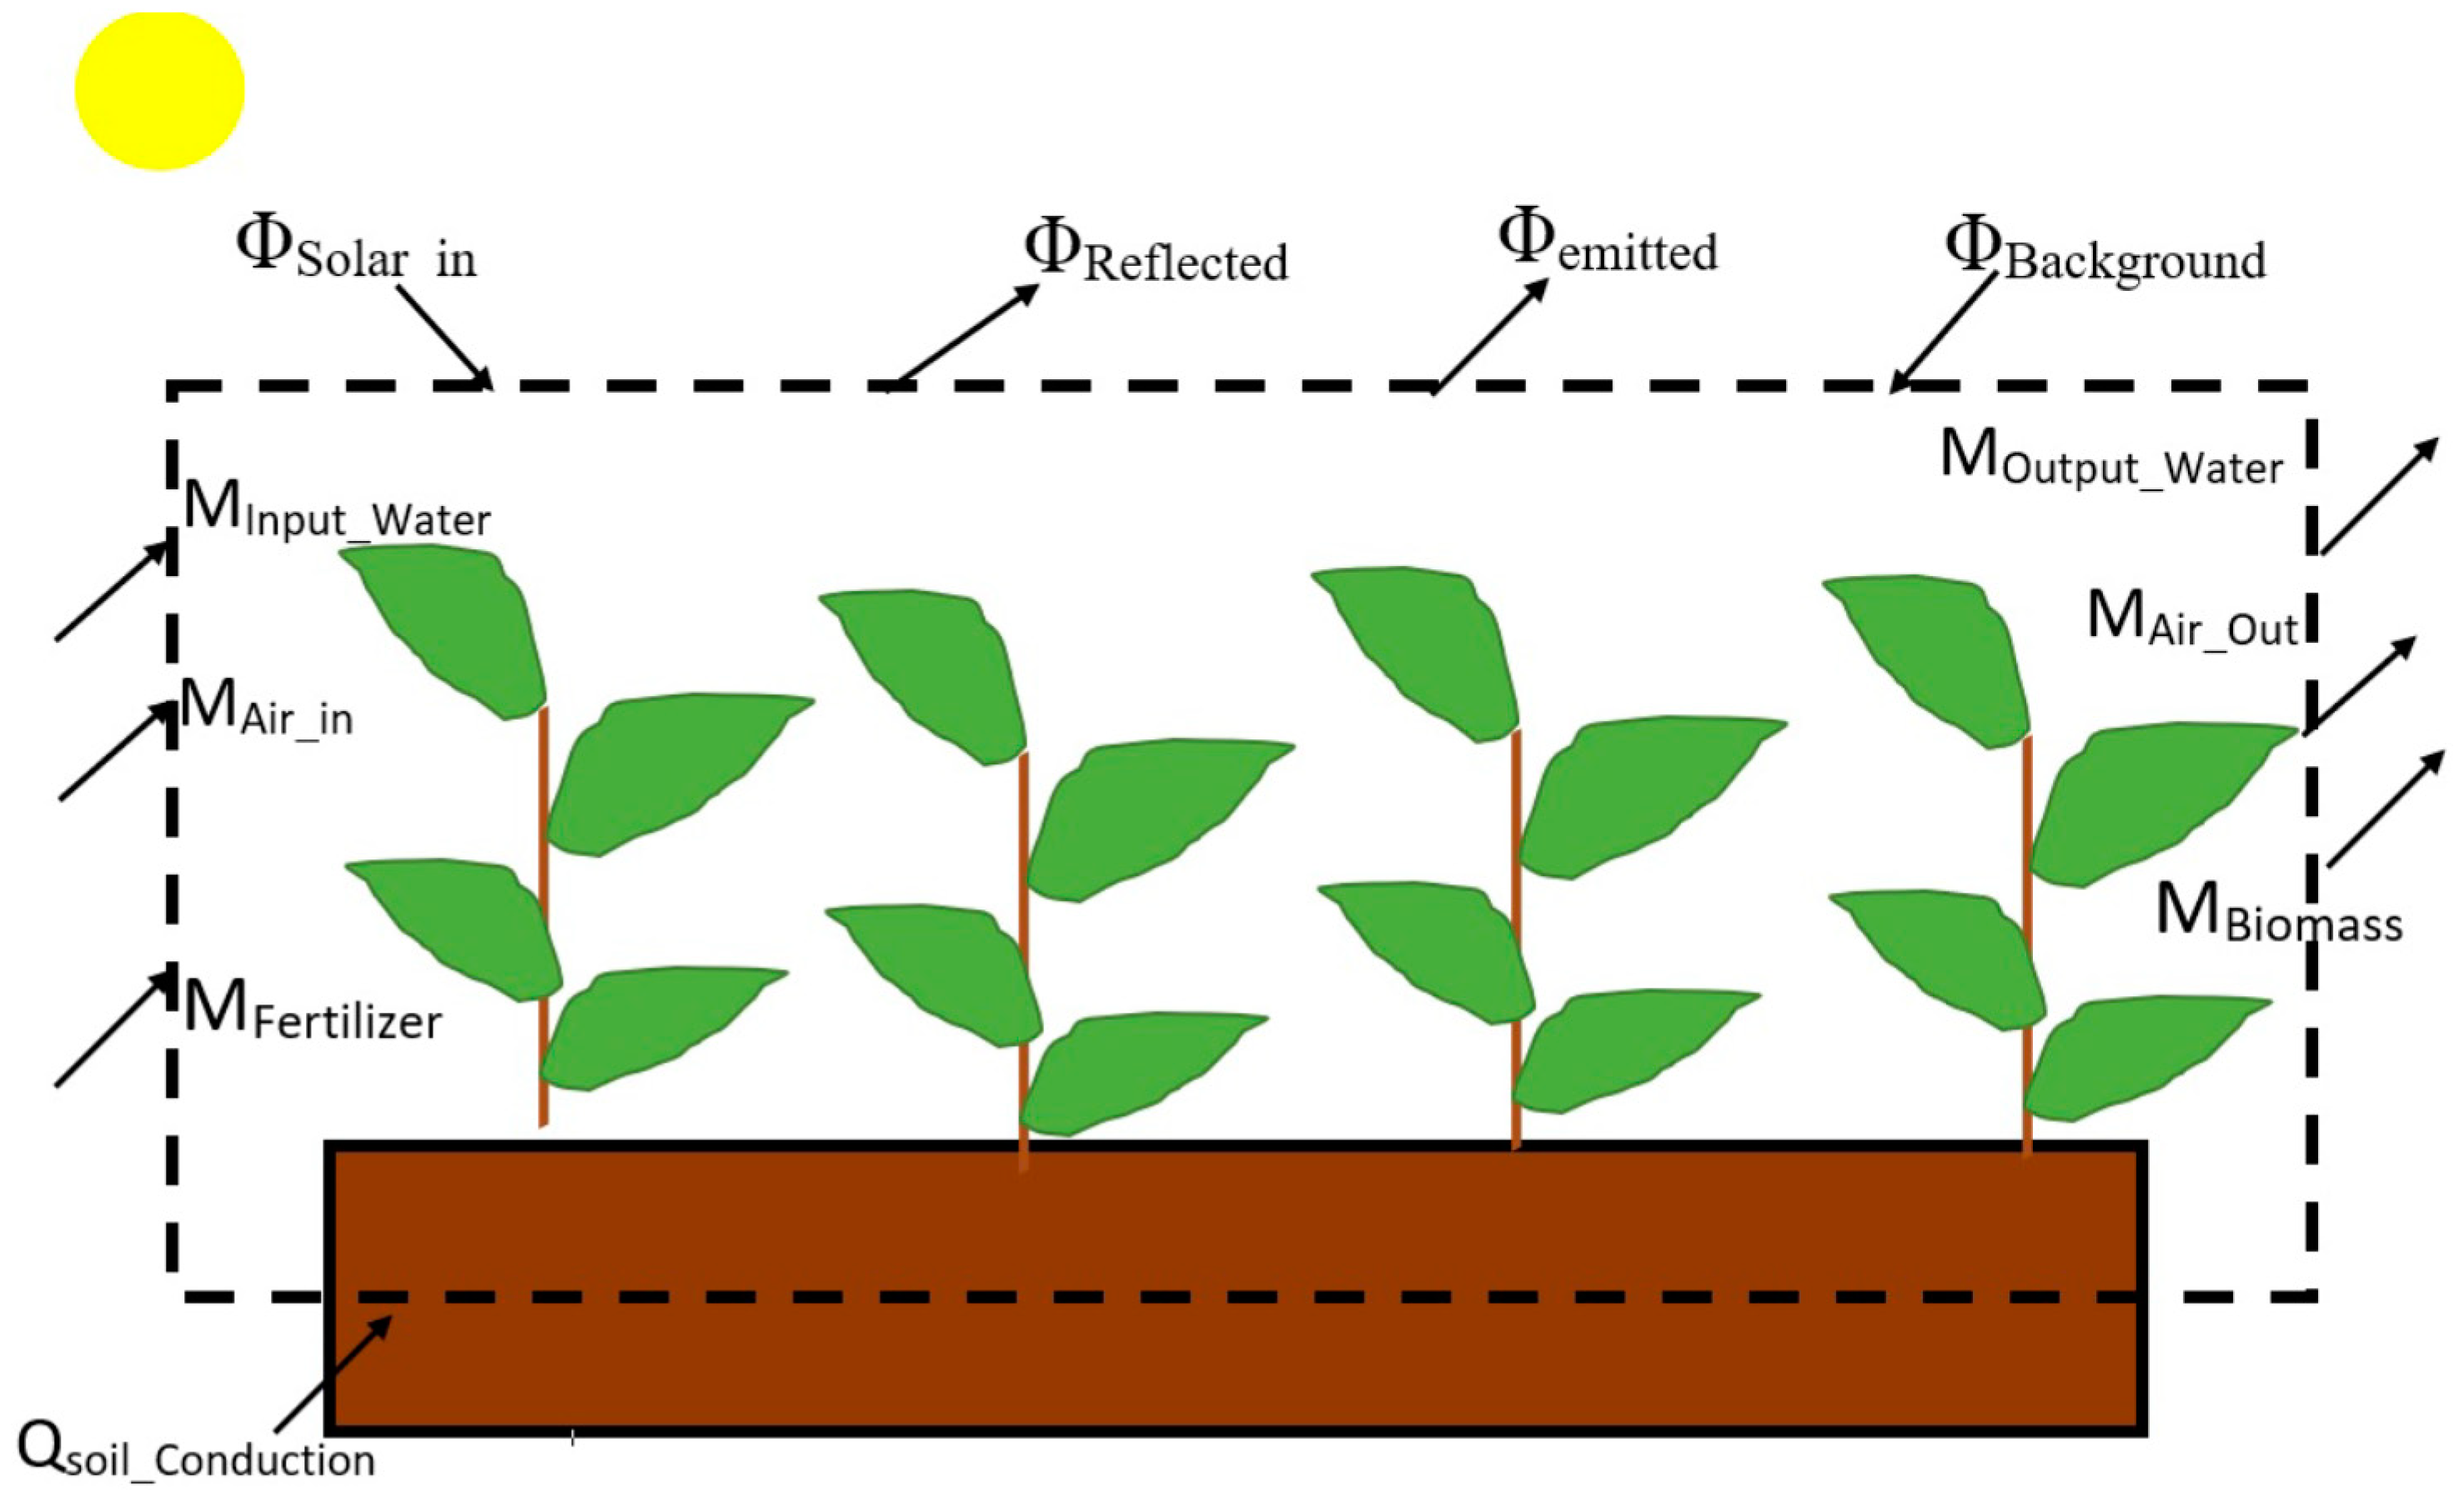
1.3. Energy and Exergy Analysis Applied to a Crop Plant System
2. Materials and Methods
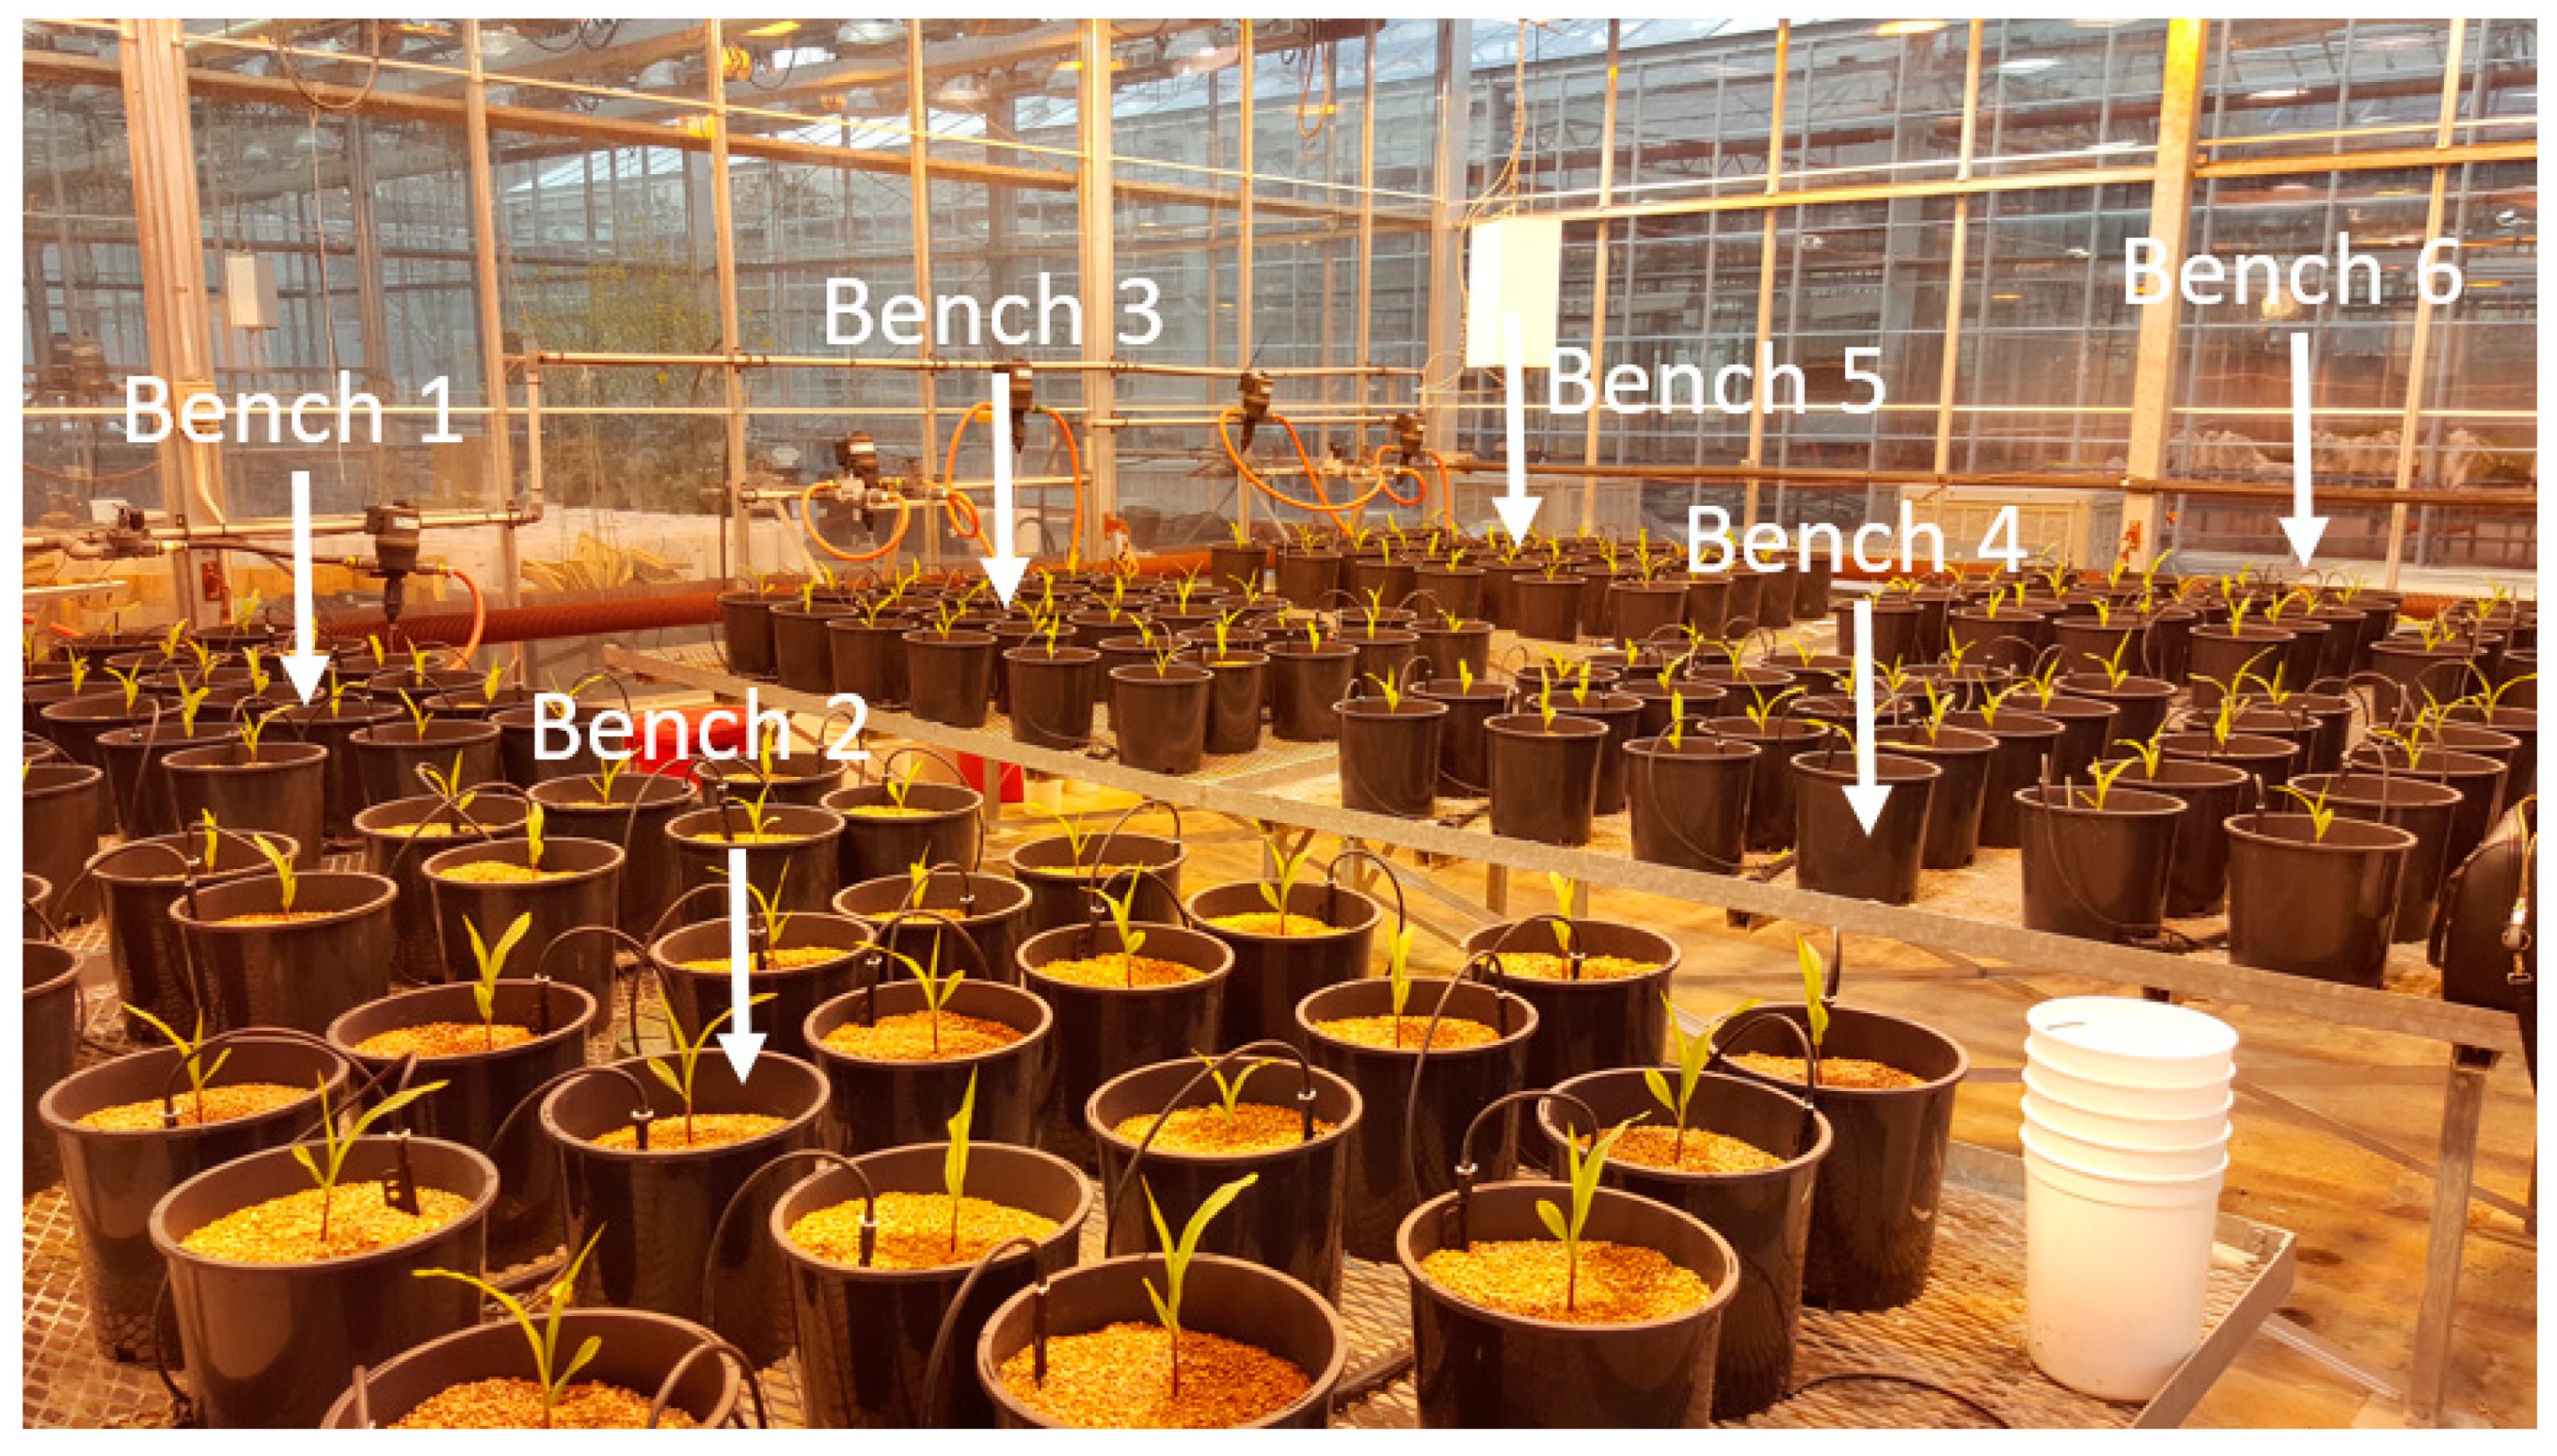
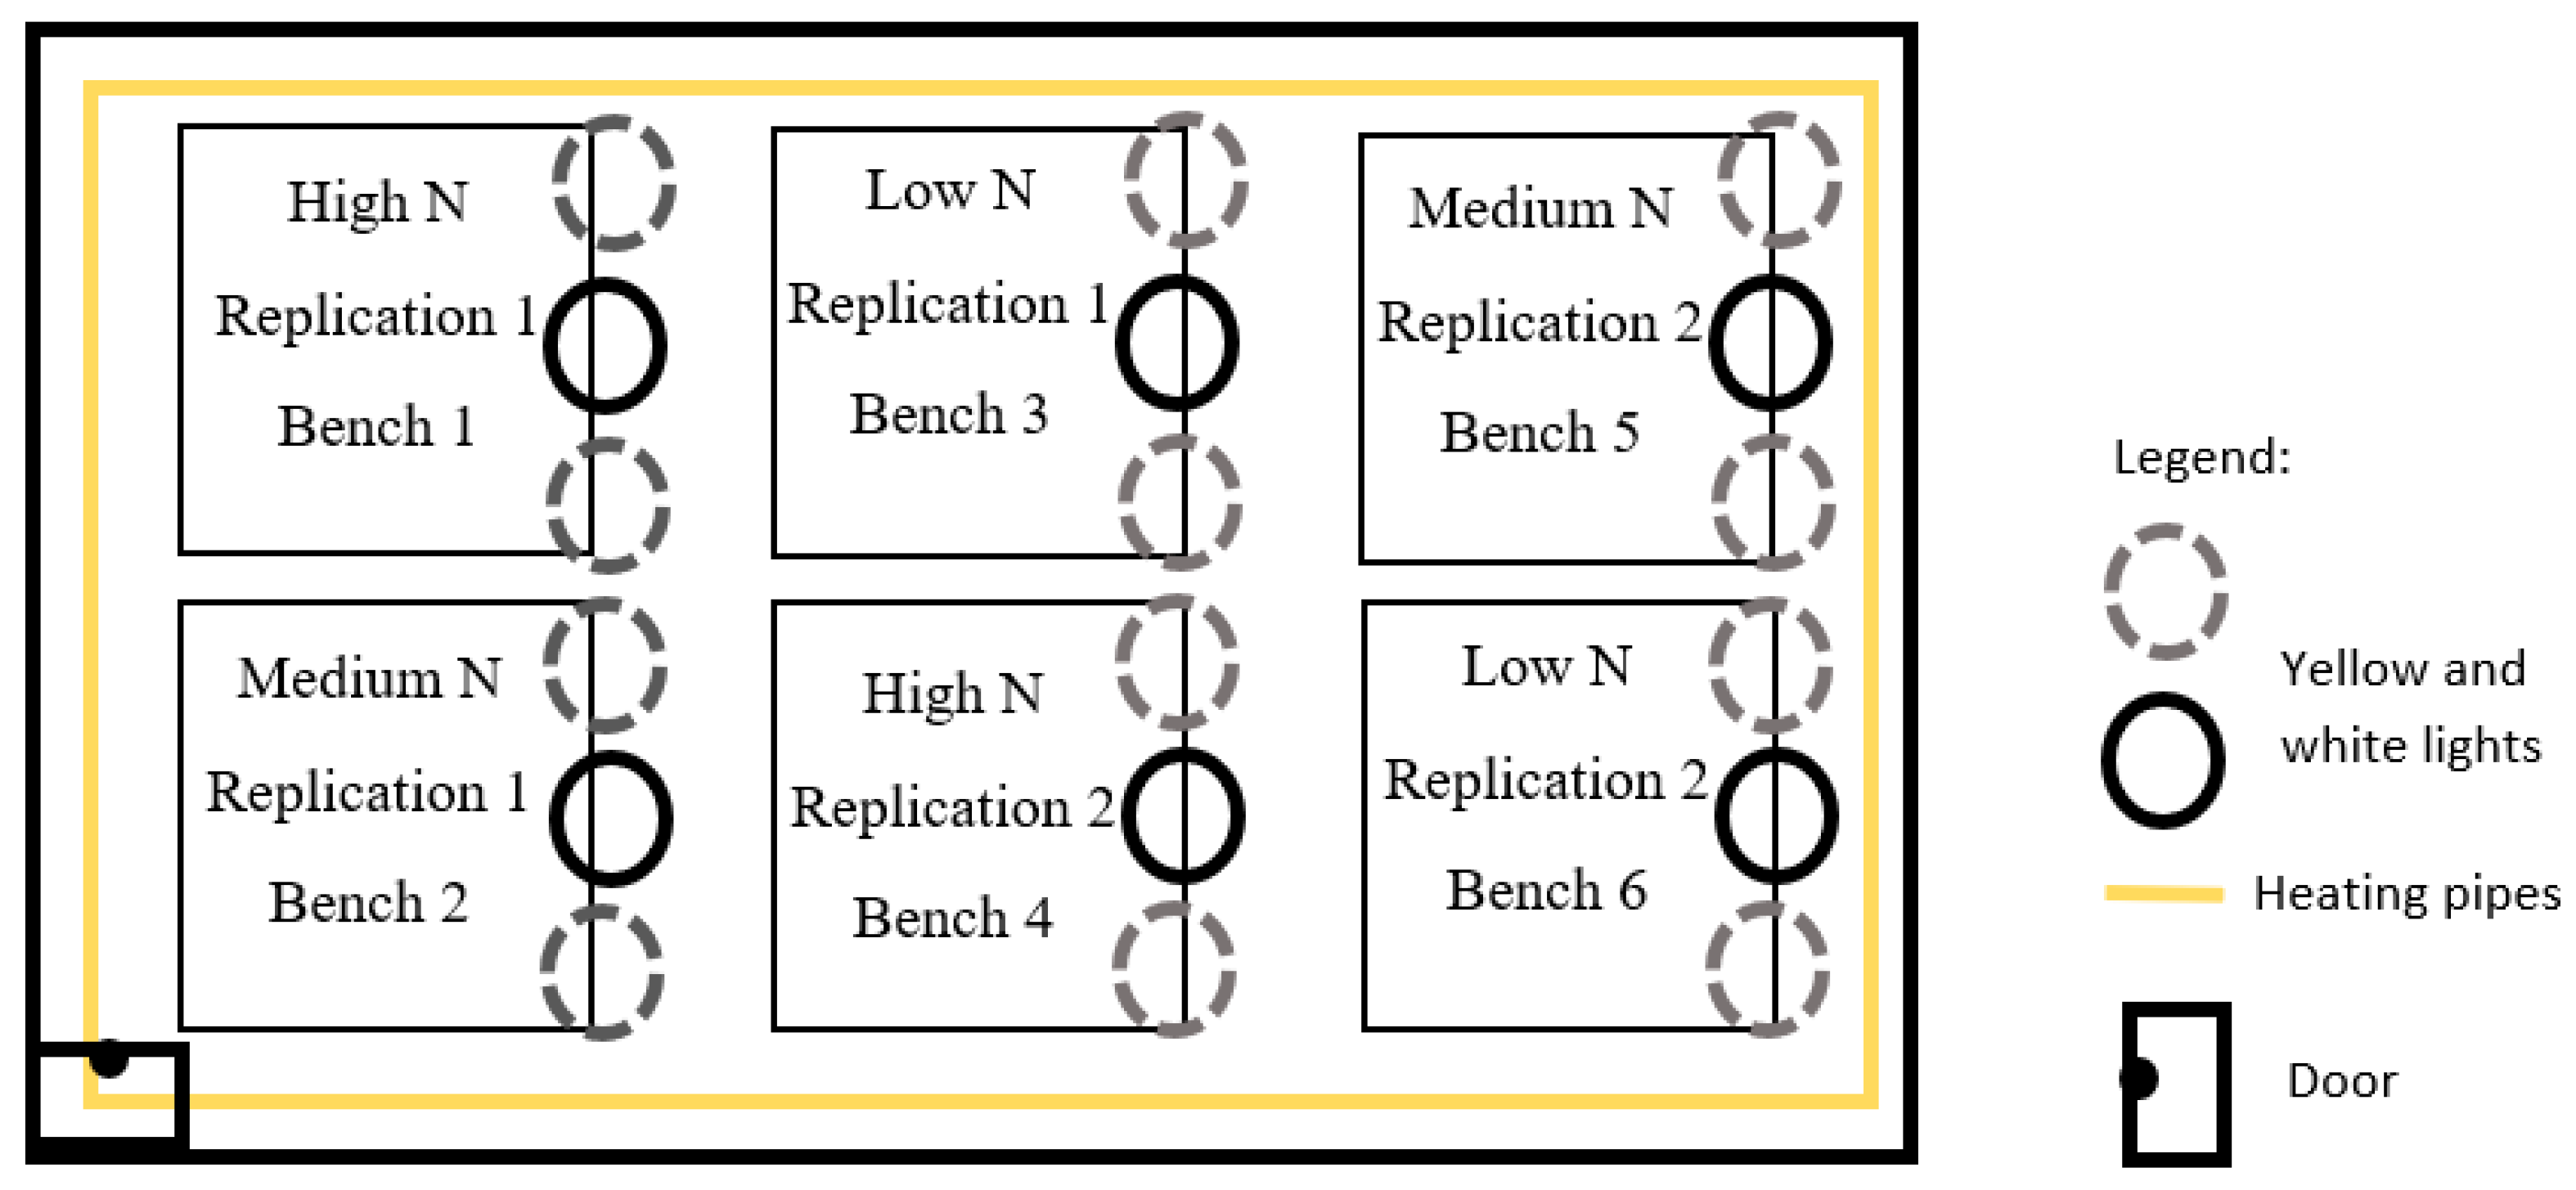
2.1. Experimental Design
2.2. Thermal Image Acquisition and Processing
2.3. Data Analysis
3. Results
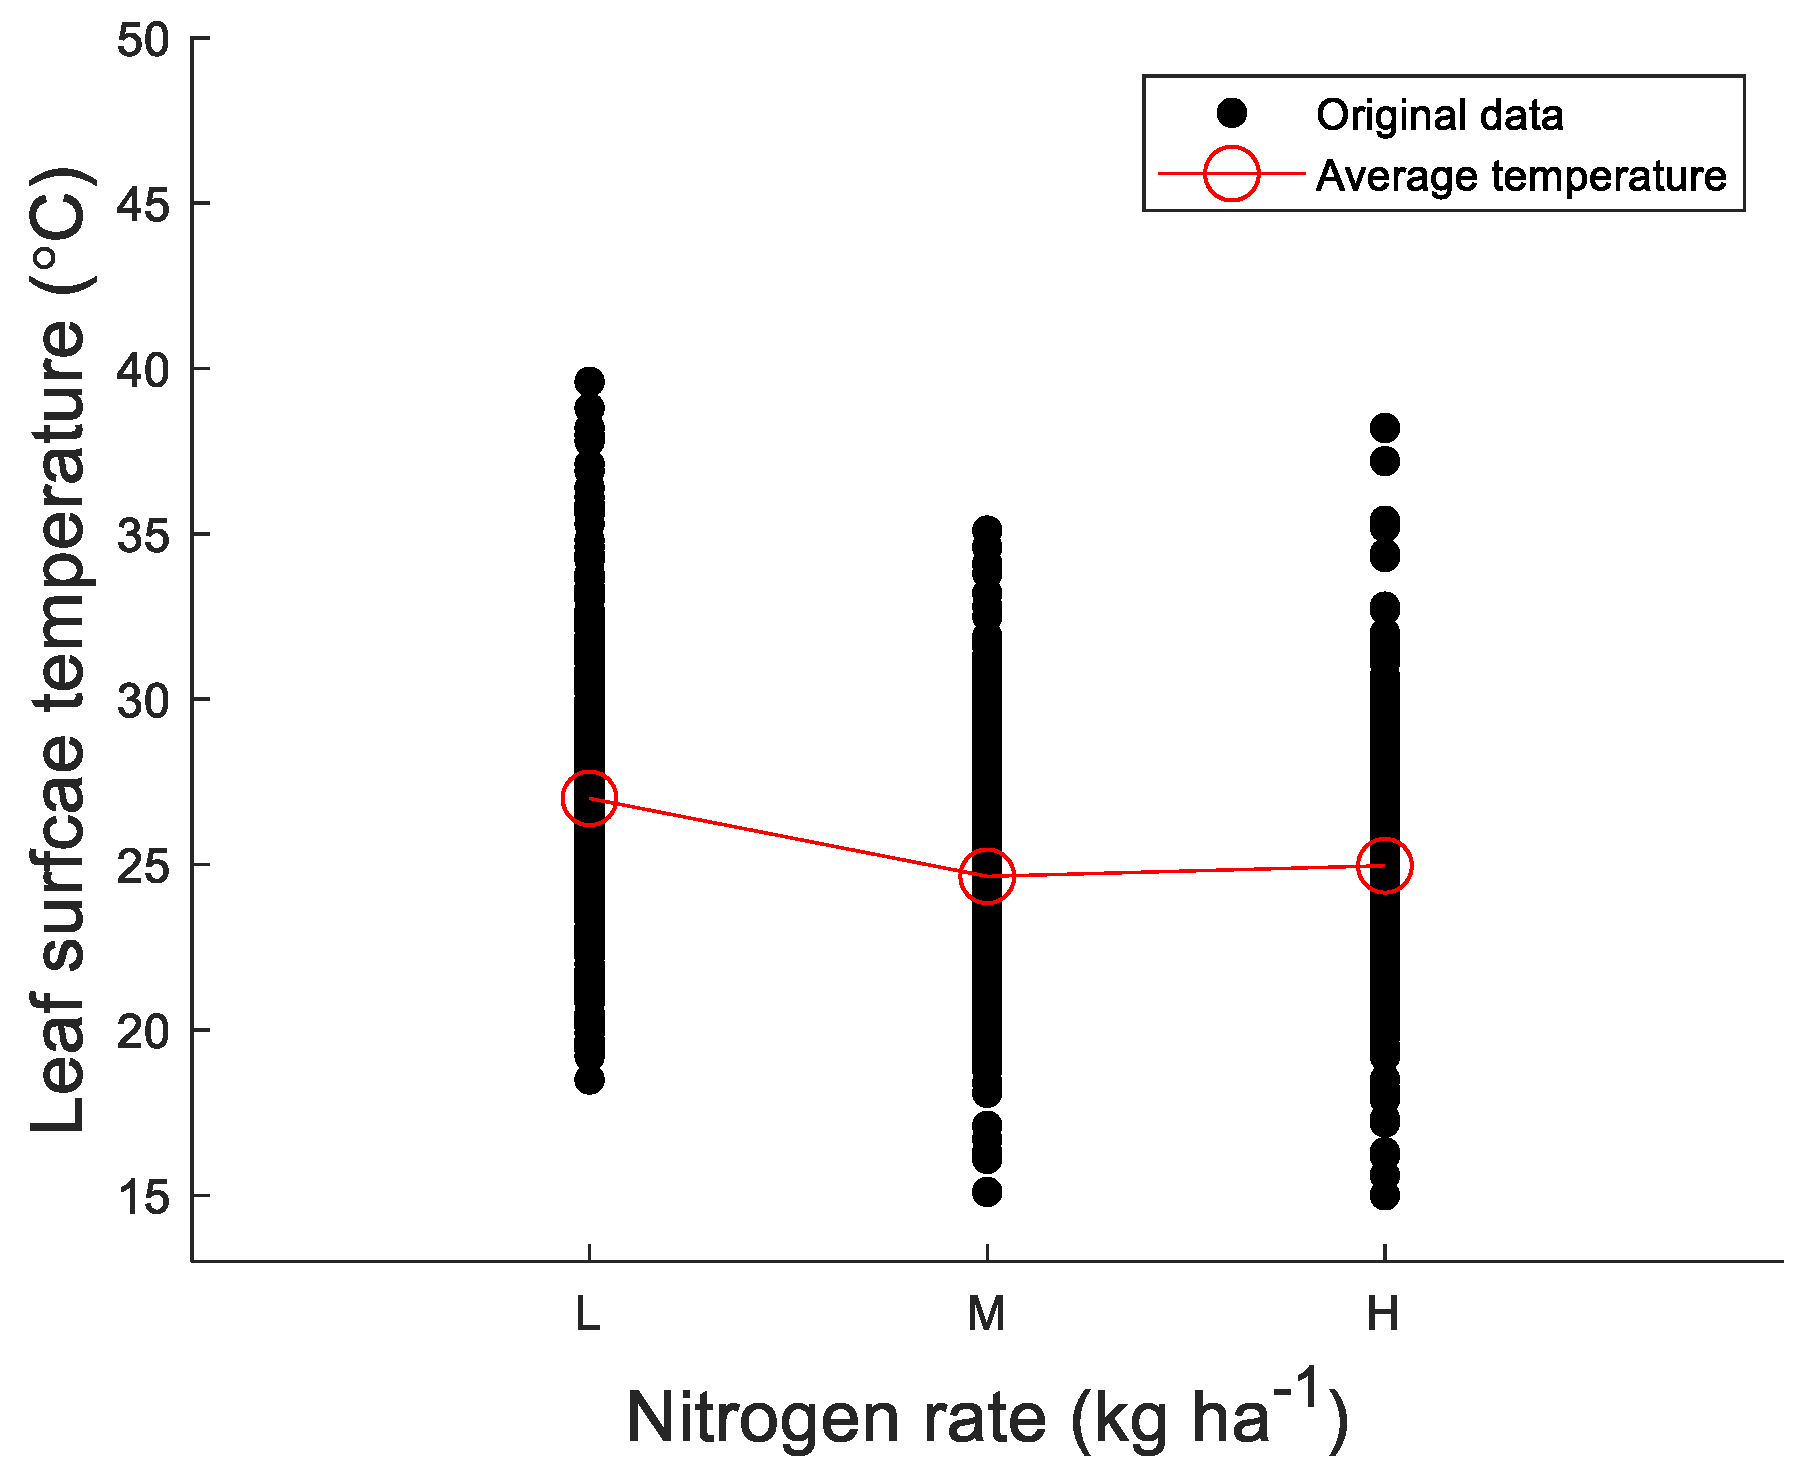
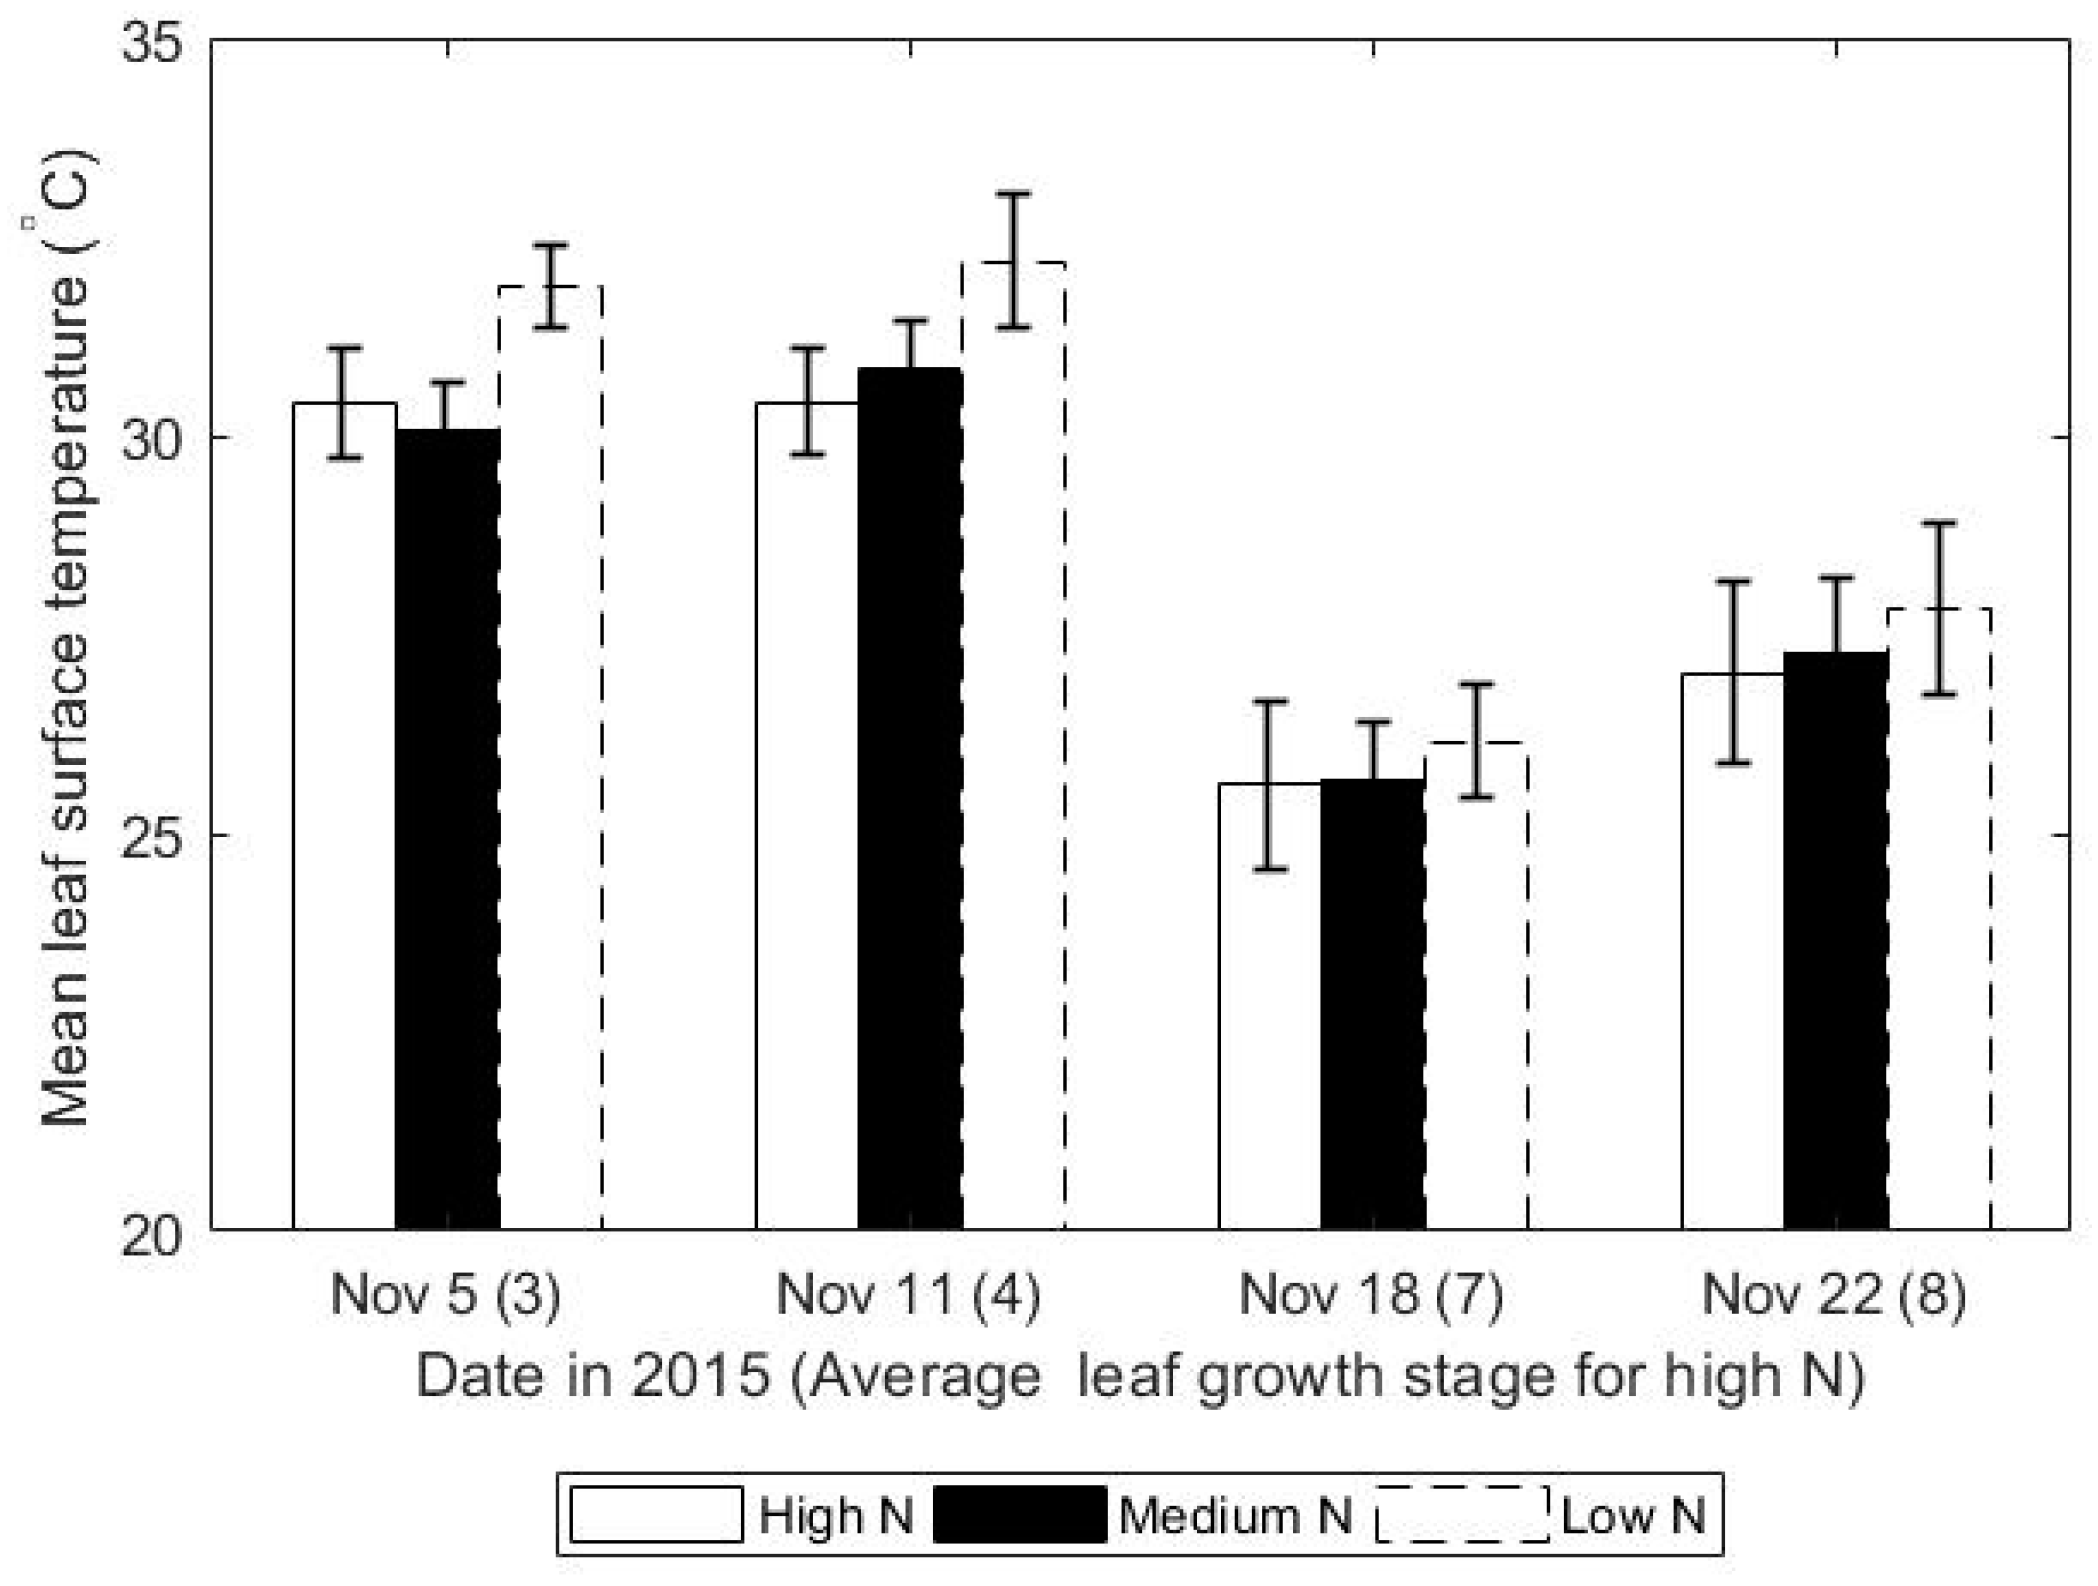
3.1. Leaf Surface Temperature Decreased with Increasing Rates of Nitrogen
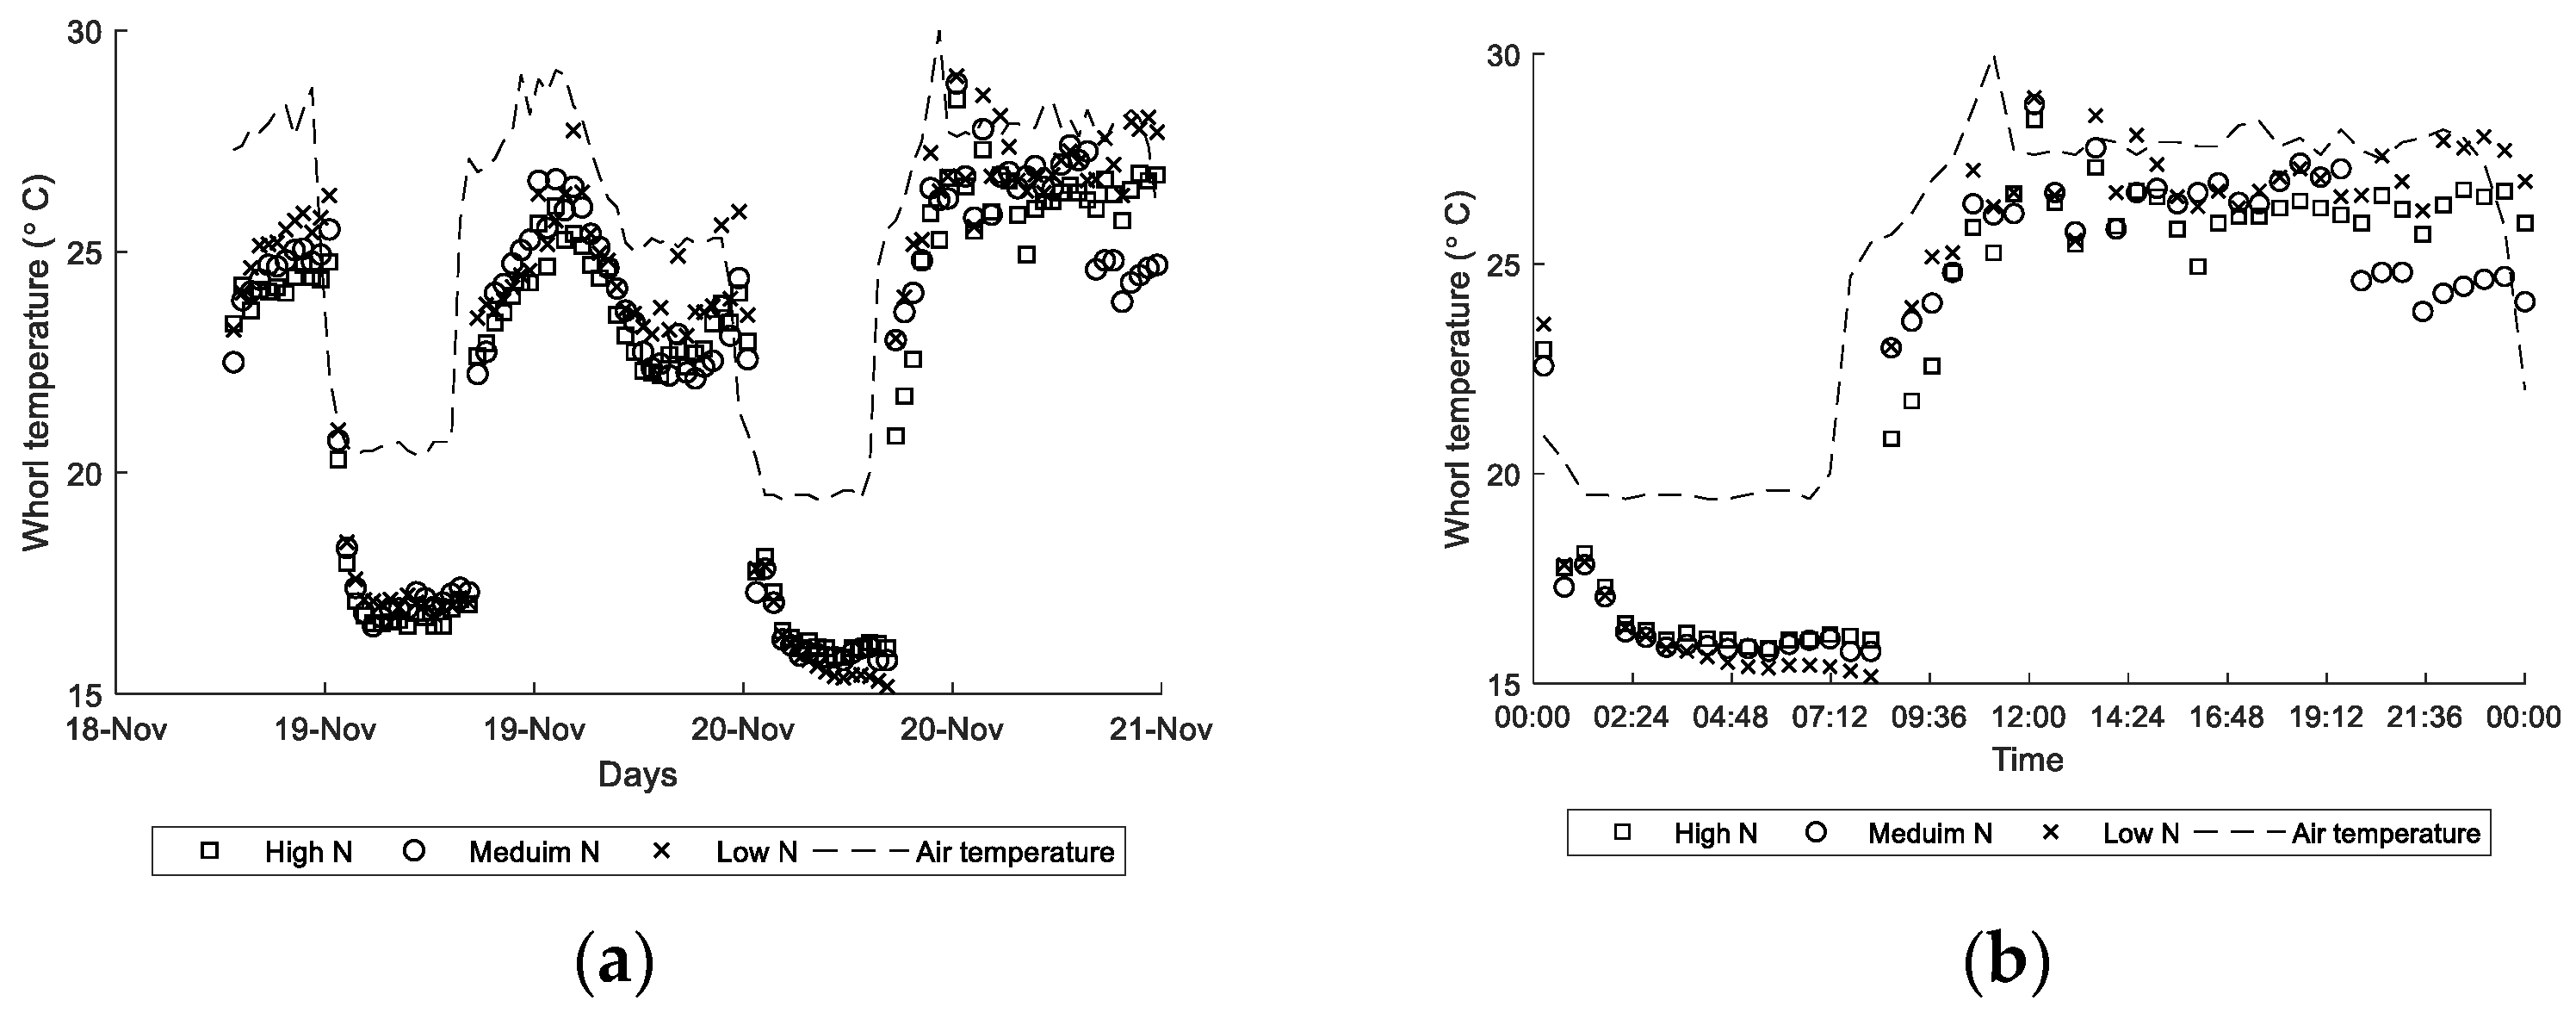
3.2. Whorl Temperature Variation between Day and Night
3.3. Biomass Increased with Increasing Rates of Nitrogen and Leaf Surface Temperature Decreased
4. Discussion
5. Conclusions
Author Contributions
Funding
Institutional Review Board Statement
Informed Consent Statement
Data Availability Statement
Acknowledgments
Conflicts of Interest
References
- Leff, B.; Ramankutty, N.; Foley, J.A. Geographic distribution of major crops across the world. Glob. Biogeochem. Cycles 2004, 18. [Google Scholar] [CrossRef]
- Subedi, K.D.; Ma, B.L. Assessment of some major yield-limiting factors on maize production in a humid temperate environment. Field Crops Res. 2009, 110, 21–26. [Google Scholar] [CrossRef]
- Verma, D.; Pareek, N. Study of Broiling effect on Nutritional Quality and Phytochemical Content in Sweet Corn. Int. J. Environ. Rehabil. Conserv. 2018, 158–188. [Google Scholar] [CrossRef]
- Serna-Saldivar, S.O.; Carrillo, E.P. Food uses of whole corn and dry-milled fractions. In Corn; AACC International Press: St. Paul, MN, USA, 2019; pp. 435–467. [Google Scholar]
- Shapiro, C.A.; Wortmann, C.S. Corn response to nitrogen rate, row spacing, and plant density in eastern Nebraska. Agron. J. 2006, 98, 529–535. [Google Scholar] [CrossRef] [Green Version]
- Montezano, Z.F.; Corazza, E.J.; Muraoka, T. Variabilidade de nutrientes em plantas de milho cultivado em talhão manejado homogeneamente. Bragantia 2008, 67, 969–976. [Google Scholar] [CrossRef] [Green Version]
- Blackmer, T.M.; Schepers, J.S. Aerial photography to detect nitrogen stress in corn. J. Plant Physiol. 1996, 148, 440–444. [Google Scholar] [CrossRef]
- Meyer, J. Sugarcane nutrition and fertilization. In Good Management Practices Manual for the Cane Sugar Industry; Meyer, J., Ed.; The International Finance Corporation (IFC): Johannesburg, South Africa, 2011; pp. 173–226. [Google Scholar]
- Ni, Z.; Liu, Z.; Huo, H.; Li, Z.L.; Nerry, F.; Wang, Q.; Li, X. Early water stress detection using leaf-level measurements of chlorophyll fluorescence and temperature data. Remote Sens. 2015, 7, 3232–3249. [Google Scholar] [CrossRef] [Green Version]
- Rhezali, A.; Lahlali, R. Nitrogen (N) mineral nutrition and imaging sensors for determining N status and requirements of maize. J. Imaging 2017, 3, 51. [Google Scholar] [CrossRef] [Green Version]
- Bongiovanni, R.; Lowenberg-DeBoer, J. Precision agriculture and sustainability. Precis. Agric. 2004, 5, 359–387. [Google Scholar] [CrossRef]
- Valentin, A.S.R.; Horstrand, P.; López, J.F.; López, S. Setting up an autonomous hyperspectral flying platform for precision agriculture. In High-Performance Computing in Geoscience and Remote Sensing, International Society for Optics and Photonics; SPIE: Berlin, Germany, 2018; Volume 10792, p. 1079206. [Google Scholar]
- Muñoz-Huerta, R.F.; Guevara-Gonzalez, R.G.; Contreras-Medina, L.M.; Torres-Pacheco, I.; Prado-Olivarez, J.; Ocampo-Velazquez, R.V. A review of methods for sensing the nitrogen status in plants: Advantages, disadvantages and recent advances. Sensors 2013, 13, 10823–10843. [Google Scholar] [CrossRef]
- Paleari, L.; Movedi, E.; Vesely, F.M.; Thoelke, W.; Tartarini, S.; Foi, M.; Confalonieri, R. Estimating crop nutritional status using smart apps to support nitrogen fertilization. A case study on paddy rice. Sensors 2019, 19, 981. [Google Scholar] [CrossRef] [PubMed] [Green Version]
- Xiong, D.; Chen, J.; Yu, T.; Gao, W.; Ling, X.; Li, Y.; Huang, J. SPAD-based leaf nitrogen estimation is impacted by environmental factors and crop leaf characteristics. Sci. Rep. 2015, 5, 13389. [Google Scholar] [CrossRef] [PubMed] [Green Version]
- Zhang, J.; Blackmer, A.M.; Blackmer, T.M. Reliability of chlorophyll meter measurements prior to corn silking as affected by the leaf change problem. Commun. Soil Sci. Plant Anal. 2009, 40, 2087–2093. [Google Scholar] [CrossRef]
- Maes, W.H.; Steppe, K. Perspectives for remote sensing with unmanned aerial vehicles in precision agriculture. Trends Plant Sci. 2019, 24, 152–164. [Google Scholar] [CrossRef] [PubMed]
- Jackson, R.D.; Idso, S.B.; Reginato, R.J.; Pinter, P.J., Jr. Canopy temperature as a crop water stress indicator. Water Resour. Res. 1981, 17, 1133–1138. [Google Scholar] [CrossRef]
- Abraham, N.; Hema, P.S.; Saritha, E.K.; Subramannian, S. Irrigation automation based on soil electrical conductivity and leaf temperature. Agric. Water Manag. 2000, 45, 145–157. [Google Scholar] [CrossRef]
- Jones, H.G.; Rotenberg, E. Energy, radiation and temperature regulation in plants. In eLS; Wiley: New York, NY, USA, 2001. [Google Scholar]
- Unkovich, M.; Baldock, J.; Farquharson, R. Field measurements of bare soil evaporation and crop transpiration, and transpiration efficiency, for rainfed grain crops in Australia—A review. Agric. Water Manag. 2018, 205, 72–80. [Google Scholar] [CrossRef]
- Kokin, E.; Palge, V.; Pennar, M.; Jürjenson, K. Strawberry leaf surface temperature dynamics measured by thermal camera in night frost conditions. Agron. Res. 2018, 16. [Google Scholar] [CrossRef]
- Cangel, Y.A.; Boles, M.A. Thermodynamics: An Engineering Approach, 4th ed.; McGraw-Hill: Singapore, 2002. [Google Scholar]
- Fraser, R.; Kay, J.J. Exergy analysis of ecosystems: Establishing a role for thermal remote sensing. In Thermal Remote Sensing in Land Surface Processing; Taylor and Francis: London, UK, 2004; pp. 283–360. [Google Scholar]
- Kotas, T.J. The Exergy Method of Thermal Plant Analysis; Elsevier: Amsterdam, The Netherlands, 2013. [Google Scholar]
- Cornelissen, R. Thermodynamics and Sustainable Development: The Use of Exergy Analysis and the Reduction of Irreversibility. Ph.D. Thesis, University of Groningen, Groningen, The Netherland, 1999. [Google Scholar]
- Cornelissen, R.L.; Hirs, G. The value of the exergetic life cycle assessment besides the LCA. Energy Convers. Manag. 2002, 43, 1417–1424. [Google Scholar] [CrossRef]
- Wall, G. Exergy a useful concept within resource accounting. In Chalmers Tekniska Högskola; Göteborgs Universitet: Gothenburg, Sweden, 1977. [Google Scholar]
- Wall, G. Exergy conversion in the Swedish society. Resour. Energy Econ. 1987, 9, 55–73. [Google Scholar] [CrossRef] [Green Version]
- Wall, G. Exergy conversion in the Japanese society. Energy 1990, 15, 435–444. [Google Scholar] [CrossRef]
- Kay, J.J.; Schneider, E.D. Thermodynamics and measures of ecological integrity. In Ecological Indicators; Springer: Boston, MA, USA, 1992; pp. 159–182. [Google Scholar]
- Schneider, E.D.; Kay, J.J. Complexity and thermodynamics: Towards a new ecology. Futures 1994, 26, 626–647. [Google Scholar] [CrossRef]
- Schneider, E.D.; Kay, J.J. Life as a manifestation of the second law of thermodynamics. Math. Comput. Model. 1994, 19, 25–48. [Google Scholar] [CrossRef]
- Schrodinger, E. What Is Life?: With Mind and Matter and Autobiographical Sketches; Cambridge University Press: Cambridge, UK, 2012. [Google Scholar]
- Jørgensen, S.E.; Nielsen, S.N. Application of exergy as thermodynamic indicator in ecology. Energy 2007, 32, 673–685. [Google Scholar] [CrossRef]
- Gong, M.; Wall, G. On exergy and sustainable development-Part 2: Indicators and methods. Exergy Int. J. 2001, 1, 217–233. [Google Scholar] [CrossRef]
- Maes, W.H.; Pashuysen, T.; Trabucco, A.; Veroustraete, F.; Muys, B. Does energy dissipation increase with ecosystem succession? Testing the ecosystem exergy theory combining theoretical simulations and thermal remote sensing observations. Ecol. Model. 2011, 222, 3917–3941. [Google Scholar] [CrossRef]
- Kay, J.J. Ecosystems as self-organizing holarchic open systems: Narratives and the second law of thermodynamics. In Handbook of Ecosystem Theories and Management; Lewis Publishers: Boca Raton, FL, USA, 2000. [Google Scholar]
- Prigogine, I. Etude Thermodynamique des Phe’nome`nes Irre´- Versibles; Desoer: Liege, Belgium, 1947. [Google Scholar]
- Nicolis, G.; Prigogine, I. Exploring Complexity: An Introduction; Freeman: New York, NY, USA, 1989. [Google Scholar]
- Luvall, J.C.; Quattrochi, D.A. Thermal characteristics of urban landscapes. In Proceedings of the 23rd Conference on Agricultural and Forest Meteorology, Albuquerque, NM, USA, 2–6 November 1998. [Google Scholar]
- Luvall, J.C.; Rickman, D.; Fraser, R.F. Thermal remote sensing and the thermodynamics of ecosystem development. In Proceedings of the AGU Fall Meeting 2013, San Francisco, CA, USA, 9–13 December 2013. [Google Scholar]
- Kay, J.J.; Allen, T.; Fraser, R.; Luvall, J.C.; Ulanowicz, R. Can we use energy based indicators to characterize and measure the status of ecosystems, human, disturbed and natural. In Proceedings of the International Workshop: Advances in Energy Studies: Exploring Supplies, Constraints and Strategies, Porto Venere, Italy, 19–21 October 2001; pp. 121–133. [Google Scholar]
- Luvall, J.C.; Holbo, H.R. Measurements of short-term thermal responses of coniferous forest canopies using thermal scanner data. Remote Sens. Environ. 1989, 27, 1–10. [Google Scholar] [CrossRef]
- Luvall, J.C.; Holbo, H.R. Thermal remote sensing methods in landscape ecology. Ecol. Stud. 1991, 82, 127–152. [Google Scholar]
- Quattrochi, D.A.; Luvall, J.C. Thermal infrared remote sensing for analysis of landscape ecological processes: Methods and applications. Landsc. Ecol. 1999, 14, 577–598. [Google Scholar] [CrossRef]
- Quattrochi, D.A.; Luvall, J.C. Thermal Remote Sensing in Land Surface Processing; CRC Press: Boca Raton, FL, USA, 2004. [Google Scholar]
- Lin, H.; Zhang, H.; Song, Q. Transition from abstract thermodynamic concepts to perceivable ecological indicators. Ecol. Indic. 2018, 88, 37–42. [Google Scholar] [CrossRef]
- Holdaway, R.J.; Sparrow, A.D.; Coomes, D.A. Trends in entropy production during ecosystem development in the Amazon Basin. Philos. Trans. R. Soc. B Biol. Sci. 2010, 365, 1437–1447. [Google Scholar] [CrossRef] [PubMed] [Green Version]
- Lawrence, R. Thermal Remote Sensing and the Exergy Destruction Principle Applied to Precision Agriculture. Master’s Thesis, University of Waterloo, Waterloo, ON, Canada, 2016. [Google Scholar]
- Duncan, W.G.; Hatfield, A.L.; Ragland, J.L. The growth and yield of corn II: Daily growth of corn kernels. Agron. J. 1965, 57, 221–223. [Google Scholar] [CrossRef]
- Nunez, R.; Kamprath, E. Relationships between N response, plant population, and row width on growth and yield of corn. Agron. J. 1969, 61, 279–282. [Google Scholar] [CrossRef]
- Finn, J.T. RE Ulanowicz: Growth and development: Ecosystems phenomenology. Behav. Sci. 1988, 33, 158–159. [Google Scholar] [CrossRef]
- Reiniger, P.; Seguin, B. Surface temperature as an indicator of evapotranspiration and soil moisture. Remote Sens. Rev. 1986, 1, 277–310. [Google Scholar] [CrossRef]
- Mamo, M.; Malzer, G.L.; Mulla, D.J.; Huggins, D.R.; Strock, J. Spatial and temporal variation in economically optimum nitrogen rate for corn. Agron. J. 2003, 95, 958–964. [Google Scholar] [CrossRef] [Green Version]
- McDonald, A.; Davies, W.J. Keeping in touch: Responses of the whole plant to deficits. Adv. Bot. Res. 1996, 22, 229. [Google Scholar]
- Reddy, T.Y.; Reddy, V.R.; Anbumozhi, V. Physiological responses of groundnut (Arachis hypogea L.) to drought stress and its amelioration: A critical review. Plant Growth Regul. 2003, 41, 75–88. [Google Scholar] [CrossRef]
- Pirasteh-Anosheh, H.; Saed-Moucheshi, A.; Pakniyat, H.; Pessarakli, M. Stomatal responses to drought stress. Water Stress Crop Plants 2016, 24–40. [Google Scholar] [CrossRef]
- Alzaben, H. Investigating the Exergy Destruction Principle Applied to Precision Agriculture Using Thermal Remote Sensing. Ph.D. Thesis, University of Waterloo, Waterloo, ON, Canada, 2020. [Google Scholar]
- Echarte, L.; Rothstein, S.; Tollenaar, M. The response of leaf photosynthesis and dry matter accumulation to nitrogen supply in an older and a newer maize hybrid. Crop Sci. 2008, 48, 656–665. [Google Scholar] [CrossRef]
- Nelson, J.A.; Bugbee, B. Analysis of environmental effects on leaf temperature under sunlight, high pressure sodium and light emitting diodes. PLoS ONE 2015, 10, e0138930. [Google Scholar] [CrossRef] [PubMed]
- Niklaus, F.; Vieider, C.; Jakobsen, H. MEMS-based uncooled infrared bolometer arrays: A review. In MEMS/MOEMS Technologies and Applications; International Society for Optics and Photonics: San Diego, CA, USA, 2008; Volume 6836, p. 68360D. [Google Scholar]
- Alzaben, H.; Fraser, R.; Swanton, C. An inverse correlation between corn temperature and nitrogen stress: A field case study. Agron. J. 2019, 111, 3207–3219. [Google Scholar] [CrossRef]
- Mury, A. The Light Field in Natural Scenes. Master’s Thesis, University of Delft, Delft, The Netherlands, 2009. [Google Scholar]
- Akbari, M.H. Energy-Based Indicators of Ecosystem Health. Master’s Thesis, University of Guelph, Guelph, ON, Canada, 1996. [Google Scholar]
- Safty, M.E. Use and organization of domestic space in the Arab world. Int. J. Sociol. Fam. 1981, 11, 179–199. [Google Scholar]
- Song, D.; Bhushan, B. Bioinspired triangular patterns for water collection from fog. Philos. Trans. R. Soc. 2019, 377, 20190128. [Google Scholar] [CrossRef] [PubMed] [Green Version]


| For N Control | High N (20 mM) (kg) | Medium N (12 mM) (kg) | Low N (4 mM) (kg) |
|---|---|---|---|
| 34-0-0 | 16.47 | 9.88 | 3.29 |
| HPO4 | 3.74 | 3.74 | 3.74 |
| KHCO3 (0-0-47) | 7.5 | 7.5 | 7.5 |
| MgSO4 7H2O | 8 | 8 | 8 |
| Micronutrient (pH 5.6–6.0) | 0.6 | 0.6 | 0.6 |
| Features | Specifications |
|---|---|
| Resolution | 640 × 480 pixels |
| Temperature range | −40 to 650 °C |
| Spectral range | 7.5–14 μm |
| Thermal sensitivity | <0.04 °C at 30 °C |
| Minimum focus distance | 0.25 m |
| Image frequency (frame rate) | 30 Hz |
| Accuracy | ±2 °C |
| Field of view | 25 × 190 |
| Source | SS a | df b | MS c | Fcalcu d | Fcriti e | p-Value |
|---|---|---|---|---|---|---|
| N rate | 1467 | 2 | 733.34 | 18.16 | 3.02 | 3.46 × 10⁻⁴ |
| Error | 12,598 | 312 | 40.38 | |||
| Total | 14,065 | 314 |
| Date in 2015 | Leaf Tip Stage a | High N b (°C) | Medium N (°C) | Low N (°C) | p-Value c |
|---|---|---|---|---|---|
| 3 November | 29.63 ± 2.76 | 26.82 ± 3.1 | 29.13 ± 2.06 | 0.003 | |
| 5 November | 3 | 27.89 ± 1.82 | 27.59 ± 2.37 | 28.96 ± 2.09 | 0.057 |
| 6 November | 3 | 26.11 ± 1.41 | 25.10 ±1.71 | 29.19 ± 3.25 | <0.001 |
| 9 November | 4 | 25.48 ± 2.59 | 25.55 ± 1.94 | 28.74 ± 3.43 | <0.001 |
| 10 November | 4 | 29.61 ± 3.48 | 30.63 ± 2.45 | 33.81 ± 3.31 | <0.001 |
| 12 November | 5 | 23.10 ± 1.85 | 24.38 ± 2.32 | 25.92 ± 2.07 | <0.001 |
| 13 November | 5 | 23.33 ± 1.25 | 23.44 ± 1.87 | 26.83 ± 1.76 | <0.001 |
| 16 November | 6 | 31.03 ± 2.27 | 27.88 ± 3.04 | 32.25 ± 3.05 | <0.001 |
| 17 November | 7 | 26.10 ± 0.95 | 22.65 ± 2.09 | 25.23 ± 2.93 | <0.001 |
| Date | Leaf Tip Stage | High N (°C) | Medium N (°C) | Low N (°C) | p-Value |
|---|---|---|---|---|---|
| 2015 | |||||
| 5 November | 3 | 30.41 ± 0.68 | 30.08 ± 0.6 | 31.88 ± 0.52 | <0.001 a |
| 11 November | 4 | 30.43 ± 0.45 | 30.82 ± 0.41 | 32.19 ± 0.73 | 0.005 a |
| 18 November | 7 | 25.885 ± 1.46 | 24.33 ± 1.11 | 27.13 ± 1.83 | <0.001 a |
| 22 November | 7 | 25.61 ± 1.06 | 25.69 ± 0.73 | 26.16 ± 0.71 | 0.39 b |
| 24 November | 8 | 27.02 ± 1.31 | 27.28 ± 0.88 | 27.82 ± 1.33 | 0.1 b |
| 2016 | |||||
| 19 January | 3 | 24.45 ± 3.49 | 24.29 ± 2.07 | 25.46 ± 2.06 | 0.13 b |
| 23 January | 4 | 24.93 ± 2.04 | 24.52 ±1.12 | 24.51 ± 1.71 | 0.35 b |
| 29 January | 6 | 23.82 ± 1.75 | 24.44 ± 0.96 | 24.08 ± 1.2 | 0.3 b |
| Experiment No. | Time Period | High N (g) | Medium N (g) | Low N (g) |
|---|---|---|---|---|
| 1 | October–December 2015 | 18.9 ± 3.49 | 11.1 ± 1.92 | 6.5 ± 1.34 |
| 2 | January–February 2016 | 4.4 ± 0.97 | 4.2 ± 1.17 | 3.3 ± 0.61 |
Publisher’s Note: MDPI stays neutral with regard to jurisdictional claims in published maps and institutional affiliations. |
© 2021 by the authors. Licensee MDPI, Basel, Switzerland. This article is an open access article distributed under the terms and conditions of the Creative Commons Attribution (CC BY) license (http://creativecommons.org/licenses/by/4.0/).
Share and Cite
Alzaben, H.; Fraser, R.; Swanton, C. The Role of Engineering Thermodynamics in Explaining the Inverse Correlation between Surface Temperature and Supplied Nitrogen Rate in Corn Plants: A Greenhouse Case Study. Agriculture 2021, 11, 101. https://doi.org/10.3390/agriculture11020101
Alzaben H, Fraser R, Swanton C. The Role of Engineering Thermodynamics in Explaining the Inverse Correlation between Surface Temperature and Supplied Nitrogen Rate in Corn Plants: A Greenhouse Case Study. Agriculture. 2021; 11(2):101. https://doi.org/10.3390/agriculture11020101
Chicago/Turabian StyleAlzaben, Heba, Roydon Fraser, and Clarence Swanton. 2021. "The Role of Engineering Thermodynamics in Explaining the Inverse Correlation between Surface Temperature and Supplied Nitrogen Rate in Corn Plants: A Greenhouse Case Study" Agriculture 11, no. 2: 101. https://doi.org/10.3390/agriculture11020101
APA StyleAlzaben, H., Fraser, R., & Swanton, C. (2021). The Role of Engineering Thermodynamics in Explaining the Inverse Correlation between Surface Temperature and Supplied Nitrogen Rate in Corn Plants: A Greenhouse Case Study. Agriculture, 11(2), 101. https://doi.org/10.3390/agriculture11020101