
Effects of Long-Term Straw Management and Potassium Fertilization on Crop Yield, Soil Properties, and Microbial Community in a Rice–Oilseed Rape Rotation


Abstract
:
1. Introduction
2. Materials and Methods
2.1. Experimental Site Description
2.2. Experimental Design
2.3. Sample Sampling and Determination
2.3.1. Grain Yield
2.3.2. Soil Samples
2.3.3. Determination of Soil Physicochemical Indexes
2.3.4. Soil DNA Extraction and High-Throughput Sequencing Analysis
2.3.5. Sequence Processing
2.4. Statistical Analysis
3. Results
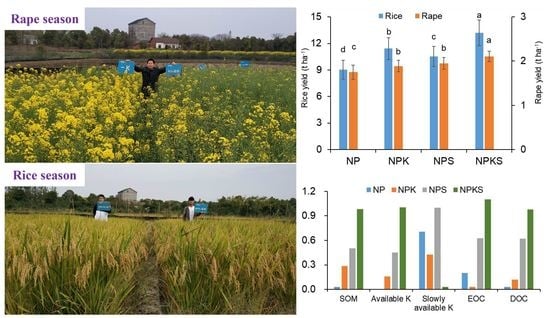
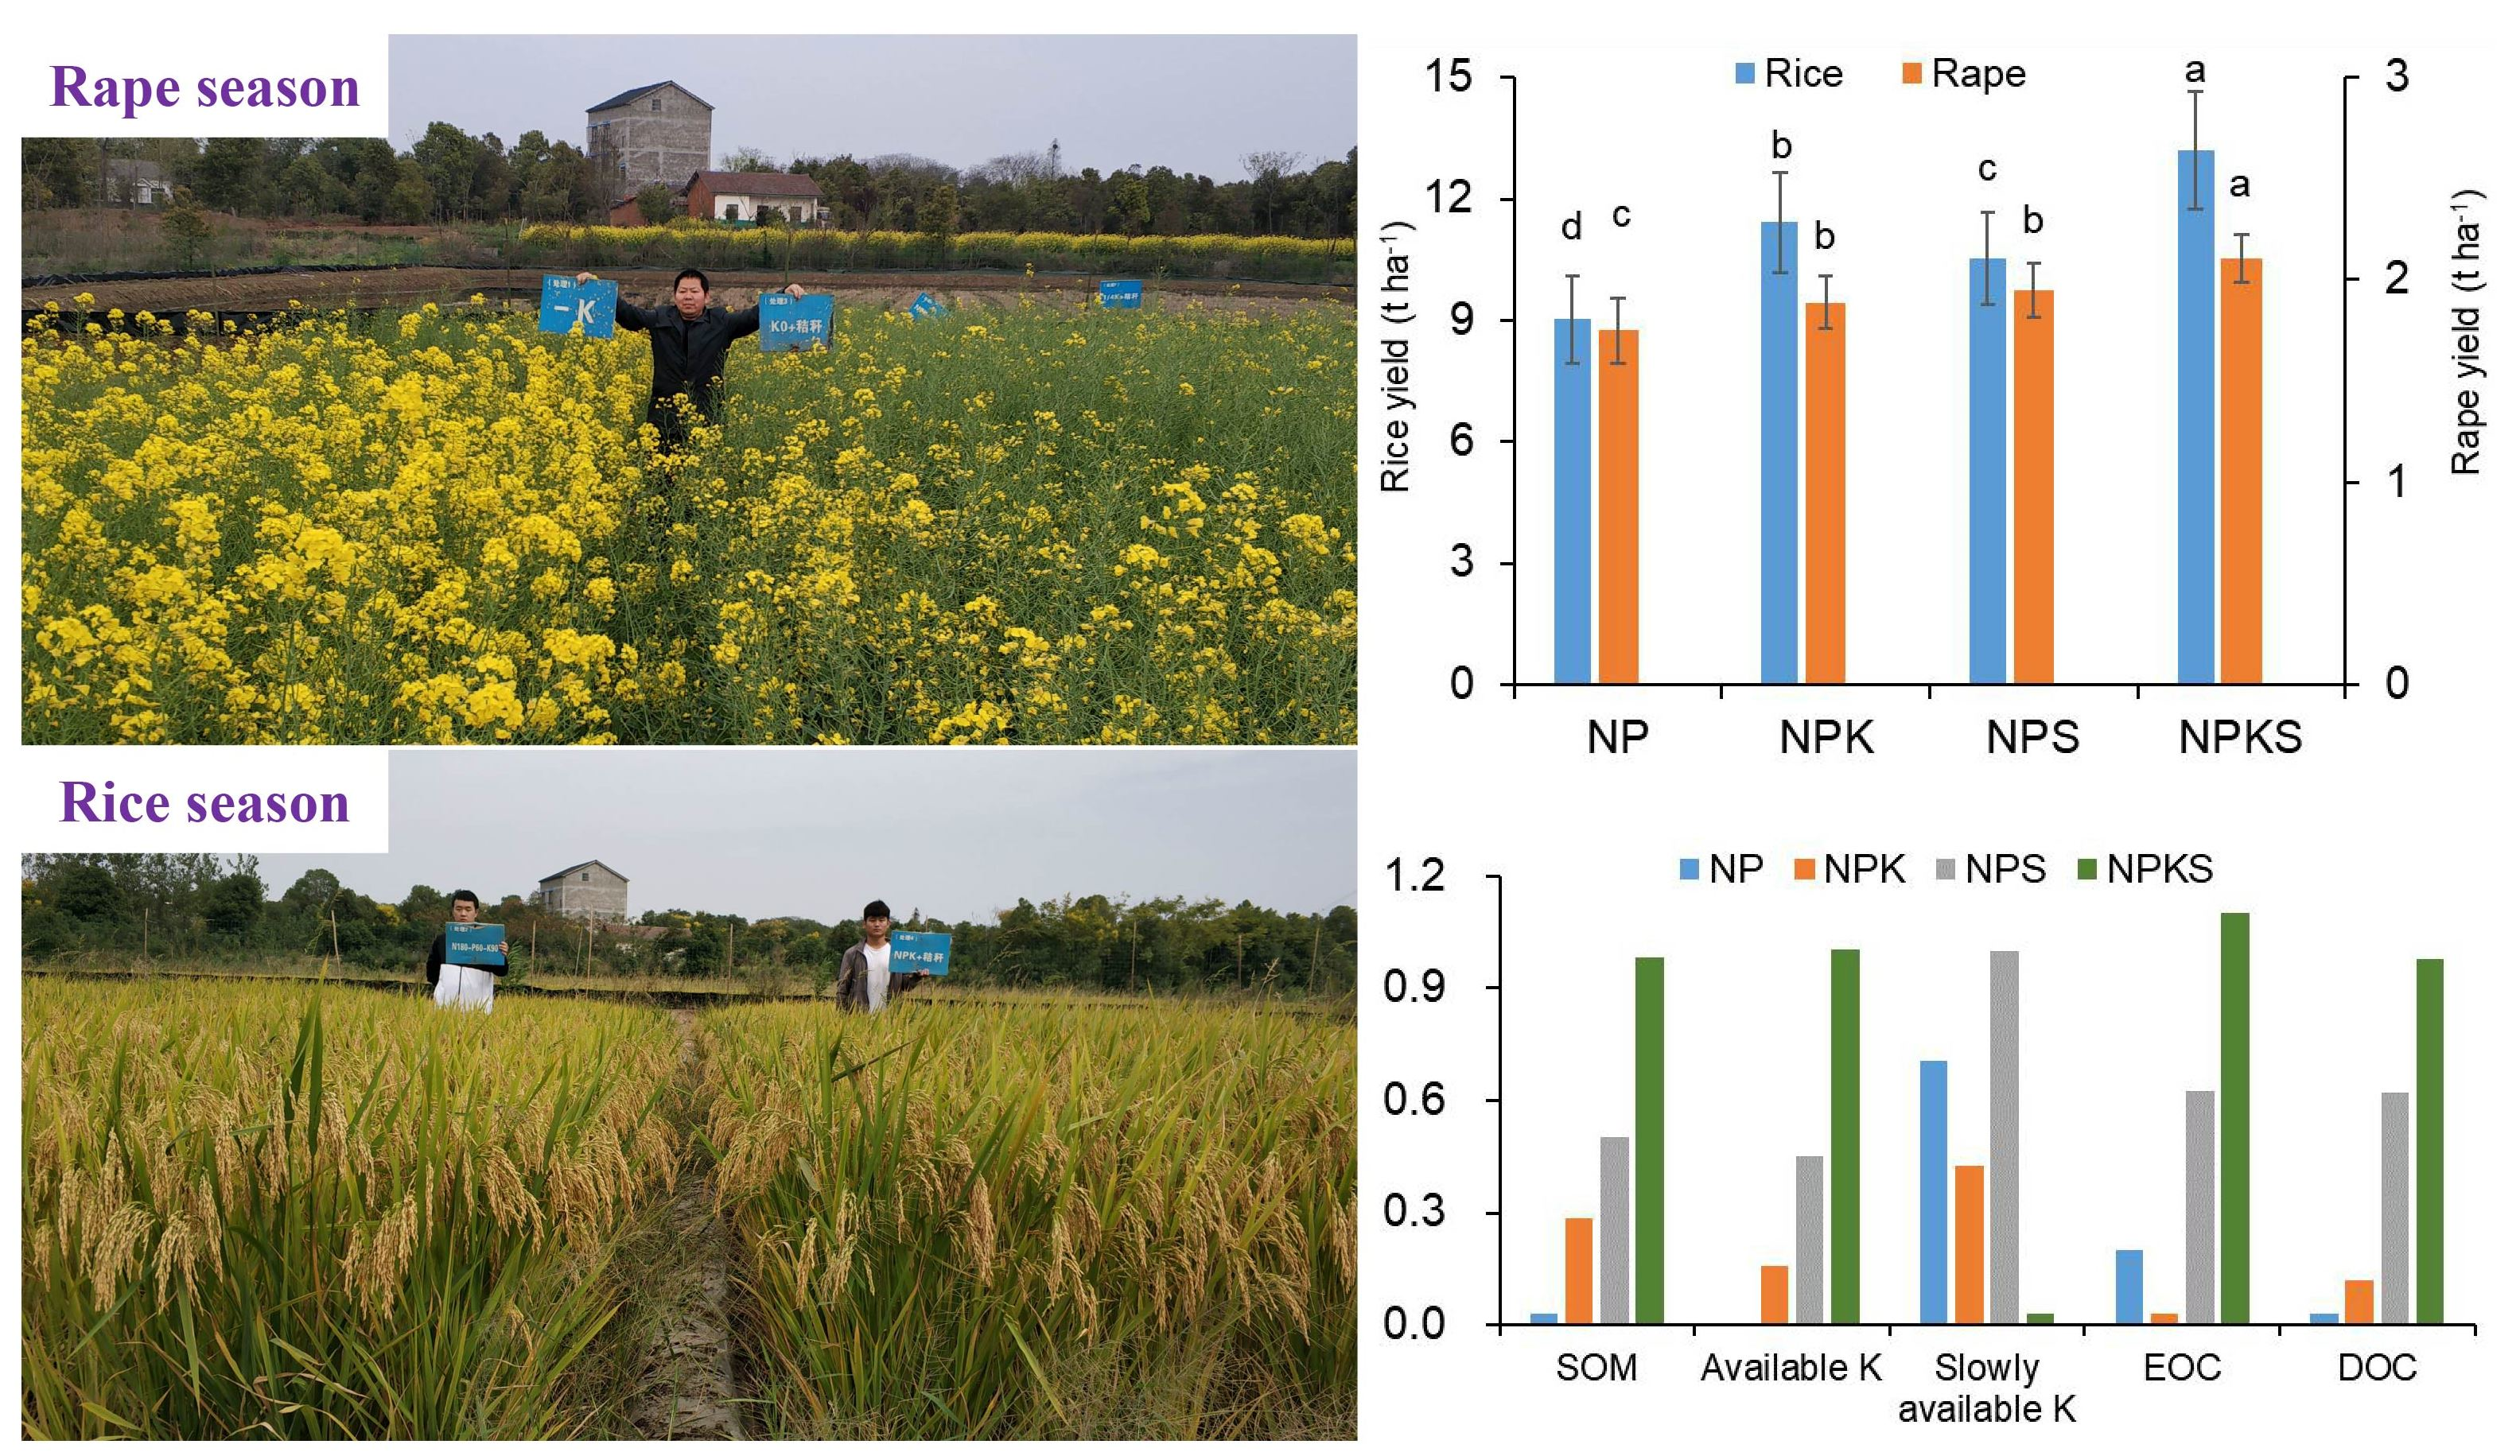
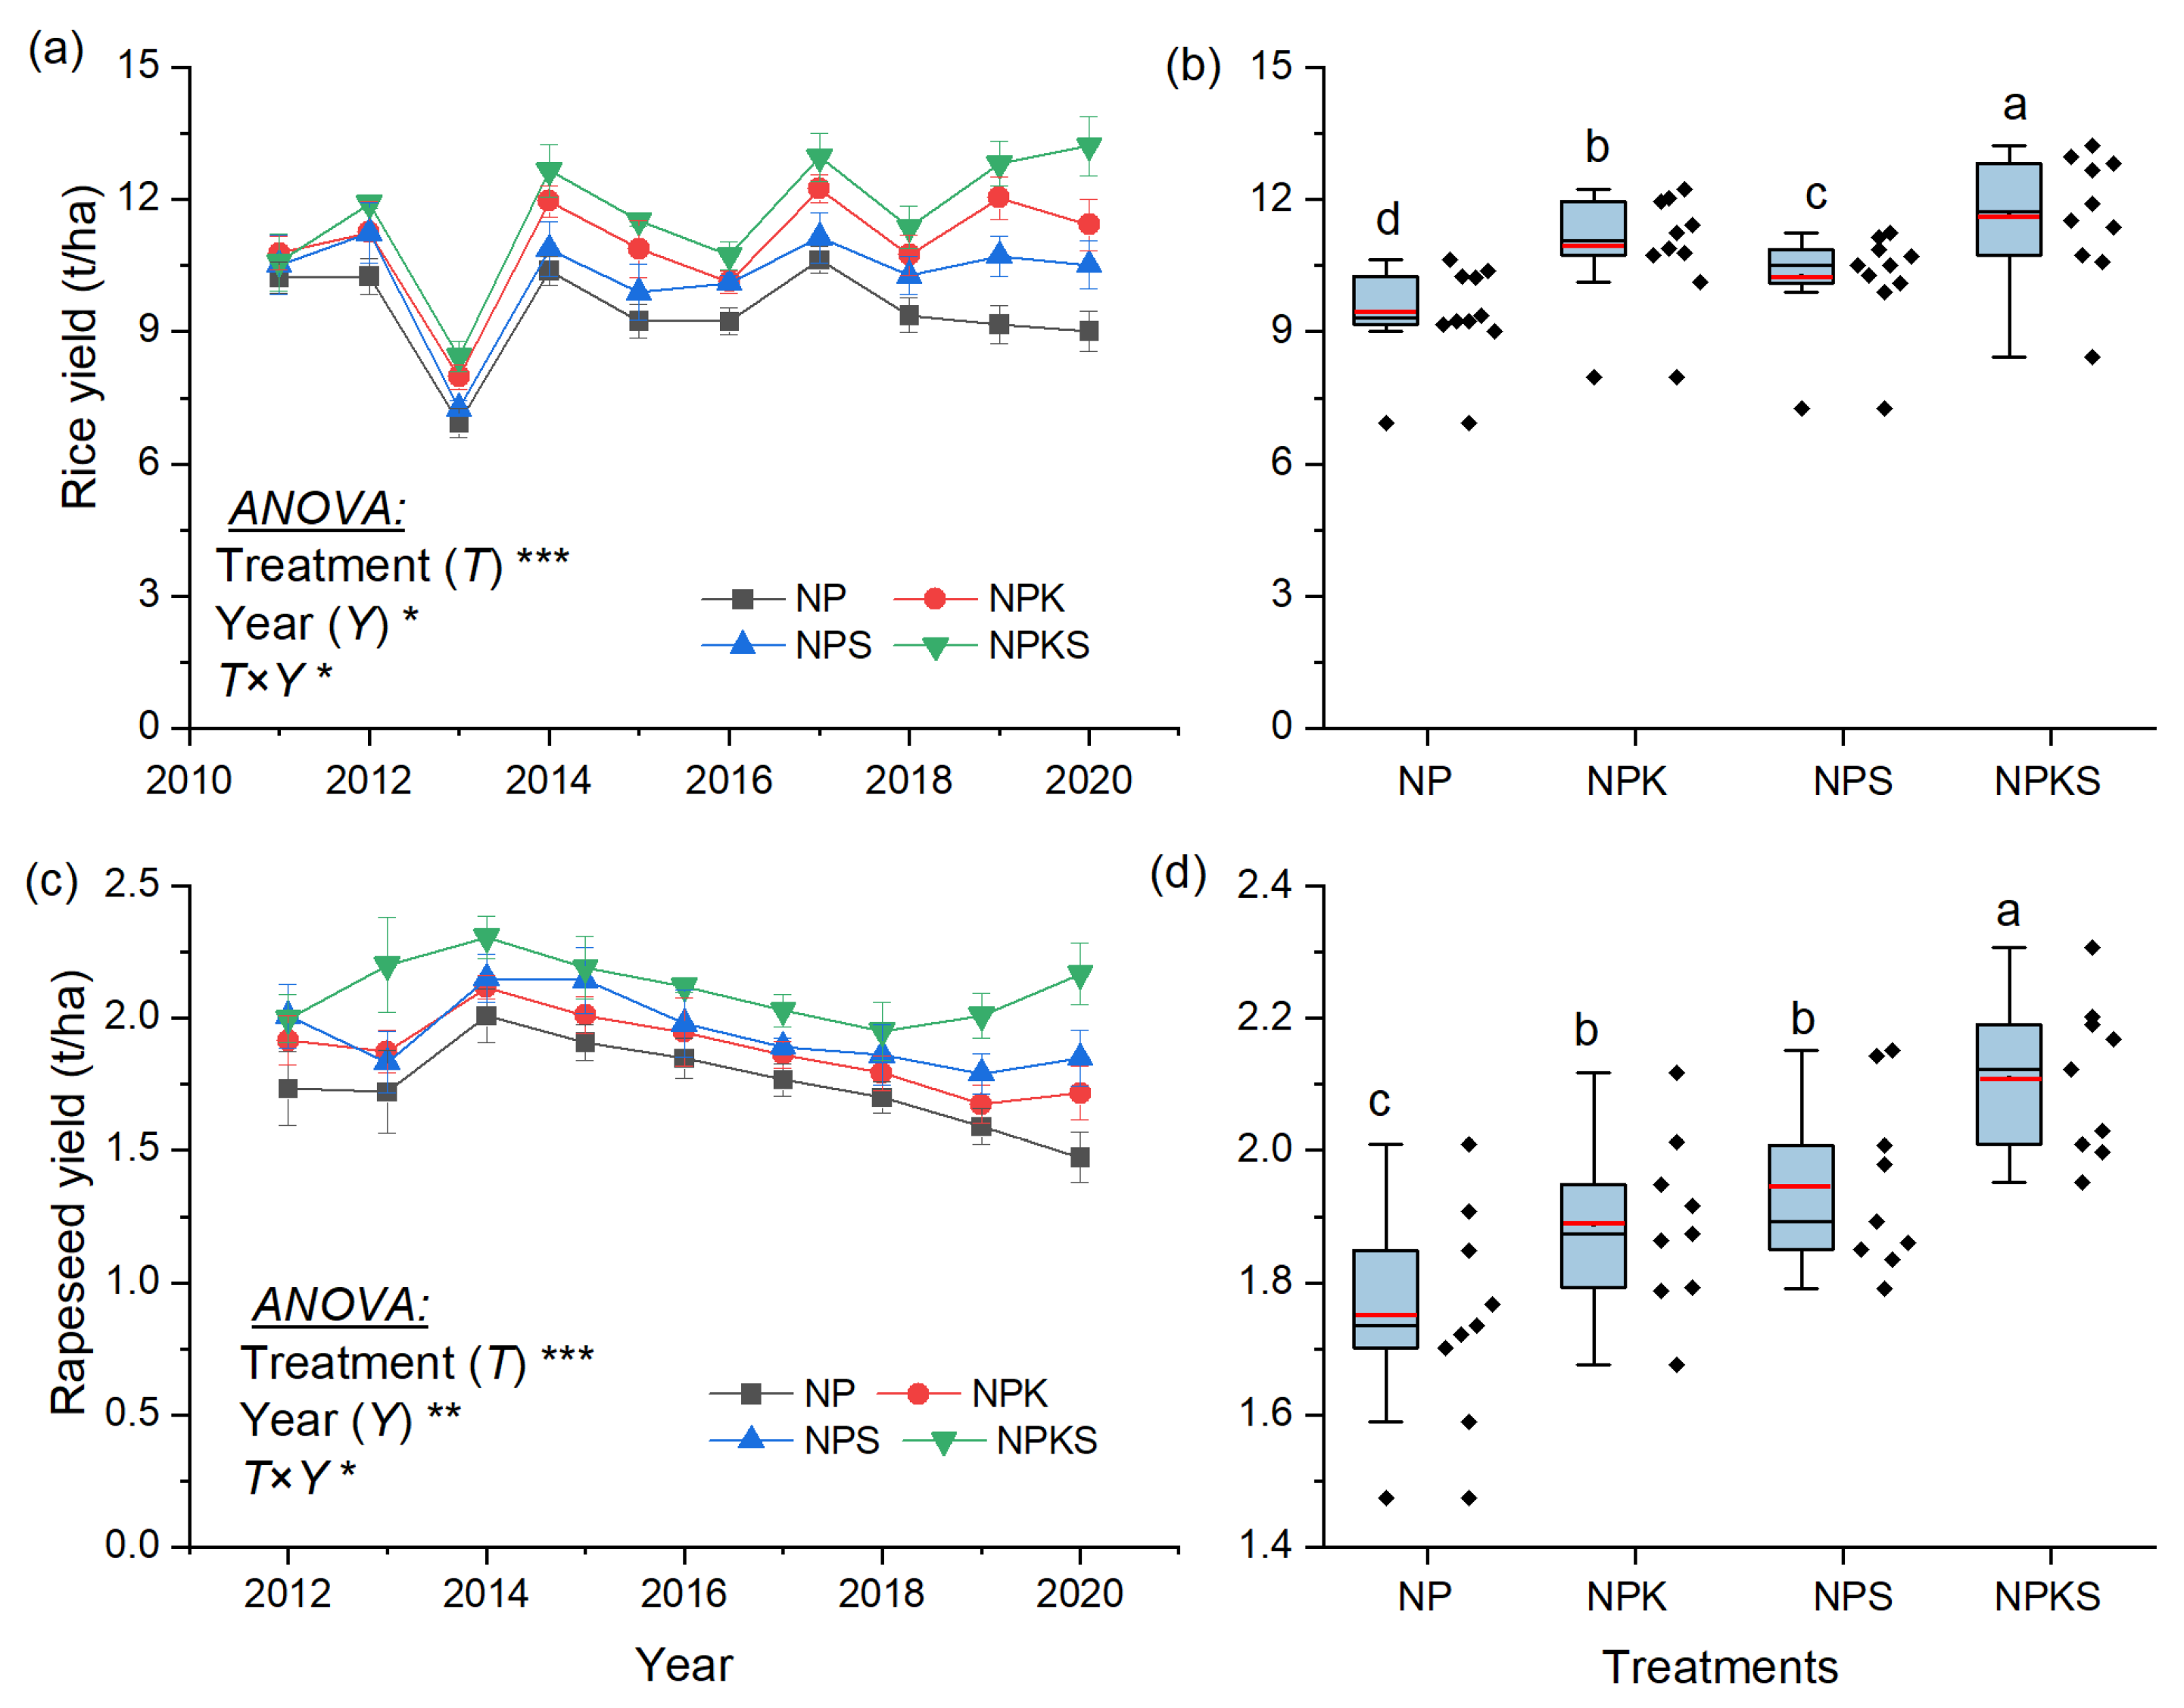
3.1. Grain Yield
3.2. Soil Properties
3.3. Alpha Diversity of Bacterial and Fungal Communities
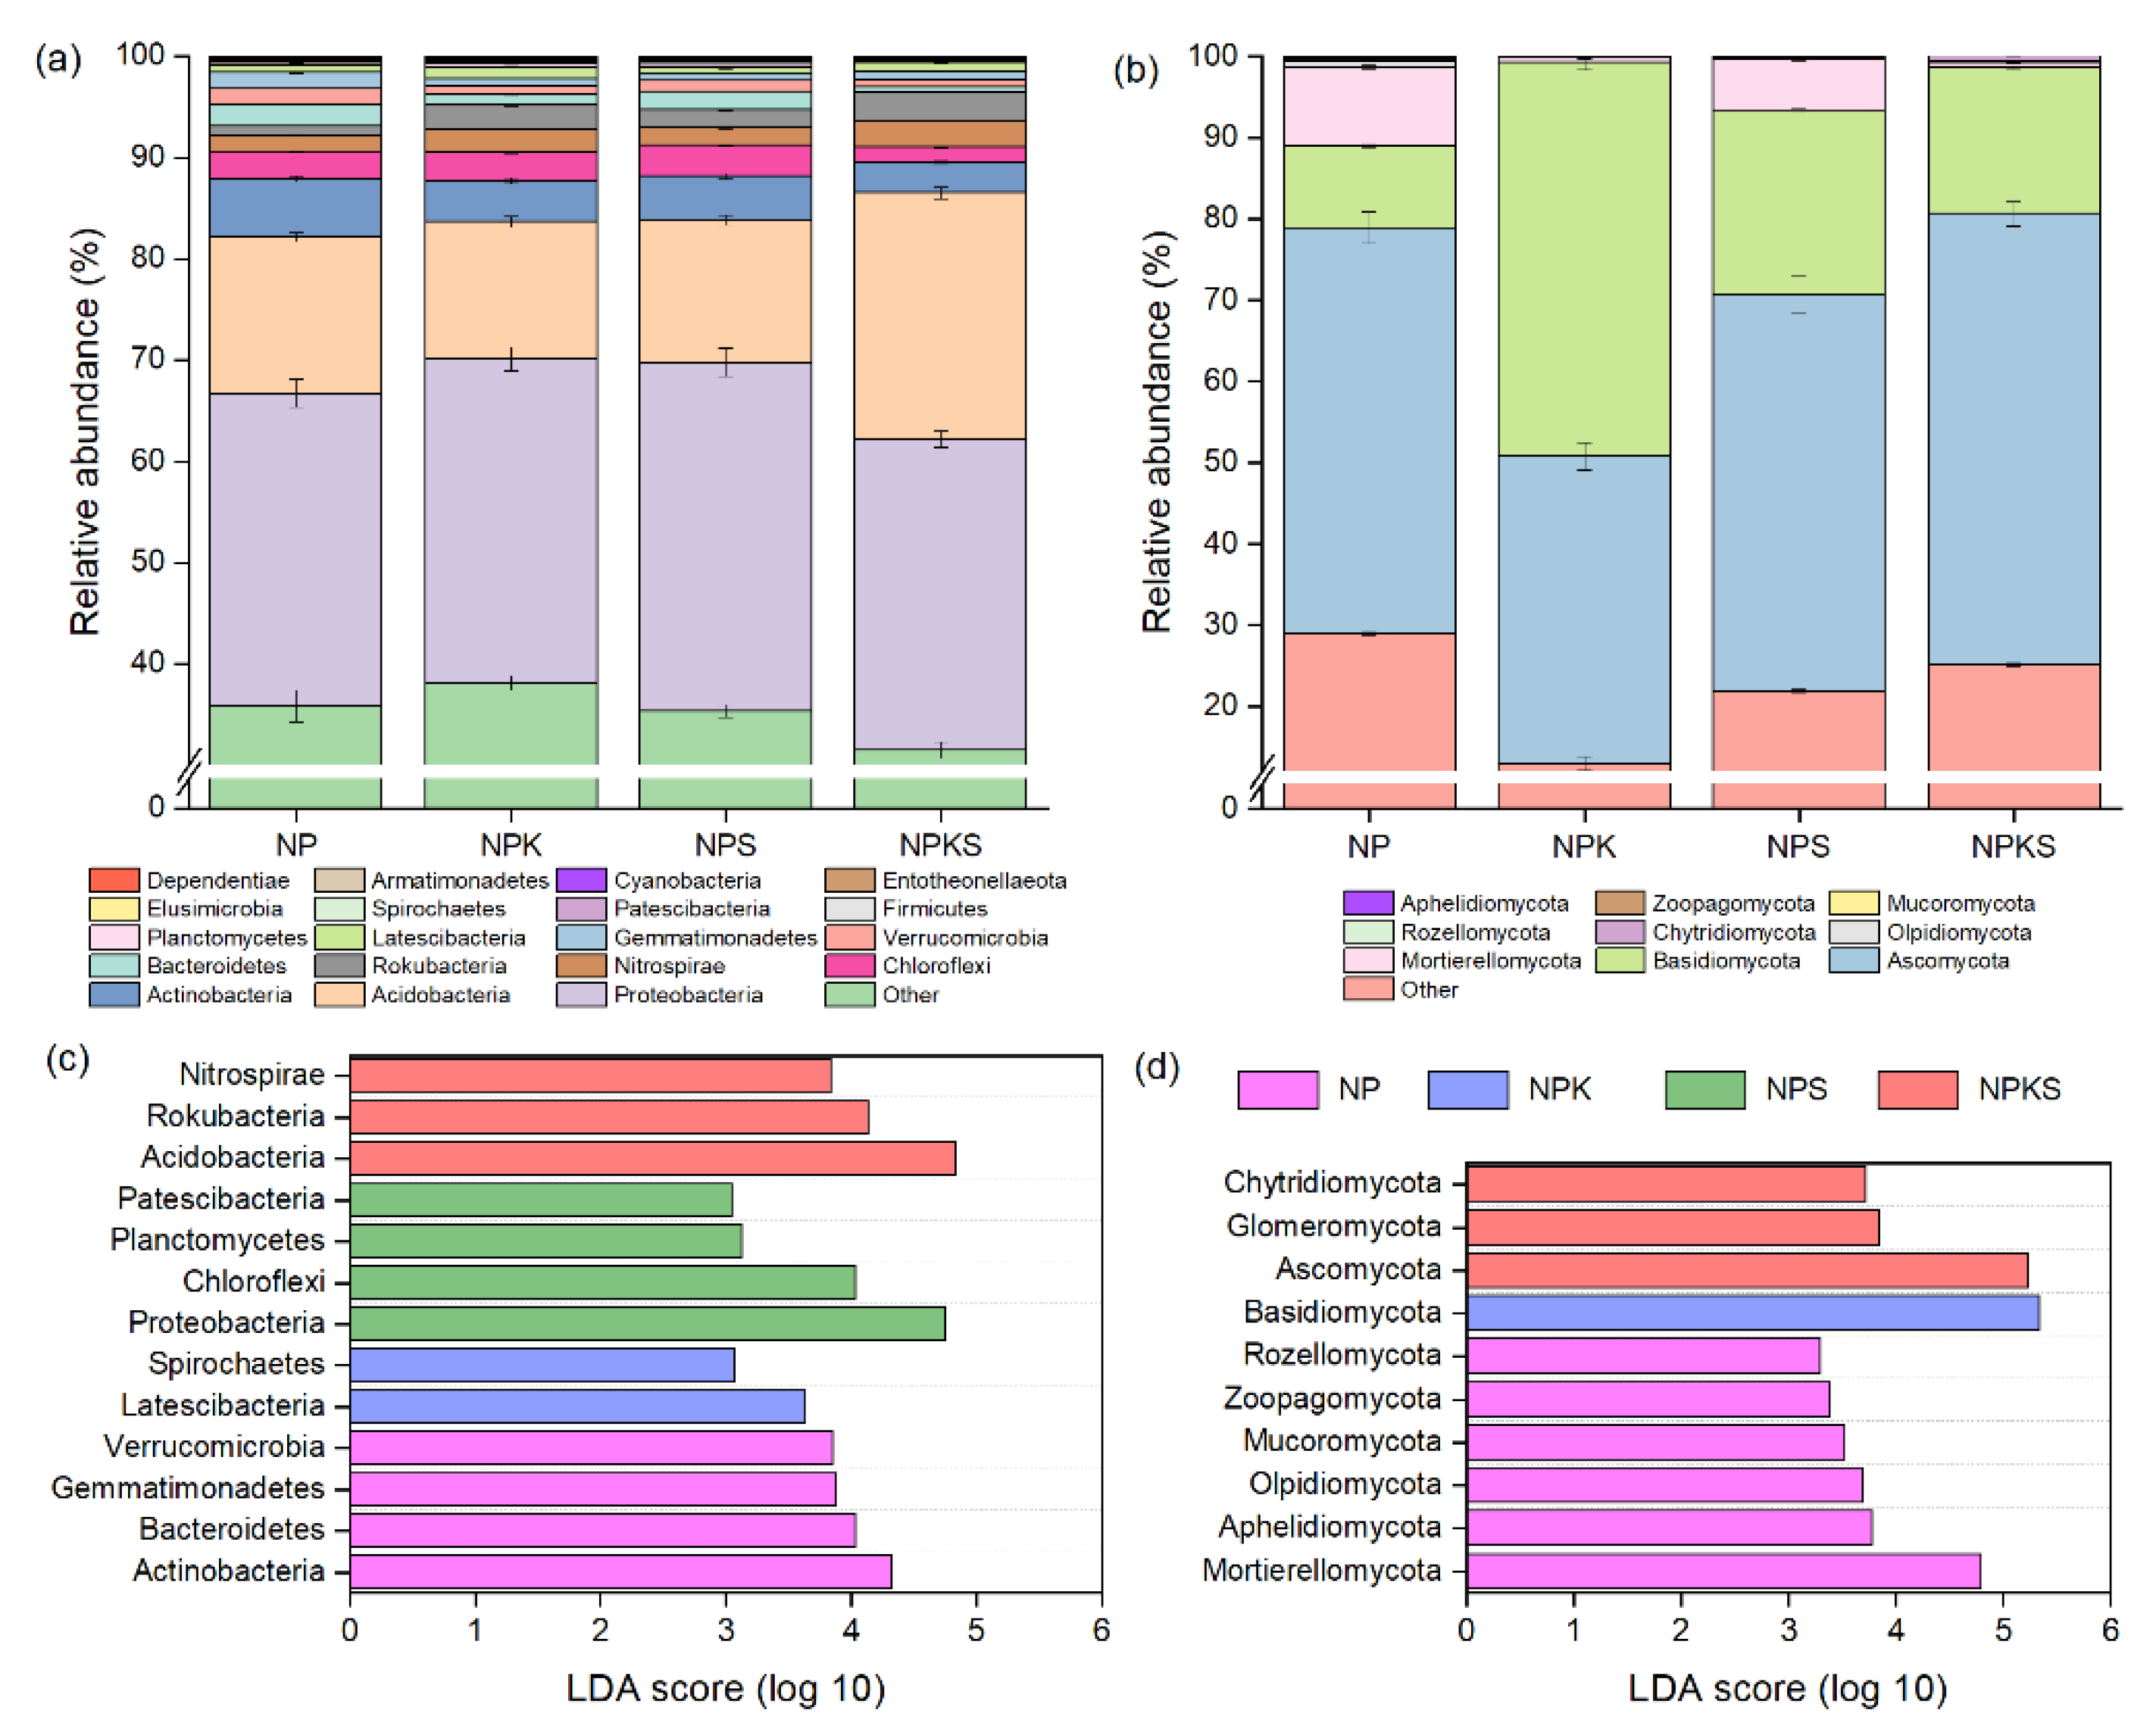
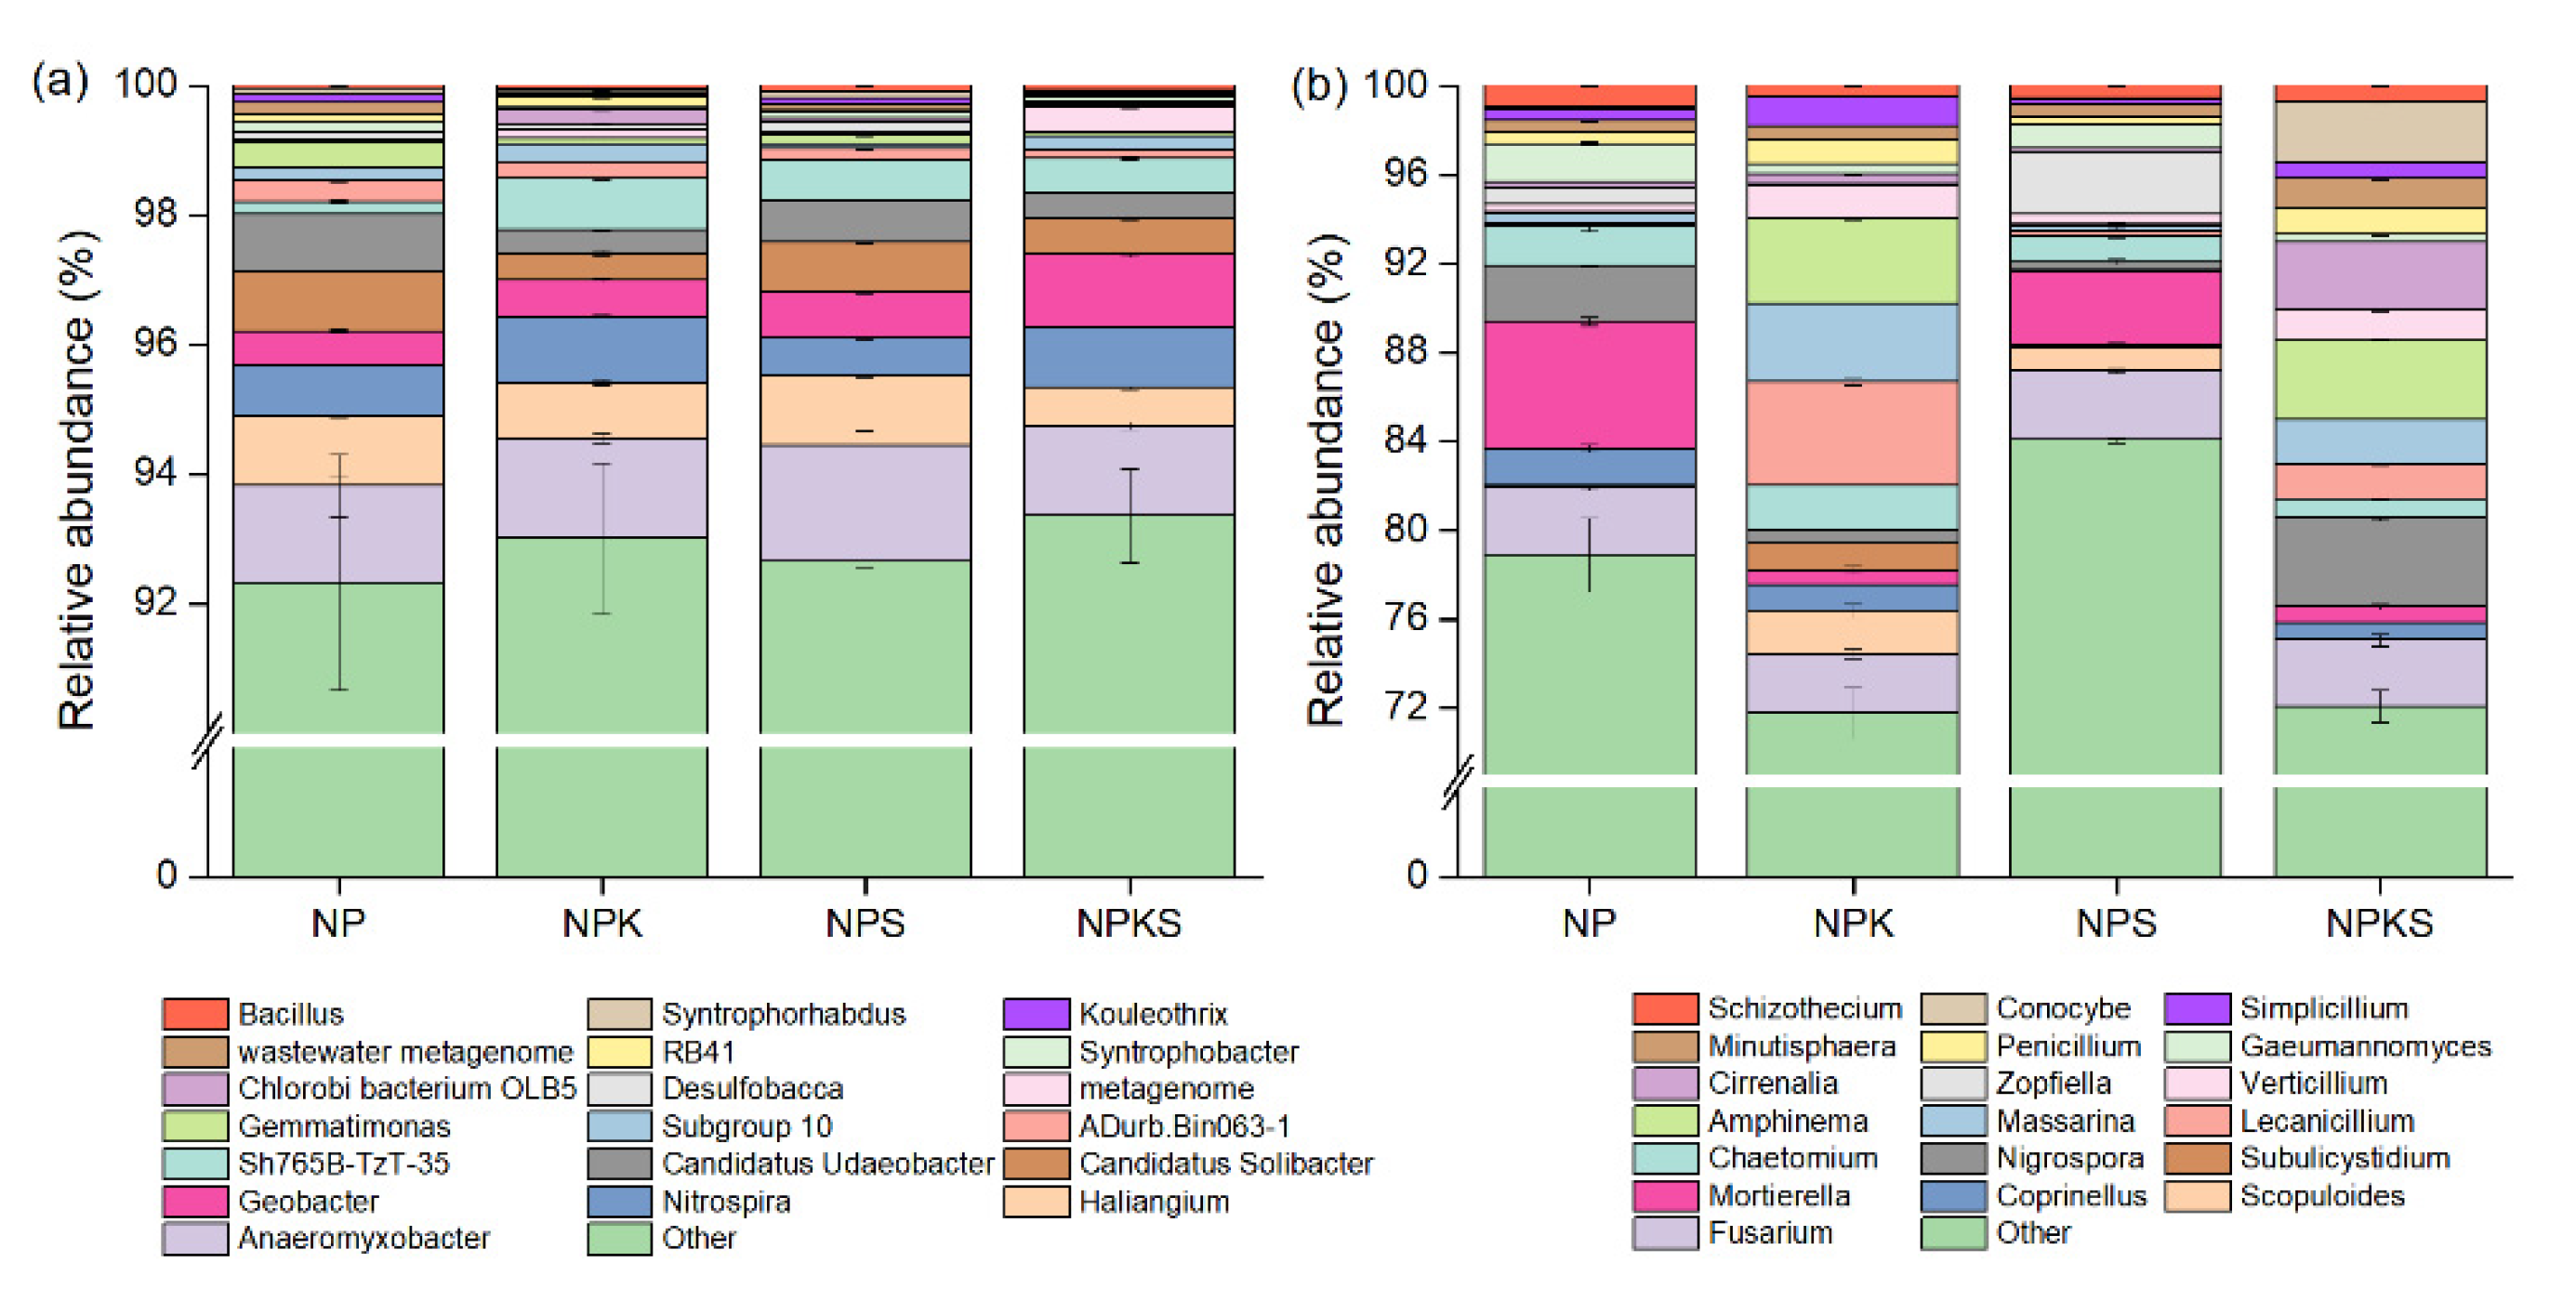
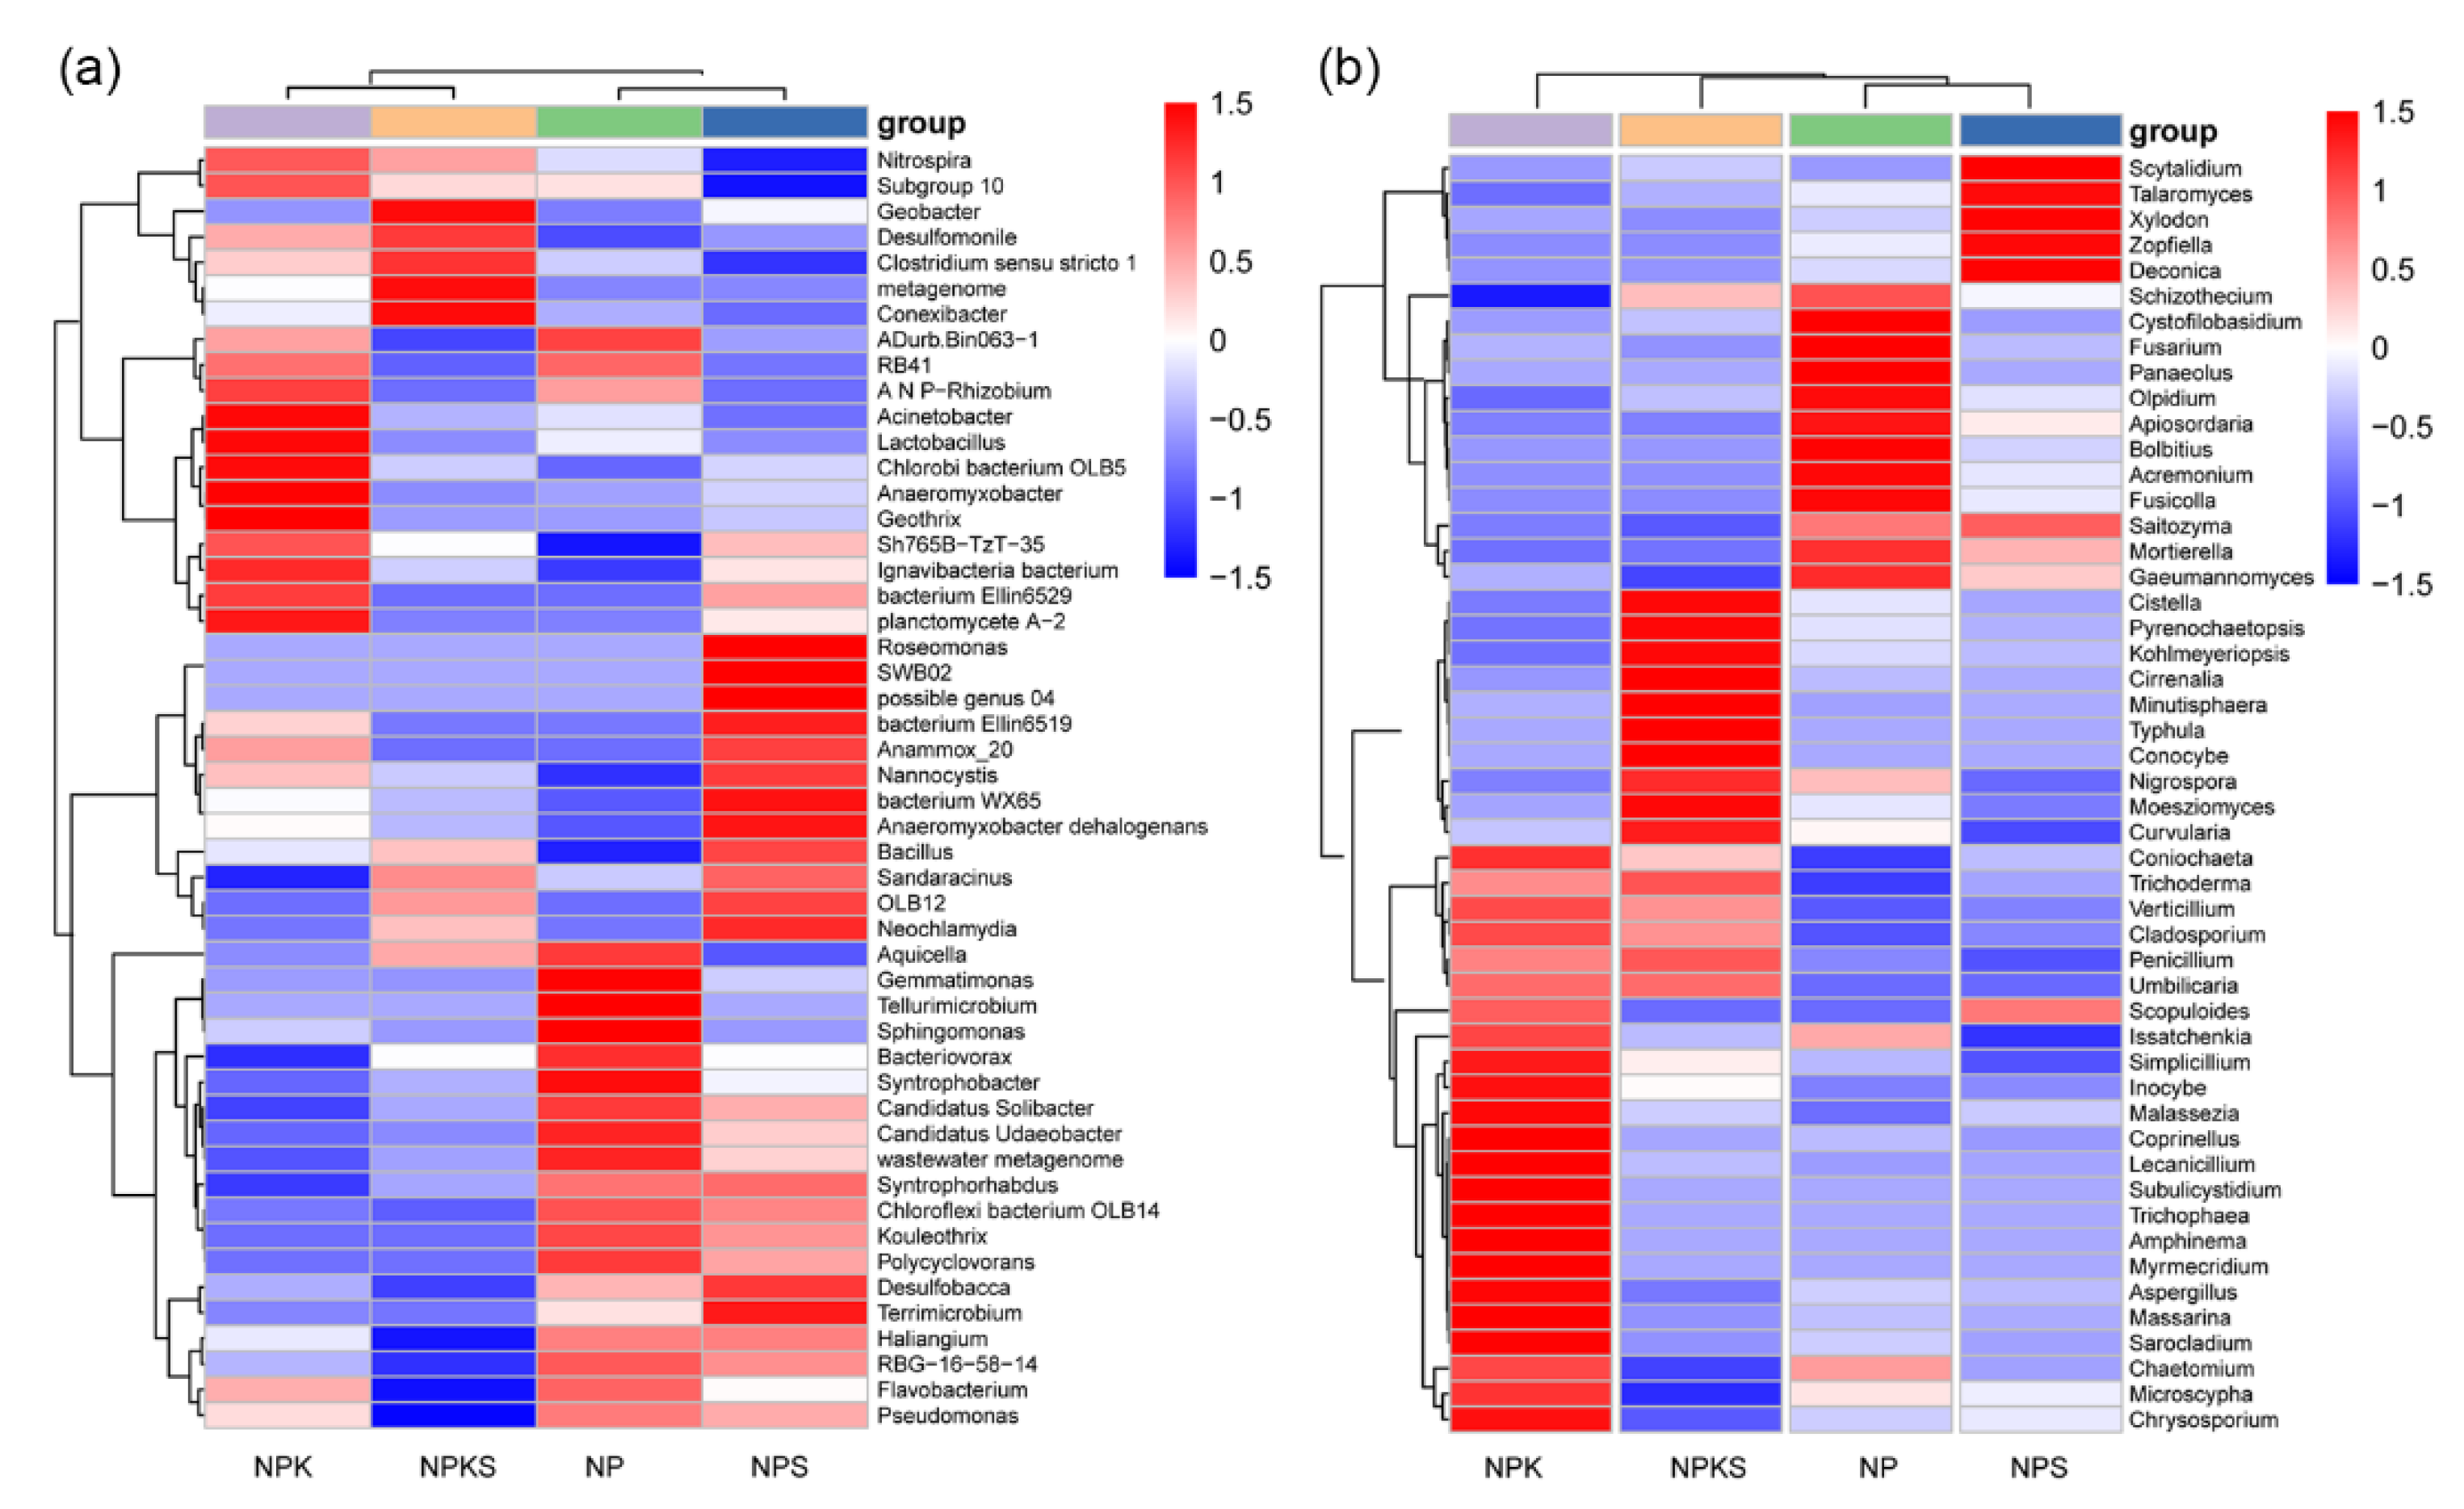
3.4. Composition of Bacterial and Fungal Communities
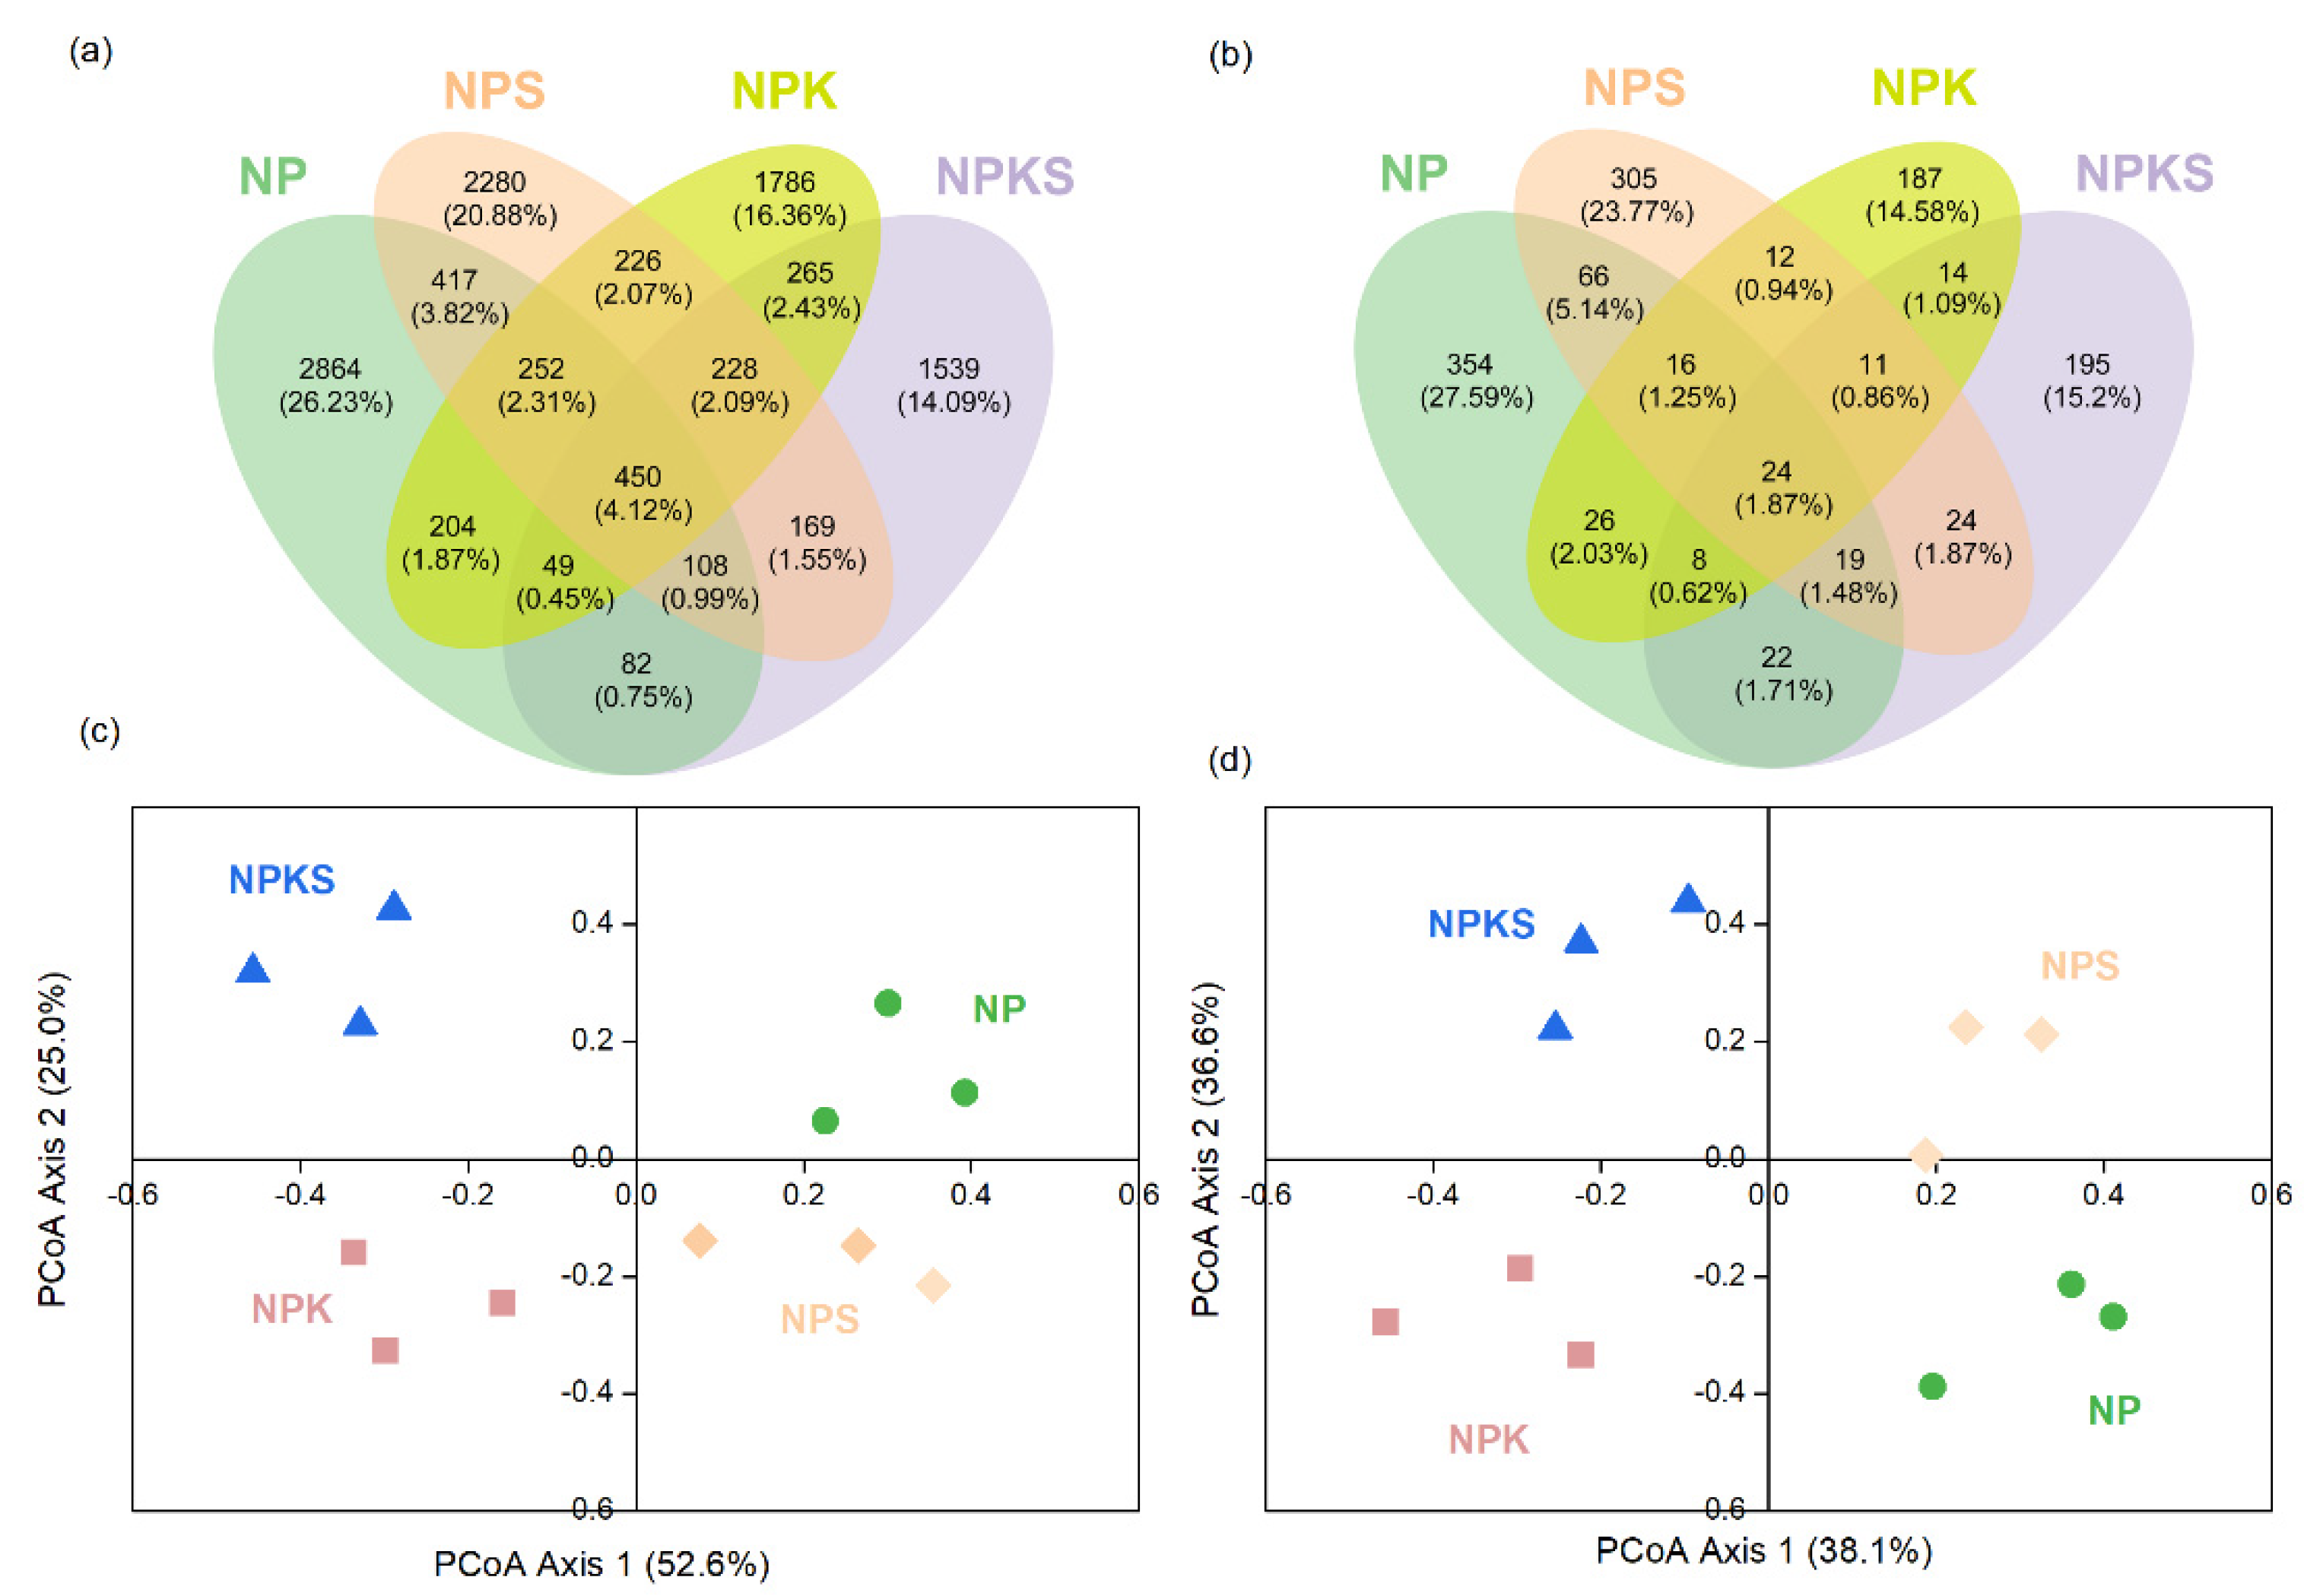
3.5. Beta Diversity of Bacterial and Fungal Communities
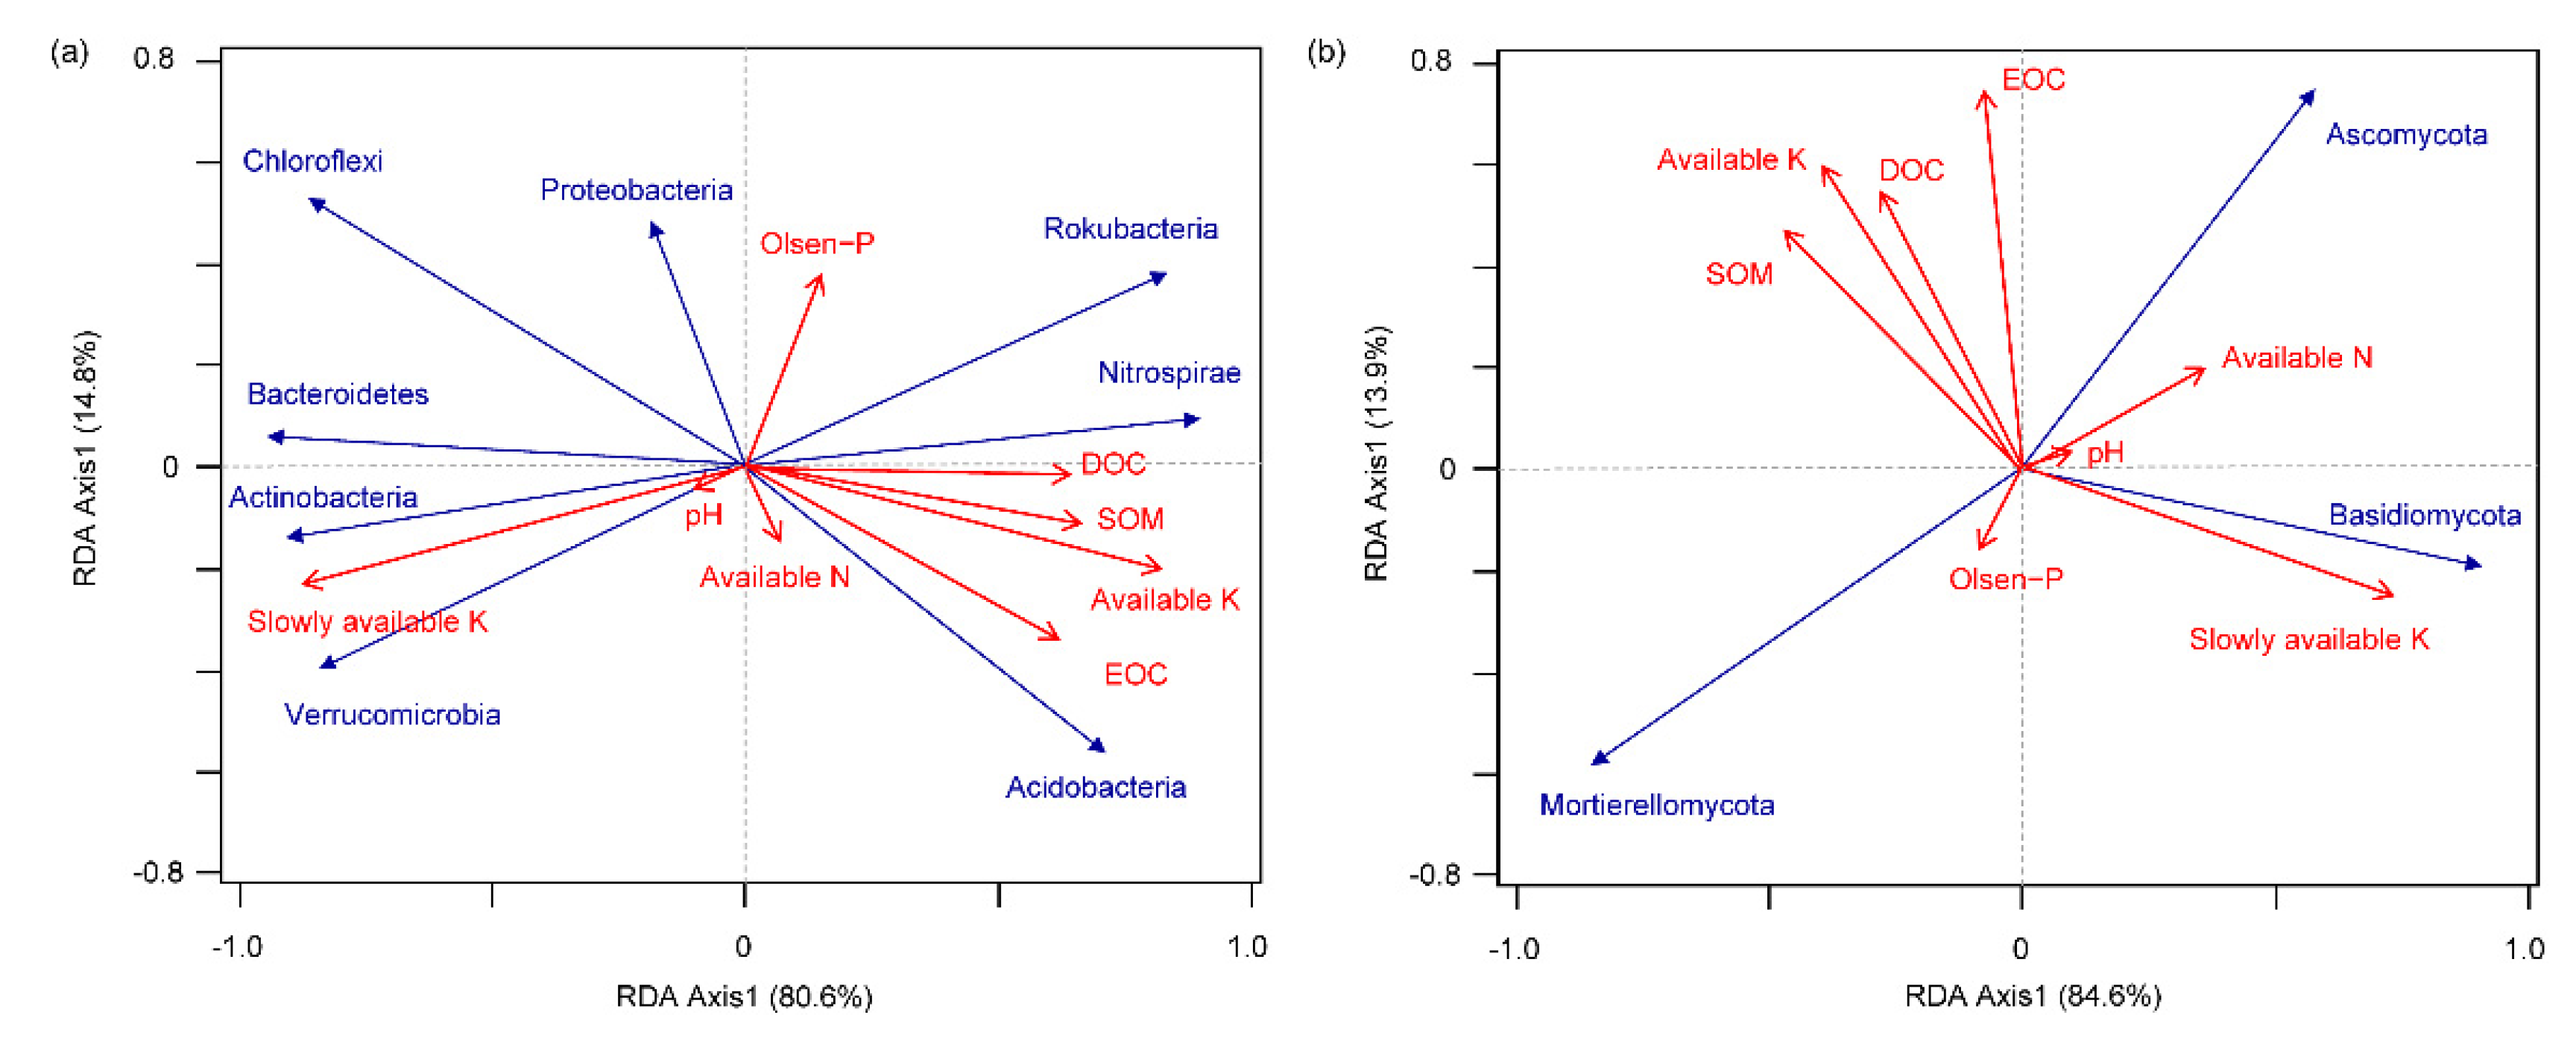
3.6. Correlation of Dominant Microbial Communities with Soil Properties
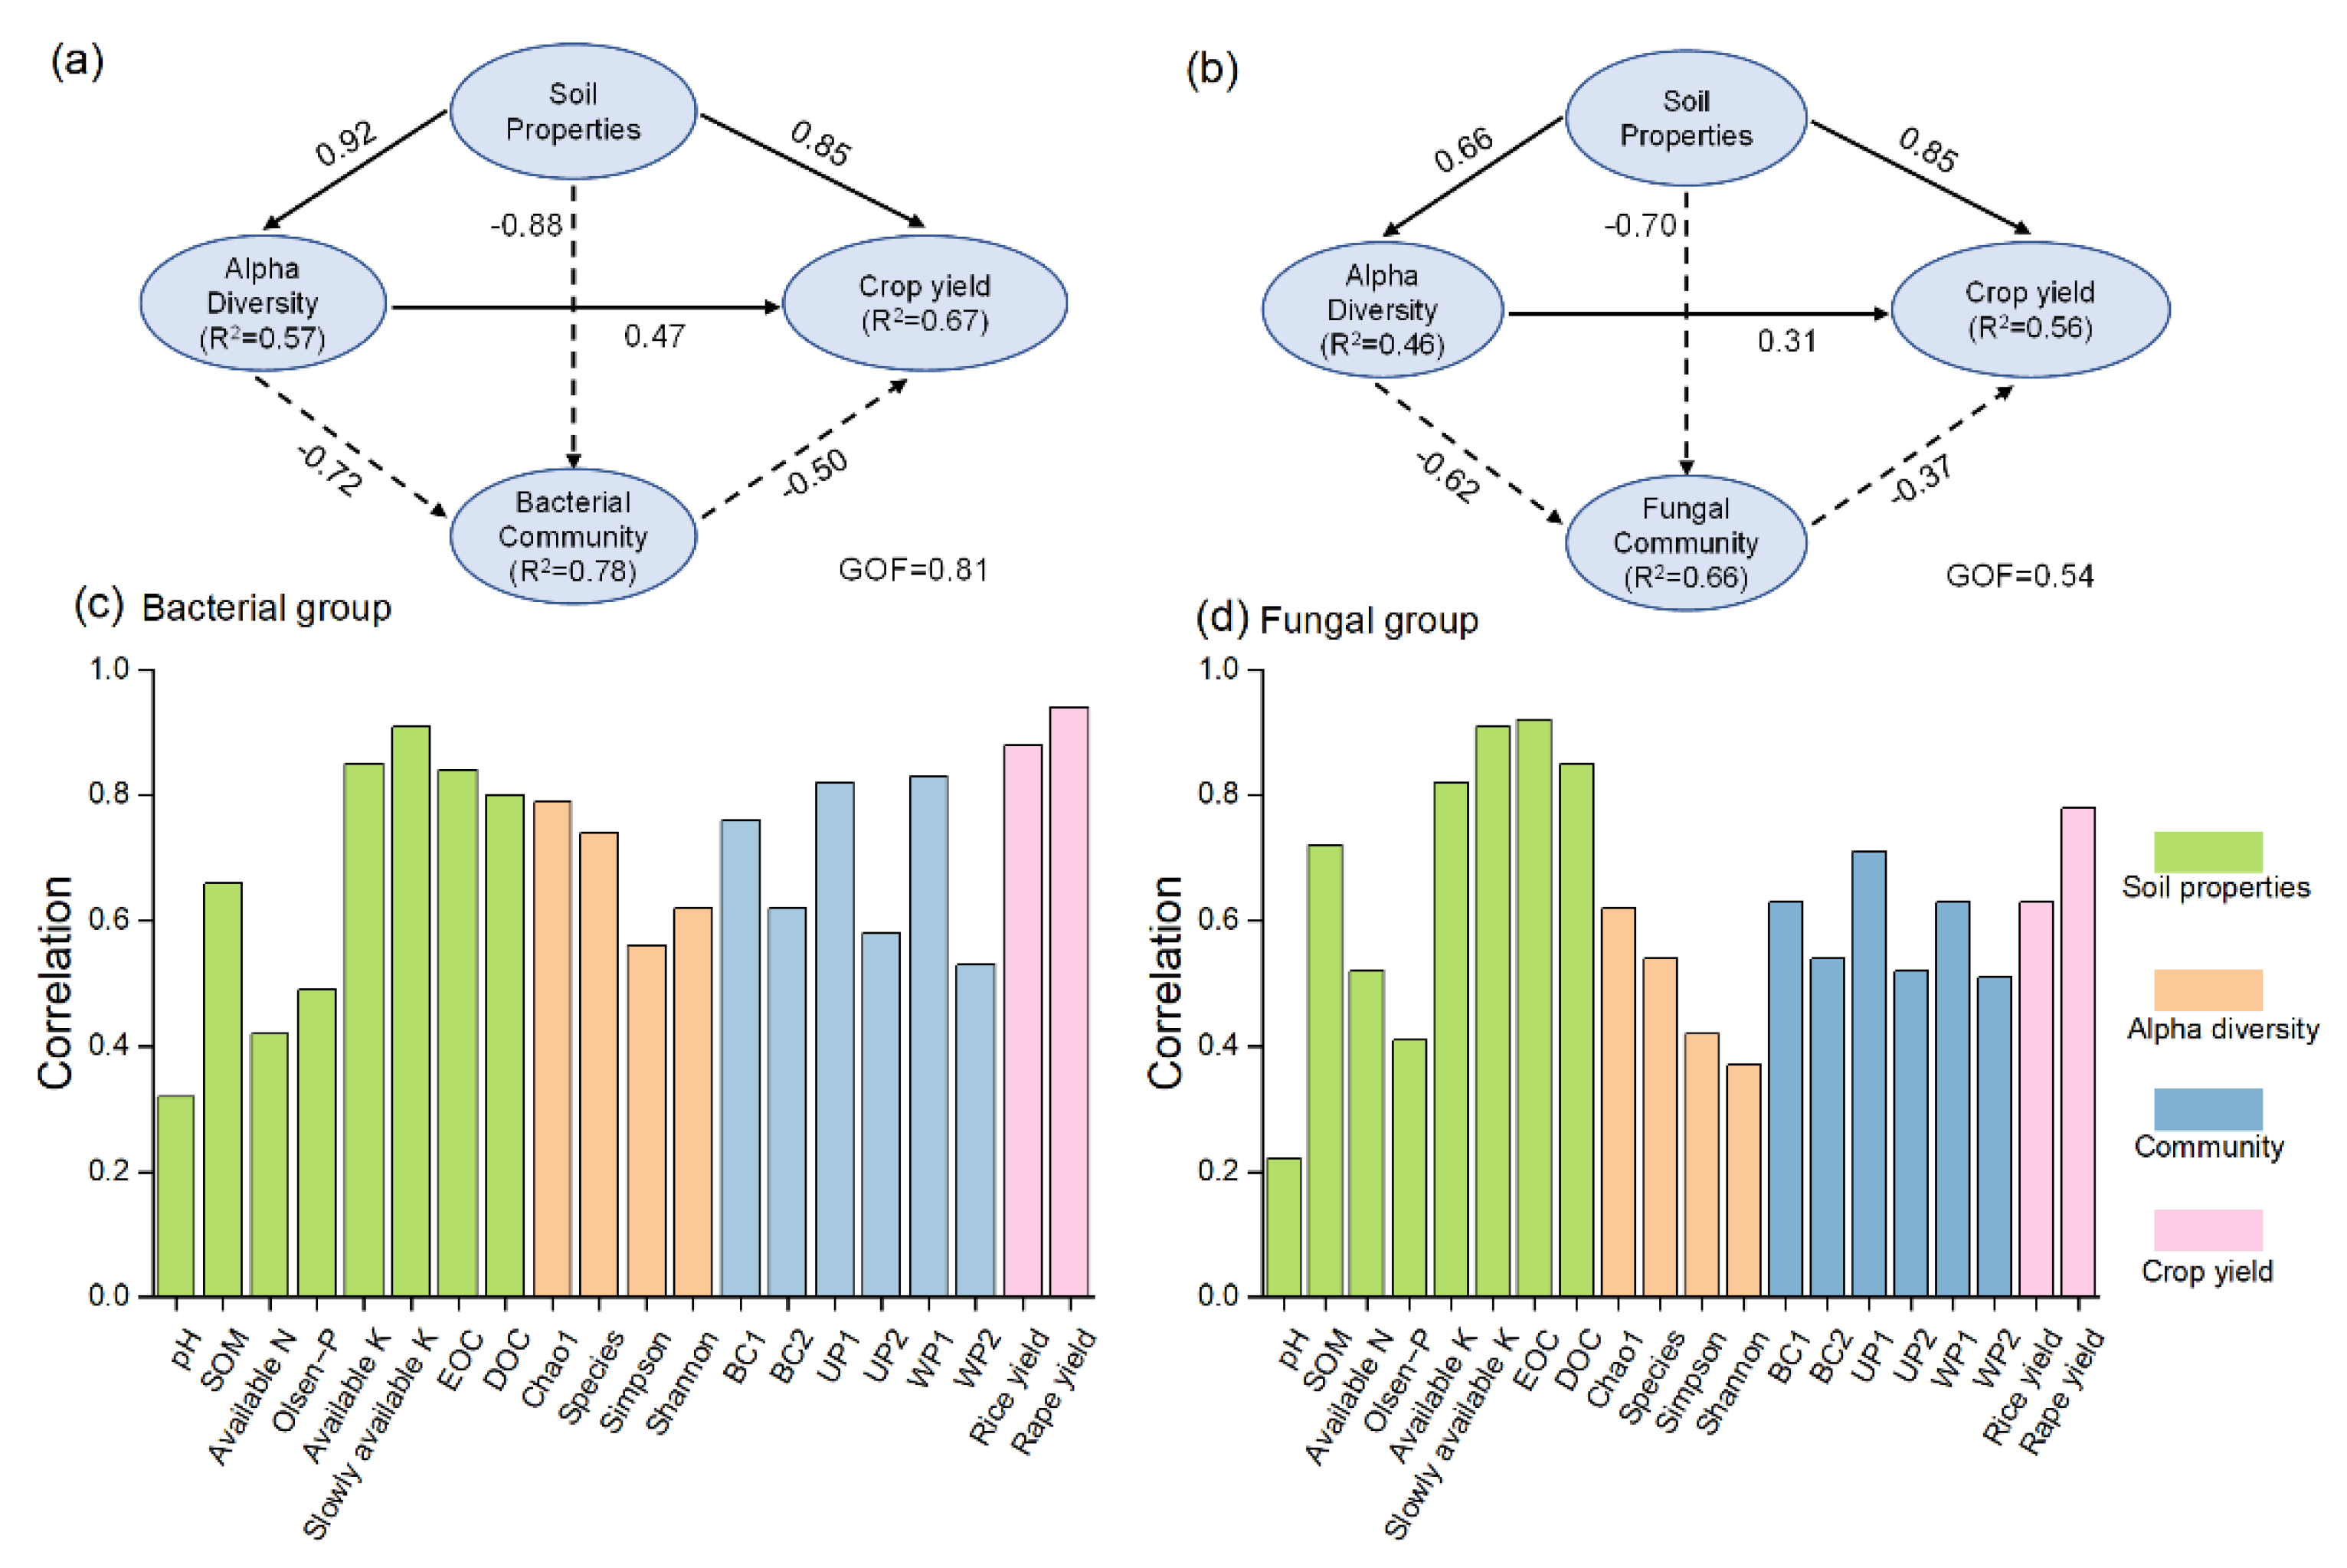
3.7. Potential Pathways Influencing Crop Yield
4. Discussion
4.1. Effects of Long-Term of Straw Returning and K Fertilizer on Crop Yield
4.2. Effects of Long-Term Straw Returning and K Fertilizer on the Soil Properties
4.3. Effects of Long-Term Straw Returning and K Fertilizer on the Soil Microbial Alpha Diversity
4.4. Effects of Long-Term Straw Returning and K Fertilizer on the Soil Microbial Community
5. Conclusions
Supplementary Materials
Author Contributions
Funding
Conflicts of Interest
References
- Bentsen, N.S.; Felby, C.; Thorsen, B.J. Agricultural residue production and potentials for energy and materials services. Prog. Energy Combust. Sci. 2014, 40, 59–73. [Google Scholar] [CrossRef]
- Thiagarajan, A.; Fan, J.; McConkey, B.G.; Janzen, H.H.; Campbell, C.A. Dry matter partitioning and residue N content for 11 major field crops in Canada adjusted for rooting depth and yield. Can. J. Soil Sci. 2018, 98, 574–579. [Google Scholar] [CrossRef] [Green Version]
- Li, X.; Li, Y.; Wu, T.; Qu, C.; Ning, P.; Shi, J.; Tian, X. Potassium fertilization combined with crop straw incorporation alters soil potassium fractions and availability in northwest China: An incubation study. PLoS ONE 2020, 15, e0236634. [Google Scholar] [CrossRef]
- Lv, X.; Wang, Z.; Ma, L.; Cao, N.; Meng, Y.; Zhou, Z. Crop residue incorporation combined with potassium fertilizer increased cotton canopy apparent photosynthesis and seed cotton yield in barley-cotton rotation system. Arch. Agron. Soil Sci. 2021, 67, 300–312. [Google Scholar] [CrossRef]
- Karami, A.; Homaee, M.; Afzalinia, S.; Ruhipour, H.; Basirat, S. Organic resource management: Impacts on soil aggregate stability and other soil physico-chemical properties. Agric. Ecosyst. Environ. 2012, 148, 22–28. [Google Scholar] [CrossRef]
- Li, J.; Lu, J.; Li, X.; Ren, T.; Cong, R.; Zhou, L. Dynamics of potassium release and adsorption on rice straw residue. PLoS ONE 2014, 9, e90440. [Google Scholar] [CrossRef] [PubMed]
- Liu, Z.; Liu, J.; Yu, Z.; Yao, Q.; Li, Y.; Liang, A.; Zhang, W.; Mi, G.; Jin, J.; Liu, X.; et al. Long-term continuous cropping of soybean is comparable to crop rotation in mediating microbial abundance, diversity and community composition. Soil Tillage Res. 2020, 197, 104503. [Google Scholar] [CrossRef]
- Kumar, P.; Kumar, T.; Singh, S.; Tuteja, N.; Prasad, R.; Singh, J. Potassium: A key modulator for cell homeostasis. J. Biotechnol. 2020, 324, 198–210. [Google Scholar] [CrossRef] [PubMed]
- Li, X.K.; Lu, J.W.; Wu, L.S.; Chen, F. The difference of potassium dynamics between yellowish red soil and yellow cinnamon soil under rapeseed (Brassica napus L.)–rice (Oryza sativa L.) rotation. Plant Soil 2009, 320, 141–151. [Google Scholar] [CrossRef]
- Yuan, G.; Huan, W.; Song, H.; Lu, D.; Chen, X.; Wang, H.; Zhou, J. Effects of straw incorporation and potassium fertilizer on crop yields, soil organic carbon, and active carbon in the rice-wheat system. Soil Tillage Res. 2021, 209, 104958. [Google Scholar] [CrossRef]
- Bai, N.; Zhang, H.; Li, S.; Zheng, X.; Zhang, J.; Zhang, H.; Zhou, S.; Sun, H.; Lv, W. Long-term effects of straw and straw-derived biochar on soil aggregation and fungal community in a rice-wheat rotation system. PeerJ 2019, 6, e6171. [Google Scholar] [CrossRef] [PubMed] [Green Version]
- Pathak, H.; Mohanty, S.; Jain, N.; Bhatia, A. Nitrogen, phosphorus, and potassium budgets in Indian agriculture. Nutr. Cycl. Agroecosystems 2009, 86, 287–299. [Google Scholar] [CrossRef]
- Song, X.D.; Liu, F.; Wu, H.Y.; Cao, Q.; Zhong, C.; Yang, J.L.; Li, D.C.; Zhao, Y.G.; Zhang, G.L. Effects of long-term K fertilization on soil available potassium in East China. Catena 2020, 188, 104412. [Google Scholar] [CrossRef]
- Xu, X.; Mao, X.; Van Zwieten, L.; Niazi, N.K.; Lu, K.; Bolan, N.S.; Wang, H. Wetting-drying cycles during a rice-wheat crop rotation rapidly (im)mobilize recalcitrant soil phosphorus. J. Soils Sediments 2020, 20, 3921–3930. [Google Scholar] [CrossRef]
- Chen, H.; Jarosch, K.A.; Mészáros, É.; Frossard, E.; Zhao, X.; Oberson, A. Repeated drying and rewetting differently affect abiotic and biotic soil phosphorus (P) dynamics in a sandy soil: A 33P soil incubation study. Soil Biol. Biochem. 2021, 153, 108079. [Google Scholar] [CrossRef]
- Erinle, K.O.; Marschner, P. Soil water availability influences P pools in the detritusphere of crop residues with different C/P ratios. J. Soil Sci. Plant Nutr. 2019, 19, 771–779. [Google Scholar] [CrossRef]
- Hiel, M.P.; Barbieux, S.; Pierreux, J.; Olivier, C.; Lobet, G.; Roisin, C.; Garre, S.; Colinet, G.; Bodson, B.; Dumont, B. Impact of crop residue management on crop production and soil chemistry after seven years of crop rotation in temperate climate, loamy soils. PeerJ 2018, 6, e4836. [Google Scholar] [CrossRef] [Green Version]
- Liu, Z.; Zhou, H.; Xie, W.; Yang, Z.; Lv, Q. Long-term effects of maize straw return and manure on the microbial community in cinnamon soil in Northern China using 16S rRNA sequencing. PLoS ONE 2021, 16, e0249884. [Google Scholar] [CrossRef]
- Yu, C.; Li, Y.; Mo, R.; Deng, W.; Zhu, Z.; Liu, D.; Hu, X. Effects of long-term straw retention on soil microorganisms under a rice-wheat cropping system. Arch. Microbiol. 2020, 202, 1915–1927. [Google Scholar] [CrossRef]
- Ma, Z.; Xie, Y.; Zhu, L.; Cheng, L.; Xiao, X.; Zhou, C.; Wang, J. Which of soil microbes is in positive correlation to yields of maize (Zea mays L.)? Plant Soil Environ. 2017, 63, 574–580. [Google Scholar] [CrossRef] [Green Version]
- Chen, Y.; Xin, L.; Liu, J.; Yuan, M.; Liu, S.; Jiang, W.; Chen, J. Changes in bacterial community of soil induced by long-term straw returning. Sci. Agric. 2017, 74, 349–356. [Google Scholar] [CrossRef]
- Srour, A.Y.; Ammar, H.A.; Subedi, A.; Pimentel, M.; Cook, R.L.; Bond, J.; Fakhoury, A.M. Microbial communities associated with long-term tillage and fertility treatments in a corn-soybean cropping system. Front. Microbiol. 2020, 11, 18. [Google Scholar] [CrossRef] [PubMed]
- Ling, N.; Chen, D.; Guo, H.; Wei, J.; Bai, Y.; Shen, Q.; Hu, S. Differential responses of soil bacterial communities to long-term N and P inputs in a semi-arid steppe. Geoderma 2017, 292, 25–33. [Google Scholar] [CrossRef]
- Tian, H.; Wang, H.; Hui, X.; Wang, Z.; Drijber, R.A.; Liu, J. Changes in soil microbial communities after 10 years of winter wheat cultivation versus fallow in an organic-poor soil in the Loess Plateau of China. PLoS ONE 2017, 12, e0184223. [Google Scholar] [CrossRef] [Green Version]
- Guo, Z.; Liu, H.; Wan, S.; Hua, K.; Wang, D.; Guo, X.; He, C. Fertilization practice changes rhizosphere microbial community structure in the agroecosystem. Ann. Appl. Biol. 2019, 174, 123–132. [Google Scholar] [CrossRef]
- Ullah, S.; He, P.; Ai, C.; Zhao, S.; Ding, W.; Song, D.; Zhang, J.; Huang, S.; Abbas, T.; Zhou, W. How do soil bacterial diversity and community composition respond under recommended and conventional nitrogen fertilization regimes? Microorganisms 2020, 8, 1193. [Google Scholar] [CrossRef] [PubMed]
- Wasaki, J.; Sakaguchi, J.; Yamamura, T.; Ito, S.; Shinano, T.; Osaki, M.; Kandeler, E. P and N deficiency change the relative abundance and function of rhizosphere microorganisms during cluster root development of white lupin (Lupinus albus L.). Soil Sci. Plant Nutr. 2018, 64, 686–696. [Google Scholar] [CrossRef]
- Dai, Z.; Liu, G.; Chen, H.; Chen, C.; Wang, J.; Ai, S.; Wei, D.; Li, D.; Ma, B.; Tang, C.; et al. Long-term nutrient inputs shift soil microbial functional profiles of phosphorus cycling in diverse agroecosystems. ISME J. 2020, 14, 757–770. [Google Scholar] [CrossRef] [PubMed] [Green Version]
- Yu, Z.; Hu, X.; Wei, D.; Liu, J.; Zhou, B.; Jin, J.; Liu, X.; Wang, G. Long-term inorganic fertilizer use influences bacterial communities in Mollisols of Northeast China based on high-throughput sequencing and network analyses. Arch. Agron. Soil Sci. 2019, 65, 1331–1340. [Google Scholar] [CrossRef]
- Fan, K.K.; Delgado-Baquerizo, M.; Guo, X.S.; Wang, D.Z.; Zhu, Y.G.; Chu, H.Y. Biodiversity of key-stone phylotypes determines crop production in a 4-decade fertilization experiment. ISME J. 2021, 15, 550–561. [Google Scholar] [CrossRef]
- Wang, J.; Song, Y.; Ma, T.; Raza, W.; Li, J.; Howland, J.G.; Huang, Q.; Shen, Q. Impacts of inorganic and organic fertilization treatments on bacterial and fungal communities in a paddy soil. Appl. Soil Ecol. 2017, 112, 42–50. [Google Scholar] [CrossRef]
- Mcbain, A.J.; Bartolo, R.G.; Catrenich, C.E.; Charbonneau, D.; Ledder, R.G.; Price, B.B.; Gilbert, P. Exposure of sink drain microcosms to triclosan: Population dynamics and antimicrobial susceptibility. Appl. Environ. Microbiol. 2003, 69, 5433–54442. [Google Scholar] [CrossRef] [PubMed] [Green Version]
- Caporaso, J.G.; Kuczynski, J.; Stombaugh, J.; Bittinger, K.; Bushman, F.D.; Costello, E.K.; Fierer, N.; Pena, A.G.; Goodrich, J.K.; Gordon, J.I.; et al. QIIME allows analysis of high-throughput community sequencing data. Nat. Methods 2010, 7, 335–336. [Google Scholar] [CrossRef] [Green Version]
- Radhakrishnan, S.; Varadharajan, M. Status of microbial diversity in agroforestry systems in Tamil Nadu, India. J. Basic Microbiol. 2016, 56, 662–669. [Google Scholar] [CrossRef]
- Schloss, P.D.; Westcott, S.L.; Ryabin, T.; Hall, J.R.; Hartmann, M.; Hollister, E.B.; Lesniewski, R.A.; Oakley, B.B.; Parks, D.H.; Robinson, C.J.; et al. Introducing mothur: Open-source, platform-independent, community-supported software for describing and comparing microbial communities. Appl. Environ. Microbiol. 2009, 75, 7537–7541. [Google Scholar] [CrossRef] [PubMed] [Green Version]
- Barberan, A.; Ramirez, K.S.; Leff, J.W.; Bradford, M.A.; Wall, D.H.; Fierer, N. Why are some microbes more ubiquitous than others? Predicting the habitat breadth of soil bacteria. Ecol. Lett. 2014, 17, 794–802. [Google Scholar] [CrossRef] [PubMed]
- Yan, F.; Sun, Y.; Hui, X.; Jiang, M.; Xiang, K.; Wu, Y.; Zhang, Q.; Tang, Y.; Yang, Z.; Sun, Y.; et al. The effect of straw mulch on nitrogen, phosphorus and potassium uptake and use in hybrid rice. Paddy Water Environ. 2019, 17, 23–33. [Google Scholar] [CrossRef]
- Huang, W.; Wu, J.F.; Pan, X.H.; Tan, X.M.; Zeng, Y.J.; Shi, Q.H.; Liu, T.J.; Zeng, Y.H. Effects of long-term straw return on soil organic carbon fractions and enzyme activities in a double-cropped rice paddy in South China. J. Integr. Agric. 2021, 20, 236–247. [Google Scholar] [CrossRef]
- Wu, W.; Ma, B.; Uphoff, N. A review of the system of rice intensification in China. Plant Soil 2015, 393, 361–381. [Google Scholar] [CrossRef]
- Tian, Z.; Ji, Y.; Sun, L.; Xu, X.; Fan, D.; Zhong, H.; Liang, Z.; Ficsher, G. Changes in production potentials of rapeseed in the Yangtze River basin of China under climate change: A multi-model ensemble approach. J. Geogr. Sci. 2018, 28, 1700–1714. [Google Scholar] [CrossRef] [Green Version]
- Li, H.; Lu, J.; Ren, T.; Li, X.; Cong, R. Nutrient efficiency of winter oilseed rape in an intensive cropping system: A regional analysis. Pedosphere 2017, 27, 364–370. [Google Scholar] [CrossRef]
- Wang, X.; Sun, B.; Mao, J.; Sui, Y.; Cao, X. Structural convergence of maize and wheat straw during two-year decomposition under different climate conditions. Environ. Sci. Tech. 2012, 46, 7159–7165. [Google Scholar] [CrossRef] [PubMed]
- Bai, Y.; Wang, L.; Lu, Y.; Yang, L.; Zhou, L.; Ni, L.; Cheng, M. Effects of long-term full straw return on yield and potassium response in wheat-maize rotation. J. Integr. Agric. 2015, 14, 2467–2476. [Google Scholar] [CrossRef]
- Li, J.F.; Zhong, F.F. Nitrogen release and re-adsorption dynamics on crop straw residue during straw decomposition in an Alfisol. J. Integr. Agric. 2021, 20, 248–259. [Google Scholar] [CrossRef]
- Segnini, A.; Nunes Carvalho, J.L.; Bolonhezi, D.; Bastos Pereira Milori, D.M.; Lopes da Silva, W.T.; Simoes, M.L.; Cantarella, H.; de Maria, I.C.; Martin-Neto, L. Carbon stock and humification index of organic matter affected by sugarcane straw and soil management. Sci. Agric. 2013, 70, 321–326. [Google Scholar] [CrossRef] [Green Version]
- Wang, Y.; Zheng, J.; Boyd, S.E.; Xu, Z.; Zhou, Q. Effects of litter quality and quantity on chemical changes during eucalyptus litter decomposition in subtropical Australia. Plant Soil 2019, 442, 65–78. [Google Scholar] [CrossRef]
- Zribi, W.; Faci, J.M.; Araguees, R. Mulching effects on moisture, temperature, structure and salinity of agricultural soils. ITEA Inf. Tec. Econ. Agrar. 2011, 107, 148–162. [Google Scholar] [CrossRef]
- Akhtar, K.; Wang, W.; Ren, G.; Khan, A.; Feng, Y.; Yang, G. Changes in soil enzymes, soil properties, and maize crop productivity under wheat straw mulching in Guanzhong, China. Soil Tillage Res. 2018, 182, 94–102. [Google Scholar] [CrossRef]
- Zhang, Z.; Cong, R.H.; Ren, T.; Li, H.; Zhu, Y.; Lu, J.W. Optimizing agronomic practices for closing rapeseed yield gaps under intensive cropping systems in China. J. Integr. Agric. 2020, 19, 1241–1249. [Google Scholar] [CrossRef]
- Zhu, D.; Zhang, J.; Lu, J.; Cong, R.; Ren, T.; Li, X. Optimal potassium management strategy to enhance crop yield and soil potassium fertility under paddy-upland rotation. J. Sci. Food Agric. 2020, 101, 3404–3412. [Google Scholar] [CrossRef]
- Madar, R.; Singh, Y.V.; Meena, M.C.; Das, T.K.; Gaind, S.; Verma, R.K. Potassium and residue management options to enhance productivity and soil quality in zero till maize-wheat rotation. Clean Soil Air Water 2020, 48, 1900316. [Google Scholar] [CrossRef]
- Xu, Q.; Fu, H.; Zhu, B.; Hussain, H.A.; Zhang, K.; Tian, X.; Duan, M.; Xie, X.; Wang, L. Potassium improves drought stress tolerance in plants by affecting root morphology, root exudates and microbial diversity. Metabolites 2021, 11, 131. [Google Scholar] [CrossRef] [PubMed]
- Han, Y.; Ma, W.; Zhou, B.; Salah, A.; Geng, M.; Cao, C.; Zhan, M.; Zhao, M. Straw return increases crop grain yields and K-use efficiency under a maize-rice cropping system. Crop. J. 2021, 9, 168–180. [Google Scholar] [CrossRef]
- Zhao, Y.; Chen, Y.; Dai, H.; Cui, J.; Wang, L.; Sui, P. Effects of organic amendments on the improvement of soil nutrients and crop yield in sandy soils during a 4-year field experiment in Huang-Huai-Hai plain, northern China. Agronomy 2021, 11, 157. [Google Scholar] [CrossRef]
- Kallenbach, C.M.; Frey, S.D.; Grandy, A.S. Direct evidence for microbial-derived soil organic matter formation and its ecophysiological controls. Nat. Commun. 2016, 7, 13630. [Google Scholar] [CrossRef]
- Zeng, J.; Liu, X.; Song, L.; Lin, X.; Zhang, H.; Shen, C.; Chu, H. Nitrogen fertilization directly affects soil bacterial diversity and indirectly affects bacterial community composition. Soil Biol. Biochem. 2016, 92, 41–49. [Google Scholar] [CrossRef]
- Cai, C.; Liu, H.; Dai, X.; Whalen, J.K. Multiple selection of resistance genes in arable soil amended with cephalosporin fermentation residue. Soil Biol. Biochem. 2019, 136, 107538. [Google Scholar] [CrossRef]
- Fierer, N.; Lauber, C.L.; Ramirez, K.S.; Zaneveld, J.; Bradford, M.A.; Knight, R. Comparative metagenomic, phylogenetic and physiological analyses of soil microbial communities across nitrogen gradients. ISME J. 2012, 6, 1007–1017. [Google Scholar] [CrossRef] [PubMed] [Green Version]
- Sun, R.; Zhang, X.X.; Guo, X.; Wang, D.; Chu, H. Bacterial diversity in soils subjected to long-term chemical fertilization can be more stably maintained with the addition of livestock manure than wheat straw. Soil Biol. Biochem. 2015, 88, 9–18. [Google Scholar] [CrossRef]
- Ma, M.; Jiang, X.; Wang, Q.; Ongena, M.; Wei, D.; Ding, J.; Guan, D.; Cao, F.; Zhao, B.; Li, J. Responses of fungal community composition to long-term chemical and organic fertilization strategies in Chinese Mollisols. Microbiologyopen 2018, 7, e00597. [Google Scholar] [CrossRef]
- Fan, K.K.; Weisenhorn, P.; Gilbert, J.A.; Chu, H.Y. Wheat rhizosphere harbors a less complex and more stable microbial co-occurrence pattern than bulk soil. Soil Biol. Biochem. 2018, 125, 251–260. [Google Scholar] [CrossRef]
- Gu, Y.; Wang, Y.; Wang, P.; Wang, C.; Ma, J.; Yang, X.; Ma, D.; Li, M. Study on the diversity of fungal and bacterial communities in continuous cropping fields of Chinese chives. BioMed Res. Int. 2020, 5, 1–14. [Google Scholar] [CrossRef] [PubMed]
- Fan, K.K.; Delgado-Baquerizo, M.; Guo, X.S.; Wang, D.Z.; Zhu, Y.G.; Chu, H.Y. Microbial resistance promotes plant production in a four-decade nutrient fertilization experiment. Soil Biol. Biochem. 2020, 141, 107679. [Google Scholar] [CrossRef]


| Treatment | Rice Season | Oilseed Rape Season | |||
|---|---|---|---|---|---|
| Chemical Fertilizer (N-P2O5-K2O) | Crop Straw (N-P2O5-K2O) | Chemical Fertilizer (N-P2O5-K2O) | Crop Straw (N-P2O5-K2O) | Boron (Na2B4O7·5H2O) | |
| NP | 180-60-0 | 0-0-0 | 180-60-0 | 0-0-0 | 15.0 |
| NPK | 180-60-90 | 0-0-0 | 180-60-90 | 0-0-0 | 15.0 |
| NPS | 180-60-0 | 19.4-3.1-142.6 | 180-60-0 | 53.4-7.8-164.3 | 15.0 |
| NPKS | 180-60-90 | 20.2-3.5-151.5 | 180-60-90 | 61.6-8.5-179.1 | 15.0 |
| Soil Properties | Treatments | |||
|---|---|---|---|---|
| NP | NPK | NPS | NPKS | |
| pH | 5.82 ± 0.03 a | 5.76 ± 0.04 a | 5.75 ± 0.03 a | 5.73 ± 0.02 a |
| SOM (g kg−1) | 29.8 ± 2.9 b | 31.5 ± 3.4 b | 32.8 ± 2.6 ab | 35.7 ± 1.4 a |
| Available N (mg kg−1) | 77.3 ± 8.9 b | 71.8 ± 8.3 b | 89.0 ± 6.3 a | 85.7 ± 7.4 a |
| Olsen-P (mg kg−1) | 9.6 ± 0.5 b | 10.1 ± 0.6 b | 11.2 ± 1.1 a | 10.4 ± 0.8 b |
| Available K (mg kg−1) | 169.5 ± 8.8 d | 183.0 ± 7.6 c | 208.0 ± 11.4 b | 254.7 ± 16.2 a |
| Slowly available K (mg kg−1) | 601.5 ± 10.3 b | 572.9 ± 14.5 c | 632.0 ± 16.7 a | 529.0 ± 14.8 d |
| EOC (g kg−1) | 5.9 ± 0.5 c | 5.1 ± 0.2 c | 7.6 ± 0.4 b | 9.5 ± 0.3 a |
| DOC (mg kg−1) | 20.8 ± 0.4 c | 22.0 ± 1.0 c | 27.0 ± 0.9 b | 30.6 ± 1.2 a |
| Microbe Type | Treatment | Richness Index | Diversity Index | Coverage | ||
|---|---|---|---|---|---|---|
| Chao1 | ACE | Simpson | Shannon | |||
| Bacteria | NP | 4463 ± 142 a | 4422 ± 135 a | 0.999 ± 0.031 a | 10.98 ± 0.06 a | 0.994 ± 0.035 a |
| NPK | 3664 ± 165 b | 3470 ± 124 b | 0.998 ± 0.045 a | 10.27 ± 0.05 b | 0.990 ± 0.051 a | |
| NPS | 4298 ± 151 a | 4128 ± 128 a | 0.998 ± 0.037 a | 10.65 ± 0.08 ab | 0.998 ± 0.048 a | |
| NPKS | 3045 ± 123 c | 2897 ± 135 c | 0.993 ± 0.033 a | 9.33 ± 0.06 c | 0.991 ± 0.044 a | |
| Fungi | NP | 535 ± 21 a | 518 ± 19 a | 0.952 ± 0.031 a | 6.45 ± 0.04 a | 1.000 ± 0.045 a |
| NPK | 298 ± 11 c | 264 ± 16 d | 0.958 ± 0.043 a | 5.82 ± 0.03 b | 1.000 ± 0.053 a | |
| NPS | 477 ± 18 b | 453 ± 21 b | 0.953 ± 0.036 a | 5.98 ± 0.04 b | 1.000 ± 0.039 a | |
| NPKS | 317 ± 16 c | 311 ± 14 c | 0.966 ± 0.045 a | 6.23 ± 0.04 ab | 1.000 ± 0.044 a | |
Publisher’s Note: MDPI stays neutral with regard to jurisdictional claims in published maps and institutional affiliations. |
© 2021 by the authors. Licensee MDPI, Basel, Switzerland. This article is an open access article distributed under the terms and conditions of the Creative Commons Attribution (CC BY) license (https://creativecommons.org/licenses/by/4.0/).
Share and Cite
Li, J.; Gan, G.; Chen, X.; Zou, J. Effects of Long-Term Straw Management and Potassium Fertilization on Crop Yield, Soil Properties, and Microbial Community in a Rice–Oilseed Rape Rotation. Agriculture 2021, 11, 1233. https://doi.org/10.3390/agriculture11121233
Li J, Gan G, Chen X, Zou J. Effects of Long-Term Straw Management and Potassium Fertilization on Crop Yield, Soil Properties, and Microbial Community in a Rice–Oilseed Rape Rotation. Agriculture. 2021; 11(12):1233. https://doi.org/10.3390/agriculture11121233
Chicago/Turabian StyleLi, Jifu, Guoyu Gan, Xi Chen, and Jialong Zou. 2021. "Effects of Long-Term Straw Management and Potassium Fertilization on Crop Yield, Soil Properties, and Microbial Community in a Rice–Oilseed Rape Rotation" Agriculture 11, no. 12: 1233. https://doi.org/10.3390/agriculture11121233
APA StyleLi, J., Gan, G., Chen, X., & Zou, J. (2021). Effects of Long-Term Straw Management and Potassium Fertilization on Crop Yield, Soil Properties, and Microbial Community in a Rice–Oilseed Rape Rotation. Agriculture, 11(12), 1233. https://doi.org/10.3390/agriculture11121233