Article

Hyperspectral Characteristics and Scale Effects of Leaf and Canopy of Summer Maize under Continuous Water Stresses

1
College of Resources and Environment, Anhui Agricultural University, Hefei 230036, China
2
Anhui Public Meteorological Service Center, Anhui Meteorological Bureau, Hefei 230031, China
3
The Weather Modification Center of Henan Province, Zhengzhou 450003, China
4
College of Applied Meteorology, Nanjing University of Information Science & Technology, Nanjing 210044, China
5
Department of Disaster Management, Begum Rokeya University, Rangpur 5400, Bangladesh
*
Author to whom correspondence should be addressed.
These authors contributed equally to this work.
Agriculture 2021, 11(12), 1180; https://doi.org/10.3390/agriculture11121180
Submission received: 14 October 2021 / Revised: 18 November 2021 / Accepted: 19 November 2021 / Published: 23 November 2021
(This article belongs to the Section Agricultural Water Management)

Abstract

:
The scale effect problem is one of the most challenging issues in remote sensing studies. However, the research on the methodology and theory of the scale effect is scarcely applied in practice. To this end, in this study, 3 years of field experimental data of continuous water stresses on summer maize were used for this purpose. Furthermore, the Prospect and Sail models were employed to investigate the scale effects of reflectance characteristics and vegetation indexes. The results indicated that the spectral characteristics of canopy and leaf of summer maize were similar under continuous water stresses at various stages. The reflectance at the canopy level was distinct from that at the leaf level, considering the soil background differences. From leaf to canopy scales, with the increase in the leaf area index (LAI), the spectral reflectance of all treatments in the visible band decreased, but increased in the near-infrared band, and the reflectance was saturated when LAI increased to 5. The reflectance difference caused by LAI variation was enlarged as the drought stress intensified in the short-wave infrared band. The spectral reflectance in the near-infrared band was susceptible to leaf inclination angle (LIA) variation and changed significantly, especially in the closed canopy. With the increase in LAI, the difference vegetation index (DVI) and normalized difference vegetation index (NDVI) values under each treatment showed a gradually increasing trend. With the increase in LIA, the DVI value decreased gradually, and the DVI value under the saturated canopy was significantly higher than that under the unclosed canopy. However, the NDVI values of all treatments did not change with LIA, mostly under the closed canopy. Overall, the results demonstrated that LAI had a more significant influence on canopy reflectance than LIA. In addition, NDVI was not able to capture the LAI and LIA information when the canopy was closed, but DVI performed better.

1. Introduction

Maize is widely cultivated worldwide, and its global yield ranks second after rice [1]. As a versatile crop, maize plays a crucial role in many fields, such as food production, economics, industry, and energy. China is among the largest maize producers in the world. The production of maize reached 2.158 × 10⁸ tons in 2014, accounting for 20% of the global maize production [2]. In addition, given population expansion, environmental development, and economic constraints, the demand for maize production will increase dramatically over the next 50 years [3]. Against the background of climate change, maize will be more sensitive to the stresses of different environments [4], considering its inherent characteristics. The yield and quality of maize decreases to varying degrees [5,6,7] under environmental stress at any stage of the whole growth period. In the growth process of maize, the crop water status mainly depends on the soil water status. Water stress is one of the most vital environmental stresses in each growth stage. Both the excess (waterlogging stress) and shortage (drought stress) of soil water will inhibit the growth of crops and eventually lead to yield loss. The changes in various physiological parameters (leaf area index (LAI), chlorophyll content (CC), leaf water potential (LWP), leaf water content (LWC), canopy temperature, the fraction of photo-synthetically active radiation (FPAR), and phenology) are the direct indicators of physiological and ecological aspects of maize under environmental stress. These can provide a potent scientific basis for accurately and efficiently monitoring the response of maize to environmental stress. However, the exact acquisition process of the above parameters is challenging and requires a considerable workforce and material resources. Moreover, data acquisition required for CC, LWP, and LWC requires destructive sampling, making it difficult to provide long-term, dynamic, and reliable datasets.
At present, as a result of climate change, the frequency and spatial pattern of drought and waterlogging will change significantly [8,9,10]. This will significantly increase the uncertainty of food security and production. Currently, the key areas that affect the development of the global economy, such as world food security, national macro policies, and drought and flood monitoring, are in urgent need of a large amount of rapid and accurate data support. Moreover, the data require spatial macrocosmic and temporal continuity, and accuracy. Remote sensing technology can fully meet the above requirements. In addition, it can also be used to quickly, efficiently, and nondestructively monitor the response of crops to extreme events such as drought and flood [11]. From the perspective of crops, the developed vegetation canopy transport model provides a reliable technical means for accurately monitoring physiological and biochemical parameters and vegetation conditions under environmental stress. Furthermore, it also provides a theoretical basis for guiding agricultural production, realizing agricultural precision, and monitoring agrometeorological disasters rapidly and precisely.
Considering most studies have focused on the effects of single drought [12] and waterlogging [6,13,14] stresses on crop physiology and production, the corresponding stress level is discontinuous. Moreover, the related studies have mainly focused on the simple quantitative analysis of physiological mechanisms. The dynamic physiological and ecological responses of summer maize to continuous water stresses is still unclear [15,16,17,18] and deserve further research.
In addition, the scale effect problem is one of the most challenging issues in remote sensing studies. This problem has not been systematically investigated, and the research on the methodology and theory of the scale effect is still rarely applied in practice. Thus, the further development of quantitative remote sensing is seriously restricted [19]. In the study area of the remote sensing monitoring of vegetation physical and chemical parameters, the problems of the scale effect are mainly due to different measurement scales. The measuring space involves leaf, canopy, and pixel scales. Due to the complexity of the surface conditions, there is no specified method to define the scale at which pixels are acquired. Moreover, the law applicable at one scale may not be applicable if it is higher or lower at another scale, considering the significant difference in surface conditions at different scales [20]. However, as a result of the improvement in remote sensing data resolution, the scale effects of leaf and canopy deserve more attention in the remote sensing monitoring process of physical and chemical parameters. For example, in the case of summer maize, the canopy structure and soil characteristics are significantly different under different water treatments, which leads to different reflectance characteristics at leaf and canopy scales. The sensitivity of the crop’s physical and chemical parameters changes with spectral reflectance at different scales. This is crucial for remote sensing monitoring of crop physical and chemical parameters at different scales. However, few in-depth studies can be found in the existing literature.
Based on a field experiment under continuous water stresses, in this study we collected the physical and chemical parameters, and leaf and canopy reflectance spectra, of summer maize. This study had four objectives: first, to analyze the leaf and canopy spectral characteristics of summer maize at different growth stages under continuous water stresses; second, to determine the spectral reflectance of summer maize at leaf and canopy scales under different leaf area index (LAI) and leaf inclination angle (LIA) coupling with the leaf radiative transport model (Prospect) and canopy radiative transport model (Sail); third, to estimate the variation characteristics of two typical vegetation indexes (DVI and NDVI) of summer maize under different LAI and LIA at different leaf and canopy scales; and fourth, to thoroughly investigate the scale effects of spectral reflectance and the vegetation index of summer maize under different leaf and canopy scales.

2. Materials and Methods

2.1. Experimental Design

The water stress experiment was carried out in the agrometeorological observation and experimental station of Nanjing University of Information Science and Technology (NUIST) (31°20′ N, 118°70′ E) during the summer maize growing season (July to October) of 2015–2017 (Figure 1). This station is located in the lower reaches of the Yangtze River. It belongs to the subtropical monsoon climate zone, with an annual average precipitation of 1100 mm and an annual average temperature of 15.6 °C. This station is equipped with a standard automatic meteorological observation. Both the length and width of each test plot are 2.5 m and the depth is 1.5 m. The gap between the plot is reinforced concrete to prevent water leakage and isolation. Loamy clay was used to fill the plot; the maximum field capacity was 27.57%; the soil’s wilting moisture, clayey content, and pH (H2O) were 11.0%, 26.1%, and 6.1 ± 0.2, respectively; and the organic carbon and total nitrogen contents were 19.4 and 11.5 g·kg−1, respectively. A removable shelter is equipped above the plot to prevent the impact of precipitation. The tested maize variety is the local dominant variety, namely Jiangyu 403, and each plot was evenly sown with 40 maize plants (5 rows and 8 columns). The seeds were sown around 6 July every year.
In order to preserve and strengthen the seedlings, the water stress experiment began from the late jointing stage of the maize, and the soil water was irrigated to 80–90% of the field capacity (FC). The water treatment was started five days after the jointing stage until the summer maize was harvested according to the percentage of FC, and there were three replicates for each treatment. Five continuous water treatment levels were set in the experiment, namely, W1 (severe drought stress, 35% to 45% FC), W2 (moderate drought stress, 50% to 60% FC), W3 (mild drought stress, 65% to 75% FC), W4 (CK, full water supply, 80% to 90% FC), and W5 (mild flooding, 95% to 105% FC). The specific irrigation scheme is shown in Table 1.
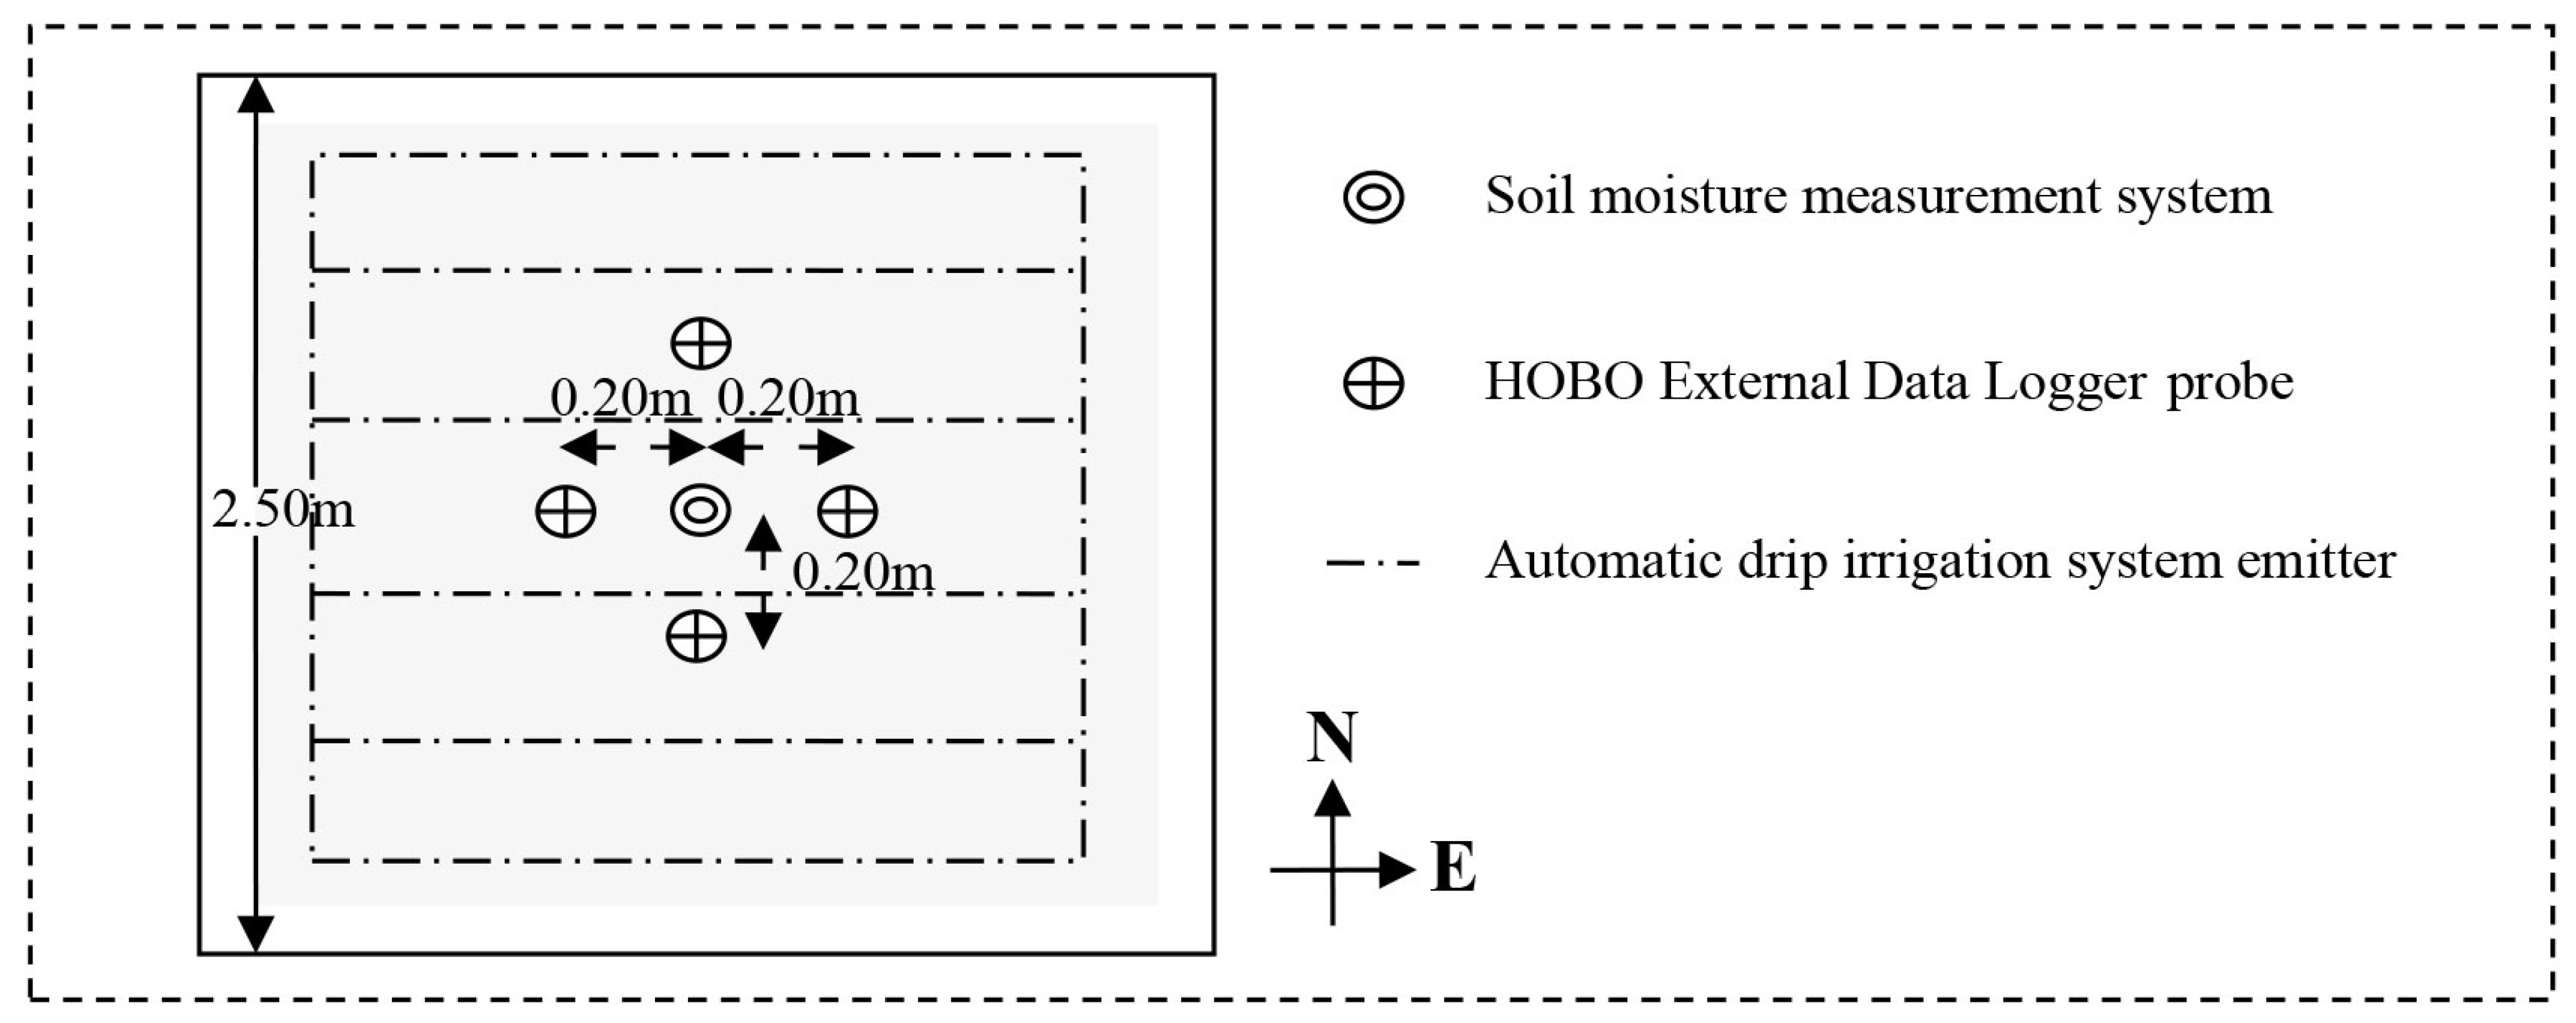
Each plot is equipped with a soil moisture data sensor, which automatically collects and records the average soil moisture content every 60 min. The data is transmitted to the CR1000 data collector to calculate the real-time irrigation amount of different treatments. The PVC water pipes with small holes distributed evenly in the plot are controlled for automatic irrigation. In addition, the drying weighing method is used to measure the soil moisture manually every 3–5 days to correct the data of the sensor and data collector. Moreover, a set of soil temperature observation systems composed of 3 Hobo External Data Logger probes and 1 Watchdog button sensor is used to monitor the soil temperature in real time and realize simultaneous observation of water and heat. The specific layout of automatic observation instruments in each plot is shown in Figure 2.

2.2. Observation Items

2.2.1. Leaf Area

Three flag leaves were collected in each treatment, then sealed in a plastic bag and placed in a cold and dark container to prevent water loss as much as possible. The leaf area was measured by a LI-3000C portable area meter.

2.2.2. Leaf Fresh Weight and Dry Weight

Three flag leaves were selected and freshly weighed, and then the samples were bagged and placed in a thermostatic drying oven for heating. The temperature was controlled at 100–105 °C for the first hour and then maintained at 70–80 °C for the remaining time. The dry weight was measured after 24 h.

2.2.3. Leaf Equivalent Water Thickness

Three flag leaves were selected for each plot and freshly weighed, and then the samples were bagged and placed in a thermostatic drying oven for heating. The leaf equivalent water thickness was obtained by subtracting the leaf fresh weight from the dry weight and then dividing by the leaf area.

2.2.4. Dry Matter Content

Three flag leaves were selected for each plot and freshly weighed, and then the samples were bagged and placed in a thermostatic drying oven for heating. Dry matter content was obtained by dividing the leaf dry weight by the leaf area.

2.2.5. Chlorophyll Content

From each plot, three leaves were sampled randomly during each growing stage. Leaf samples were sealed in plastic bags and kept in an icebox at about 0 °C for subsequent biochemical analysis to extract the leaf chlorophyll content. We first punched around 6 leaf discs of known area (about 2.54 cm2), and they were ground into a homogenate until the tissue became white in a mortar with quartz sand, CaCO3 powder, and 2–3 mL ethanol of 95%. The homogenate and the residue were filtered into a brown volume bottle of 10 mL for the subsequent absorbance measurements. Spectral absorbance was measured at 470, 649, and 665 nm using a Shimadzu UV-1700 spectrophotometer (Shimadzu Inc., Kyoto, Japan) [21]. The chlorophyll content of maize measured by SPAD-502 chlorophyll meter (Konica Minolta, Osaka, Japan) was used as a reference.

2.2.6. Canopy Spectral Reflectance

During each daily variation measurement after water treatment, FieldSpec4 (Analytical Spectral Devices, Inc., Boulder, CO, USA) was used to measure the canopy spectral reflectance. The sensor probe was vertically downward, and the vertical height from the probe to the maize canopy was about 4.0 m. The fiberoptic field of view (FOV) angle was set as 25°, and then the sampling spectrum of each plot with a diameter of about 2 m was obtained. The test was carried out under sunny, cloudless, windless, or low wind conditions and repeated 3 times. The measurement time was 11:00–13:00 and 15 sample spectra were recorded at a time interval of 2 s. The average value was taken as the spectral reflectance of each treatment, and the standard whiteboard correction was carried out in time during the measurement process. The specific operation is outlined in Chou et al. [22].

2.2.7. Leaf Spectral Reflectance

FieldSpec4 was used to measure leaf spectral reflectance in each diurnal variation measurement process after water treatment. In each plot, three representative plants were randomly selected, and 1 leaf from each plant was selected, then sealed in a plastic bag and placed in a cold and dark container to prevent water loss as much as possible. In a dark room, the leaf spectrum was measured by fixing the measurement angle and distance under the PRO Lamp light source provided by FieldSpec4. Each test was repeated three times, and 15 sample spectra were recorded at a time interval of 2 s. The average value was taken as the spectral reflectance of each treatment. The standard whiteboard correction was carried out in time during the measurement process.

2.3. Vegetation Index

In this study, typical spectral indexes, differential vegetation index (DVI) as the representation of a linear index and the normalized differential vegetation index (NDVI) as the representation of a non-linear index, were selected to analyze their scale effects with different LAI or LIA changes under continuous water stresses. The specific calculation formulas are as follows:
DVI = R NIR R RED
NDVI = R NIR R RED R NIR + R RED
where R NIR represents the reflectance in the near-infrared band, R RED represents the reflectance in the red band.

2.4. Statistical Analysis

The correlation coefficient was derived by correlation matrix analysis through OriginPro software (version 2016, OriginLab Co., Northampton, MA, USA). The significant differences between treatments were determined by one-way Analysis of Variance (ANOVA) followed by the Least-Significant Difference (LSD) test. All data were examined for assumptions of normality, and we completed homogeneity tests before these analyses were carried out.

3. Results and Discussion

3.1. Hyperspectral Characteristics of Summer Maize at Different Growth Stages

3.1.1. Variation Characteristics of Leaf Spectrum

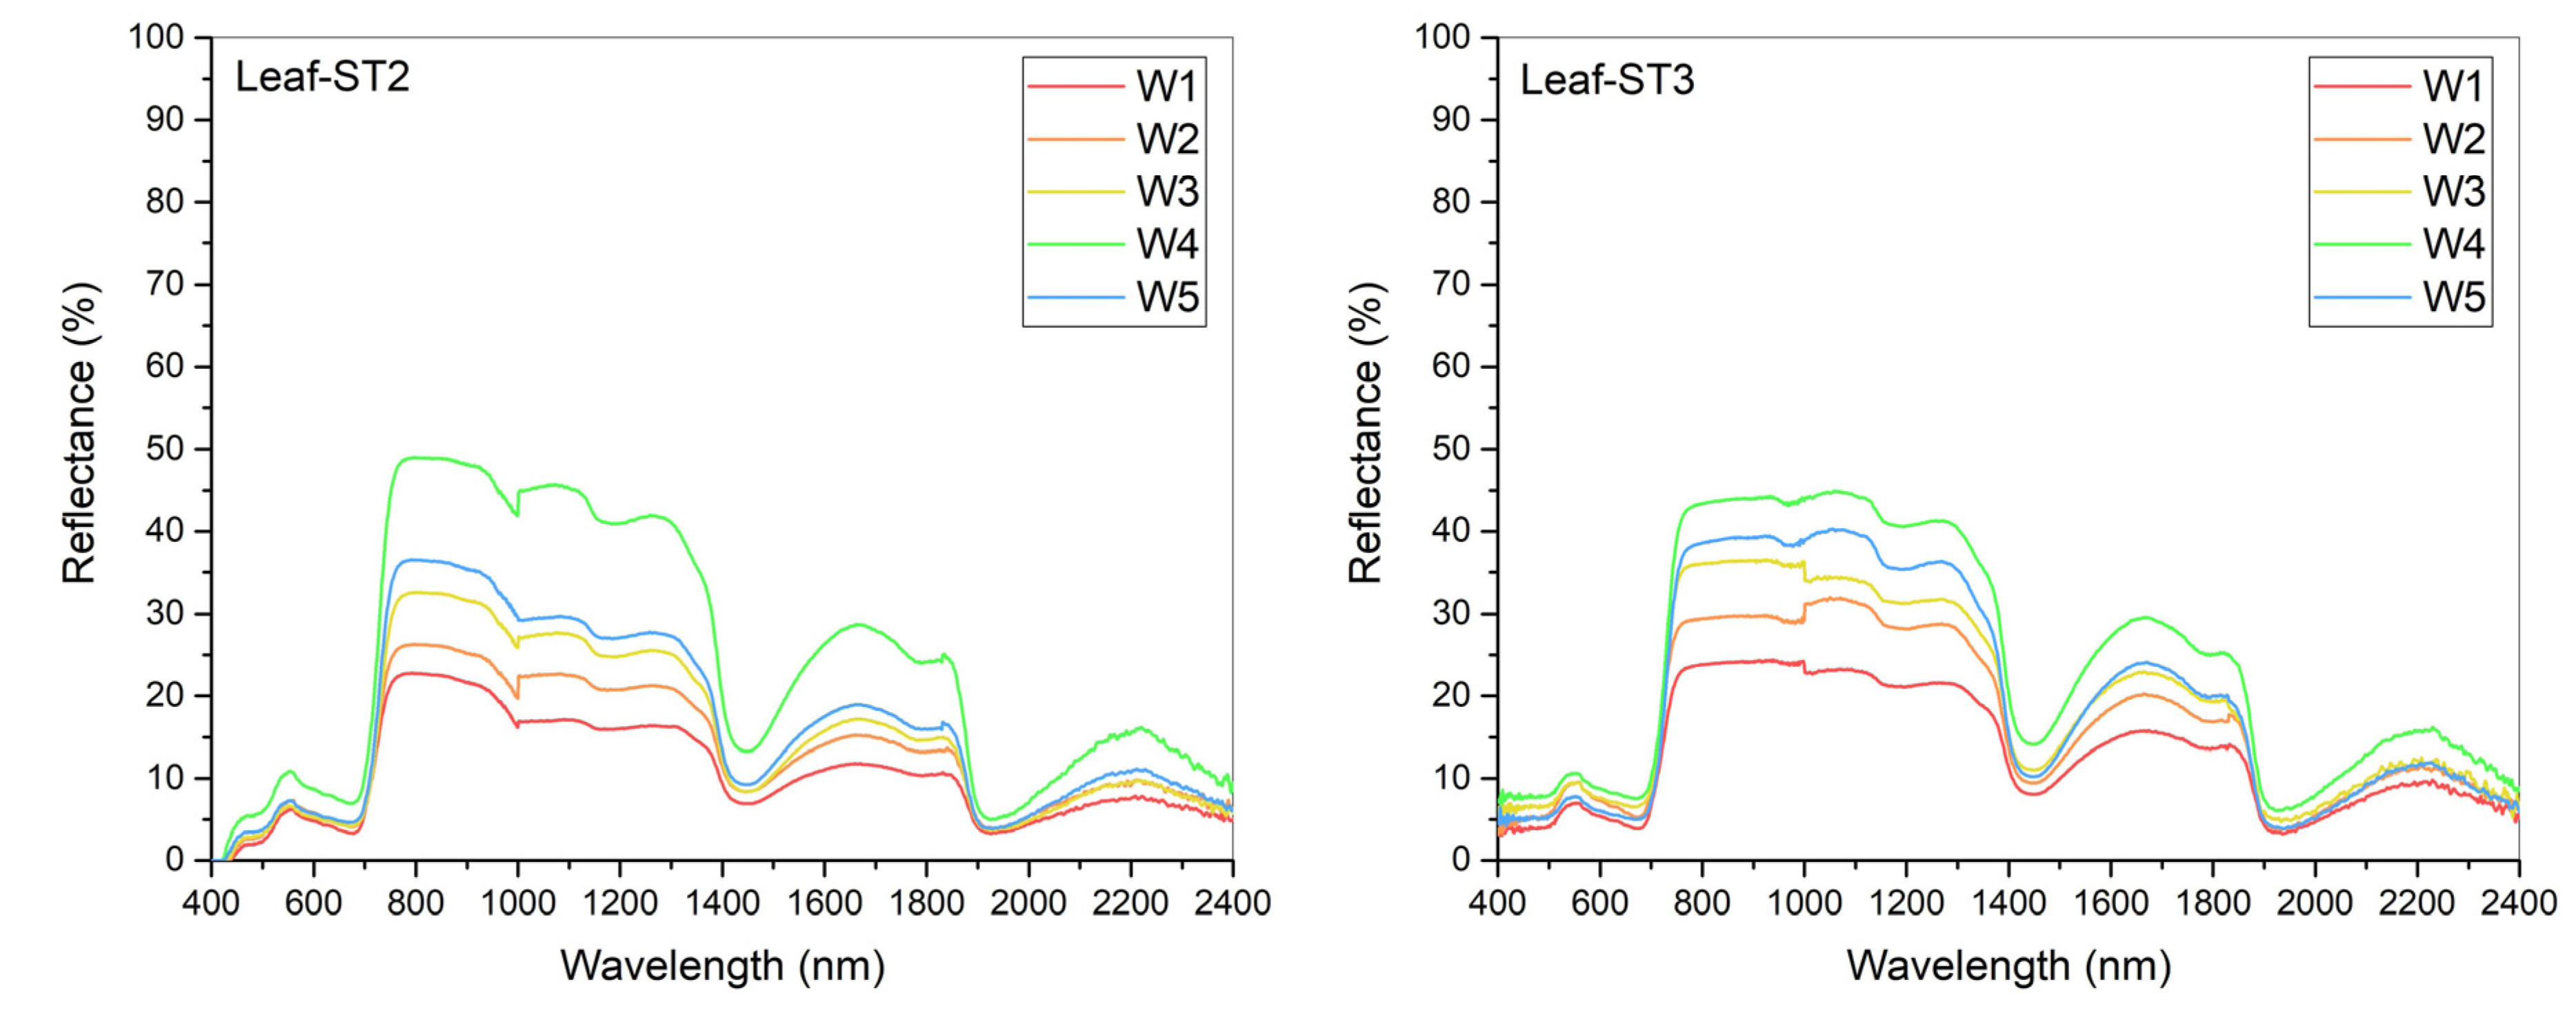
Due to the lack of a leaf spectrum in the vegetative growth stage (ST1), the leaf spectral characteristics at the tasseling-silking stage (ST2) and maturity stage (ST3) were analyzed. As shown in Figure 3, in the above two growth stages, the leaf spectral characteristics of summer maize under all treatments were largely similar. However, differences still existed, especially in the water-sensitive band around 1450 nm. The vegetation reflectance spectrum showed a decreasing feature due to leaf water content [23] and formed the water absorption depth and area. This absorption depth and area between different treatments presented the following order: W4 > W5 > W3 > W2 > W1. This phenomenon was consistent with the previous study [24], because the absorption depth and the area of leaf spectrum at 1450 nm were used to diagnose the leaf water content, and the two parameters are proportional to the leaf water content [25,26]. In addition, as can be seen from the near-infrared reflectance (NIR) band, the leaf reflectance of summer maize under different treatments is also displayed in the same order, and the difference between the leaf spectral characteristics under different treatments was small. However, the two measurements in the visible band were inconsistent with the chlorophyll content in the previous study [24]. This may be caused by the light source problem during the observation and leaf curl. Therefore, our study demonstrated that the physical and chemical parameters of summer maize under different water treatments used in the radiation transfer model (Prospect) were reliable [27,28]. Thus, the leaf spectral reflectance under different treatments was then simulated.

3.1.2. Variation Characteristics of Canopy Spectrum

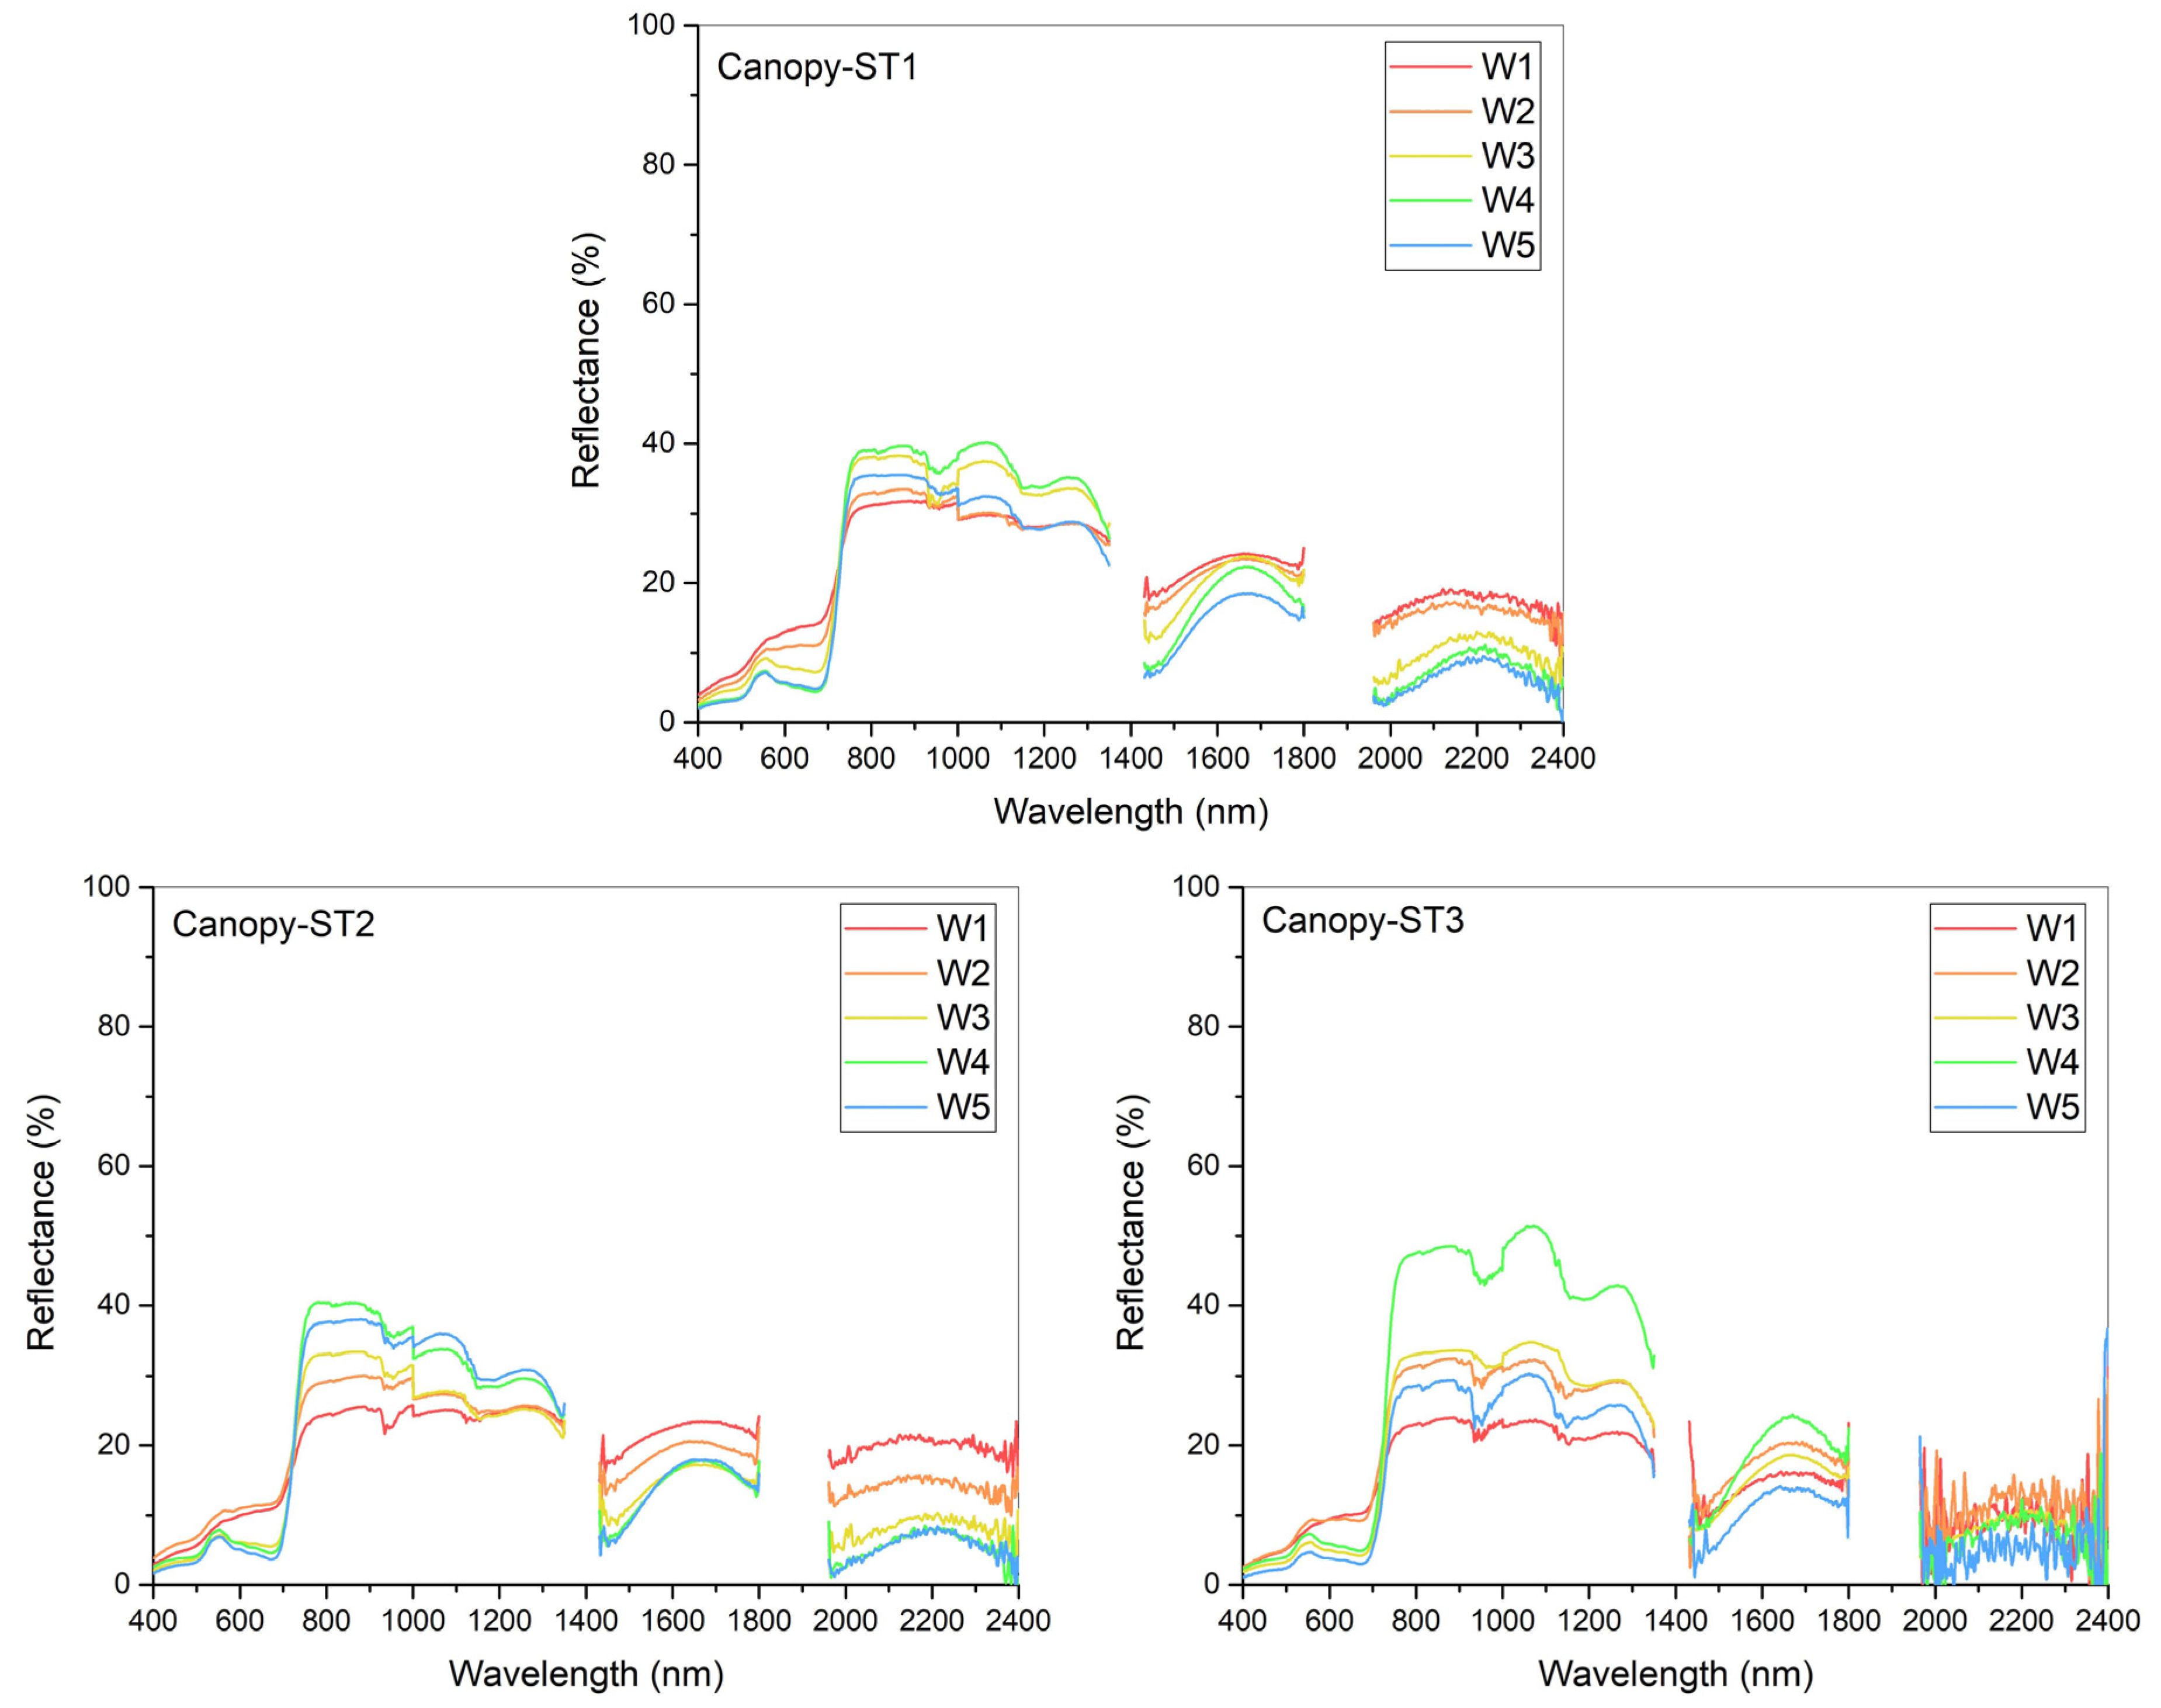
As shown in Figure 4, the canopy spectral characteristics of summer maize at different growth stages and under different treatments are basically similar. The reflectivity under all treatments was higher in the green band and lower in the blue and red bands under the visible band. Among these, the reflectivity under W4 and W5 treatments was significantly lower than that of other treatments, which was mainly due to the higher chlorophyll concentration [29,30]. Water stress is one of the major environmental stressors that significantly and systematically affects the crop, damages the photosynthetic membrane, and reduces the chlorophyll content [31,32]. However, the reflectance in the visible band can be attributed to a change in chlorophyll content. The reflectance is highly related to the water level in the visible band, where pigments are absorbed maximally. This is consistent with the conclusion drawn by Zygielbaum et al. [33]. Furthermore, due to the lower LAI under W1 and W2 treatments, the reflectance of W1 and W2 treatments was increased significantly, especially in the red band. In the ST3 stage, however, the reflectivity of W3 and W5 treatments in the visible band were both lower than that of the W4 treatment, which may be caused by the problem of the measurement points selected by the W4 treatment and the lower LAI of W5, so that the waterlogging surface features were captured. In the red band, it is difficult to distinguish the differences between different treatments, and methods such as the Gaussian model [34,35], polynomial function model, a differential technique [36], or interpolation method [37] should be used to extract them. In the near-infrared reflection band, because the reflectance here mainly depends on leaf structure and LAI, the canopy reflectance of W4 in this band is higher than that of other treatments, whereas W1 is significantly lower than other treatments. This phenomenon is consistent with Feng et al. [38], who pointed out that the reflectance of maize under drought stress is obviously lower than that of the contrast group in the 780–1350 nm high-reflecting region of the near-infrared band. From the band after 1350 nm, the value of reflectivity is basically consistent with the water treatment gradient. Moreover, in ST3, the reflectivity in the near-infrared region under water stress and W4 treatment showed the largest difference. The above phenomenon may be explained by the fact that the stress accumulated for the longest time in this stage, and saw the largest LAI difference caused by drought and mild waterlogging, which inhibited the internal structure and chlorophyll content to different degrees.

3.2. Spectral Reflectance Characteristics of Maize Leaf and Soil under Continuous Water Stresses

In this study, the leaf reflectance of summer maize was simulated using the Prospect model by input field observation parameters. Then the leaf reflectance and corresponding soil reflectance under continuous water stresses were analyzed. Specific parameters employed in the Prospect model are listed in Table 2.
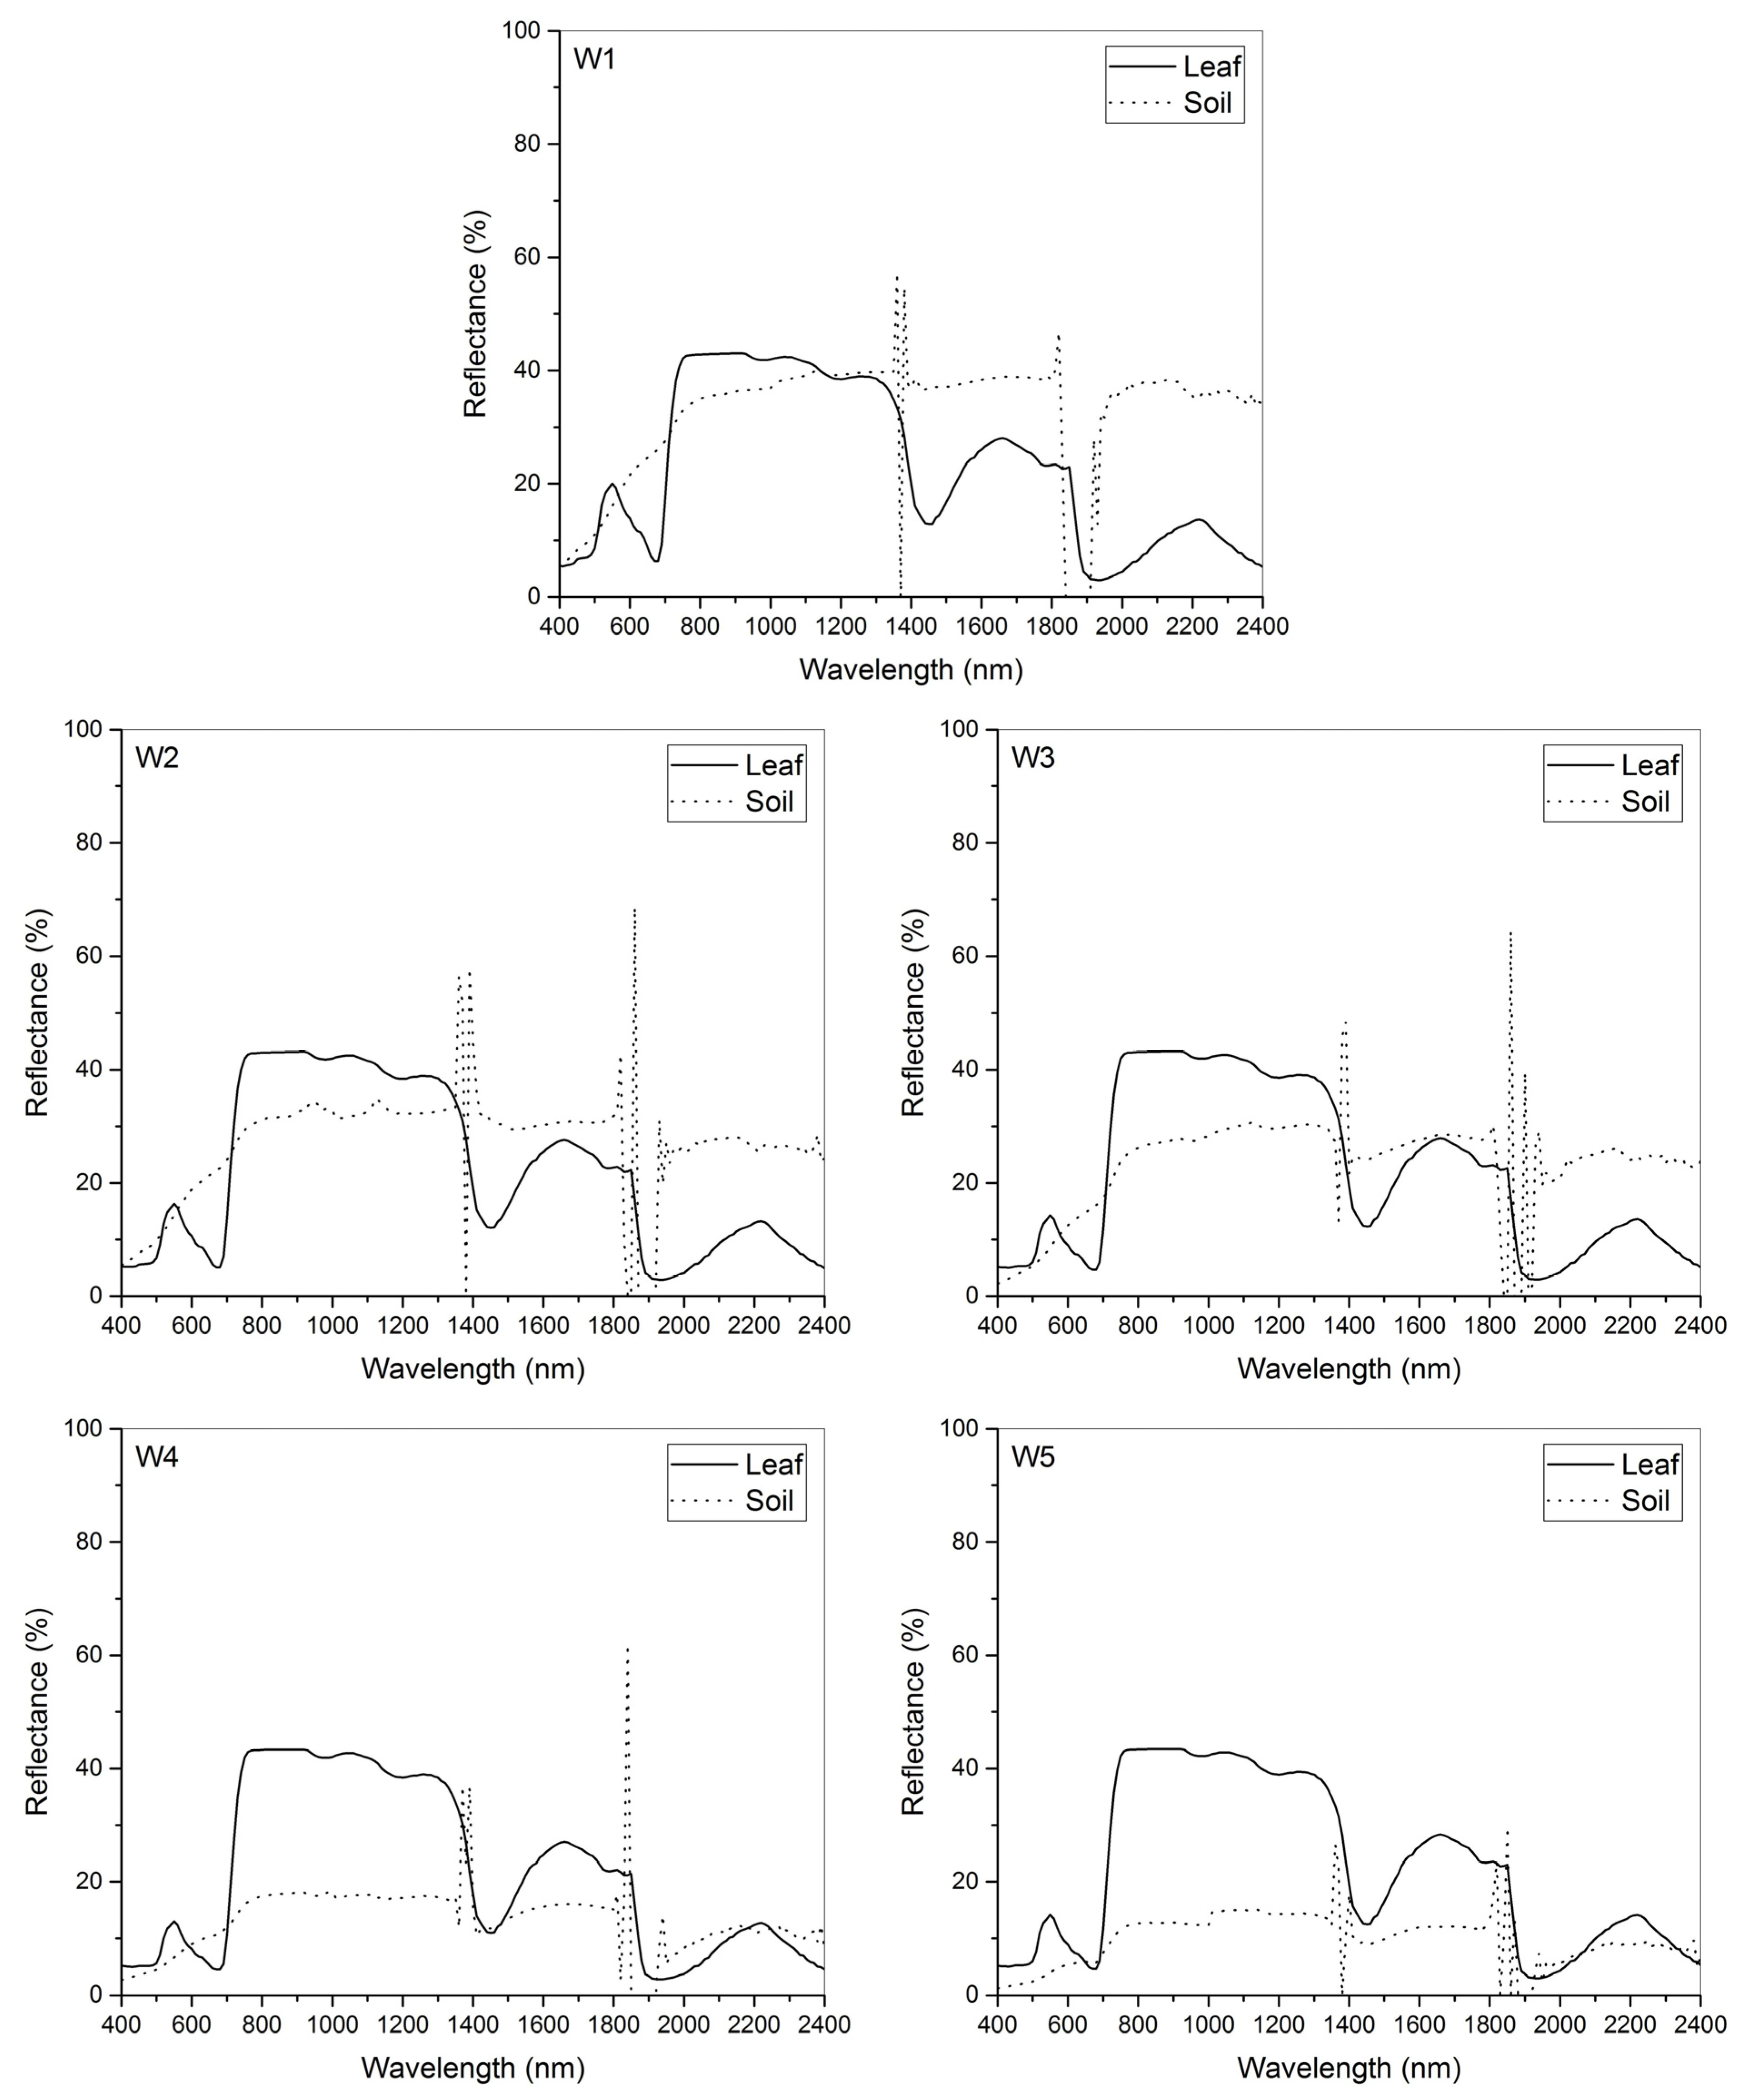
According to Table 2, the leaf and soil reflectance under continuous water stresses are calculated and presented in Figure 5. As seen in Figure 5, the highest difference in leaf reflectance among different water stresses of summer maize was shown in the visible spectrum band, followed by the reflectance in the short-wave infrared band. Based on the study of predecessors, the absorption depth and area in the water-sensitive spectrum (around 1450 nm) were positively correlated with leaf water content and were also recommended to diagnose the leaf water condition [25,26]. As shown in Figure 3, the absorption depth and area in 1450 nm showed the following trend: W4 > W5 > W3 > W2 > W1. This trend is consistent with the leaf water content. In addition, a similar trend was also found in the near-infrared spectrum reflectance. Furthermore, the difference in the soil reflectance among each water treatment is evident. The soil reflectance follows the order of decreasing trend: W1 > W2 > W3 > W4 > W5, which is closely related to the soil water treatment level. Therefore, the reflectance in canopy level under different water stresses will be distinct from that in the leaf level, considering the soil background differences.

3.3. Influences of Different Canopy Characteristics on Spectral Reflectance

From leaf to canopy scales, the main influencing factors include the canopy structure characteristics (such as LAI and LIA), soil background information, and light and observation angle information. In this study, the Prospect [39] and Sail models were integrated to simulate the changes in canopy spectral reflectance with different LAI and LIA conditions. The scale effects existing between leaf and canopy scales were analyzed in this research. Furthermore, considering the particularity of soil characteristics under continuous water treatment, on the basis of collecting soil reflectance datasets, the effects of different LAI and LIA on spectral reflectance and spectral index are analyzed in the following sections according to the soil background of different water treatments.

3.3.1. The Impact of LAI on the Spectral Characteristics of the Leaf-Canopy Scale

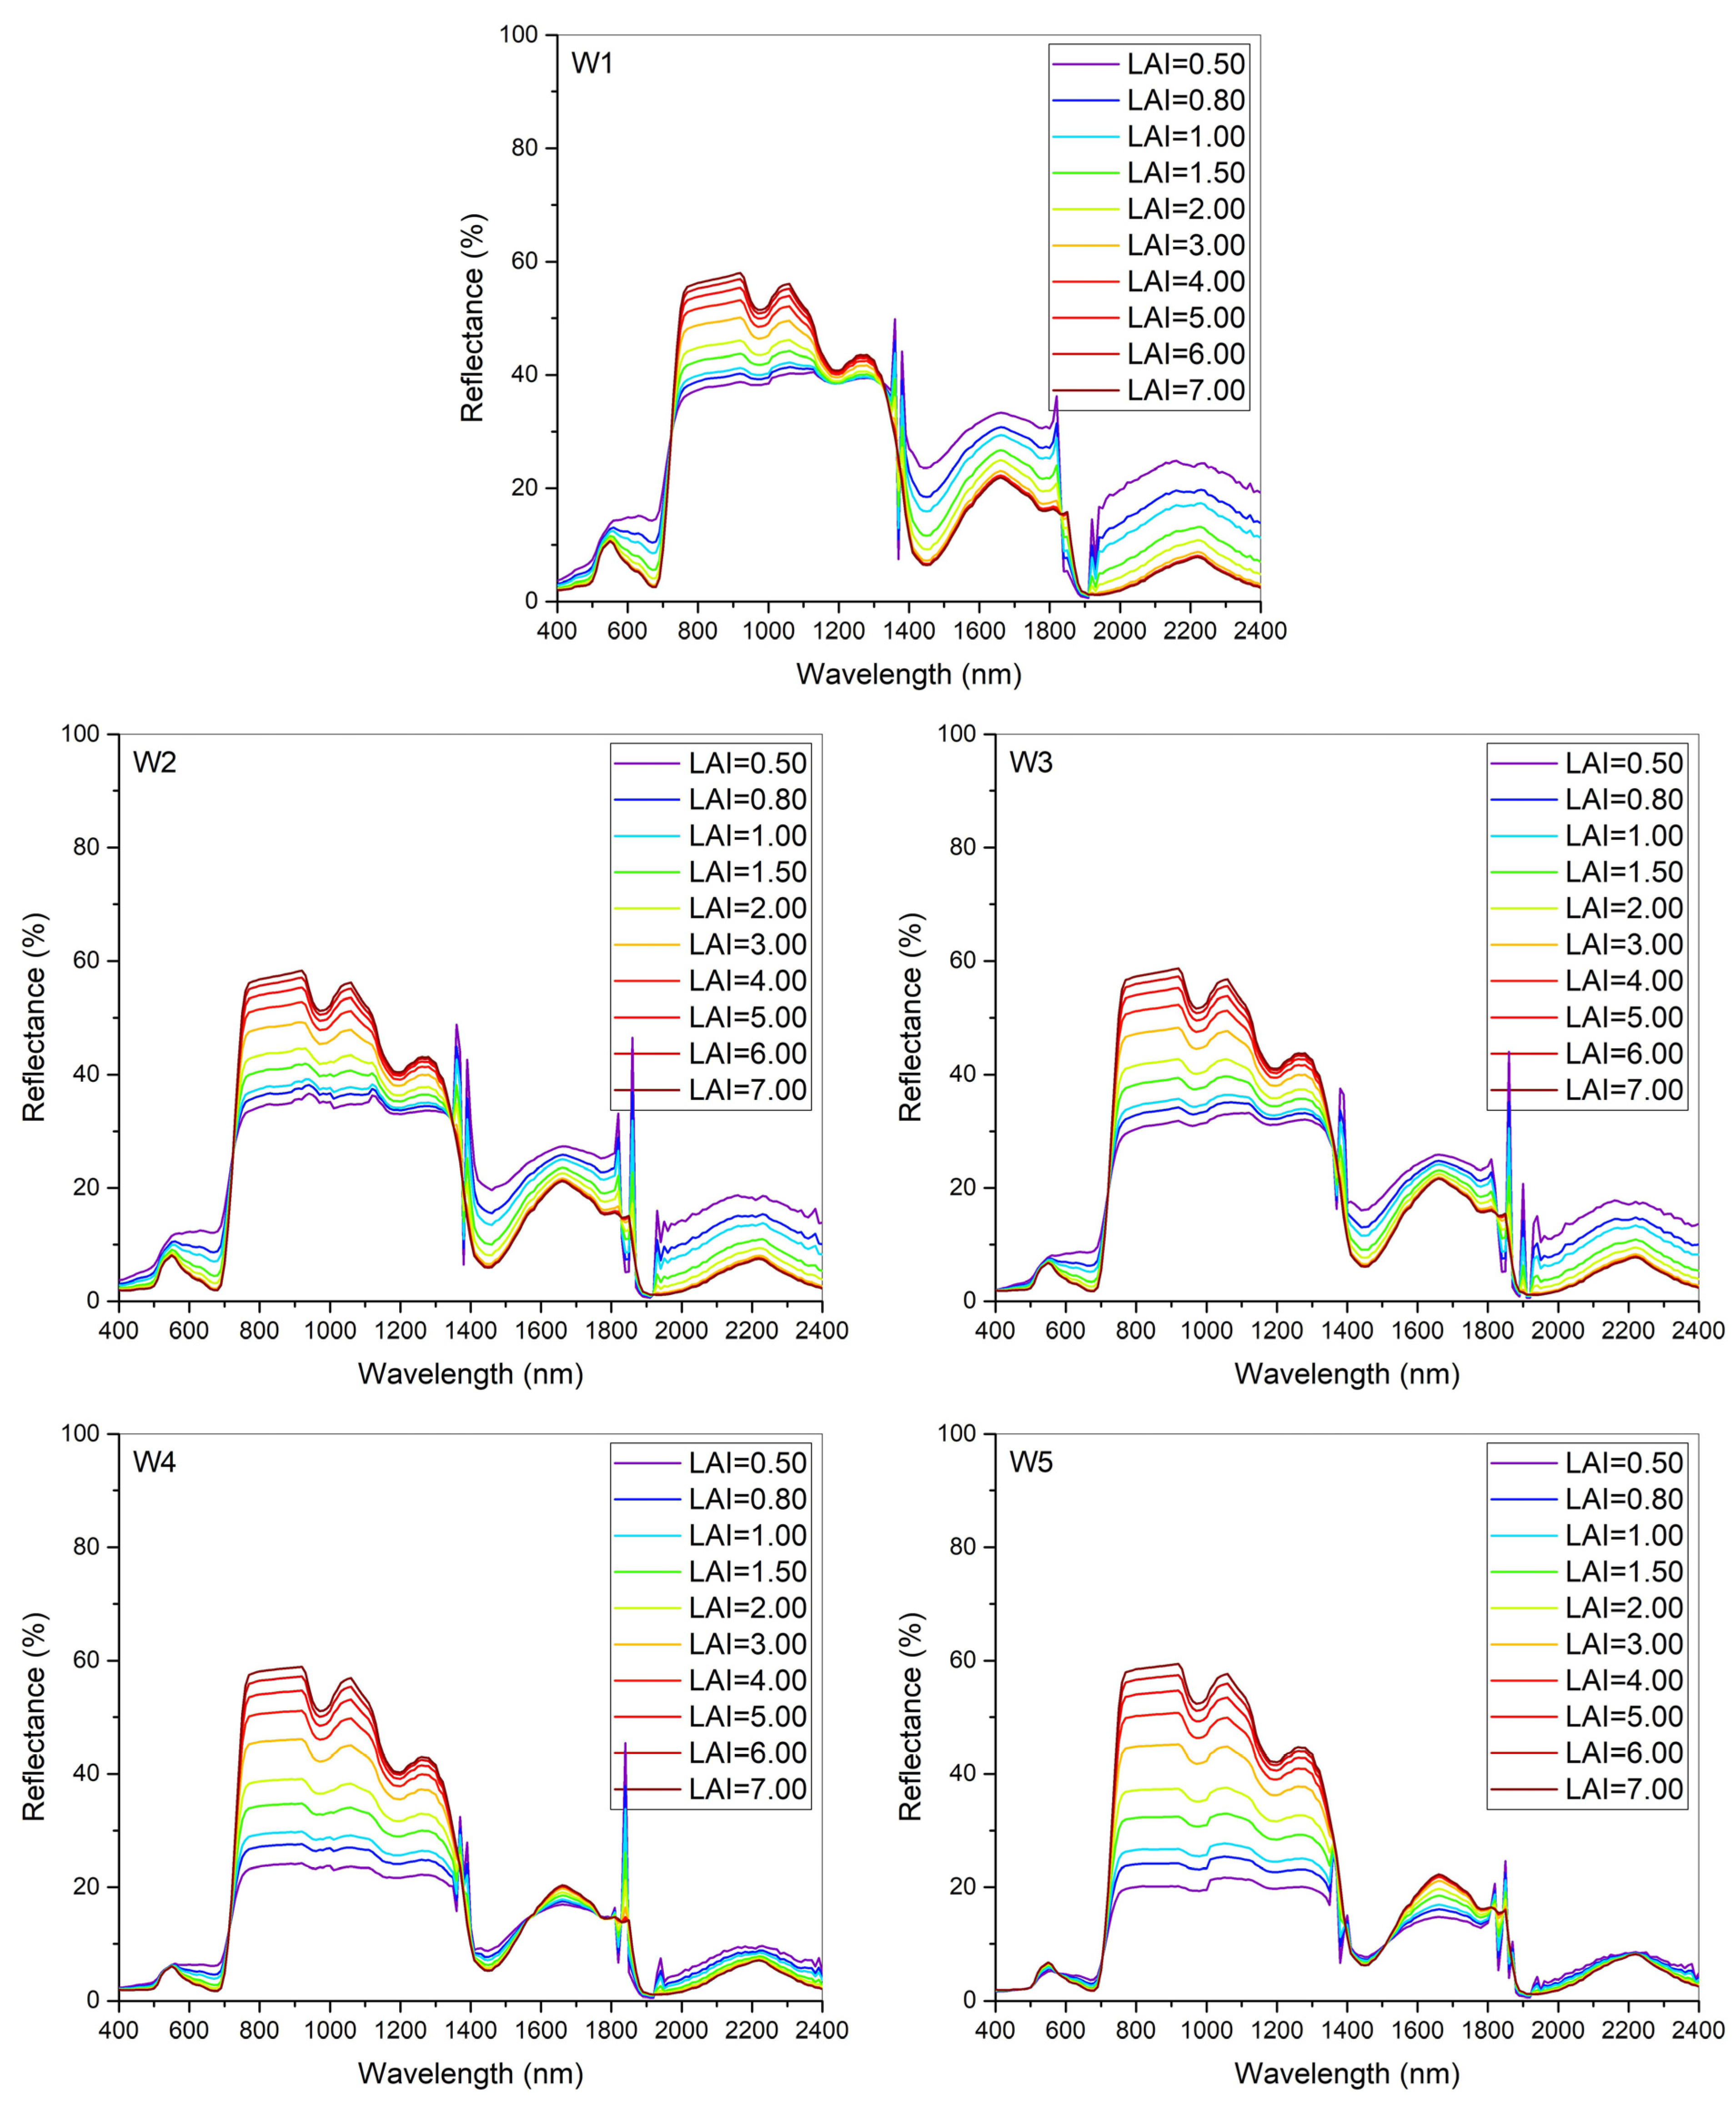
The LAI is one of the most critical parameters affecting the spectral reflectance change when upscaling the observation from leaf to canopy levels. In order to exclude the influence of other factors, other parameters were set as fixed values according to observation data, and LAI was set as 0.50, 0.80, 1.00, 1.50, 2.00, 3.00, 4.00, 5.00, 6.00, and 7.00. Studies have revealed that LAI is crucial for appraising vegetation water levels [40]. Jong et al. [41] also reported that LAI can be essential for estimating leaf-canopy characteristics using hyperspectral remote sensing. Then, the canopy reflectance under different water stresses was simulated. The specific parameters are listed in Table 3.
As shown in Figure 6, although the basic characteristics of canopy reflectance were similar, the canopy spectral reflectance of summer maize under different treatments varied greatly with LAI.
In the visible band, as LAI increased, the reflectance of each treatment gradually decreased, especially in the drought treatments (W1, W2 and W3). However, when LAI was greater than 4, the reflectance of this band reached saturation, and the reflectance in the green band showed a trend of W1 > W2 > W3 > W5 > W4, which was consistent with the trend of chlorophyll content [24]. With the increase in soil moisture, the reflectance difference caused by different LAI decreased, especially in the red band. This phenomenon is mainly due to the canopy spectrum in this band being influenced by both the characteristics of leaf and soil. The reflectance of this band decreased gradually with the increase in soil moisture content. In addition, due to the strong absorption of chlorophyll, this band also belongs to the low reflectance region. Therefore, when the soil moisture was relatively high, the reflectance of this band was relatively low, whether LAI was high or low. On the contrary, the reflectance at the red band is relatively high, and when LAI is small, the canopy reflectance is greatly affected by the soil reflectance and is also relatively high.
From the near-infrared reflectance band, the reflectance between each treatment was increased significantly with the increase in LAI. When the LAI was greater than or equal to 5, the increasing trend of reflectance was non-significant and the reflectance tended to be saturated gradually. When the reflectance was saturated, the reflectance difference between each treatment was not noticeable. However, when the canopy was not closed (LAI < 2), with the increase in LAI, the variation magnitude of canopy reflectance under drought treatment was smaller than that under W4 and W5 treatments. This is mainly because the reflectance under the drought treatment increased with the intensification of the drought in the near-infrared band, and the difference between the soil and vegetation reflectance in this band was smaller than that in the treatment with sufficient water. Therefore, when the canopy was not closed, the reflectance of this band did not change so much. For the treatment with high soil moisture (e.g., W4 and W5), due to the low soil reflectance in this band, when the canopy was not closed, the corresponding reflectance increased significantly with the increase in LAI.
From the short-wave infrared band (1400–2400 nm), under the drought treatment, the reflectance difference caused by different LAI increased with the intensification of drought stress. Furthermore, the reflectance gradually decreased with the increase in LAI, and it tended to be saturated when LAI was equal to 4. This is mainly due to the high reflectance of the soil with low water content and the low reflectance of the vegetation in this band. When LAI was relatively low, the soil background greatly influenced the canopy, leading to a high reflectance. In addition, when the canopy is not closed, the canopy reflectance varied significantly with different LAI. Under W4 treatment, the reflectance in this band varied small with different LAI. Under W5 treatment, the reflectance increased with the increase in the LAI, and reached saturation when the LAI was equal to 4. The main reason for this is the soil background’s low reflectance under the waterlogging treatment, whereas the vegetation had a higher reflectance. When the canopy is not closed, the soil reflectance background information weakens gradually with the increase in LAI, and the canopy reflectance gradually increases.
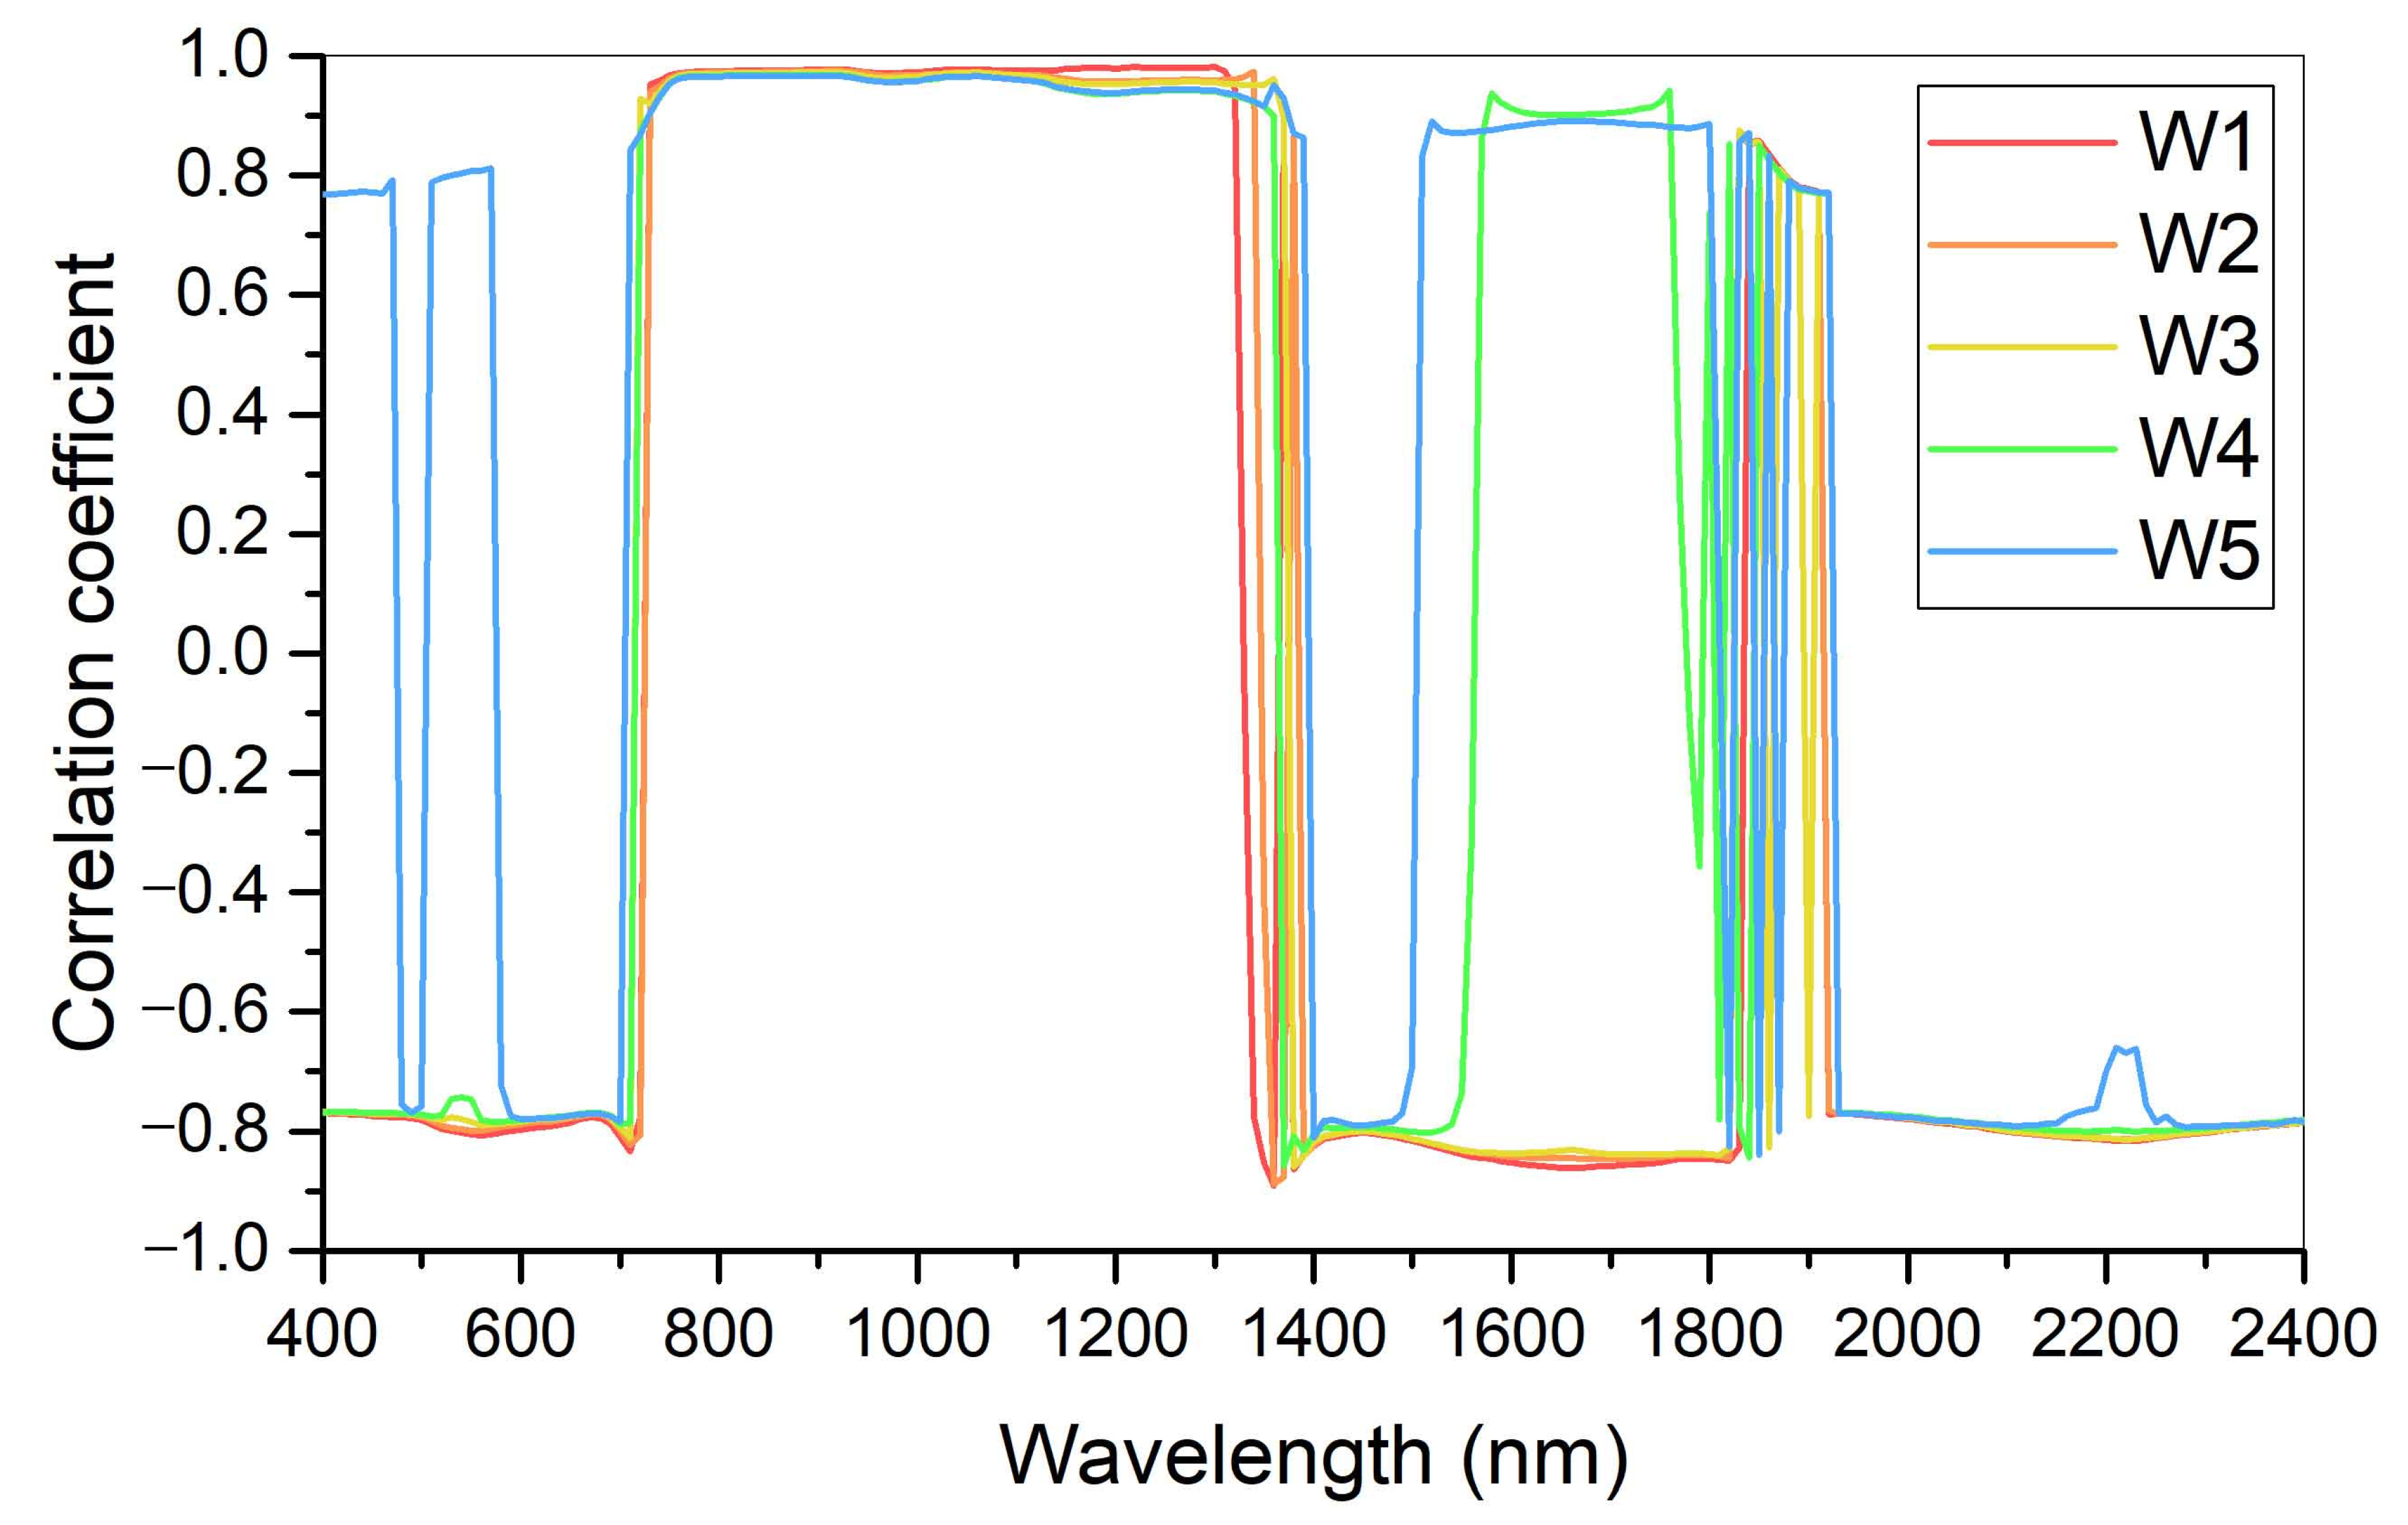
Further, from Figure 6, the canopy spectral reflectance changed with LAI in different treatments, especially in visible and short-wave infrared bands. We investigated the quantitative relationship between LAI and the canopy spectral reflectance by introducing the correlation coefficient. In Figure 7, the correlation coefficient was negative for all treatments except for W5 in the visible band. The average correlation coefficient values in the visible band were −0.79, −0.78, −0.78, −0.77, and −0.02 for W1, W2, W3, W4, and W5, respectively. The abnormal value of W5 may be due to the mild flooding treatment. In the near-infrared reflectance band, correlation coefficient values were the highest among all bands; the specific average correlation coefficient values were 0.98, 0.97 0.97, 0.97, and 0.96 for W1, W2, W3, W4, and W5, respectively. Xiao et al. [42] also discovered that the LAI was the dominant factor of canopy reflectance variation in the near-infrared reflectance band. He et al. [43] and Dian et al. [44] also suggested the canopy reflectance varied distinctly with LAI in the near-infrared reflectance band. Previous research found negative correlations between canopy reflectance and LAI at 1400–1800 nm [43,45]. Moreover, in our research, negative correlations between canopy reflectance and LAI were shown in W1, W2, and W3 treatments in 1400–1800 nm. The specific average values were −0.84, −0.83, and −0.83 respectively. In W4 and W5 treatments, the correlations between canopy reflectance and LAI were positive in most regions of 1400–1800 nm. This was the result of dry matter and water content differences induced by different water treatments. This was consistent with Xiao et al. [42]. They also found the dominant factor of canopy reflectance changed from LAI to dry matter in near-infrared and mid-infrared reflectance bands.
In general, when the leaf scale is upscaled to the canopy scale, the spectral reflectance is significantly influenced by LAI. In the near-infrared reflectance band, the correlation coefficient values between canopy reflectance and LAI were the highest. The correlations were influenced by water stress in visible and short-wave infrared bands. Considering the scale effect, revising or modifying the variation law of spectral reflectance from leaf scale to canopy scale is also necessary.

3.3.2. The Impact of LIA on the Spectral Characteristics of Leaf-Canopy Scale

As a tall and broadleaf crop, summer maize’s LIA magnitude and distribution affects the interception of sunlight, further influencing the photosynthetic efficiency and yield [46,47,48]. The distribution of LIA can induce reflectance change from leaf scale to canopy scale. Therefore, we considered the canopy closure (namely, we set LAI as 1 for the unclosed canopy and 4 for the closed canopy), then set the LIA as 25°, 35°, 45°, 55°, 65°, and 75°, to simulate the canopy reflectance under continuous water stresses. The specific parameters are shown in Table 4.
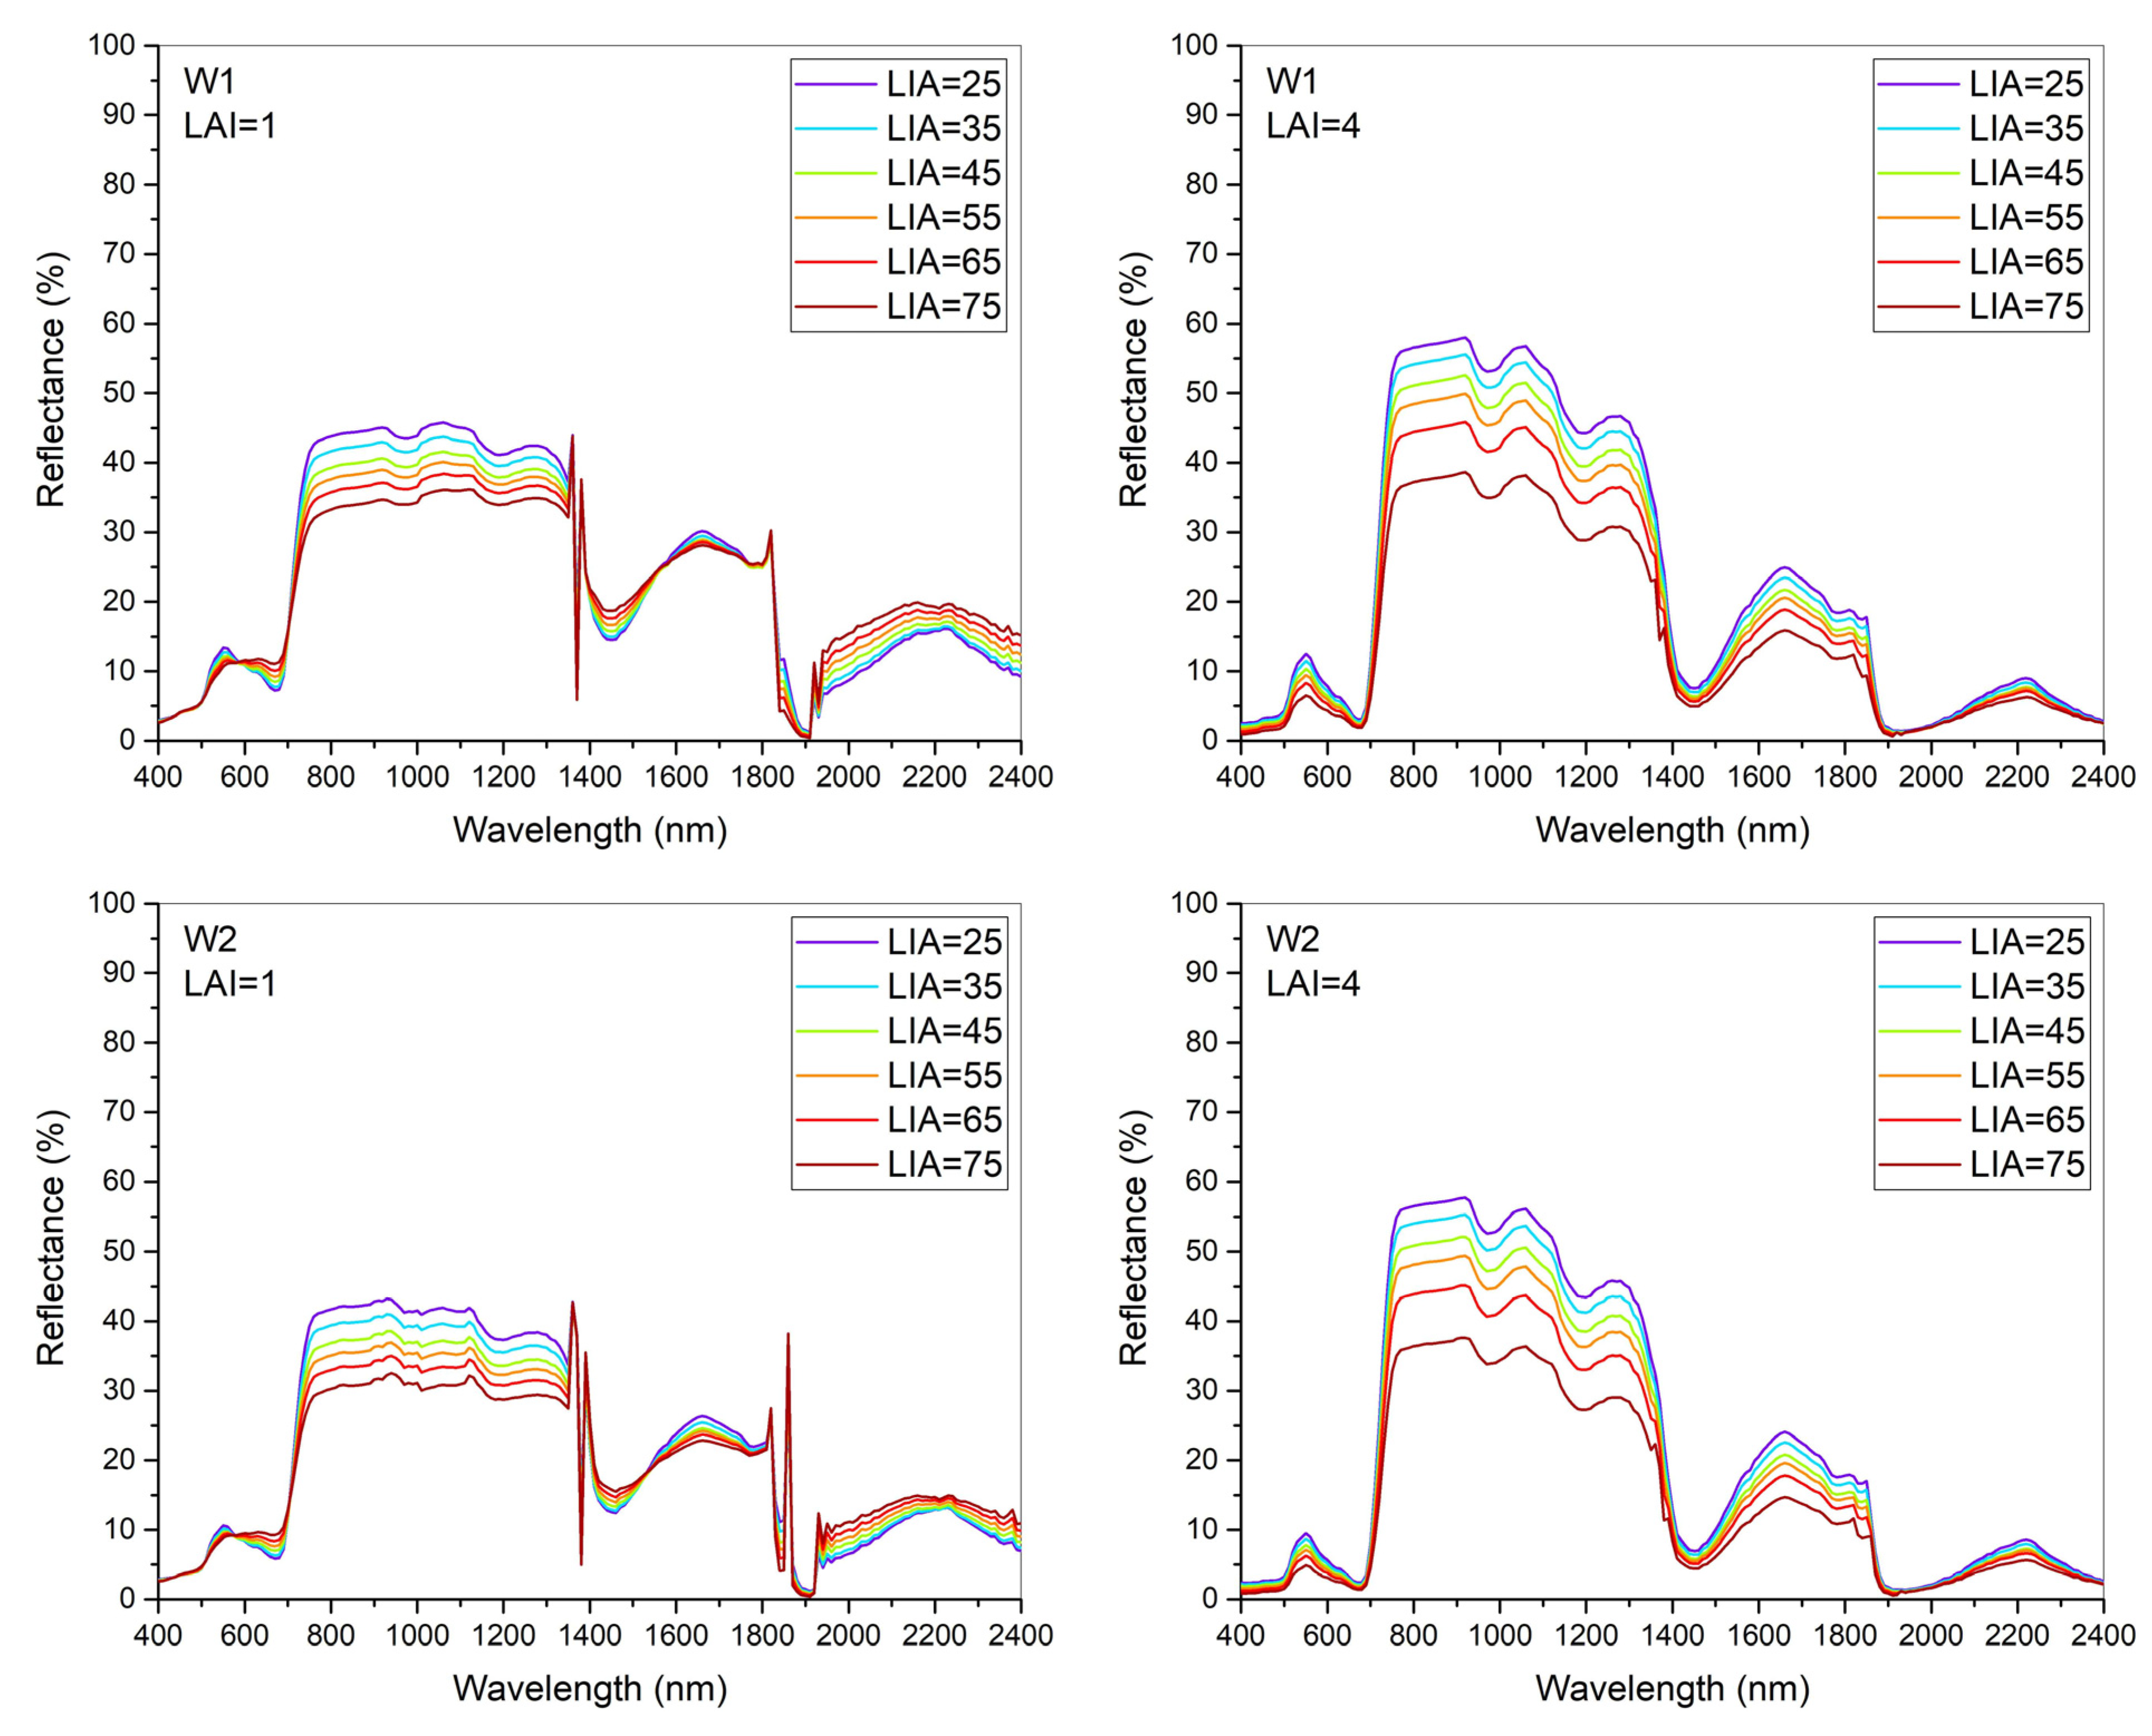
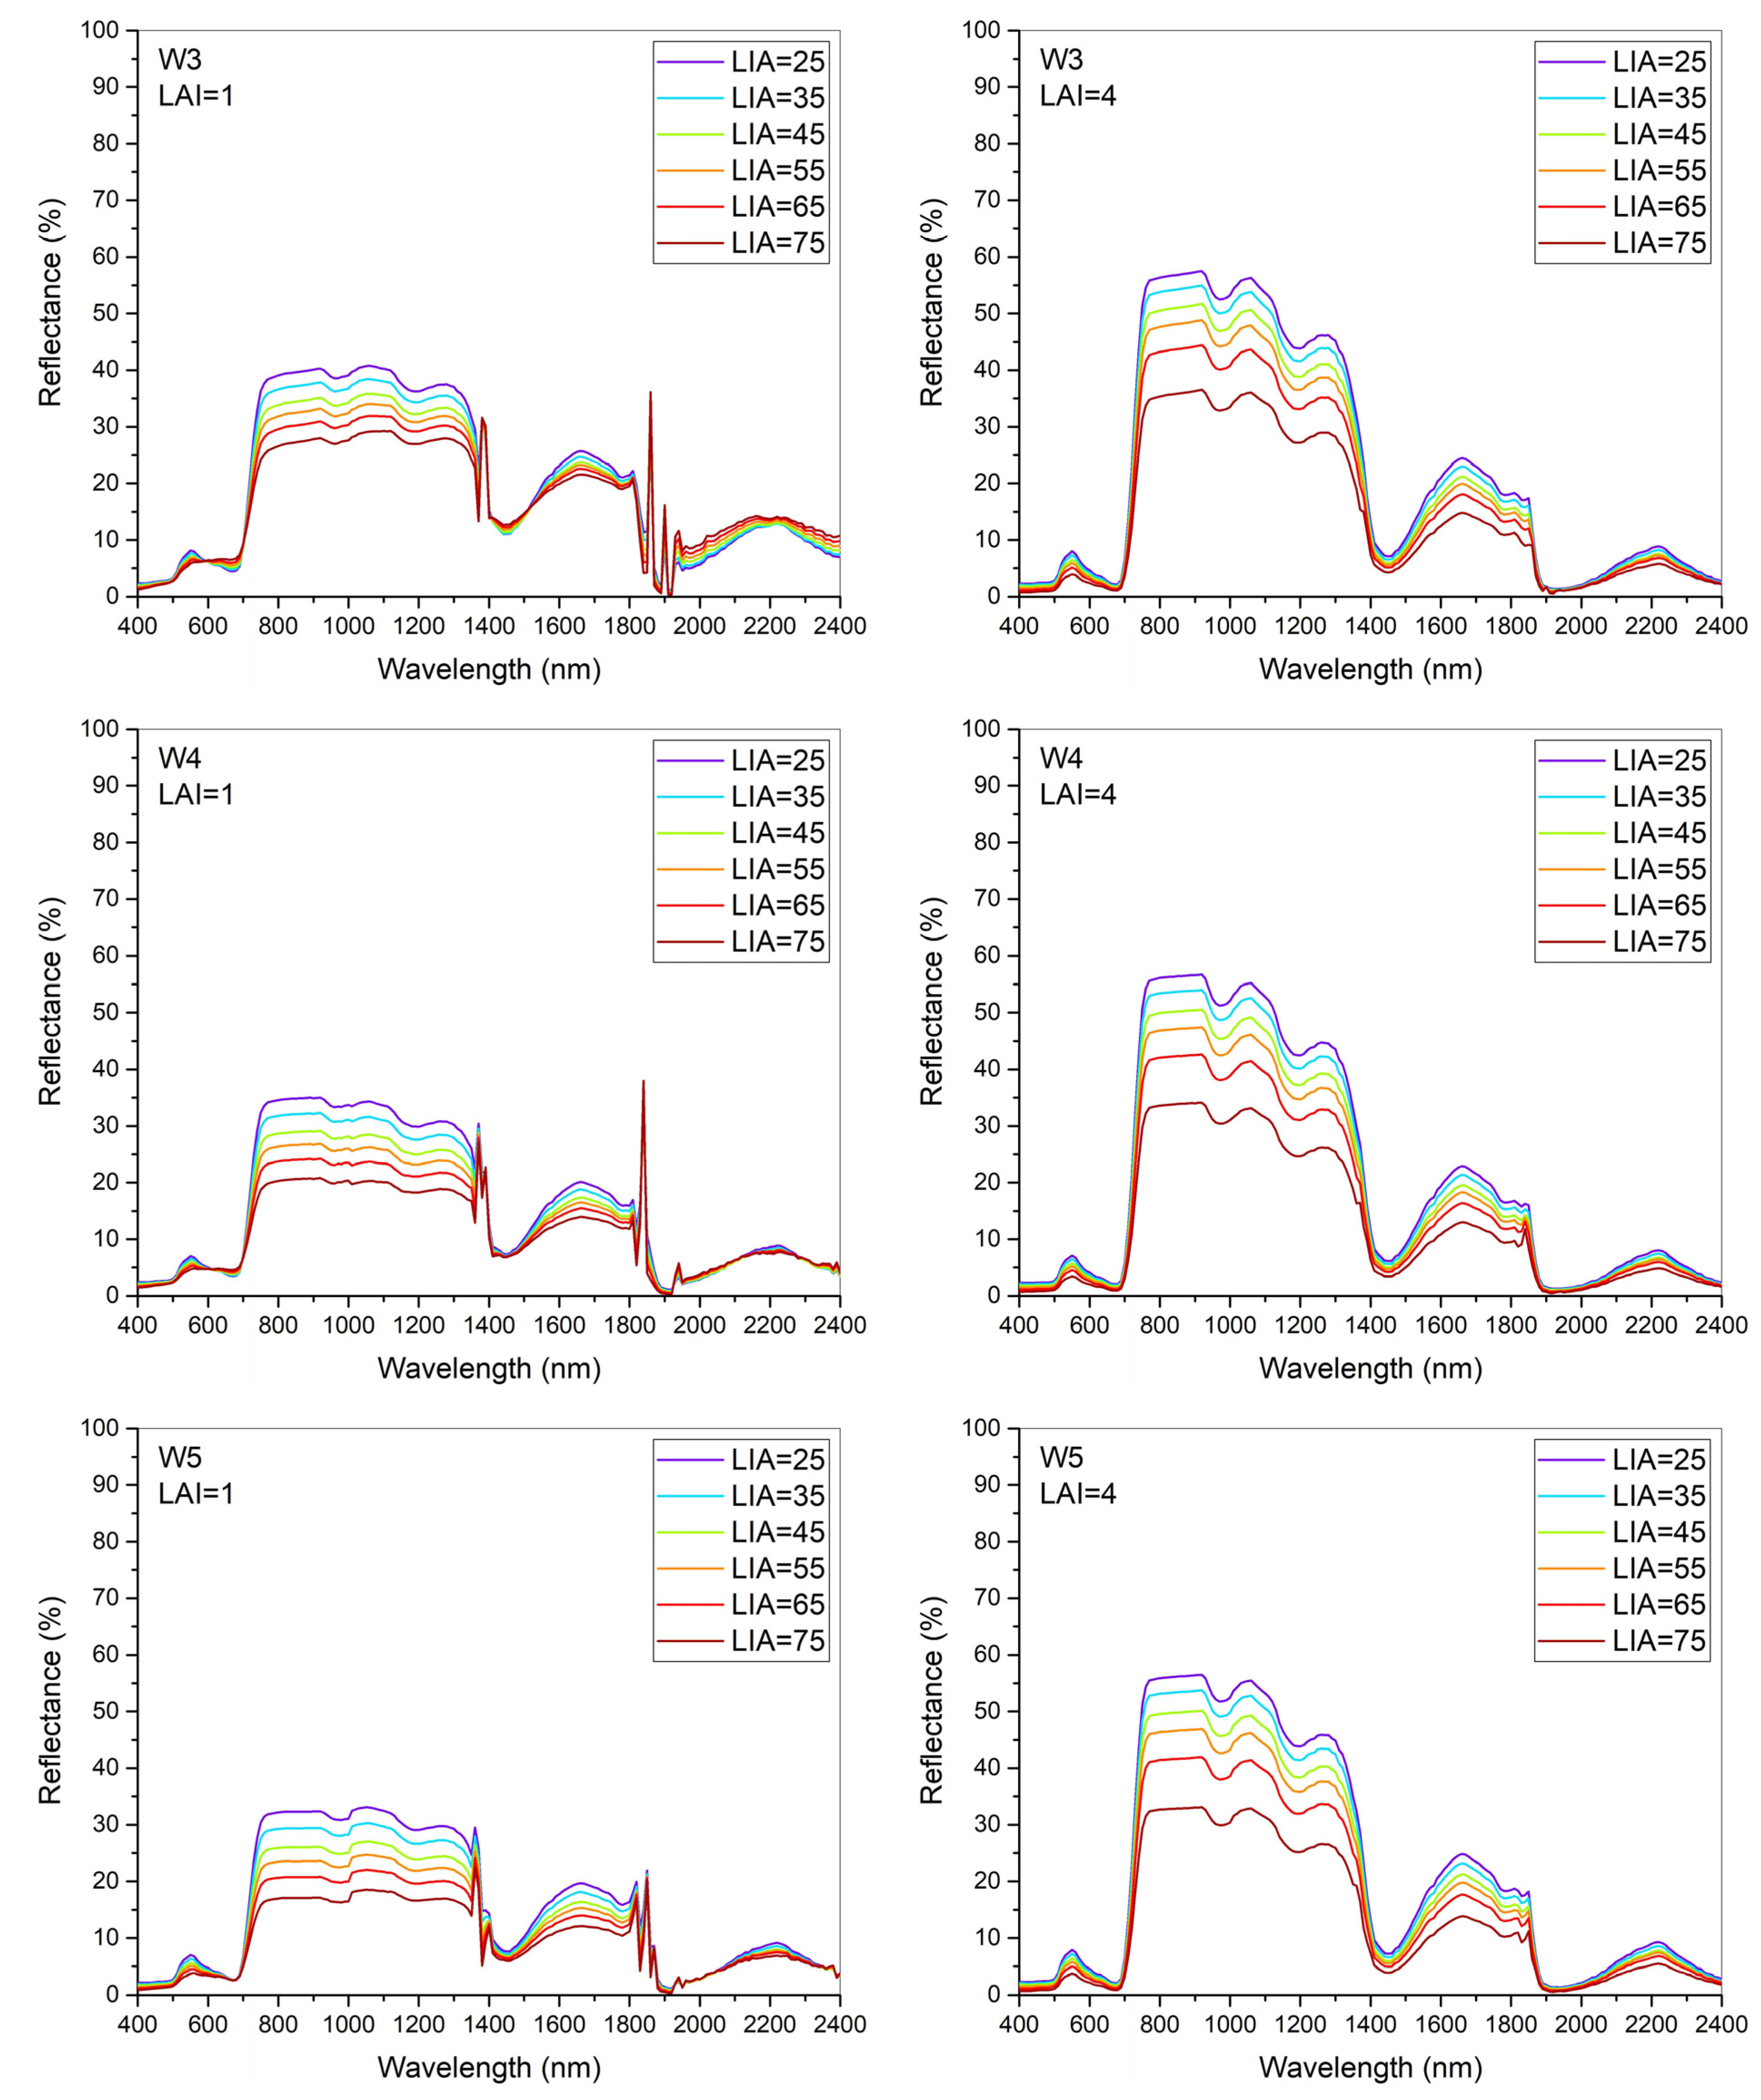
The canopy reflectance varied with LIA under different LAI when other coefficients were set as shown in Table 4. From Figure 8, the canopy reflectance declined with the increase in LIA under all treatments and different LAI, especially in the near-infrared spectrum when setting LAI as 4.
In the visible band, the canopy reflectance varied slightly with LIA regardless of the canopy closure. Combined with Figure 6, the canopy reflectance in the visible band was more susceptible to LAI than LIA. The reflectance in the near-infrared band was susceptible to LIA under two canopy closure situations. A similar result can also be found in Dian et al. [44], who suggested that leaf angle mainly affects the reflectance characteristics in the near-infrared band. Moreover, they indicated the change rate of reflectance increased with leaf angle. Our research also found that the reflectance changed more distinctly with LIA when LAI was 4 than when LAI was 1. In the short-infrared band, the reflectance decreased with the increase in LIA. The impact of LIA on reflectance increased with the water level, and showed the following trend: W1 < W2 < W3 < W4 < W5. Under the same water level, the impact of LIA on the reflectance of this band was less than that when the canopy was closed, especially under W4 and W5 treatments.
The impact of LIA on the reflectance was significant under different water levels. However, the correlations between LIA and canopy reflectance were similar among all treatments, as shown in Figure 8. The LIA influenced the reflectance in different spectrums when observed from the leaf level to the canopy level, especially when the canopy was closed. Thus, the scale effect should be taken into consideration and LIA should be considered as a correction factor when upscaling the reflectance from the leaf level to the canopy level.

3.4. Effects of Canopy Characteristics on Vegetation Index of Summer Maize under Continuous Water Stresses

3.4.1. Effects of Different LAI on Vegetation Index

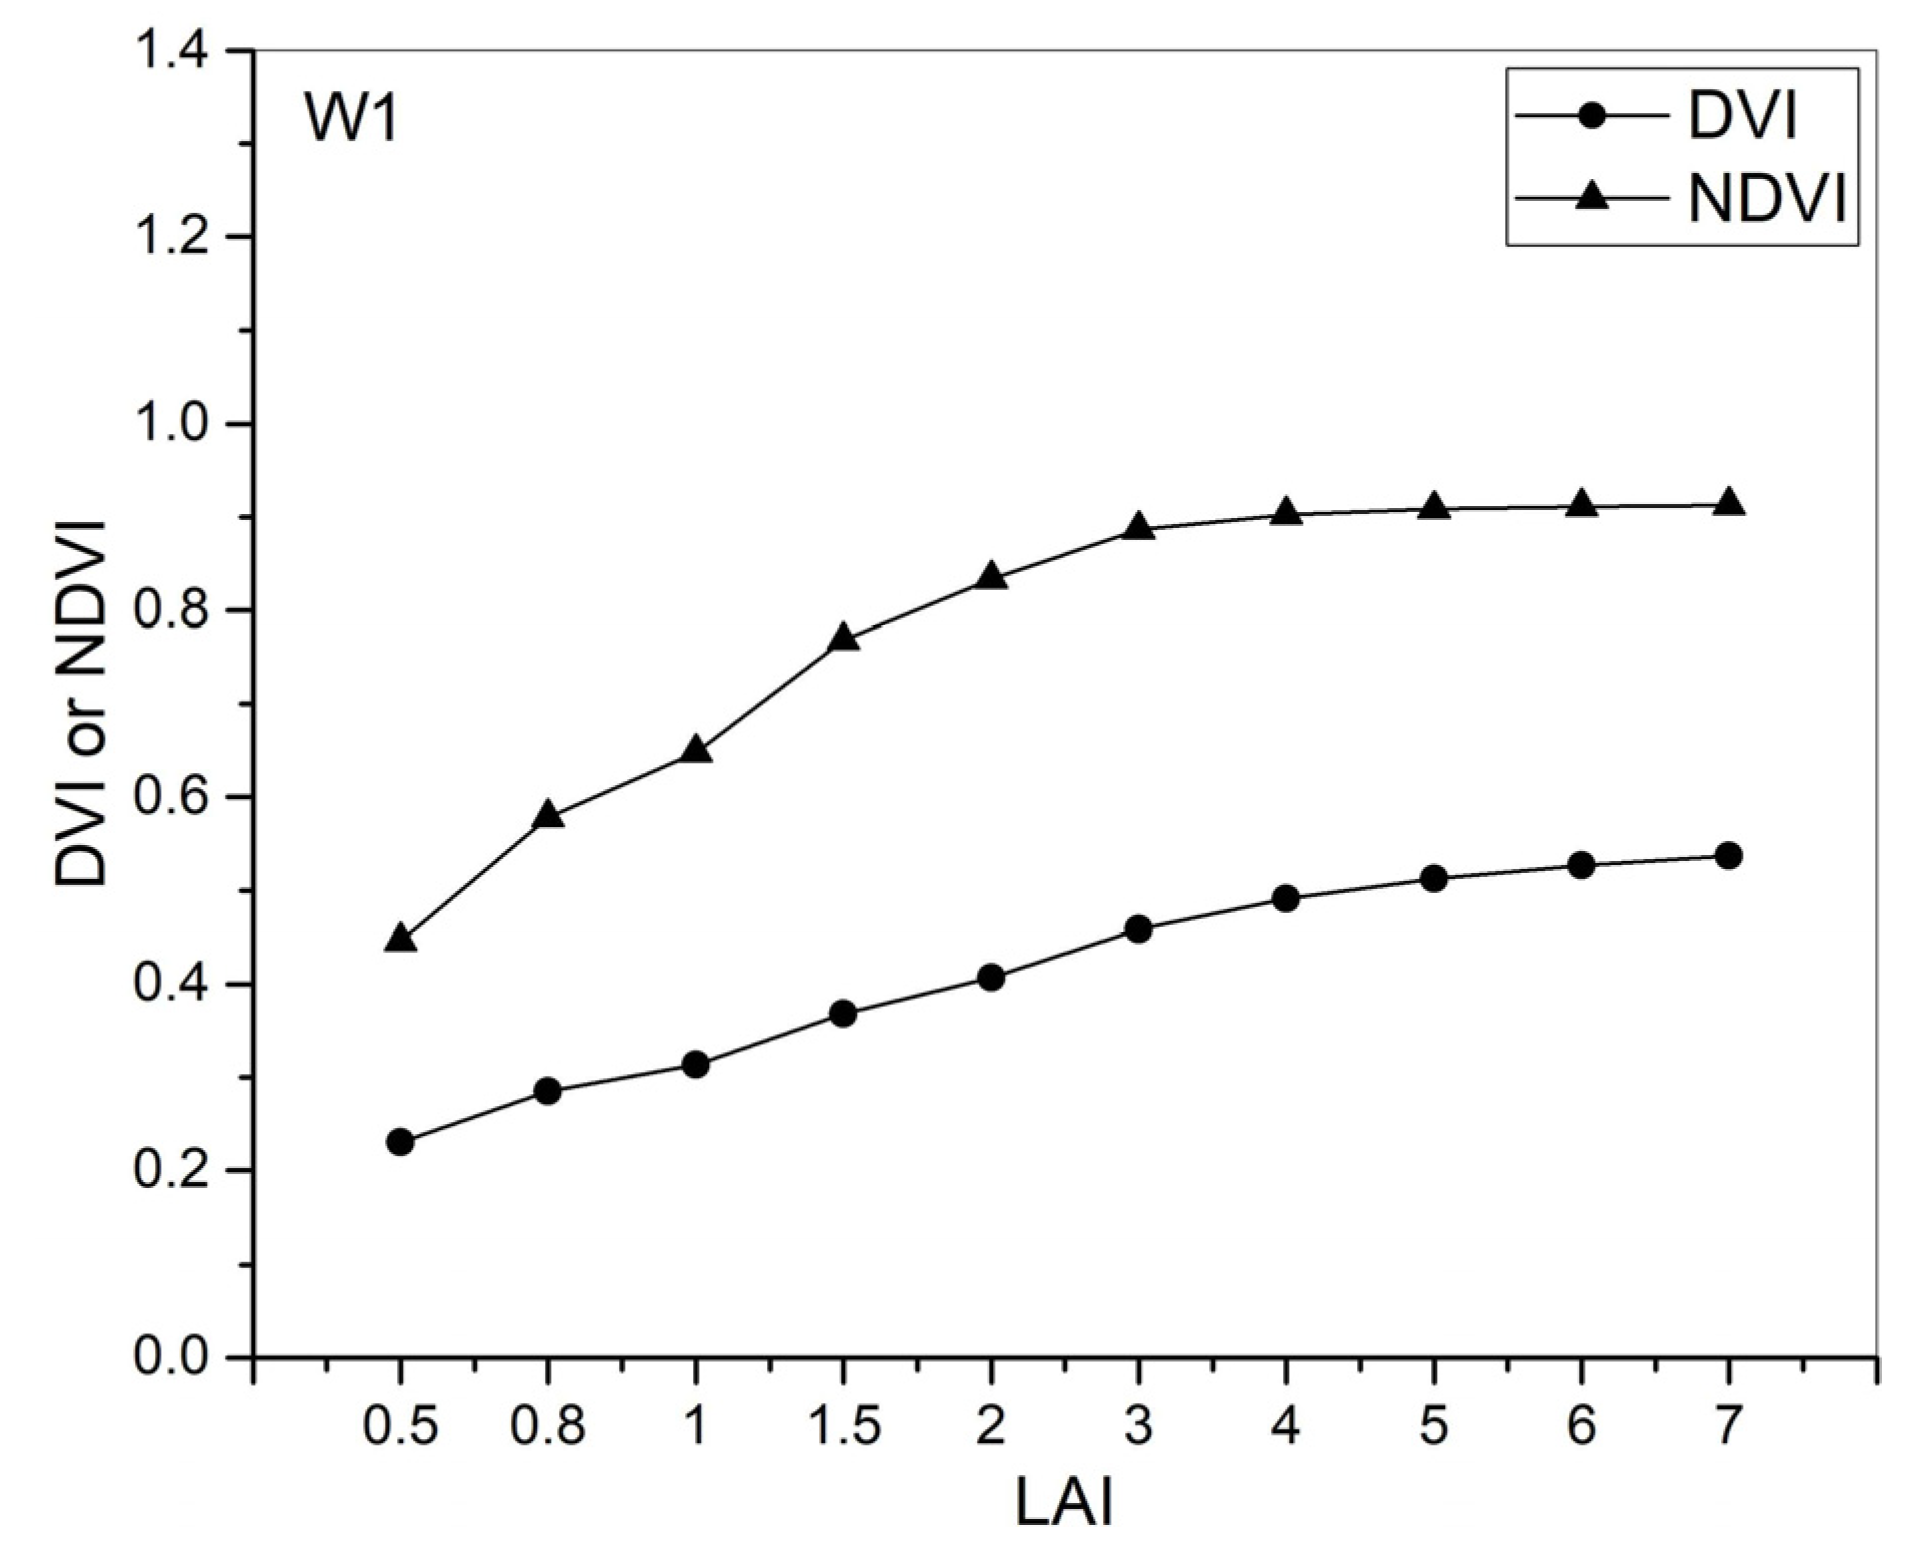
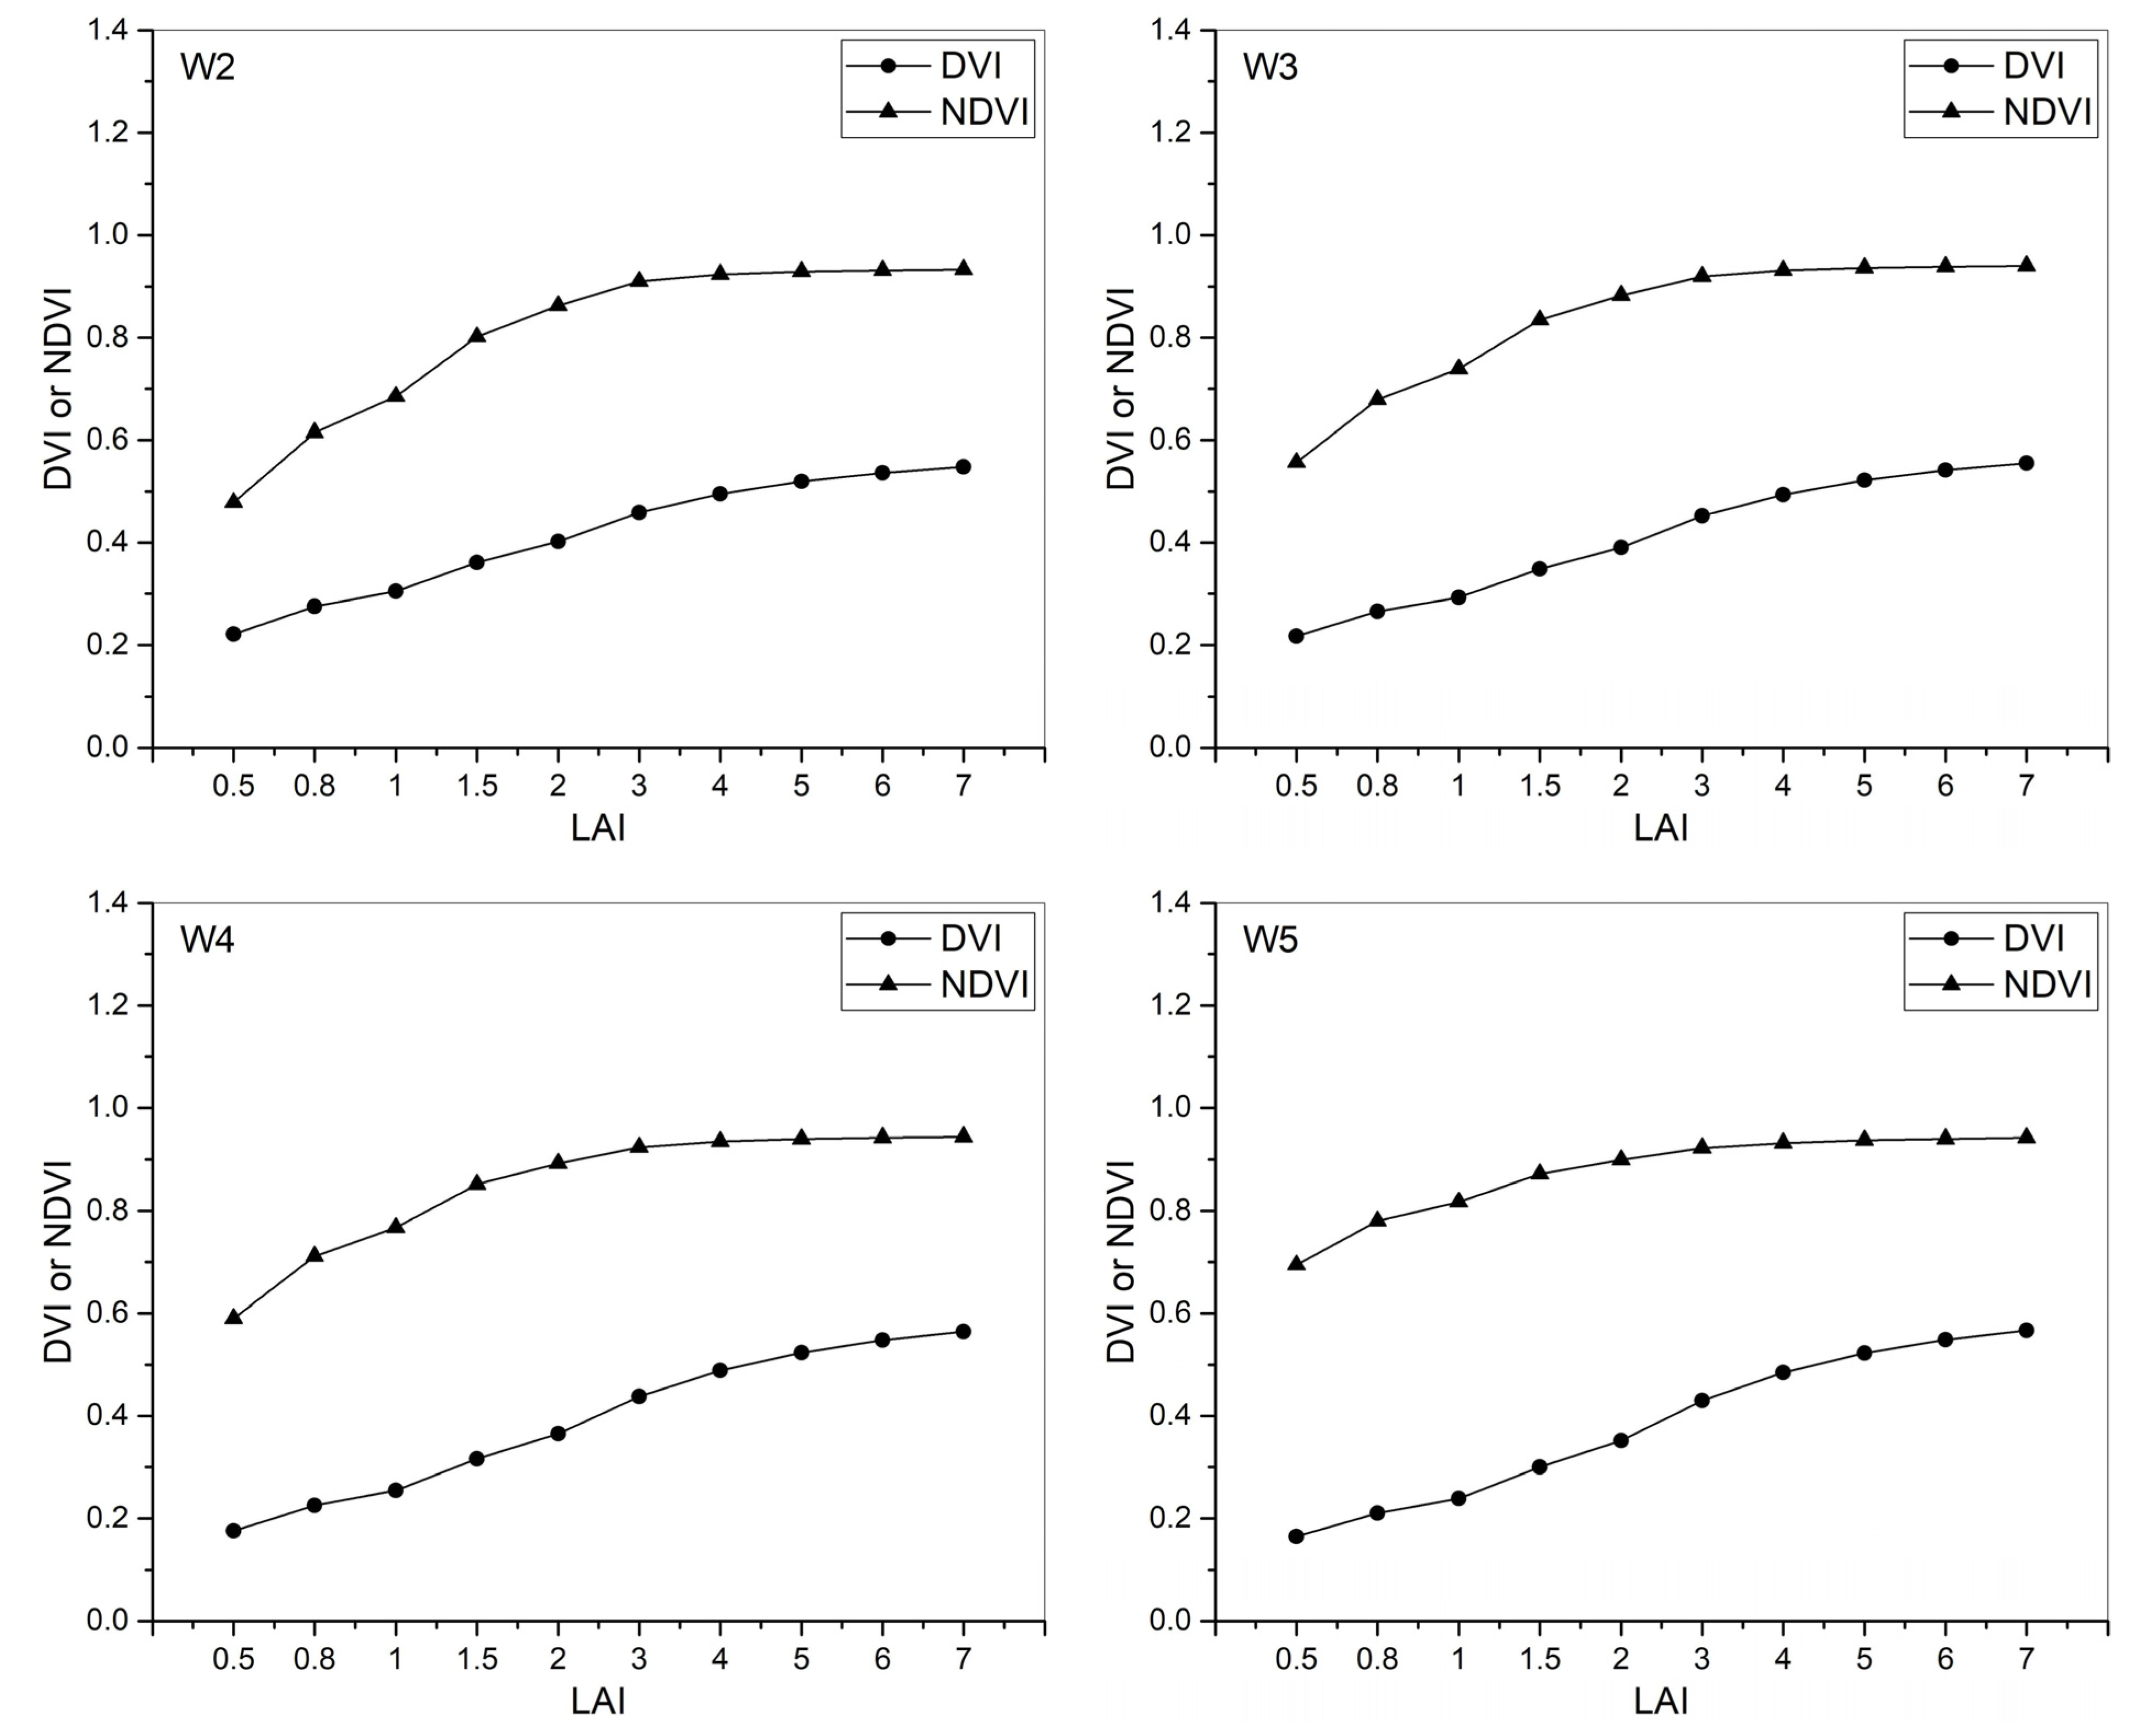
Based on the parameters shown in Table 3, the spectral reflectance under different LAI was simulated, and then the corresponding DVI and NDVI values were calculated by Formulas (1) and (2), respectively. As shown in Figure 9, with the increase in LAI, the DVI and NDVI index values under each treatment presented a gradually increasing trend.
For DVI, the slope varied from 0.17 to 0.2 when LAI increased from 0.5 to 0.8. Then, when LAI was greater than or equal to 4, the slope of the DVI curve started to decrease and reached 0.01 when LAI was 7 for most treatments. When the canopy was not closed, the DVI value in each treatment presented the changing trend of W1 < W2 < W3 < W4 < W5. However, when the canopy was closed, the trend of DVI value in each treatment was displayed as follows: W1 > W2 > W3 > W5 > W4. The difference between the highest and lowest value of the DVI in each treatment followed the order of: W1 > W2 > W3 > W4(CK) > W5. This is because, when the canopy is not closed, the canopy reflectance is mainly affected by soil reflectance, and the reflectance difference between red light and near-infrared light is significant. However, when the canopy is closed, the canopy reflectance is mainly affected by the plant spectrum; then, the reflectance difference between red light and near-infrared light in each treatment is not as significant as when the canopy is not closed.
For NDVI, the slope varied from 0.3 to 0.43 when LAI increased from 0.5 to 0.8. When the LAI was larger than or equal to 5, the slope of NDVI curve decreased to 0. This indicated that NDVI began to saturate. When the canopy was not closed, the NDVI presented W1 > W2 > W3 > W4 > W5. However, on the contrary, the NDVI among each treatment was basically the same, indicating that when the canopy is closed, the NDVI will not be applicable to distinguish the canopy spectral characteristics under different water treatments.
In this research, we found the NDVI and DVI performed differently in the low LAI region. Haboudane et al. [49] studied the sensitivity of a set of vegetation indices to LAI in the context of precision agriculture. Wu et al. [50] also evaluated the effect of LAI on vegetation indices, and argued that the NDVI increased rapidly when the LAI was low. Based on previous research, this study explored the effect of LAI on DVI and the NDVI by synthetically considering the water stress situation. Our research also indicated a similar result as that of Wu et al. [50]. Further, when compared with DVI, we found NDVI changed distinctly when LAI was relatively low, especially in drought stress treatments (W1–W3). This indicated NDVI was more suitable for LAI estimation than DVI when the canopy was not closed under drought stress. Moreover, when LAI increased to 5 and NDVI was saturated, DVI still varied with LAI slowly among all water treatments. Thus, DVI was more suitable than NDVI for LAI estimation when LAI was high.

3.4.2. Effects of Different LIA on Vegetation Index

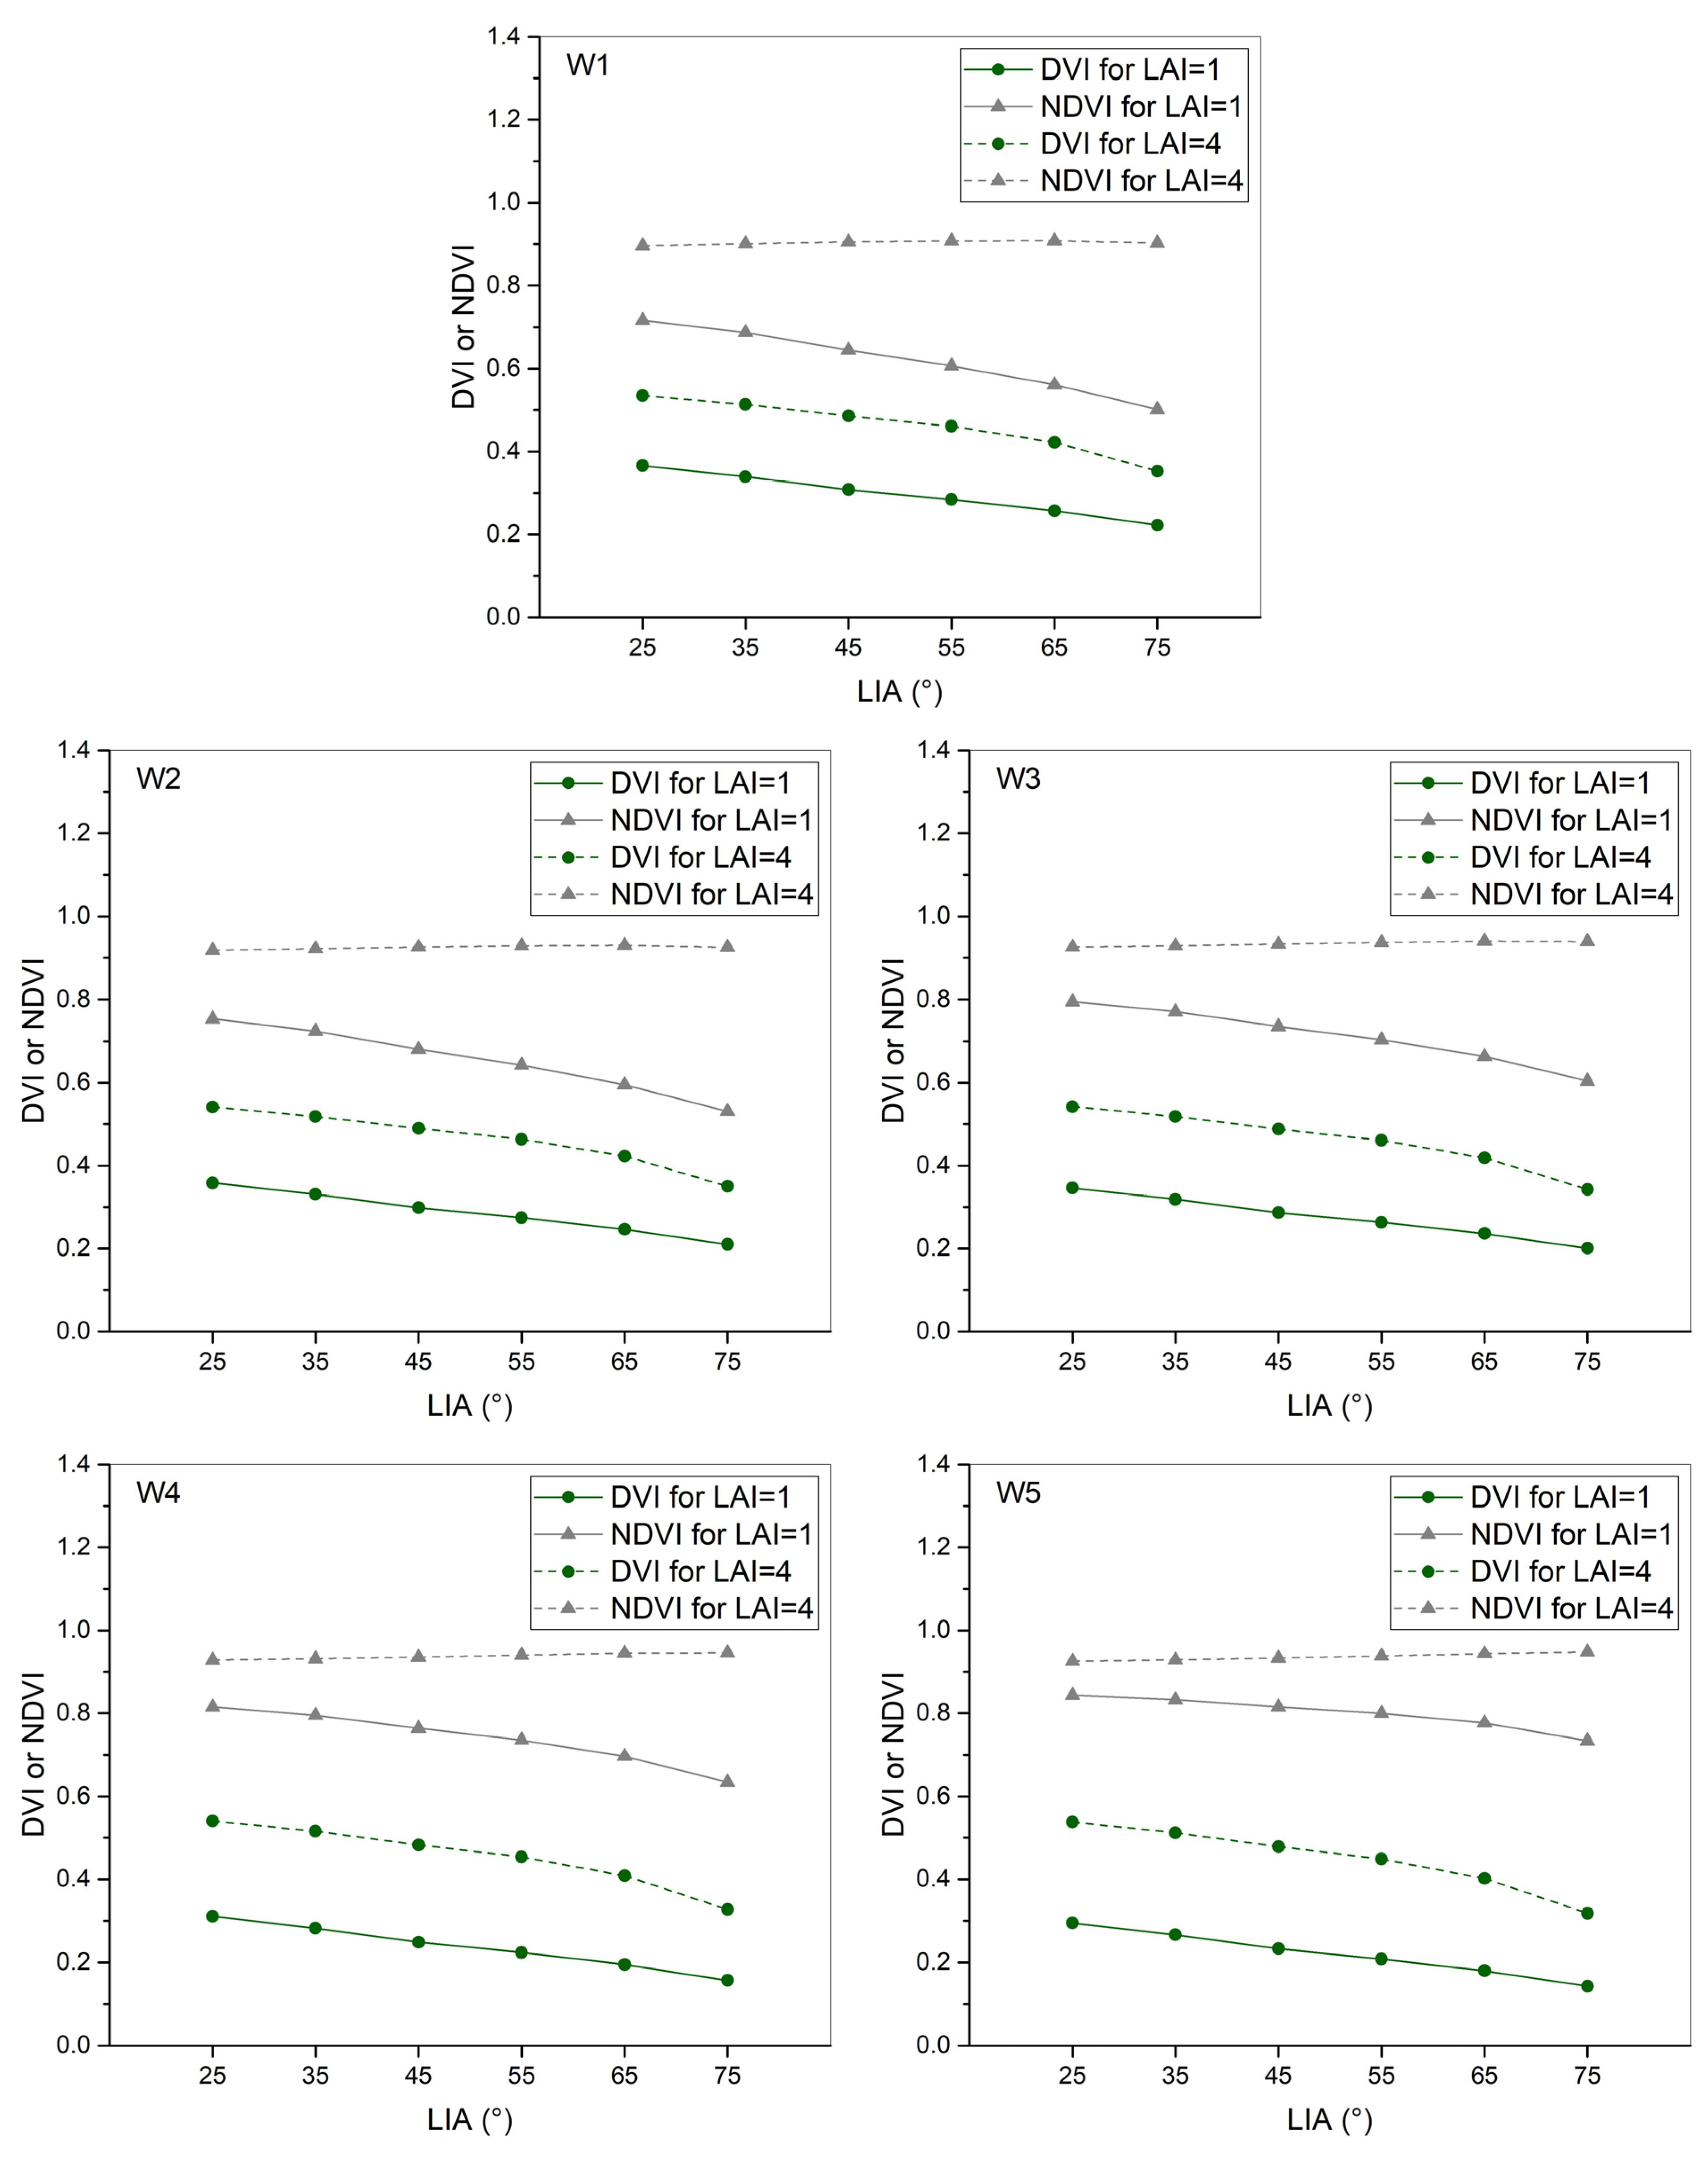
Based on the parameters shown in Table 4, the spectral reflectance under different LAI was simulated, and then the corresponding DVI and NDVI values were calculated by Formulas (1) and (2), respectively. As shown in Figure 10, both DVI and NDVI decreased with the increase in LIA, except when the canopy was closed, when the NDVI became saturated.
For DVI, with the increase in LIA, the DVI value decreased gradually, and when the canopy was saturated, the DVI was significantly larger than that when the canopy was not closed. When the canopy was not closed, the DVI of each treatment decreased slowly with the rise in LIA, whereas when the canopy was closed, the DVI decreased significantly when the LIA increased from 65° to 75°.
For NDVI, when the canopy was closed, the NDVI value of each treatment did not change with LIA, and the difference in NDVI value in each treatment was also small. When the canopy was not closed, the NDVI value presented a trend of W1 > W2 > W3 > W4 > W5. With the increase in LIA, the NDVI value in each treatment showed a decreasing trend, and the decreasing amplitude showed a trend of W1 > W2 > W3 > W4 > W5.
Furthermore, when the canopy was closed, NDVI was saturated, whereas DVI still slowly varied with LIA among all water treatments. Moreover, combined with the result from Section 3.4.1, the NDVI could not capture the LAI and LIA information when the canopy was closed, but DVI performed better.
The overall results showed that LAI had a larger influence on canopy reflectance than LIA, and the applicability of vegetation index was different under different canopy structures. For example, NDVI did not apply to the situation when the canopy was closed. Therefore, both spectral reflectance and vegetation index have scale effects of different degrees and characteristics. Further study is necessary to establish consistent physical and chemical parameters based on the remote sensing monitoring models at different scales.
Considering the scale effect, we found that the spectral characteristics and vegetation index varied with different observation scales in this study. This is consistent with the opinions from previous researches [51,52,53]. Wan et al. [54] also argued it is crucial to study the scale effect and the scaling method on the spectrum at different measuring scales. Moreover, our study considered the spatial heterogeneity caused by continuous water stress, and then analyzed the scale effect using the Prospect model. This may offer more specific support for the above opinion. In addition, LAI is a vital structural characteristic of vegetation, and the scale effect of LAI has attracted much attention in remote sensing research in recent years [55,56,57]. Our study also revealed that LAI was a critical factor for both spectral characteristics and the vegetation index. The NDVI is a widely used non-linear vegetation index. Many researchers investigated the influence of the observation scale on NDVI and drew complex conclusions. Jiang et al. [58] analyzed the difference between NDVI calculated from average reflectance and NDVI integrated from individual component NDVIs, and suggested that spatial resolution has an important impact on the NDVI measurement for heterogeneous surfaces. Thus, NDVI values at different scales may not be comparable. Tittebrand et al. [59] evaluated the satellite- and ground-based NDVI above different land-use types. Their results suggested that spatial variability of NDVI within one land-use type was lower than the differences caused by the different NDVI determination methods. Moreover, they also found the spectrometer measurements with a 60° viewing angle in the solar plane direction were found to better correspond to a satellite-derived NDVI. Our study revealed that the difference in NDVI values under different water levels was also small when the LAI was larger than 4 and the canopy was closed. Moreover, when the canopy was not closed, the spatial heterogeneity caused by continuous water stress was responsible for the NDVI change. Further, we also investigated the effect of LIA on canopy reflectance and the scale effect of the linear vegetation index. Therefore, as a key issue in the ecological remote sensing study, the scale effect also seriously restricts the further development of quantitative remote sensing [60]. Our research offered a systematical analysis of scale effects of the leaf and canopy of summer maize under continuous water stresses. Based on this study, the specific scale transformation method and selection of optimal scale deserves further exploration. Moreover, the problem of spatial heterogeneity will be more complicated considering climate change, which needs more attention.

4. Conclusions

This study aimed to analyze the scale effects of different canopy structural parameters, namely LAI and LIA, on spectral reflectance from the leaf scale to the canopy scale of summer maize under continuous water stresses using the Prospect and Sail models. On this basis, two typical vegetation indices (DVI and NDVI) were selected to analyze the scale effect of vegetation indices. The following conclusions were drawn from this study:
(1) Under continuous water stresses, the absorption depth and absorption area of the leaf spectrum at 1450 nm of summer maize during the vegetative stage and tasseling-silking stage both showed a trend of W4 > W5 > W3 > W2 > W1. The spectral characteristics of the summer maize canopy were similar at various stages and under different treatments.
(2) In terms of the influence of LAI on the leaf-canopy scale spectral characteristics, in the visible band, the spectral reflectivity of all treatments decreased gradually with the increase in LAI, especially under drought treatment. In contrast, in the near-infrared reflection band, the spectral reflectivity of each treatment increased significantly with the increase in LAI. In the short-wave infrared band, with the intensification of drought stress, the difference in spectral reflectivity between different LAI was greater.
(3) In terms of the influence of LIA on the leaf-canopy spectral characteristics, the reflectivity fluctuated slightly with LIA in the visible band. However, the canopy spectral reflectivity was most affected by the LIA in the near-infrared band. In the short-wave infrared band, canopy reflectivity decreased as the LIA increased.
(4) With the increase in LAI, the DVI and NDVI values under each treatment showed a gradually increasing trend. When the canopy was closed, NDVI was saturated, whereas DVI still slowly varied with LIA among all water treatments.
Overall, this study thoroughly investigated the scale effects of summer maize’s spectral reflectance and vegetation index under different leaf and canopy scales. The results suggested that LAI had a more significant influence on canopy reflectance than LIA. Moreover, NDVI could not capture the LAI and LIA information when the canopy was closed, and DVI performed better. This study applied tasks such as precision agriculture, parameter inversion, and target recognition with pre-knowledge.

Supplementary Materials

The following are available online at https://www.mdpi.com/article/10.3390/agriculture11121180/s1, Figure S1: Chlorophyll A + B content used in Prospect model for simulating leaf reflectance, Figure S2: Leaf equivalent water thickness used in Prospect model for simulating leaf reflectance, Figure S3: Dry matter content used in Prospect model for simulating leaf reflectance.

Author Contributions

Conceptualization: M.L. and R.C.; Analysis: M.L. and R.C.; Funding acquisition: M.L. and R.C.; Writing—Original Draft Preparation: M.L., R.C. and X.S.; Data curation: X.S., P.X. and F.N.; Writing—Review & Editing: S.S. and A.R.M.T.I. All authors have read and agreed to the published version of the manuscript.

Funding

This research was funded by the National Natural Science Foundation of China (41905100), Anhui Provincial Natural Science Foundation (2108085QD157; 1908085QD171), National Key Research and Development Program of China (2018YFD0300905), Anhui Agricultural University Science Foundation for Young Scholars (2018zd07) and Anhui Agricultural University Introduction and Stabilization of Talent Fund (yj2018-57).

Institutional Review Board Statement

Not applicable.

Informed Consent Statement

Not applicable.

Data Availability Statement

Not applicable.

Conflicts of Interest

The authors declare no conflict of interest.

References

  1. Pocketbook. World Food and Agriculture; FAO: Rome, Italy, 2015. [Google Scholar]
  2. FAO. FAOSTAT-Agriculture Database. 2014. Available online: http://faostat.fao.org/site/339/default.aspx (accessed on 14 October 2021).
  3. Zhang, F.; Cui, Z.; Fan, M.; Zhang, W.; Chen, X.; Jiang, R. Integrated soil-crop system management: Reducing environmental risk while increasing crop productivity and improving nutrient use efficiency in China. J. Environ. Qual. 2011, 40, 1051–1057. [Google Scholar] [CrossRef] [PubMed]
  4. Li, M.; Shen, S.; Lv, H.; Han, Y.; Chu, R.; Sha, X. Thermal resources and summer maize temperature suitability in the Huang-Huai-Hai region under future climate change. Trans. Atmos. Sci. 2016, 39, 391–399. [Google Scholar]
  5. Farré, I.; Faci, J.M. Deficit irrigation in maize for reducing agricultural water use in a Mediterranean environment. Agric. Water Manag. 2009, 96, 383–394. [Google Scholar] [CrossRef]
  6. Zaidi, P.H.; Rafique, S.; Rai, P.K.; Singh, N.N.; Srinivasan, G. Tolerance to excess moisture in maize (Zea mays L.): Susceptible crop stages and identification of tolerant genotypes. Field Crop. Res. 2004, 90, 189–202. [Google Scholar] [CrossRef]
  7. Liu, Y.; Tang, B.; Zheng, Y.; Ma, K.; Xu, S.; Qiu, F. Screening methods for waterlogging tolerance at maize (Zea mays L.) seedling stage. Agric. Sci. China 2010, 9, 362–369. [Google Scholar] [CrossRef]
  8. Haylock, M.; Nicholls, N. Trends in extreme rainfall indices for an updated high quality data set for Australia, 1910–1998. Int. J. Climatol. 2000, 20, 1533–1541. [Google Scholar] [CrossRef]
  9. Zhang, Q.; Li, J.; Singh, V.P.; Xiao, M. Spatio-temporal relations between temperature and precipitation regimes: Implications for temperature-induced changes in the hydrological cycle. Glob. Planet Chang. 2013, 111, 57–76. [Google Scholar] [CrossRef]
  10. Zhang, Q.; Gu, X.; Singh, V.P.; Kong, D.; Chen, X. Spatiotemporal behavior of floods and droughts and their impacts on agriculture in China. Glob. Planet Chang. 2015, 131, 63–72. [Google Scholar] [CrossRef]
  11. Gerhards, M.; Rock, G.; Schlerf, M.; Udelhoven, T. Water stress detection in potato plants using leaf temperature, emissivity, and reflectance. Int. J. Appl. Earth Obs. 2016, 53, 27–39. [Google Scholar] [CrossRef]
  12. Liu, F.; Shen, S.; Yang, B.; Tao, S. Spectral Monitoring Model of Leaf/Canopy Stomatal Conductance in Maize under Different Soil Moisture Treatments. Chin. J. Agrometeorol. 2013, 34, 727–732. [Google Scholar]
  13. Ashraf, M.; Habib-ur-Rehman. Interactive effects of nitrate and long-term waterlogging on growth, water relations, and gaseous exchange properties of maize (Zea mays L.). Plant Sci. 1999, 144, 35–43. [Google Scholar] [CrossRef]
  14. Ren, B.; Zhang, J.; Li, X.; Fan, X.; Dong, S.; Liu, P.; Zhao, B. Effects of waterlogging on the yield and growth of summer maize under field conditions. Can. J. Plant Sci. 2014, 94, 23–31. [Google Scholar] [CrossRef]
  15. Valliyodan, B.; Ye, H.; Song, L.; Murphy, M.; Shannon, J.G.; Nguyen, H.T. Genetic diversity and genomic strategies for improving drought and waterlogging tolerance in soybeans. J. Exp. Bot. 2016, 68, 1835–1849. [Google Scholar] [CrossRef] [Green Version]
  16. Grzesiak, S.; Hura, T.; Grzesiak, M.T.; Piefikowski, S. The impact of limited soil moisture and waterlogging stress conditions on morphological and anatomical root traits in maize (Zea mays L.) hybrids of different drought tolerance. Acta Physiol. Plant. 1999, 21, 305–315. [Google Scholar] [CrossRef]
  17. Mutava, R.N.; Prince, S.J.K.; Syed, N.H.; Song, L.; Valliyodan, B.; Chen, W.; Nguyen, H.T. Understanding abiotic stress tolerance mechanisms in soybean: A comparative evaluation of soybean response to drought and flooding stress. Plant Physiol. Biochem. 2015, 86, 109–120. [Google Scholar] [CrossRef]
  18. Zegada-Lizarazu, W.; Iijima, M. Deep root water uptake ability and water use efficiency of pearl millet in comparison to other millet species. Plant Prod. Sci. 2005, 8, 454–460. [Google Scholar] [CrossRef]
  19. Li, X.; Wang, Y. Prospects on future developments of quantitative remote sensing. Acta Geogr. Sin. 2013, 68, 1163–1169. [Google Scholar]
  20. Li, X.; Wang, J.; Strahler, A.H. Scaling effects and geometric-optical modeling used for scale correction. Sci. China 2000, 30, 12–17. [Google Scholar]
  21. Lichtenthaler, H.K.; Welburn, A.R. Determination of Total Carotenoids and Chlorophylls a and b of Extracts in Different Solvents. Biochem. Soc. Trans. 1983, 11, 591–592. [Google Scholar] [CrossRef] [Green Version]
  22. Chou, S.; Chen, J.M.; Yu, H.; Chen, B.; Zhang, X.; Croft, H.; Khalid, S.; Li, M.; Shi, Q. Canopy-Level Photochemical Reflectance Index from Hyperspectral Remote Sensing and Leaf-Level Non-Photochemical Quenching as Early Indicators of Water Stress in Maize. Remote Sens. 2017, 9, 794. [Google Scholar] [CrossRef] [Green Version]
  23. Seelig, H.D.; Hoehn, A.; Stodieck, L.S.; Klaus, D.M.; Iii, W.W.A.; Emery, W.J. Relations of remote sensing leaf water indices to leaf water thickness in cowpea, bean, and sugarbeet plants. Remote Sens. Environ. 2008, 112, 445–455. [Google Scholar] [CrossRef]
  24. Li, M.; Chu, R.; Yu, Q.; Islam, A.R.M.T.; Chou, S.; Shen, S. Evaluating Structural, Chlorophyll-Based and Photochemical Indices to Detect Summer Maize Responses to Continuous Water Stress. Water 2018, 10, 500. [Google Scholar] [CrossRef] [Green Version]
  25. Wang, J.; Zhao, C.; Guo, X.; Tian, Q. Study on the Water Status of the Wheat Leaves Diagnosed by the Spectral Reflectance. Sci. Agric. Sin. 2001, 34, 1–4. [Google Scholar]
  26. Wang, J.; Zhao, C.; Guo, X.; Huang, W.; Tian, Q. Study on the Water Content of Wheat Leaves by the Remote Sensing. Acta Agric. Boreali Sin. 2000, 15, 68–72. [Google Scholar]
  27. Cheng, T.; Rivard, B.; Sánchez-Azofeifa, G.A. Spectroscopic determination of leaf water content using continuous wavelet analysis. In Proceedings of the Geoscience and Remote Sensing Symposium, Honolulu, HI, USA, 25–30 July 2010; IEEE: Piscataway, NJ, USA, 2010; pp. 659–670. [Google Scholar]
  28. Fang, M.; Ju, W. A Inversion Model for Remote Sensing of Leaf Water Content Based on the Leaf Optical Property. Spectrosc. Spect. Anal. 2015, 35, 167–171. [Google Scholar]
  29. Hunt, E.R., Jr.; Doraiswamy, P.C.; McMurtrey, J.E.; Daughtry, C.S.T.; Perry, E.M.; Akhmedov, B. A visible band index for remote sensing leaf chlorophyll content at the canopy scale. Int. J. Appl. Earth Obs. 2013, 21, 103–112. [Google Scholar] [CrossRef] [Green Version]
  30. Kong, W.; Bi, Y.; Li, S.; Chen, S.; Feng, Y.; Yu, H. Hyperspectral estimation of leaf chlorophyll content in mycorrhizal inoculated soybean under drought stress. Trans. Chin. Soc. Agric. Eng. 2014, 30, 123–131. [Google Scholar]
  31. Song, L.; Jin, J. Improving CERES-Maize for simulating maize growth and yield under water stress conditions. Eur. J. Agron. 2020, 117, 126072. [Google Scholar] [CrossRef]
  32. Wang, B.; Li, Z.; Eneji, E.; Tian, X.; Zhai, Z.; Li, J.; Duan, L. Effects of Coronatine on Growth, Gas Exchange Traits, Chlorophyll Content, Antioxidant Enzymes and Lipid Peroxidation in Maize (Zea mays L.) Seedlings under Simulated Drought Stress. Plant Prod. Sci. 2008, 11, 283–290. [Google Scholar] [CrossRef] [Green Version]
  33. Zygielbaum, A.I.; Gitelson, A.A.; Arkebauer, T.J.; Rundquist, D.C. Non-destructive detection of water stress and estimation of relative water content in maize. Geophys. Res. Lett. 2009, 36, L12403. [Google Scholar] [CrossRef] [Green Version]
  34. Bonham-Carter, G.F. Numerical procedures and computer program for fitting an inverted gaussian model to vegetation reflectance data. Comput. Geosci. 1988, 14, 339–356. [Google Scholar] [CrossRef]
  35. Mille, J.; Hare, E.; Wu, J. Quantitative characterization of the vegetation red edge reflectance 1. An inverted-Gaussian reflectance model. Int. J. Remote Sens. 1990, 11, 1755–1773. [Google Scholar] [CrossRef]
  36. Li, Y.; Demetriades-Shah, T.H.; Kanemasu, E.T.; Shultis, J.K.; Kirkham, M.B. Use of second derivatives of canopy reflectance for monitoring prairie vegetation over different soil backgrounds. Remote Sens. Environ. 1993, 44, 81–87. [Google Scholar] [CrossRef]
  37. Dawson, T.P.; Curran, P.J.; Plummer, S.E. LIBERTY-Modeling the Effects of Leaf Biochemical Concentration on Reflectance Spectra. Remote Sens. Environ. 1998, 65, 50–60. [Google Scholar] [CrossRef]
  38. Feng, R.; Zhang, Y.; Yu, W.; Hu, W.; Wu, J.; Ji, R.; Wang, H.; Zhao, X. Analysis of the relationship between the spectral characteristics of maize canopy and leaf area index under drought stress. Acta Ecol. Sin. 2013, 33, 301–307. [Google Scholar] [CrossRef]
  39. Jacquemoud, S.; Baret, F. PROSPECT: A model of leaf optical properties spectra. Remote Sens. Environ. 1990, 34, 75–91. [Google Scholar] [CrossRef]
  40. Zhang, F.; Zhou, G. Estimation of Canopy Water Content by Means of Hyperspectral Indices Based on Drought Stress Gradient Experiments of Maize in the North Plain China. Remote Sens. 2015, 7, 15203–15223. [Google Scholar] [CrossRef] [Green Version]
  41. Jong, S.M.d.; Addink, E.A.; Doelman, J.C. Detecting leaf-water content in Mediterranean trees using high-resolution spectrometry. Int. J. Appl. Earth Obs. 2014, 27, 128–136. [Google Scholar] [CrossRef]
  42. Xiao, Y.F.; Zhou, D.M.; Gong, H.L.; Zhao, W.J. Sensitivity of canopy reflectance to biochemical and biophysical variables. J. Remote Sens. 2015, 19, 368–374. [Google Scholar]
  43. He, J.; Liu, B.; Li, J. Monitoring model of leaf area index of winter wheat based on hyperspectral reflectance at different growth stages. Trans. Chin. Soc. Agric. Eng. 2014, 30, 141–150. [Google Scholar]
  44. Dian, Y.Y.; Fang, S.H. Simulation analysis of vegetation TOA reflectance based on coupled leaf-canopy-atmosphere radiative transfer model. Remote. Sens. Land Resour. 2013, 25, 30–37. [Google Scholar]
  45. Zeng, Q.; Yu, K.Y.; Yao, X.; Zheng, W.Y.; Zhang, J.Z.; Ai, J.W.; Liu, J. Research on canopy reflectance modeling of Phyllostachys pubescens forest based on the PROSAIL canopy radiative transfer model. Plant Sci. J. 2017, 35, 699–707. [Google Scholar]
  46. Li, S.; Wang, C. The Methods of Obtaining and Expressing Information of Crop Plant Shape and Population Structure. J. Shihezi Univ. 1997, 1, 250–256. [Google Scholar]
  47. Stewart, D.W.; Costa, C.; Dwyer, L.M.; Smith, D.L.; Hamilton, R.I.; Ma, B.L. Canopy Structure, Light Interception, and Photosynthesis in Maize. Agron. J. 2003, 95, 1456–1474. [Google Scholar] [CrossRef]
  48. Su, W.; Guo, H.; Zhao, D.; Liu, T.; Zhang, M. Leaf Area Index Retrieval for Maize Canopy Using Optimized Leaf Angle Distribution Function of PROSAIL Model. Trans. Chin. Soc. Agric. Mach. 2016, 47, 234–241. [Google Scholar]
  49. Haboudane, D.; Miller, J.R.; Pattey, E.; Zarco-Tejada, P.J.; Strachan, I.B. Hyperspectral vegetation indices and novel algorithms for predicting green LAI of crop canopies: Modeling and validation in the context of precision agriculture. Remote Sens. Environ. 2004, 90, 337–352. [Google Scholar] [CrossRef]
  50. Wu, C.; Niu, Z. Improvement in Linearity Between Hyperspectral Vegetation Indices and Chlorophyll Content, Leaf Area Index Based on Radiative Transfer Models. Chin. Bull. Bot. 2008, 25, 714–721. [Google Scholar]
  51. Su, L.; Li, X.; Huang, Y. An review on scale in remote sensing. Adv. Earth Sci. 2001, 16, 544–548. [Google Scholar]
  52. Song, C.; Chen, C.; Shi, P. Geography complexity: New connotations of geography in the new era. Acta Geogr. Sin. 2018, 73, 1204–1213. [Google Scholar]
  53. Hansen, M.C.; Defries, R.S.; Townshend, J.R.G.; Sohlberg, R. Global land cover classification at 1 km spatial resolution using a classification tree approach. Int. J. Remote Sens. 2000, 21, 1331–1364. [Google Scholar] [CrossRef]
  54. Wan, H.; Wang, J.; Qu, Y.; Jiao, Z.; Zhang, H. Preliminary research on scale effect and scaling-up of the vagetation spectrum. J. Remote Sens. 2008, 12, 538–545. [Google Scholar]
  55. Tian, Y.H.; Wang, Y.J. Radiative transfer based scaling of LAI retrievals from reflectance data of different resolutions. Remote Sens. Environ. 2003, 84, 143–159. [Google Scholar] [CrossRef]
  56. Zhang, W.C.; Zhong, S.; Hu, S.Y. Spatial scale transferring study on Leaf Area Index derived from remotely sensed data in the Heihe River Basin, China. Acta Ecol. Sin. 2008, 28, 2495–2503. [Google Scholar]
  57. Garrigues, S.; Allard, B.D.; Baret, F. Influence of landscape spatial heterogeneity on the non-linear estimation of leaf area index from moderate spatial resolution remote sensing date. Remote Sens. Environ. 2006, 105, 286–298. [Google Scholar] [CrossRef]
  58. Jiang, Z.; Chen, Y.; Jing, L.; Wen, D. The impact of spatial resolution on NDVI over heterogeneous surface. In Proceedings of the 2005 IEEE International Geoscience and Remote Sensing Symposium, Seoul, Korea, 25–29 July 2005. [Google Scholar]
  59. Tittebrand, A.; Spank, U.; Bernhofer, C.H. Comparison of satellite- and ground-based NDVI above different land-use types. Theor. Appl. Climatol. 2009, 98, 171–186. [Google Scholar] [CrossRef]
  60. Liang, S. Quantitative Remote Sensing; Science Press: Beijing, China, 2009. [Google Scholar]
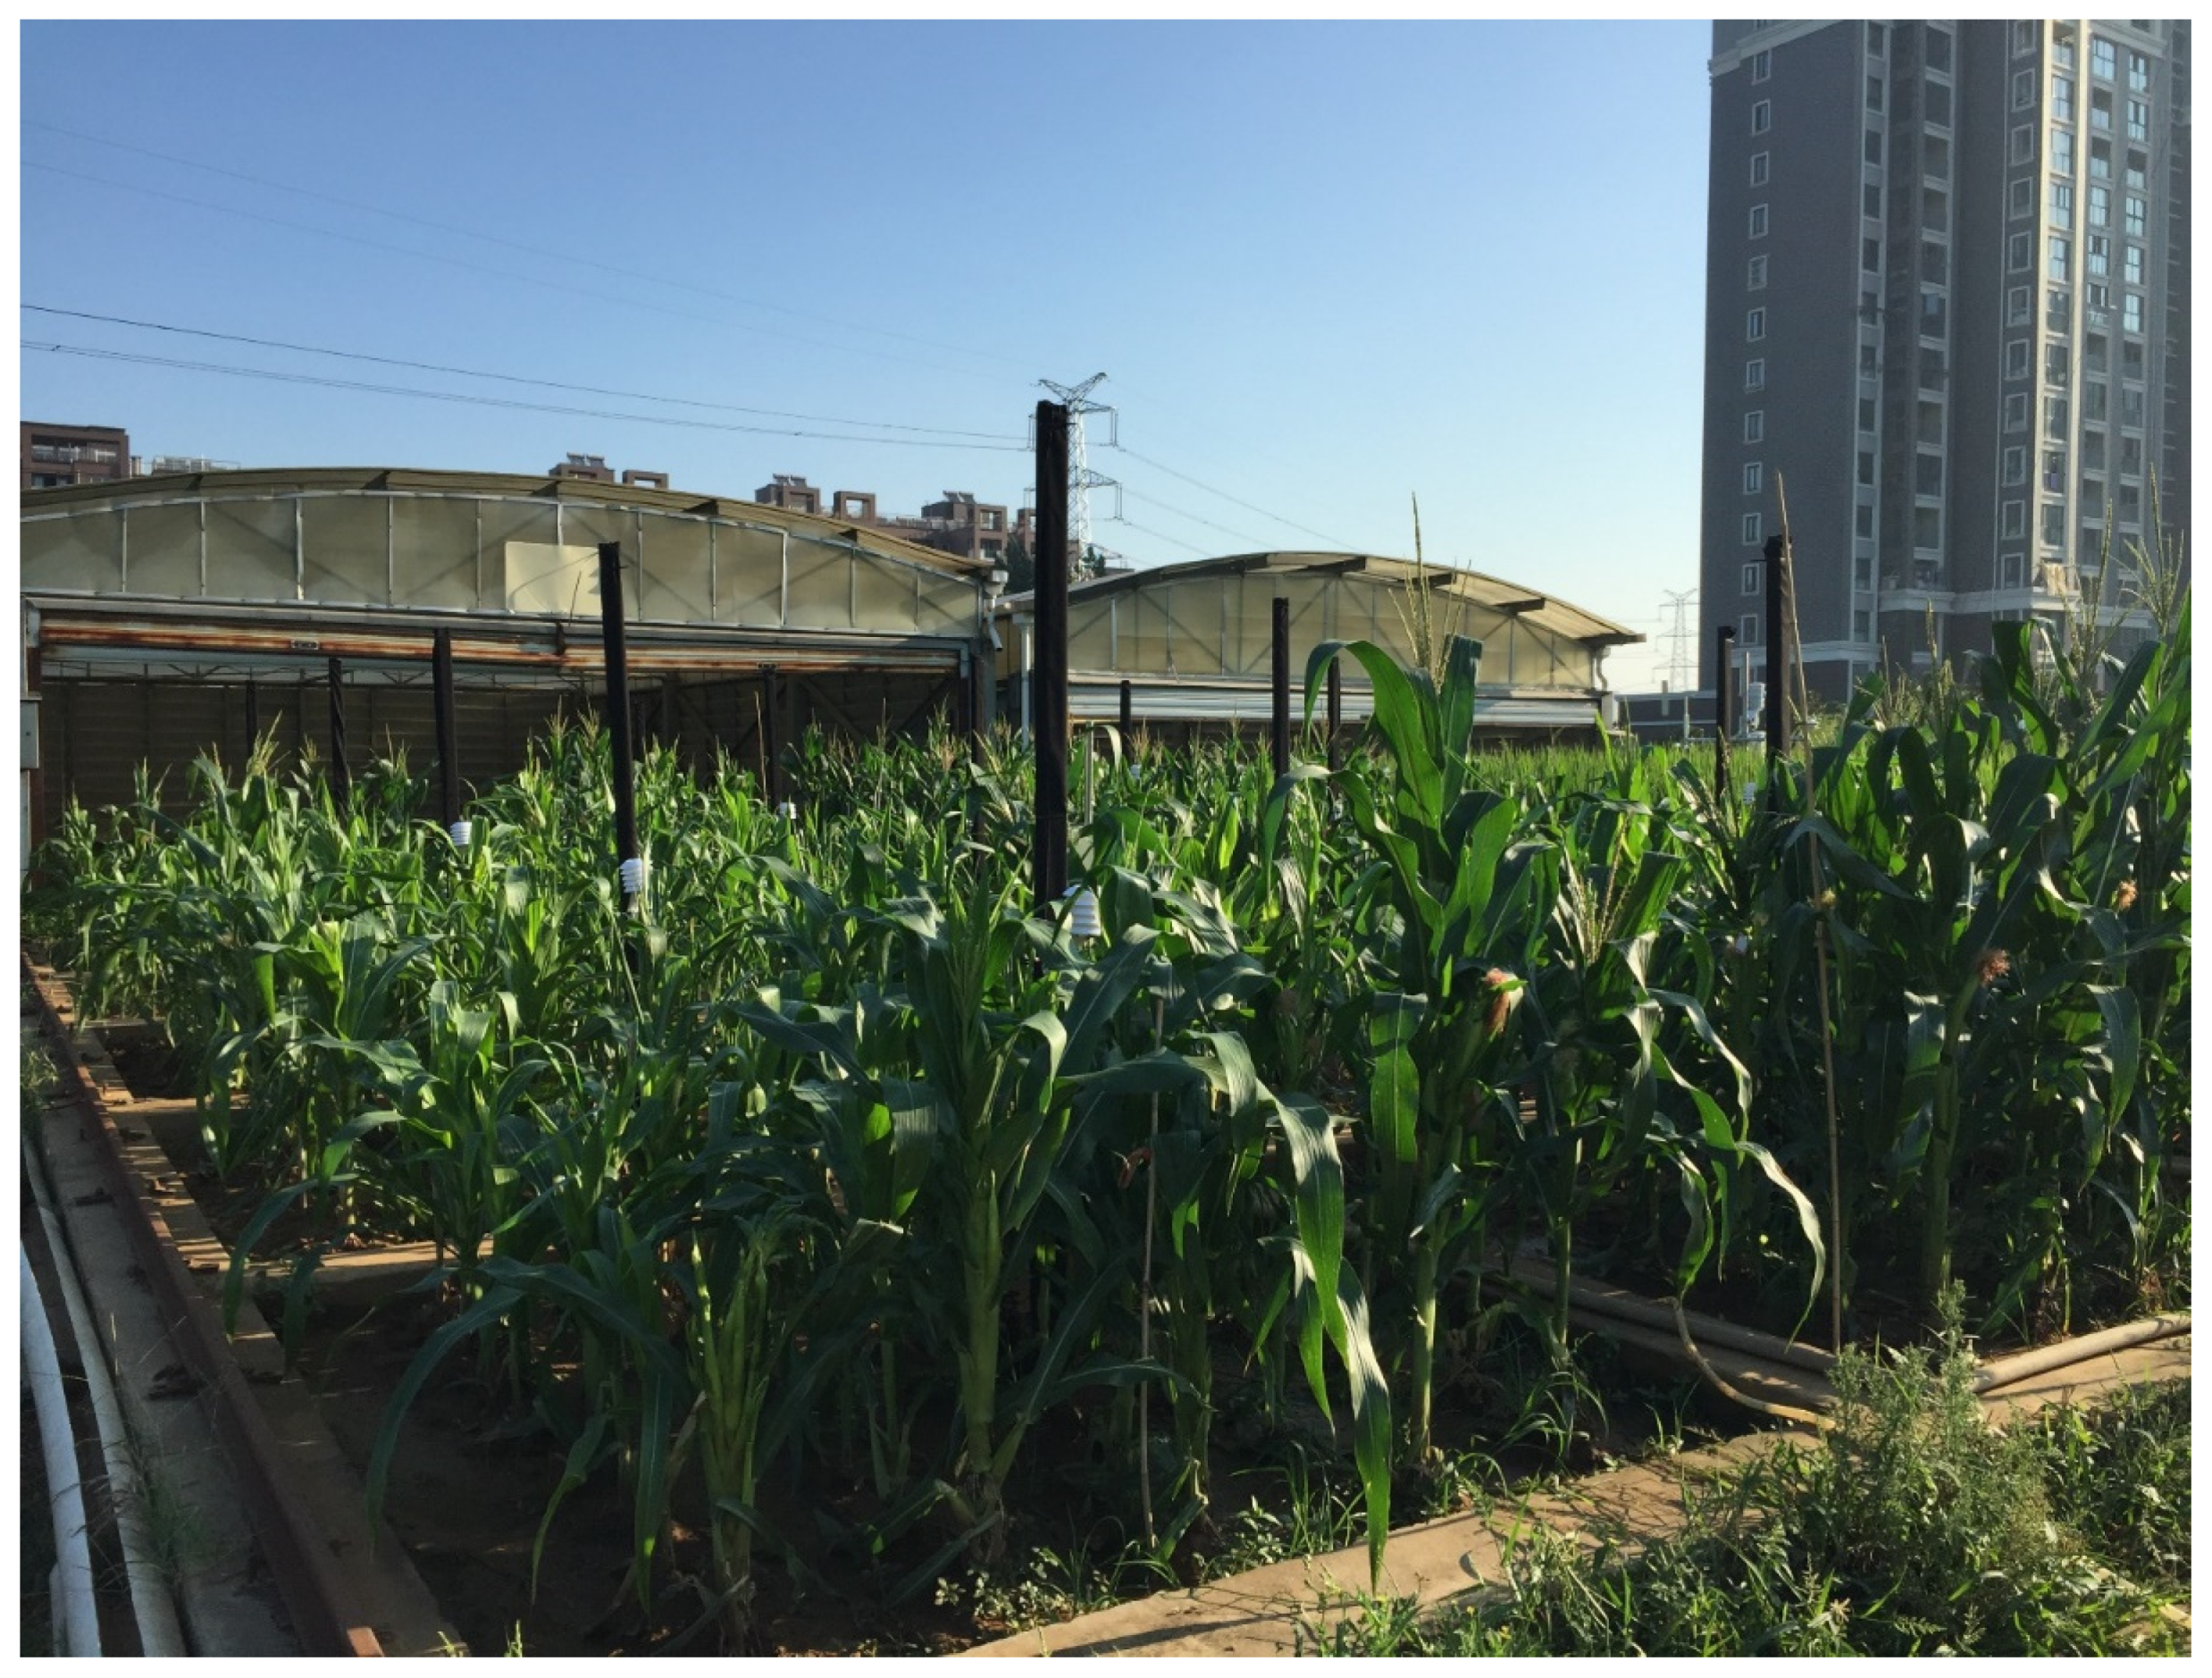
Figure 1. The water and fertilizer observation field of agrometeorological observation and experimental station of NUIST.
Agriculture 11 01180 g001
Figure 2. Layout of automatic observation instruments in each plot.
Agriculture 11 01180 g002
Figure 3. Leaf spectral characteristics of summer maize at the tasseling-silking stage (ST2) and maturity stage (ST3) under continuous water stresses.
Agriculture 11 01180 g003
Figure 4. Canopy spectral characteristics of summer maize at different growth stages under continuous water stresses.
Agriculture 11 01180 g004
Figure 5. Leaf and soil spectral reflectance of summer maize under continuous water stresses.
Agriculture 11 01180 g005
Figure 6. Influences of different LAI on canopy spectral reflectance under continuous water stresses.
Agriculture 11 01180 g006
Figure 7. Correlation coefficient between different LAI and canopy spectral reflectance under continuous water stresses.
Agriculture 11 01180 g007
Figure 8. Influences of different LIA on canopy spectral reflectance under continuous water stresses.
Agriculture 11 01180 g008aAgriculture 11 01180 g008b
Figure 9. Effects of different LAI on vegetation index under continuous water stresses.
Agriculture 11 01180 g009aAgriculture 11 01180 g009b
Figure 10. Effects of different LIA on vegetation index under continuous water stresses.
Agriculture 11 01180 g010
Table 1. Irrigation scheme for maize growth period (FC, %).
Water TreatmentVegetative Stage (ST1)Tasseling-Silking Stage (ST2)Maturity Stage (ST3)
SeedingJointingTasselingAnthesisSilkingMilk-RipeMature
W180–9035–4535–4535–4535–4535–4535–45
W280–9050–6050–6050–6050–6050–6050–60
W380–9065–7565–7565–7565–7565–7565–75
W480–9080–9080–9080–9080–9080–9080–90
W580–9095–10595–10595–10595–10595–10595–105
Table 2. Input parameters to the Prospect model for simulating leaf reflectance.
Input ParametersW1W2W3W4W5
Chlorophyll A + B content (µg/cm2)3042515852
Leaf equivalent water thickness (g/cm2)0.01380.0150.01470.0170.0146
Dry matter content (g/cm2)0.00490.00460.00430.00380.0036
Leaf structure parameter (N)1.5
Note: The sample sizes were 135, 130, and 130 plots for chlorophyll A + B content, leaf equivalent water thickness, and dry matter content, respectively. The detailed statistical analyses can be found in the Supplementary Materials.
Table 3. The input parameters of Prospect and Sail models when simulating the impact of LAI on the leaf-canopy scale effect.
ModelParametersW1W2W3W4W5
ProspectChlorophyll A + B content (µg/cm²)3042515852
Leaf equivalent water thickness (g/cm²)0.01380.0150.01470.0170.0146
Dry matter content (g/cm²)0.00490.00460.00430.00380.0036
Leaf structure parameter (N)1.5
SailLAI0.50, 0.80, 1.00, 1.50, 2.00, 3.00, 4.00, 5.00, 6.00, 7.00
LIA (°)45
Latitude (°)32
Sun declination angle (°)0
Observe zenith angle (°)0
View azimuth angle (°)0
Note: The sample sizes were 135, 130, and 130 plots for chlorophyll A + B content, leaf equivalent water thickness, and dry matter content, respectively. The detailed statistical analyses can be found in the Supplementary Materials.
Table 4. The input parameters of Prospect and Sail models when simulating the impact of LIA on the leaf-canopy scale effect.
ModelParametersW1W2W3W4W5
ProspectChlorophyll A + B content (µg/cm²)3042515852
Leaf equivalent water thickness (g/cm²)0.01380.0150.01470.0170.0146
Dry matter content (g/cm²)0.00490.00460.00430.00380.0036
Leaf structure parameter (N)1.5
SailLAI1, 4
LIA (°)25, 35, 45, 55, 65, 75
Latitude (°)32
Sun declination angle (°)0
Observe zenith angle (°)0
View azimuth angle (°)0
Note: The sample sizes were 135, 130, and 130 plots for chlorophyll A + B content, leaf equivalent water thickness, and dry matter content, respectively. The detailed statistical analyses can be found in the Supplementary Materials.
Publisher’s Note: MDPI stays neutral with regard to jurisdictional claims in published maps and institutional affiliations.