Author Contributions
Methodology, software, data curation, and writing—original draft, Y.L. (Yanbin Liu); conceptualization, funding acquisition, and validation, Y.L. (Yaoming Liu); visualization and investigation, L.C.; supervision, T.Z.; writing—review and editing, Z.L. and M.H.; DEM model of rice grain and flexible rice straw, Z.S. All authors have read and agreed to the published version of the manuscript.
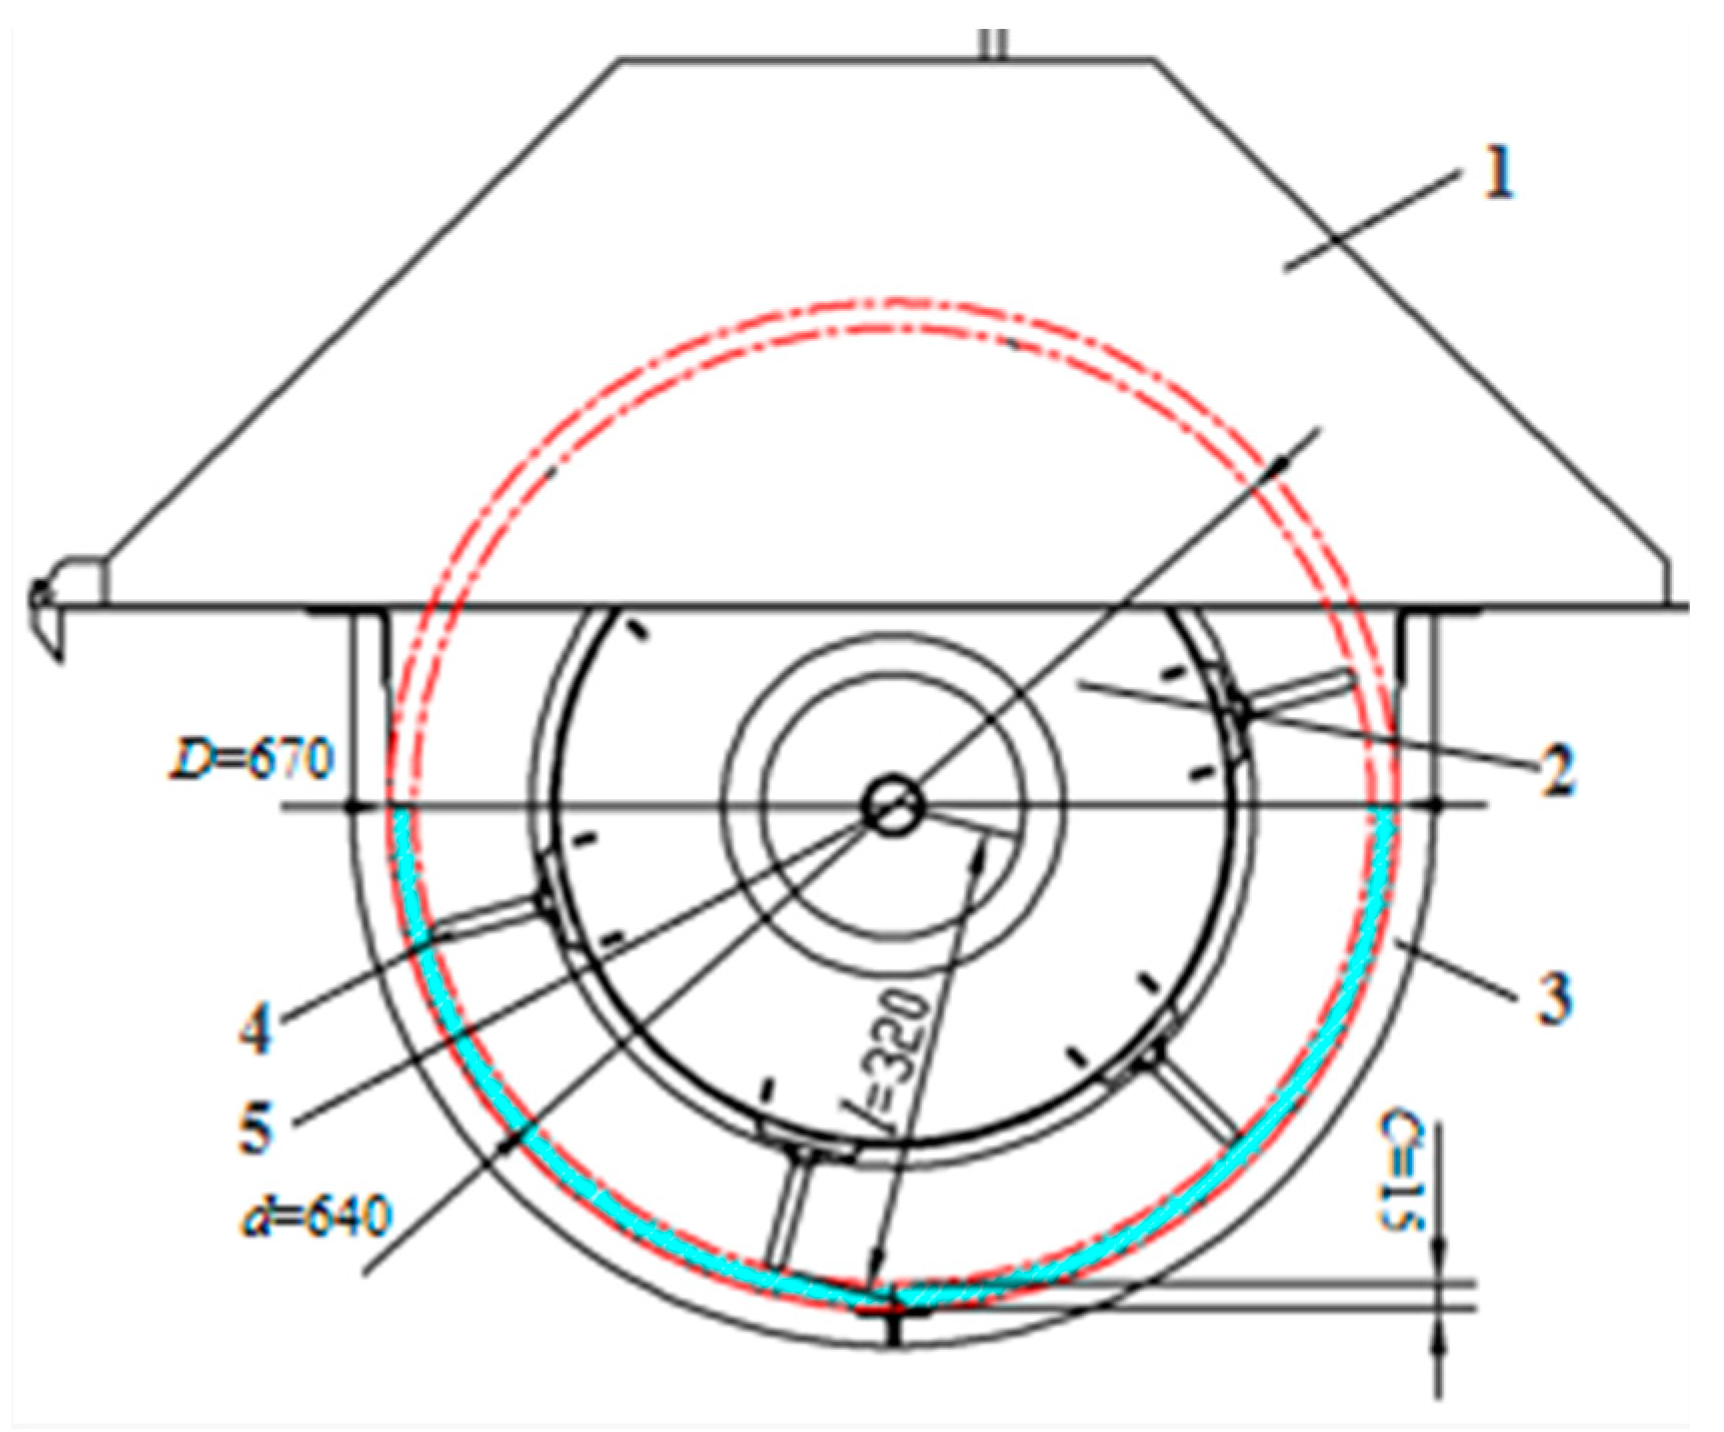
Figure 1.
Schematic diagram of the threshing device of YANMAR-AW82G combine harvester: 1—top cover; 2—threshing cylinder; 3—concave grid; 4—threshing cylinder tooth; 5—shaft; D and d are the diameters of the concave grid and threshing cylinder respectively, mm; C is the threshing gap, mm; l is the elongation of threshing rod (distance between the outer end of the threshing cylinder teeth and the center of the shaft), mm.
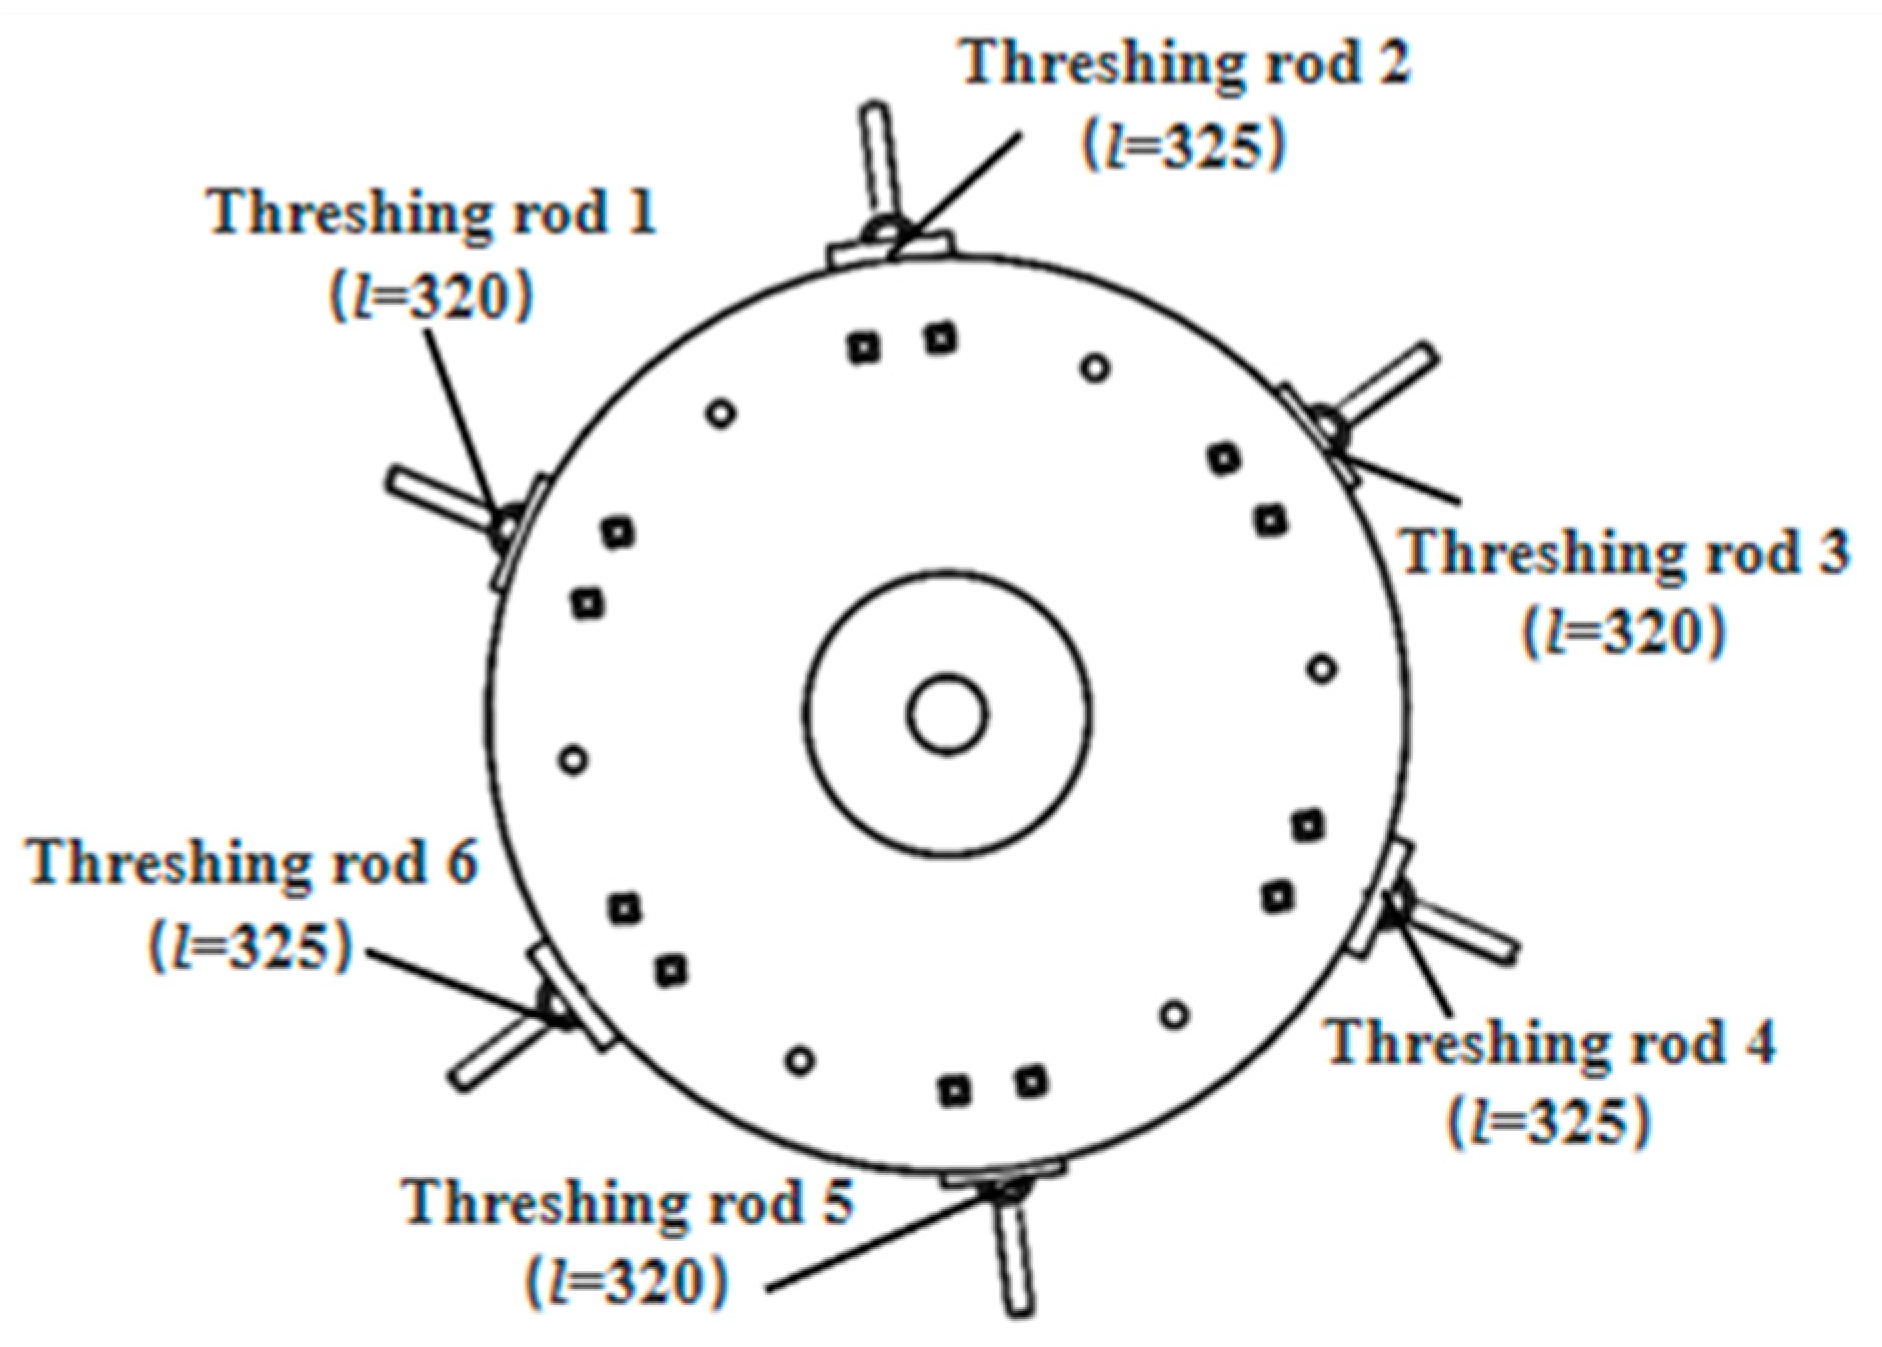
Figure 2.
Schematic diagram of the multi-threshing gaps and the threshing rods 1–6.
Figure 2.
Schematic diagram of the multi-threshing gaps and the threshing rods 1–6.
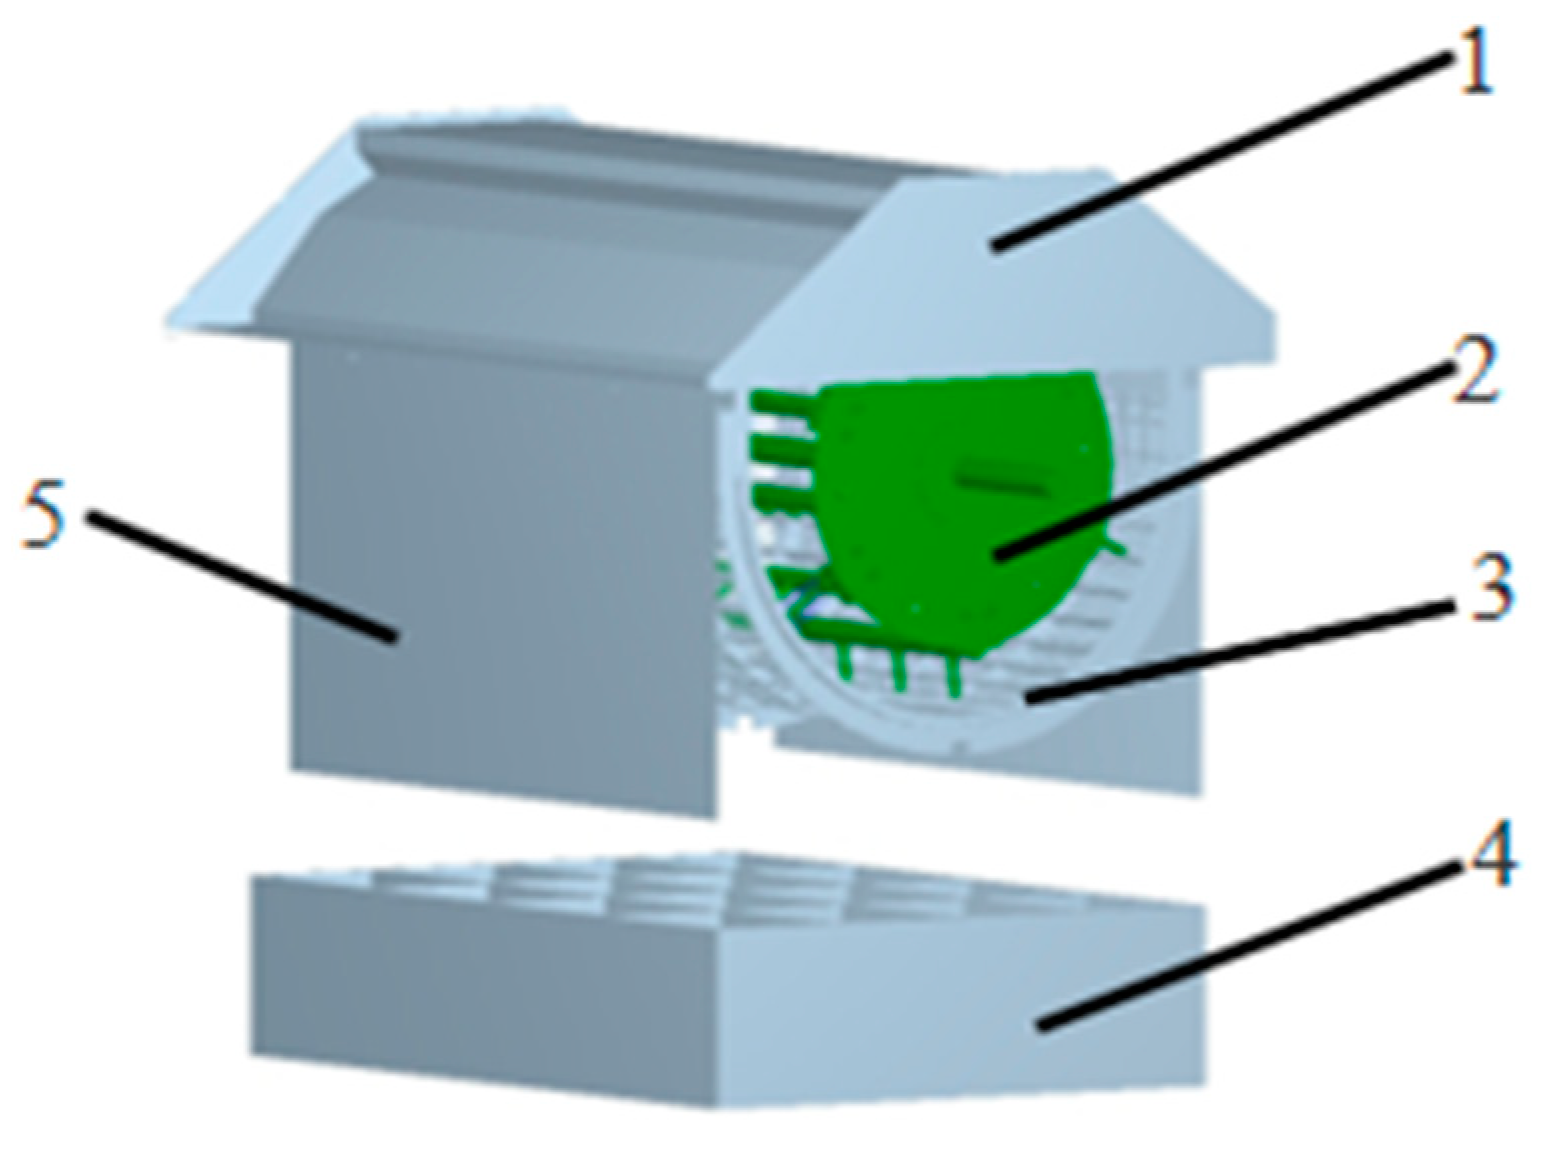
Figure 3.
Schematic diagram of simulation model of threshing device: 1—top cover; 2—threshing cylinder; 3—concave grid; 4—reception box; 5—guard plate.
Figure 3.
Schematic diagram of simulation model of threshing device: 1—top cover; 2—threshing cylinder; 3—concave grid; 4—reception box; 5—guard plate.
Figure 4.
DEM model of rice grain (a) and flexible rice straw (b).
Figure 4.
DEM model of rice grain (a) and flexible rice straw (b).
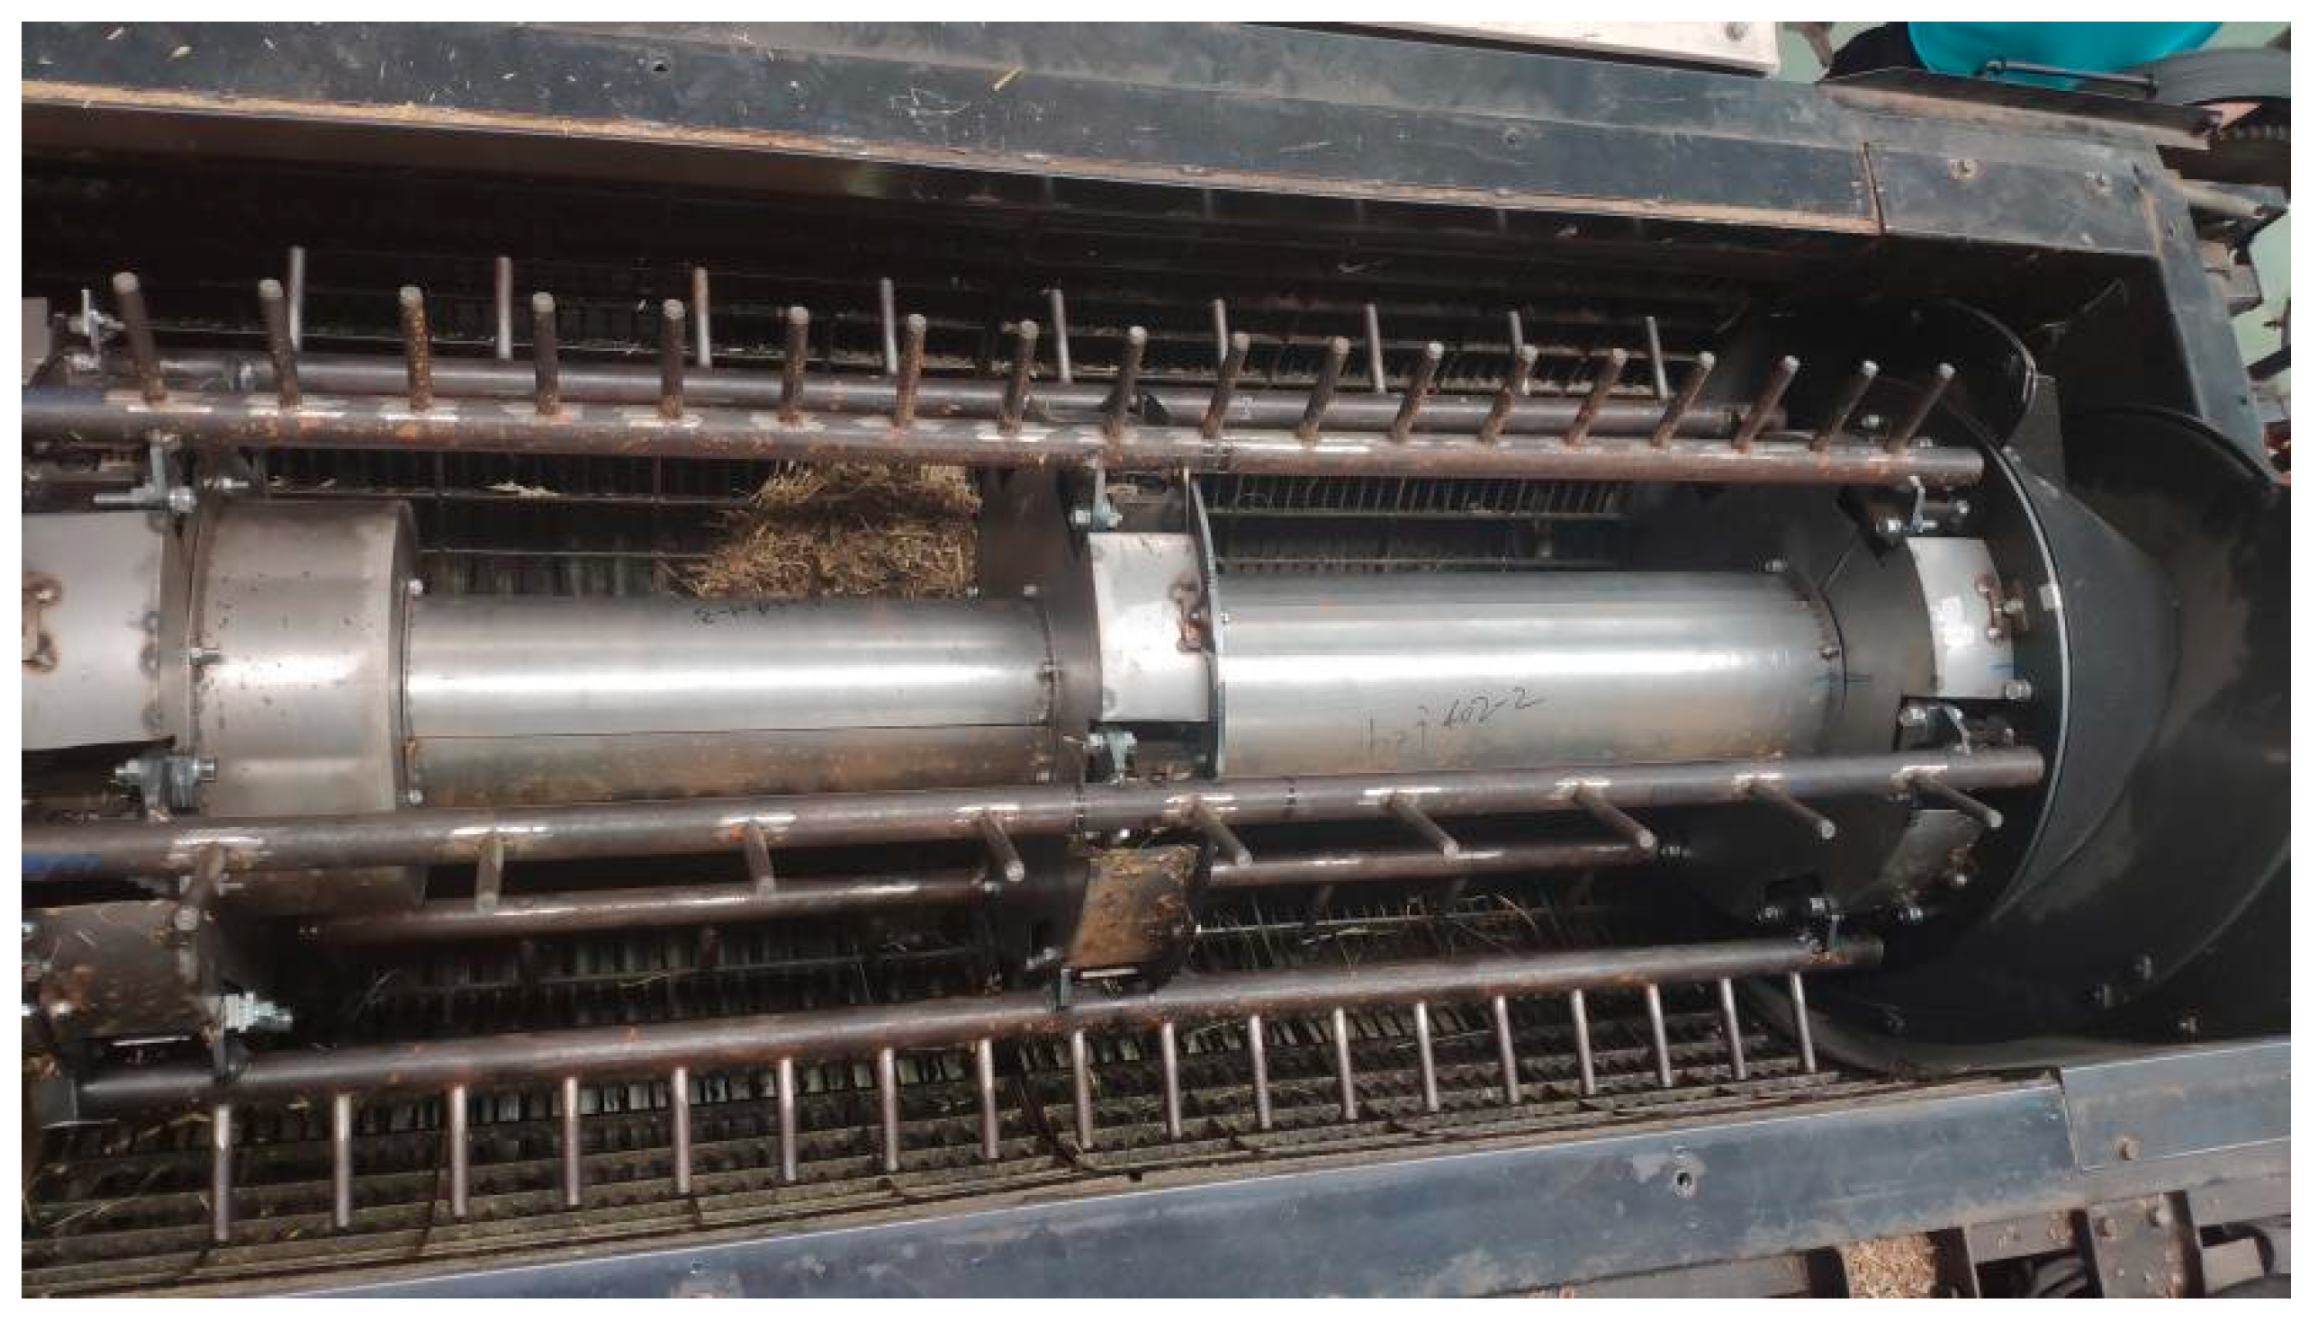
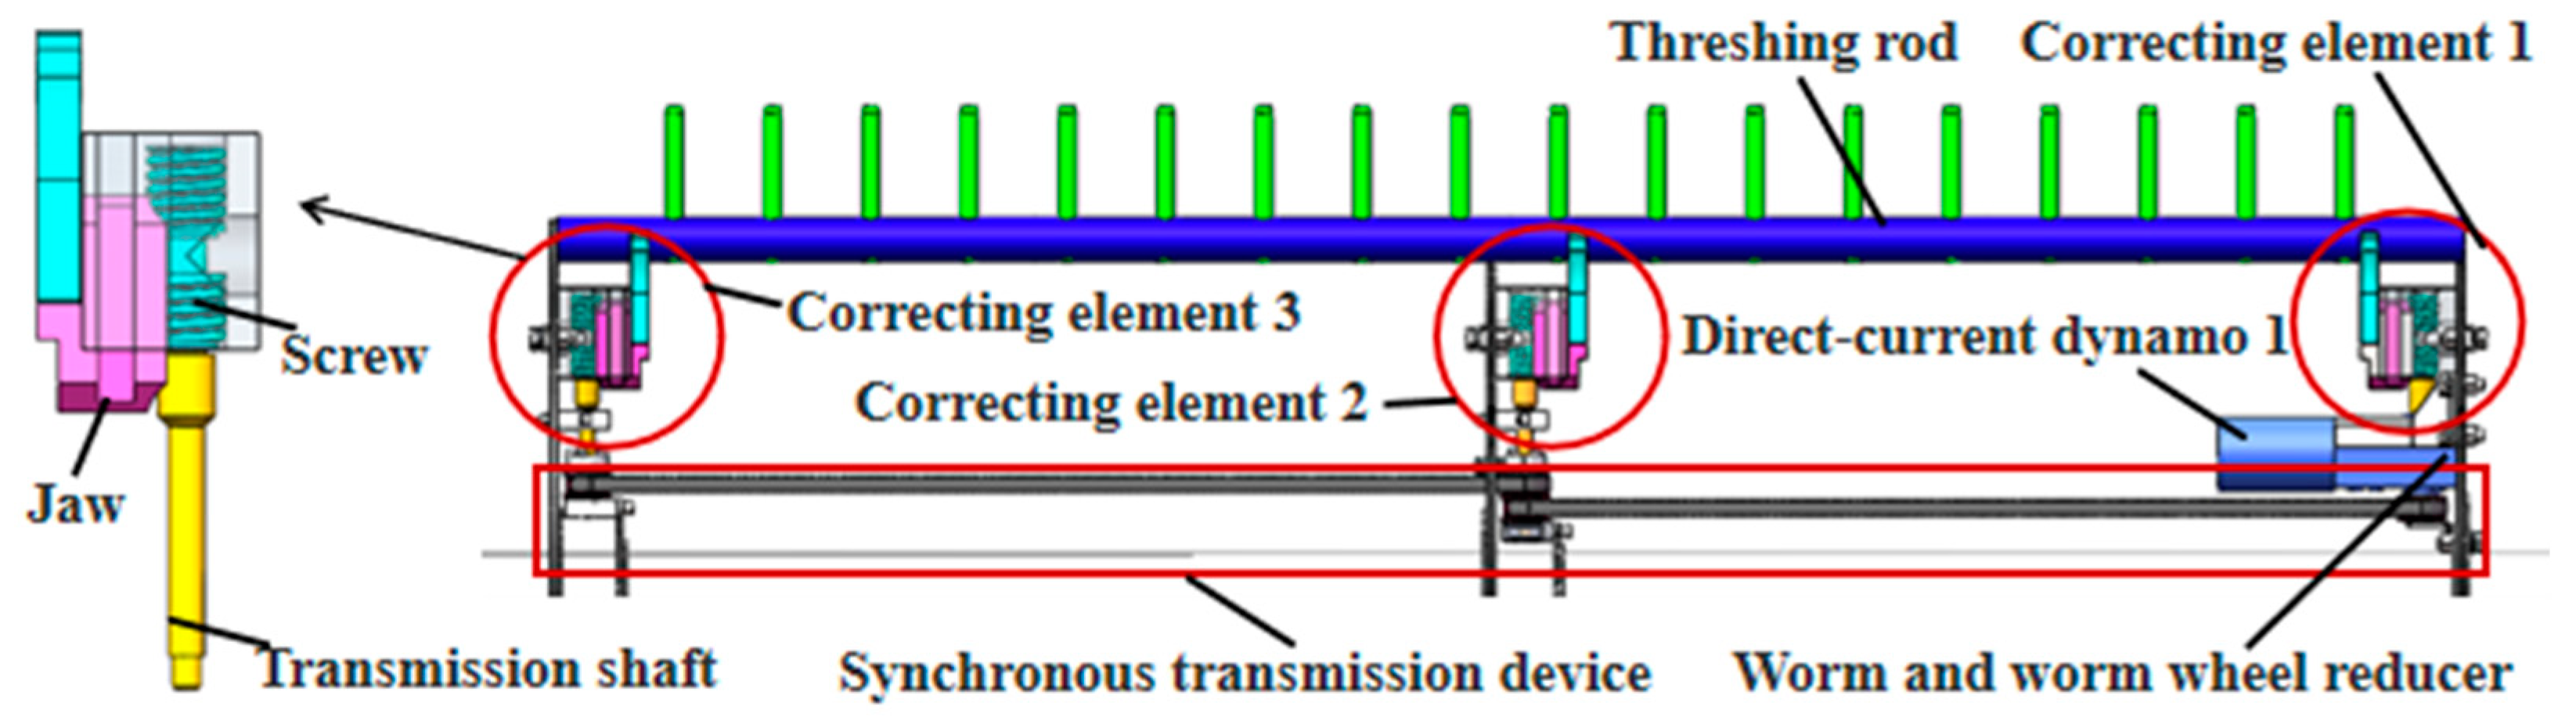
Figure 5.
Threshing device for individually adjusting threshing rod elongation.
Figure 5.
Threshing device for individually adjusting threshing rod elongation.
Figure 6.
Schematic diagram of working principle.
Figure 6.
Schematic diagram of working principle.
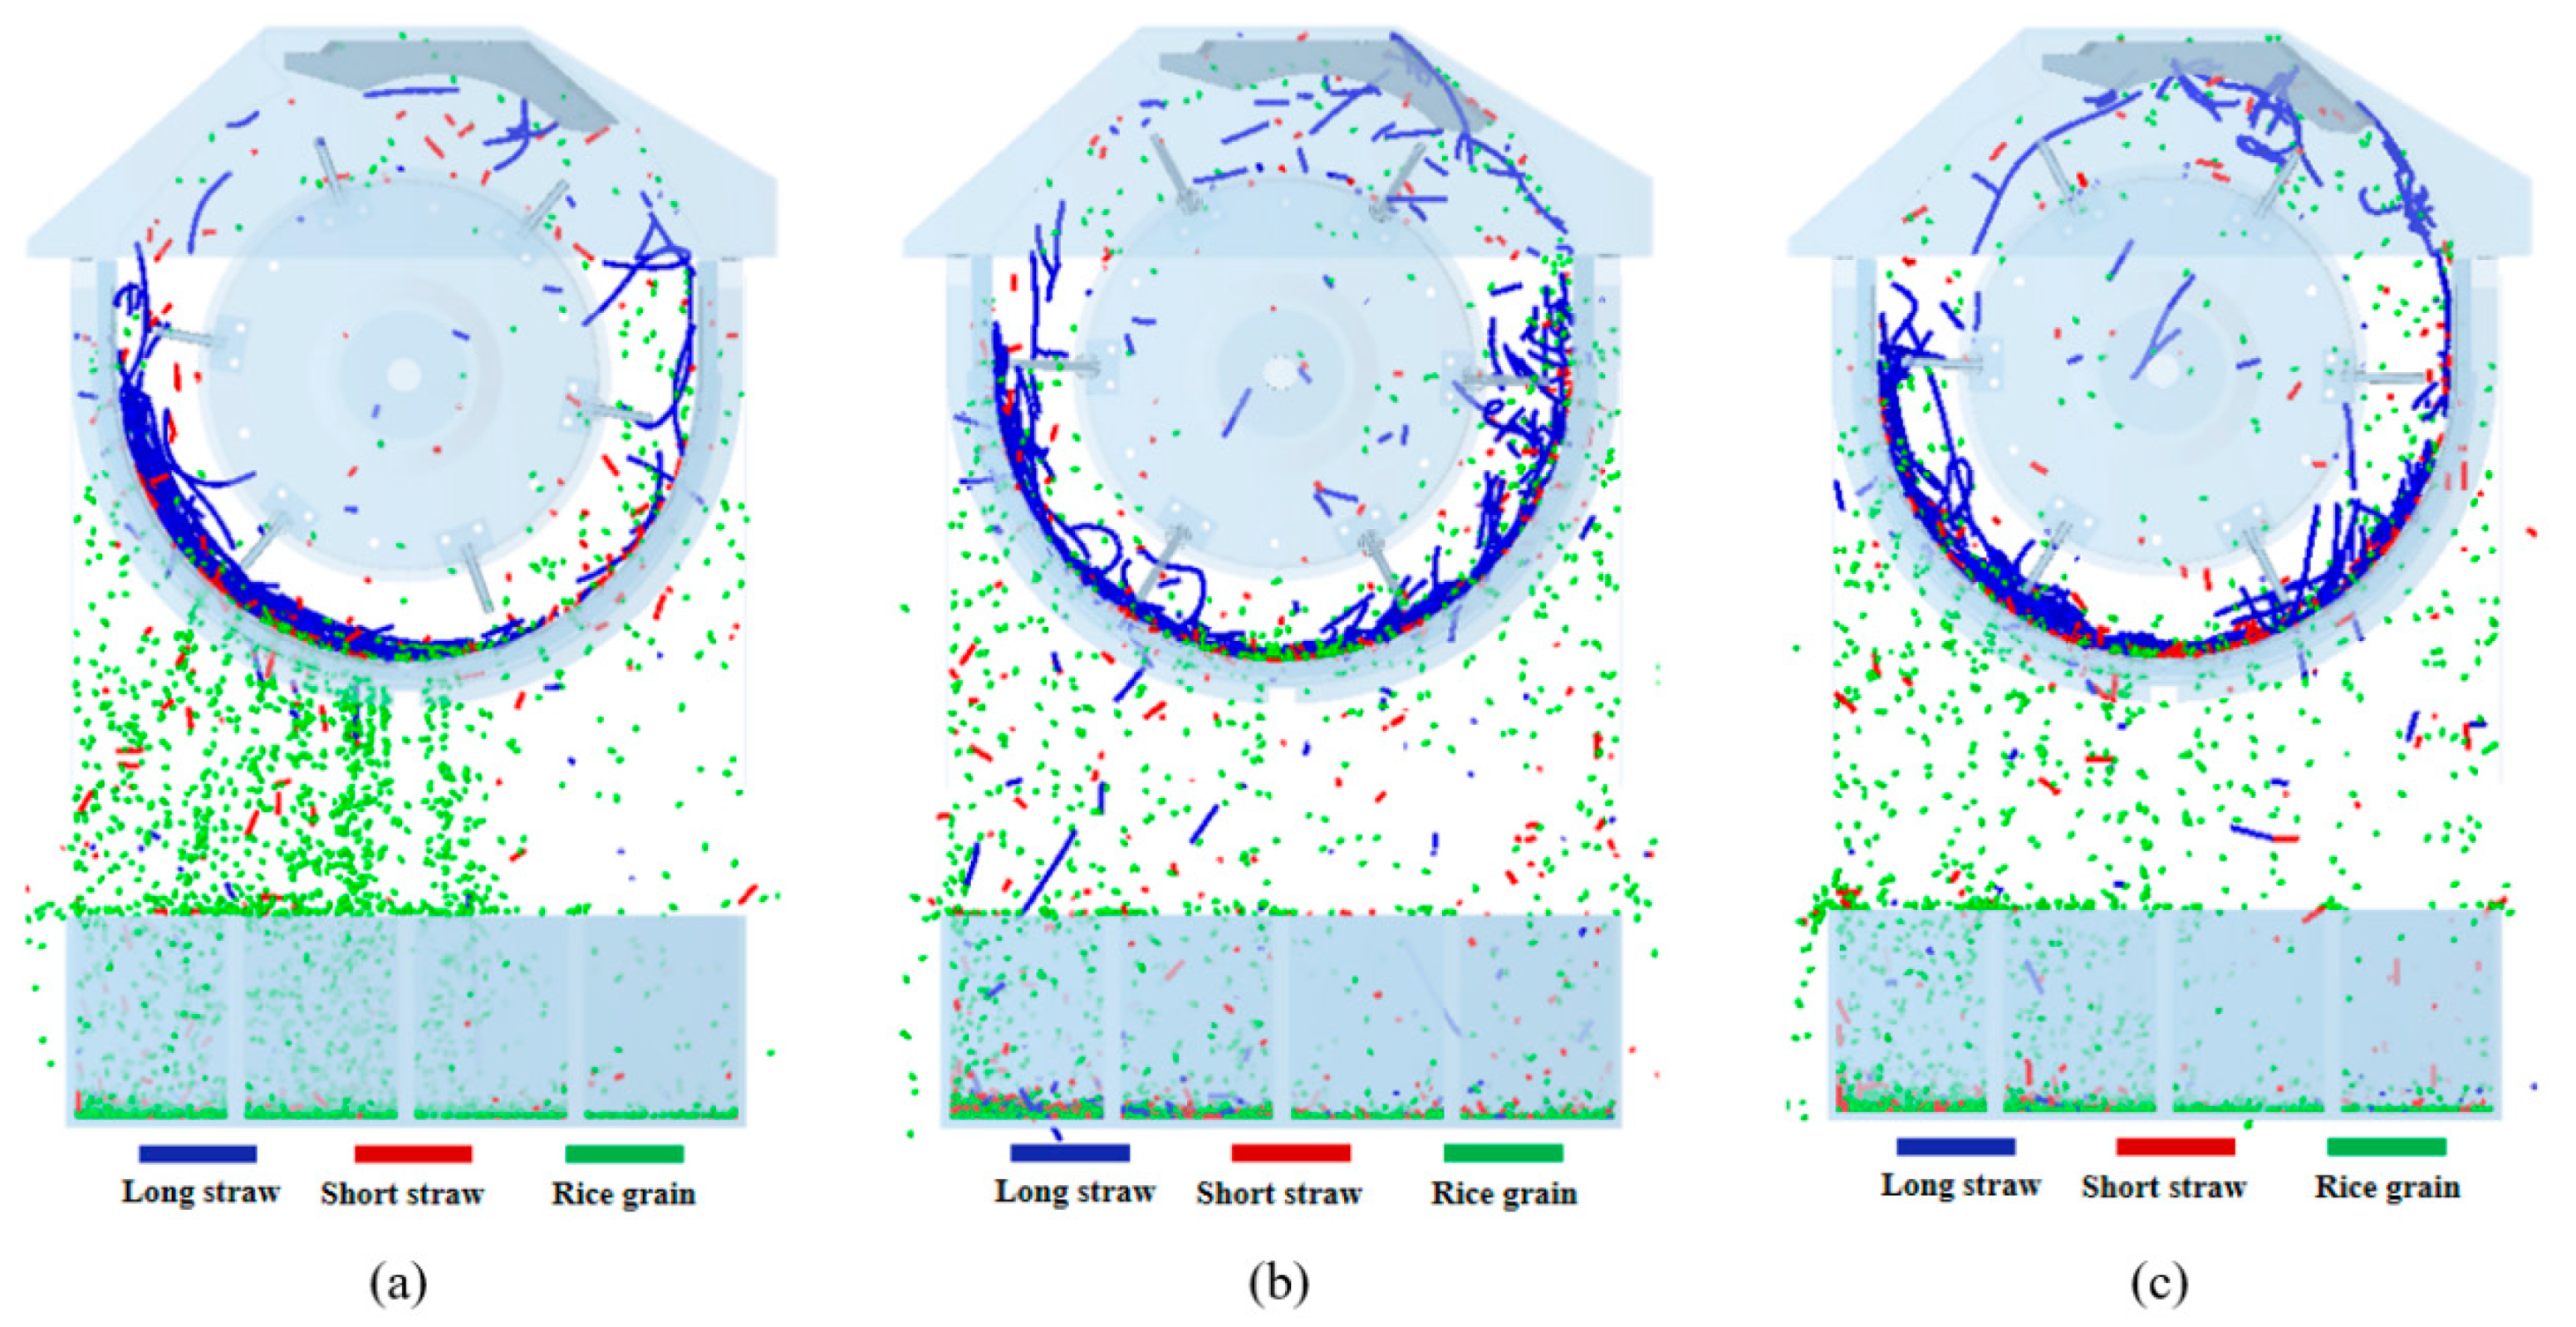
Figure 7.
Circumferential distribution of rice mixture in the concentric threshing device at 0.5 s: (a) single threshing gap of 15 mm; (b) single threshing gap of 10 mm; (c) multi-threshing gaps of 10 mm and 15 mm.
Figure 7.
Circumferential distribution of rice mixture in the concentric threshing device at 0.5 s: (a) single threshing gap of 15 mm; (b) single threshing gap of 10 mm; (c) multi-threshing gaps of 10 mm and 15 mm.
Figure 8.
Circumferential distribution of rice mixture in the concentric threshing device at 1 s: (a) single threshing gap of 15 mm; (b) single threshing gap of 10 mm; (c) multi-threshing gaps of 10 mm and 15 mm.
Figure 8.
Circumferential distribution of rice mixture in the concentric threshing device at 1 s: (a) single threshing gap of 15 mm; (b) single threshing gap of 10 mm; (c) multi-threshing gaps of 10 mm and 15 mm.
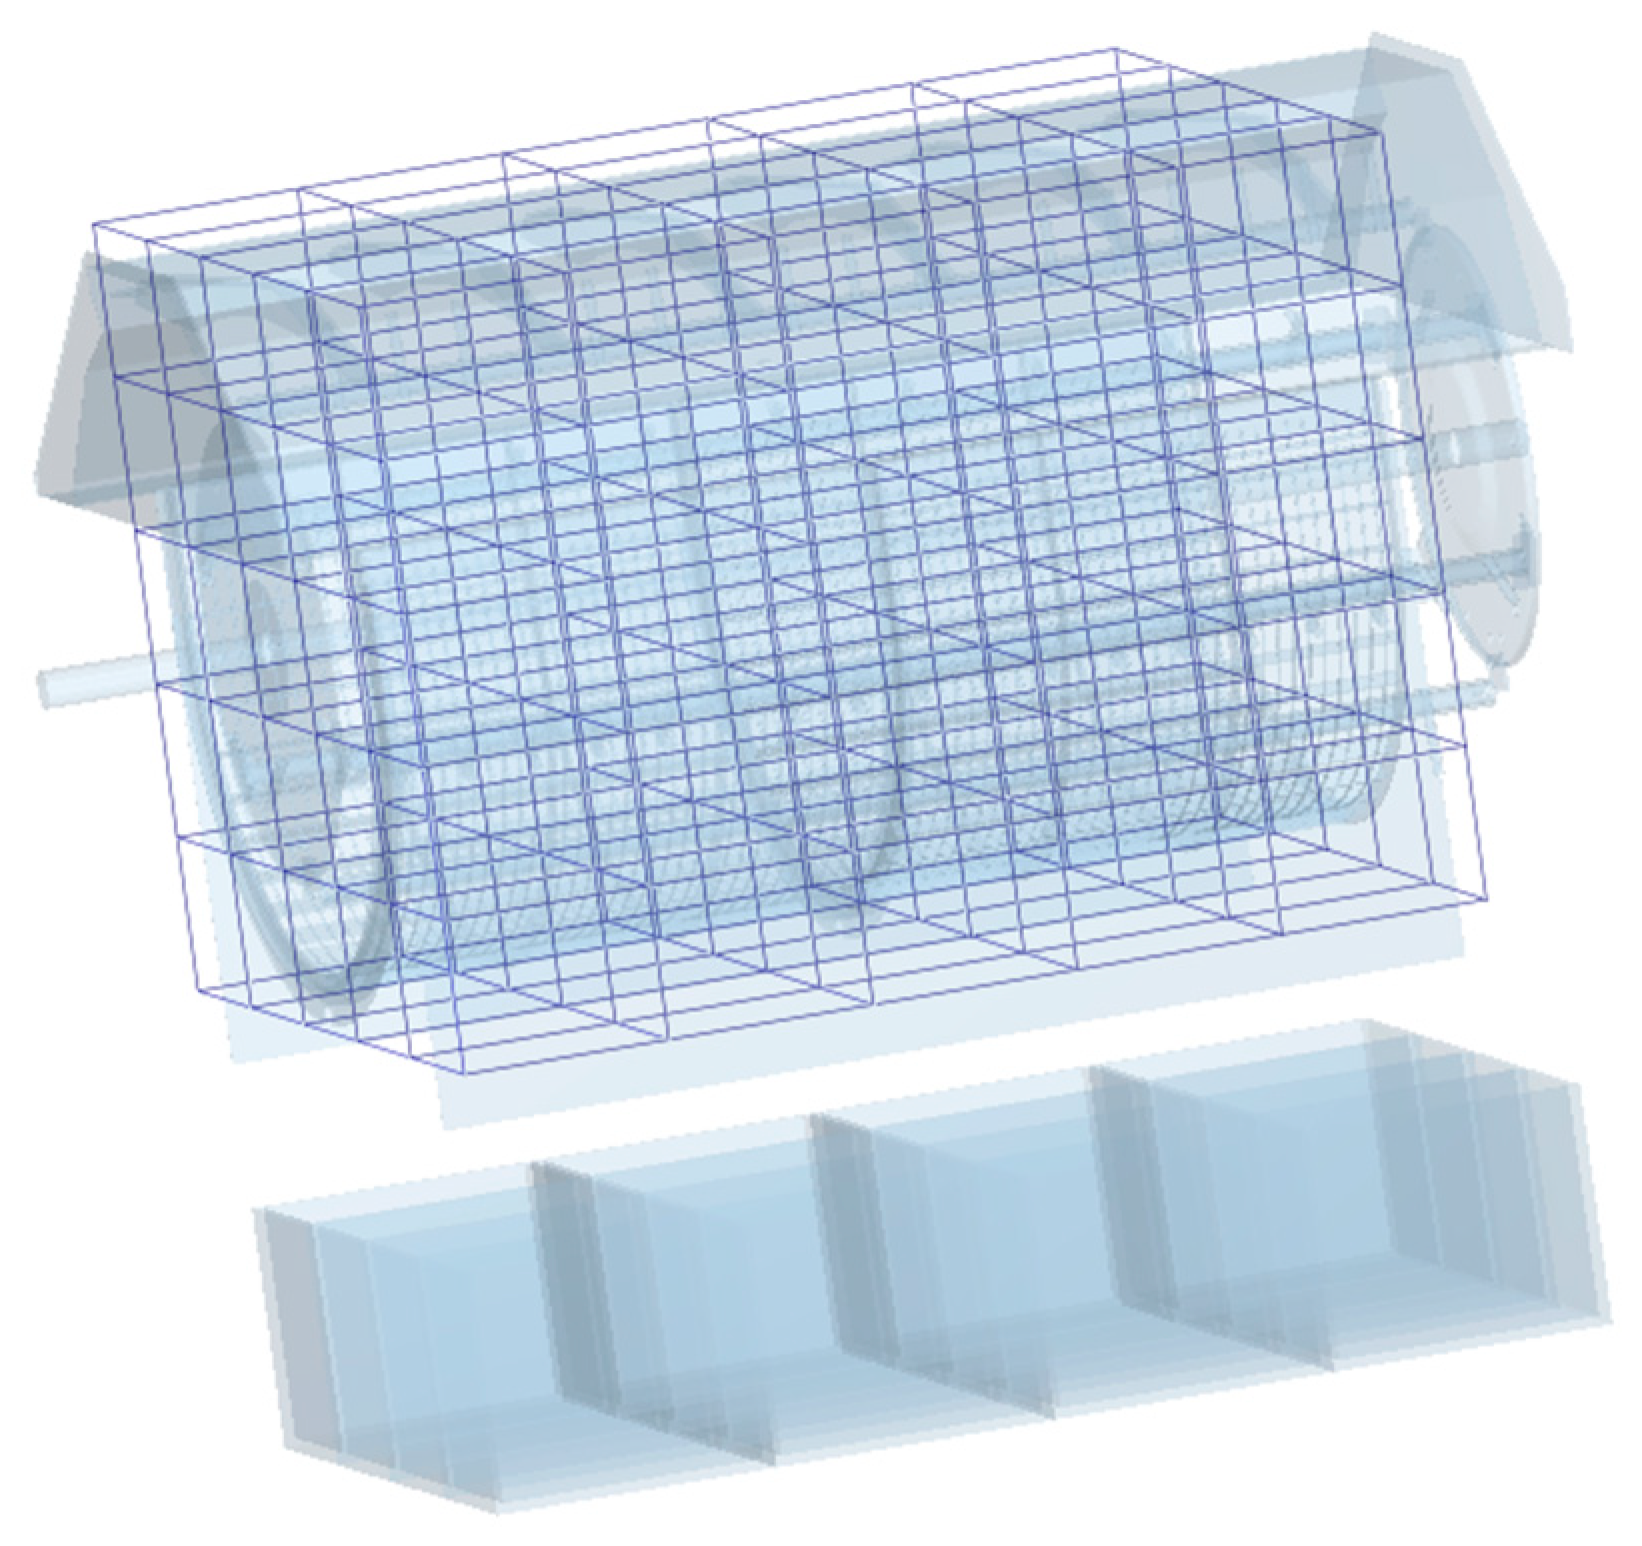
Figure 9.
Grid bin group 1.
Figure 9.
Grid bin group 1.
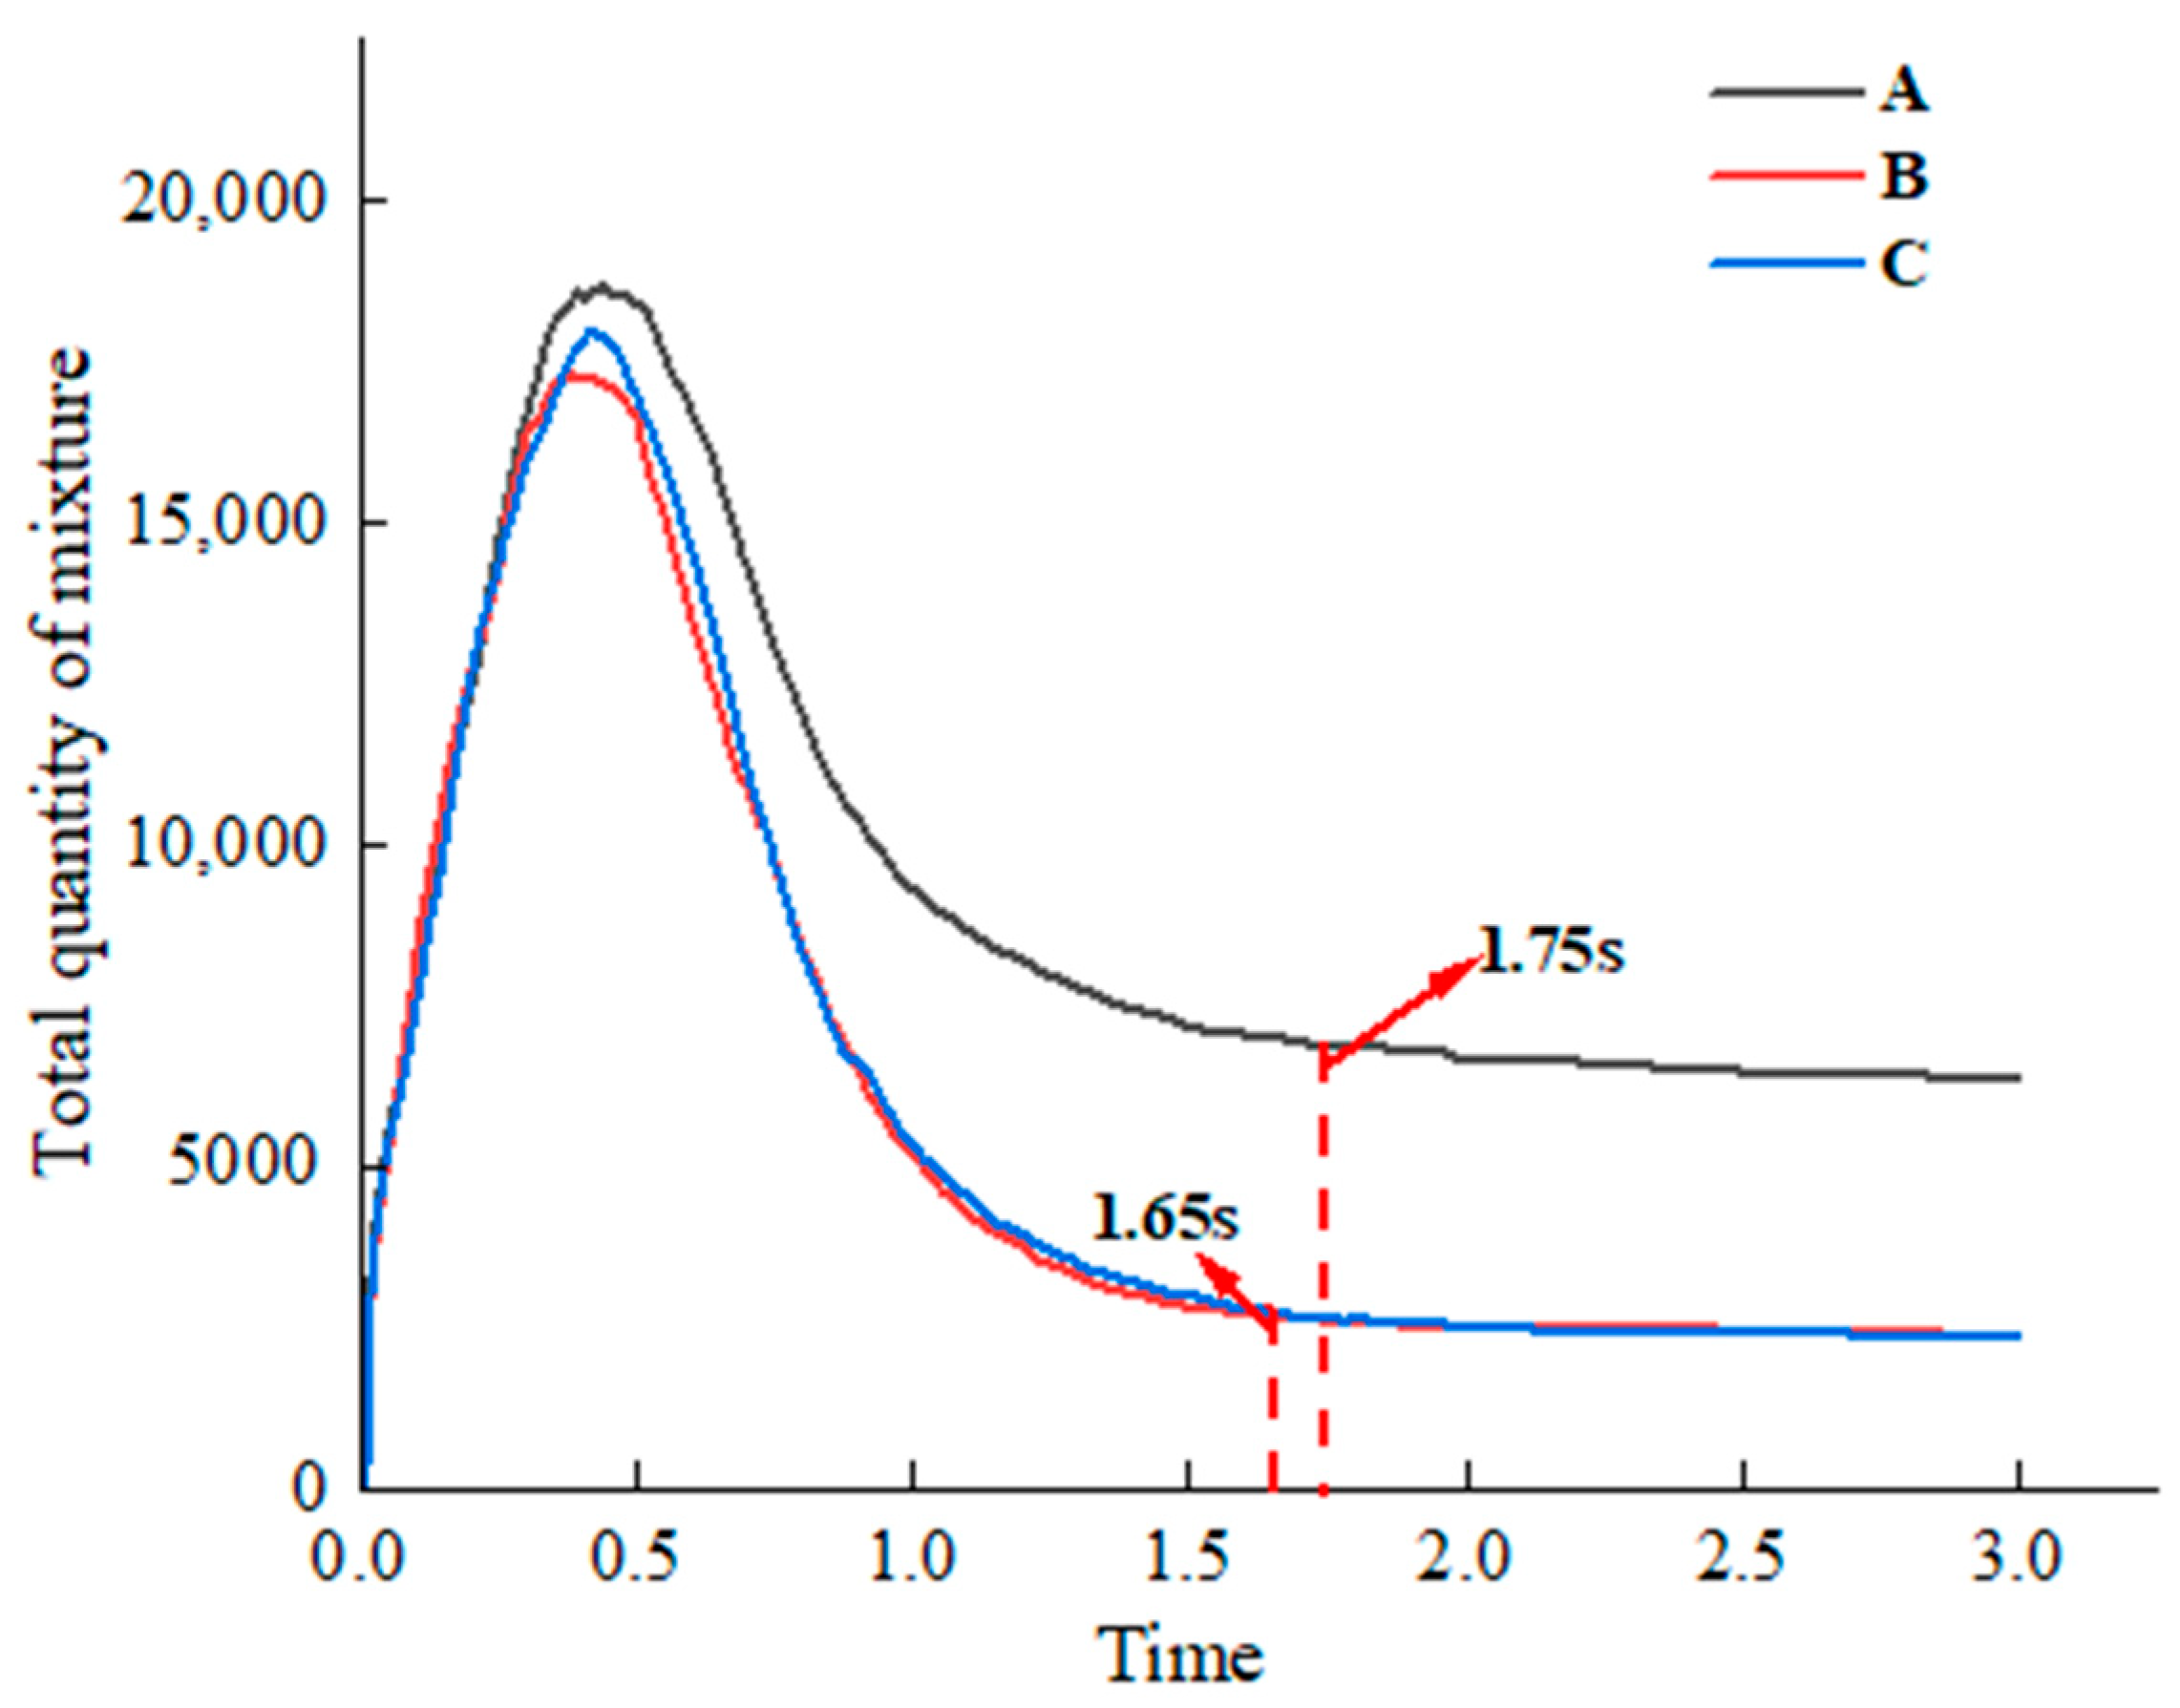
Figure 10.
The relationship between the total quantity of mixture in the concentric threshing device and time: (A) single threshing gap of 15 mm; (B) single threshing gap of 10 mm; (C) multi-threshing gaps of 10 mm and 15 mm.
Figure 10.
The relationship between the total quantity of mixture in the concentric threshing device and time: (A) single threshing gap of 15 mm; (B) single threshing gap of 10 mm; (C) multi-threshing gaps of 10 mm and 15 mm.
Figure 11.
The relationship between the average velocity of mixture in the concentric threshing device and time: (A) single threshing gap of 15 mm; (B) single threshing gap of 10 mm; (C) multi-threshing gaps of 10 mm and 15 mm.
Figure 11.
The relationship between the average velocity of mixture in the concentric threshing device and time: (A) single threshing gap of 15 mm; (B) single threshing gap of 10 mm; (C) multi-threshing gaps of 10 mm and 15 mm.
Figure 12.
Grid bin group 2.
Figure 12.
Grid bin group 2.
Figure 13.
Percentage quantity distributions of the threshed output mixture in reception boxes: (a) single threshing gap of 15 mm; (b) single threshing gap of 10 mm; (c) multi-threshing gaps of 10 mm and 15 mm.
Figure 13.
Percentage quantity distributions of the threshed output mixture in reception boxes: (a) single threshing gap of 15 mm; (b) single threshing gap of 10 mm; (c) multi-threshing gaps of 10 mm and 15 mm.
Figure 14.
The relationship among the grain unthreshed rate, grain damage rate, total loss rate, and forward speed for different threshing gaps of the concentric threshing device: (A) single threshing gap of 15 mm; (B) single threshing gap of 10 mm; (C) multi-threshing gaps of 10 mm and 15 mm; the numbers denote the total loss rate of C.
Table 1.
Combination method of the threshing rod elongation.
Table 1.
Combination method of the threshing rod elongation.
| No. l, mm | Threshing Rod 1 | Threshing Rod 2 | Threshing Rod 3 | Threshing Rod 4 | Threshing Rod 5 | Threshing Rod 6 |
|---|
| 1 | 320 | 320 | 320 | 320 | 320 | 320 |
| 2 | 325 | 325 | 325 | 325 | 325 | 325 |
| 3 | 320 | 325 | 320 | 325 | 320 | 325 |
Table 2.
Material parameters setting in the DEM simulation [
6].
Table 2.
Material parameters setting in the DEM simulation [
6].
| Simulation Material | Poisson’s Ratio | Elastic Modulus E, MPa | Density, kg/m3 |
|---|
| Rice grain | 0.28 | 375 | 1350 |
| Rice straw | 0.4 | 2.8 | 215 |
| Steel | 0.3 | 2.06 × 10⁵ | 7800 |
Table 3.
Bonding parameters of the flexible rice straw [
6].
Table 3.
Bonding parameters of the flexible rice straw [
6].
| Bonding Parameters | Values |
|---|
| Bonded disk radius, mm | 2.11 |
| Normal bonding stiffness, N/m3 | 2.35 × 10⁹ |
| Tangential bonding stiffness, N/m3 | 7.91 × 10⁹ |
| Bonding parameters | Values |
Table 4.
Contact parameters between various materials [
6].
Table 4.
Contact parameters between various materials [
6].
| Contact Parameter | Restitution Coefficient | Static Friction Coefficient | Rolling Friction Coefficient |
|---|
| Rice grain–rice grain | 0.5 | 0.425 | 0.01 |
| Rice grain–rice straw | 0.2 | 0.8 | 0.01 |
| Rice grain–steel | 0.5 | 0.58 | 0.01 |
| Rice straw–rice straw | 0.2 | 0.9 | 0.01 |
| Rice straw–steel | 0.2 | 0.8 | 0.01 |
Table 5.
Physical properties of “Jia Hua” rice.
Table 5.
Physical properties of “Jia Hua” rice.
| Parameters | Values |
|---|
| Plant height (mm) | 792 |
| Ear length (mm) | 161 |
| Grain moisture content (%) | 20.6 |
| Straw moisture content (%) | 70.8 |
| Straw/grain ratio | 2.25 |
| Number of grains per ear | 135 |
| Thousand-seed mass (g) | 32.4 |
Table 6.
Experimental design.
Table 6.
Experimental design.
| No. | Forward Speed, m/s | Feeding Rate, kg/s | Threshing Gap, mm |
|---|
| 1 | 0.8 | 3.6 | A |
| 2 | 0.8 | 3.6 | B |
| 3 | 0.8 | 3.6 | C |
| 4 | 1.0 | 4.5 | A |
| 5 | 1.0 | 4.5 | B |
| 6 | 1.0 | 4.5 | C |
| 7 | 1.2 | 5.4 | A |
| 8 | 1.2 | 5.4 | B |
| 9 | 1.2 | 5.4 | C |
Table 7.
Statistical table of the mean (M), standard deviation (SD), and standard deviation coefficients (SDC) of percentage distributions along the Y-axis on coordinates X1, X2, X3, and X4: (A) single threshing gap of 15 mm; (B) single threshing gap of 10 mm; (C) multi-threshing gaps of 10 mm and 15 mm.
| Model | Item | X1 (Y) | X2 (Y) | X3 (Y) | X4 (Y) |
|---|
| A | M ± SD | 15.8456 ± 6.7516 | 6.707 ± 2.9211 | 1.882 ± 0.5143 | 0.5655 ± 0.2191 |
| SDC | 42.61% | 43.55% | 27.33% | 38.74% |
| B | M ± SD | 15.7483 ± 6.7529 | 6.8144 ± 2.7786 | 1.8859 ± 0.5675 | 0.556 ± 0.1560 |
| SDC | 42.89% | 40.77% | 30.09% | 28.06% |
| C | M ± SD | 15.3112 ± 5.7408 | 7.3771 ± 1.8384 | 2.0375 ± 0.5687 | 0.5492 ± 0.3643 |
| SDC | 37.49% | 24.92% | 27.91% | 66.33% |
Table 8.
Statistical table of the mean (M), standard deviation (SD), and standard deviation coefficients (SDC) of percentage distributions along the X-axis on coordinates Y1, Y2, Y3, and Y4: (A) single threshing gap of 15 mm; (B) single threshing gap of 10 mm; (C) multi-threshing gaps of 10 mm and 15 mm.
| Model | Item | Y1 (X) | Y2 (X) | Y3 (X) | Y4 (X) | All |
|---|
| A | M ± SD | 3.768 ± 2.8267 | 5.1652 ± 6.0181 | 7.3787 ± 9.8535 | 8.6881 ± 9.2354 | 6.25 ± 7.0143 |
| SDC | 75.02% | 116.51% | 133.54% | 106.30% | 112.23% |
| B | M ± SD | 4.0457 ± 3.1655 | 4.7359 ± 5.318 | 7.4219 ± 9.5334 | 8.7965 ± 9.6796 | 6.25 ± 6.9670 |
| SDC | 78.24% | 112.29% | 128.45% | 110.04% | 111.47% |
| C | M ± SD | 4.1931 ± 3.1833 | 5.3775 ± 6.0256 | 7.8259 ± 9.1694 | 7.8785 ± 8.4221 | 6.25 ± 6.5564 |
| SDC | 75.92% | 112.05% | 117.17% | 106.90% | 104.90% |
Table 9.
Field test results.
Table 9.
Field test results.
| No. | Forward Speed, m/s | Threshing Gap, mm | Un-Threshed Rate, % | Damage Rate, % | Total Loss, % |
|---|
| 1 | 0.8 | A | 0.262 | 0.42 | 0.682 |
| 2 | 0.8 | B | 0.173 | 0.5 | 0.673 |
| 3 | 0.8 | C | 0.177 | 0.45 | 0.627 |
| 4 | 1.0 | A | 0.511 | 0.51 | 1.021 |
| 5 | 1.0 | B | 0.425 | 0.61 | 1.035 |
| 6 | 1.0 | C | 0.433 | 0.54 | 0.973 |
| 7 | 1.2 | A | 0.856 | 0.58 | 1.436 |
| 8 | 1.2 | B | 0.657 | 0.79 | 1.447 |
| 9 | 1.2 | C | 0.732 | 0.62 | 1.352 |


