Abstract
In the National park of Cilento, Vallo di Diano and Alburni (South Italy), a portion of a chestnut forest was converted in 2012 into an agricultural system in order to crop a local variety of bean. We investigated the effect over time of the conversion on the functional diversity of the soil microbial community by two different approaches: the catabolic response profile, based on the short time CO2 evolution induced by 25 simple organic substrates and the Biolog community level physiological profile (CLPP), based on the growth of microorganisms on 31 different substrates. The soils were sampled at 13, 17, 29, 41 and 49 months after the soil use change. The results showed that the soil use change did not produce evident modifications of the substrate utilization patterns, but rather a general decrease in the activity in the agricultural soils, as a consequence of the reduction in organic matter content. The results also showed seasonal effects on the substrate utilization profiles and on the calculated functional diversity indexes. The two approaches appeared to be complementary: Degens catabolic response profile was more able to discriminate between the two systems, whereas the Biolog was more able to highlight the variability among samplings.
1. Introduction
Forests cover roughly 30% of the world’s land area [1]. Besides their intrinsic beauty, they are a major provider of various vital components of a healthy and functioning Earth. They host 80% of the world’s terrestrial biodiversity and contain approximately 80% of the global terrestrial aboveground and 40% of the world’s belowground carbon stocks [2]. Moreover, they are an essential source of timber, food, medicine, fibers and shelter. Despite their importance, forests are rapidly disappearing around the world. Deforestation is the long-term or permanent human-induced destruction of forests practiced in order to make the land available for other uses, such as agriculture, pasture or urban areas [3]. An estimated 7.3 million hectares of forest, which is roughly the size of the country of Panama, is lost each year [4]. The drivers of deforestation are multiple and complex and depend on specific regional and national contexts. Agricultural expansion drives almost 80% of deforestation worldwide [5], while mining and urbanization/infrastructure were responsible for 7–10% each [6]. Deforestation occurs most concentrated in tropical rainforests [7], which are disappearing at a rate of about 13 million hectares per year (approximately the size of Greece).
However, the conversion of forests into agricultural systems is a topic of interest also in Mediterranean areas [8]. In Campania Region (South Italy), 4% of tree cover extent was lost from 2000 to 2018 [9]. The main environmental consequences of deforestation were the impact on the global C cycle which contributes to global climate change, the decay of air and soil quality, the changes in water cycles and the loss of biodiversity [7,8]. At a local scale, deforestation has an important impact on soil quality, mainly due to the reduction in litter input which leads to a dramatic decline in soil organic matter content and, consequently, of the natural productivity of soils. In fact, all the major physico-chemical and biological properties responsible for soil quality depend on soil organic matter. Hajabbasi et al. [10] reported a decline in physical and chemical soil properties after deforestation and the cultivation of natural soils under Quercus brontii: tillage practices resulted in almost a 20% increase in bulk density, 50% decrease in organic matter and total nitrogen, and a 10 to 15% decrease in soluble ions, compared to the undisturbed forest soil.
Soil organic matter content is also the main driver of the functional diversity of soil microbial community, since it is the trophic resource for the decomposing organisms, mainly represented by bacteria and fungi. In forest ecosystems, the specific tree cover strongly influences the metabolic abilities of soil microbial communities, determining the quantity and quality of organic carbon inputs to soil system, as well as its distribution during the year through litter fall and root exudates [11,12]. Organic inputs also determine several physico-chemical properties of soil environment such as pH, water holding capacity and structure which, in turn, may influence the metabolic activity of the soil microbial community.
The aim of this study was to investigate the effects of the conversion of a chestnut forest into an agricultural system on the functional diversity of the soil microbial community assessed by its metabolic fingerprint, i.e., the capability to use specific organic substrates as sources of carbon and energy. To achieve this goal, we used and compared two different analytical approaches: the catabolic response profile (CRP) of Degens and Harris [13], based on the short time CO2 evolution induced by 25 simple organic substrates, individually added to soil samples, and the Biolog community level physiological profile (CLPP), based on the growth of microorganisms in 96-well Ecoplates containing 31 different substrates and a blank (in triplicate), with a tetrazolium die, indicating the rate of their oxidation. These two methods are based on different assumptions and were rarely directly compared in the same study. Advantages and disadvantages of both are thoroughly discussed by Stefanowicz [14] and by Graham and Haynes [15].
2. Materials and Methods
2.1. Site Description and Soil Sampling
This study was carried out in the Campania region, in the “Parco Nazionale del Cilento, Vallo di Diano e Alburni (Salerno, Italy)”, in the municipality of Stio of the locality of Gorga. One of the major productions of the Stio area is the chestnut, collected in the dense woods of the hills. However, in recent years, the cultivation and trade of a local variety of bean (Phaseolus vulgaris L.) called “Fagiolo della Regina di Gorga”, exclusive of this area, have been encouraged. In order to enhance bean production, local farmers have deforested portions of land occupied by chestnuts by converting them into crops. The studied area is related to one of these situations. It includes two neighboring systems: the first is the native forest dominated by chestnut (Castanea sativa M.) trees (C); the second is an agricultural field (A) deriving from a part of the chestnut forest subjected to deforestation in June 2012 and then, to deep tillage in order to be used for the cultivation of Fagiolo della Regina di Gorga. The cultivation was carried out without fertilizers and pesticides application.
Further details on the study area, the mode of the conversion of soil use as well as the soil characteristics and sampling scheme, are described in Scotti et al. [16], which reported the preliminary comparison of soil physico-chemical and biological properties between the native chestnut and the deforested area, analyzed 5 months after conversion. For each area, three plots were defined and, in each plot, six sub-samples were collected from the topsoil (0–20 cm), following a W scheme after removing the undecomposed litter, in the case of the forest site. Soil samples were collected in June 2013 (I), October 2013 (II), October 2014 (III), October 2015 (IV) and June 2016 (V), corresponding to 13, 17, 29, 41 and 49 months after the soil use change.
2.2. Water Content and Organic Carbon
Soil water content was measured by gravimetric method after oven drying at 105 °C until constant weight.
Organic C content was assayed by the chromic acid titration method [17], on air-dried soil subsamples. The results were expressed on oven dry weight basis.
2.3. Soil Metabolic Fingerprint
The soil metabolic fingerprint was investigated by the catabolic response profile (CRP) as described by Degens and Harris [13] and by the Biolog community level physiological profile (CLPP), introduced by Garland and Mills [18]. Both approaches evaluate the ability of the soil microbial community to use a set of single carbon substrates as a source of carbon and energy. The Biolog is more widely reported in the soil literature, but the Degens method is considered to better reflect the effective microbial community status [15].
2.4. Catabolic Response Profile (CRP)
Wet soil samples equivalent to 1 g of dry weight were placed in 30 mL serum vials and amended with 2 mL of 25 simple organic substrates solutions (at pH 5.8–6) dispensed individually. The substrates are reported in Figure 1, Figure 2, Figure 3, Figure 4 and Figure 5. The concentrations of the substrate solutions are indicated in Degens et al. [19]. The vials were sealed and incubated at 25 °C in darkness for 4 h, shaking vigorously every hour. After incubation, the induced respiration rate was detected measuring the CO2 concentration in the vial headspace by an Agilent Technologies CG 6850 gascromatograph (Agilent Technologies, Santa Clara, CA, United States) equipped with a capillary column HP-Plot Q (30 m length; 0,32 mm ID) and a thermal conductivity detector (TCD). The basal respiration was measured with the same procedure adding to the soil 2 mL of distilled water and the value was subtracted from the gross respiration induced by each substrate. The catabolic evenness (CE) was calculated by Simpson Yule index CE = 1/Σ(pi)2, where pi is the ratio of the respiration induced by a particular substrate (net of basal) with respect to the sum of respiration induced by all substrates [13].
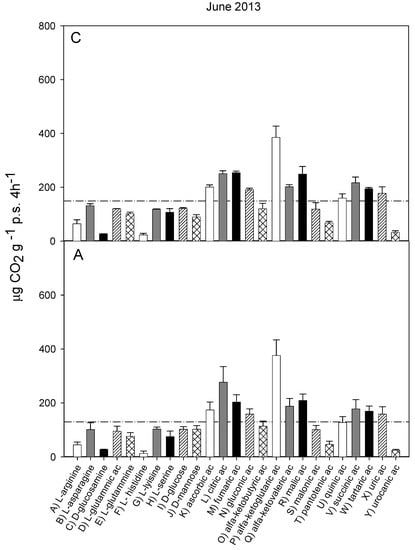
Figure 1.
Catabolic response profile of chestnut (C) and agricultural (A) soils in June 2013. The dotted line represents the average substrate induced respiration (ASIR), corresponding to 149 ± 3.76 in chestnut and to 130 ± 6.7 in agricultural soil (the values were not significantly different).
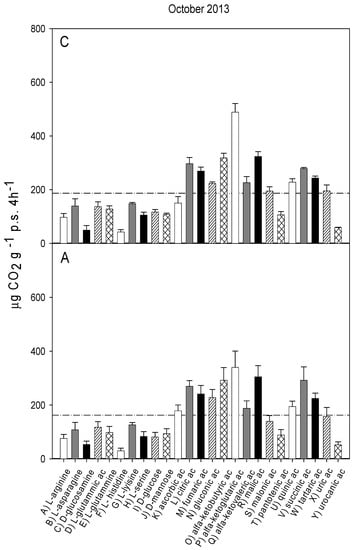
Figure 2.
Catabolic response profile of chestnut (C) and agricultural (A) soils in October 2013. The dotted line represents the average substrate-induced respiration (ASIR), corresponding to 187 ± 7.9 in chestnut and to 162 ± 13.8 in agricultural soil (the values were not significantly different).
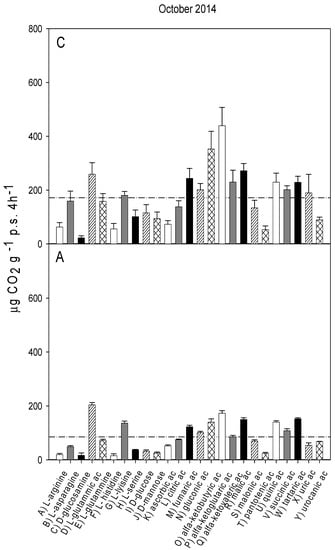
Figure 3.
Catabolic response profile of chestnut (C) and agricultural (A) soils in October 2014. The dotted line represents the average substrate-induced respiration (ASIR), corresponding to 171 ± 15.3 in chestnut and to 84.9 ± 2.5 in agricultural soil (the values were not significantly different).
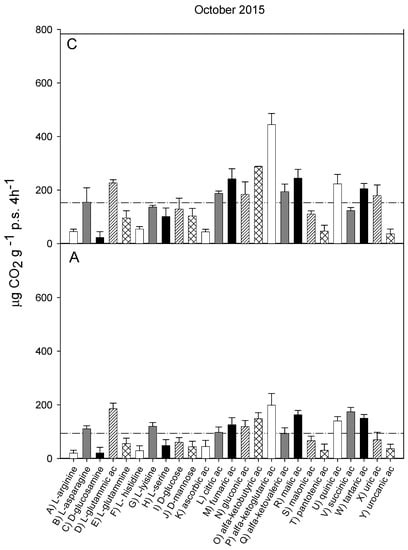
Figure 4.
Catabolic response profile of chestnut (C) and agricultural (A) soils in October 2015. The dotted line represents the average substrate-induced respiration (ASIR), corresponding to 152.8 ± 17.9 in chestnut and to 93.99 ± 19.3 in agricultural soil (the values were significantly different with p < 0.05).
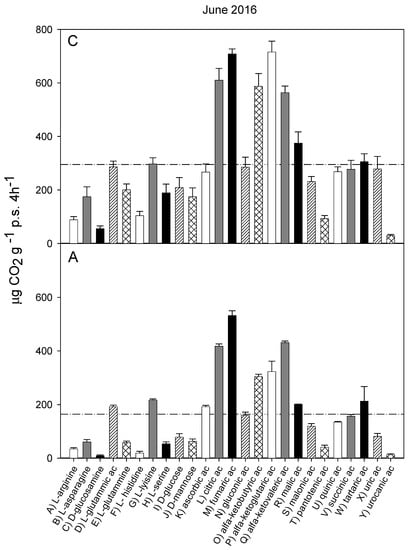
Figure 5.
Catabolic response profile of chestnut (C) and agricultural (A) soils in June 2016. The dotted line represents the average substrate-induced respiration (ASIR), corresponding to 152.8 ± 17.9 in chestnut and to 93.99 ± 19.3 in agricultural soil (the values were significantly different with p < 0.05).
2.5. Biolog Community Level Physiological Profile (CLPP)
The Biolog CLPP was determined in commercial 96 wells EcoPlates™ containing 31 carbon sources (listed in Table 2) and a blank, all in triplicate, as described by Bartelt-Ryser et al. [20]. A soil suspension was obtained shaking 5 g of wet soil in 40 mL of sterilized water for 30 min at room temperature. The suspension was centrifuged at 2419 rcf for 5 min and the supernatant, diluted 1:100, was dispensed in the wells at a dose of 100 µl. The plates were incubated at 25 °C in darkness to allow the growth of microorganisms. As the substrates are utilized by microorganisms, the tetrazolium violet dye is reduced, developing a purple color, which was recorded 96 h post inoculation, as optical density at 590 nm, using the Bio-Rad Microplate Reader 550 (Biorad, Hercules, CA, United States). The average well color development (AWCD) was calculated as the sum of activities measured in all wells of each plate, divided by the 31 carbon sources and assumed as an indicator of the general level of microbial activity [21]. Shannon’s index was calculated as H’ = −Σpi ln pi, where pi is the ratio of the activity on a particular substrate with respect to the sum of activities on all substrates [22,23].
2.6. Statystical Analysis
The data of the induced respiration rates and of the optical densities obtained by the two analytical approaches for each substrate, for each soil and each sampling time, were processed by principal component analysis (PCA) using the Multi-Variate Statistical Package software. In order to investigate the differences between the two soils and among samplings, the scores of the first two principal components and the values of the other measured or calculated variables, were analyzed by the Two-Way ANOVA using Sigma Plot 11 software, after verifying the normal distribution and the equal variance of the data. The results of catabolic evenness, which failed both conditions, were processed by the Mann–Whitney rank sum test. The results of Corg also showed not normal distribution and thus, comparisons between the two soils for each sampling and among sampling for each soil, were tested by One Way ANOVA. In all cases, the Tukey post hoc test was used for multiple comparisons. In order to compare the trends of substrate-induced respiration rates or optical density (OD) values between C and A soils, the data were subjected to Spearman correlation analyses, after the Shapiro–Wilk test had verified that not all the data had normal distribution.
3. Results
3.1. Water Content and Soil Organic Carbon
Water content (Table 1) was not different between the C and A soils. Significant (p < 0.001) differences were found among samplings, with higher values in sampling II and IV, in comparison with the other ones.

Table 1.
Water content (WC), organic carbon (C org), catabolic evenness (CE) and Shannon index (H’) obtained at each sampling time for the chestnut (C) and the agricultural (A) soils from the data of respiration induced by the 25 substrates of catabolic response profile (CRP) and from the OD of Biolog community level physiological profile (CLPP), respectively.
Soil organic carbon (C org) (Table 1) was, on average, higher in C (49.9 g kg−1) than in A soil (31.7 g kg−1), corresponding to a reduction of 36%, although significant differences (p < 0.05) between the two soils were found only in samplings I, II and III. No significant differences were found for different sampling times.
3.2. Catabolic Response Profile
The catabolic response profiles (CRP) of the two studied soils at the five sampling times, are shown in Figure 1, Figure 2, Figure 3, Figure 4 and Figure 5. The horizontal dotted line in each graph indicates the average substrate-induced respiration (ASIR), that we assumed as the homologous of the Biolog average well color development (AWCD). For each sampling time, the CRP showed comparable trends between the chestnut and agricultural soil. In both soils and for all sampling times, fumaric, α-ketoglutaric, malic and tartaric acids induced respiration rates overcoming the ASIR line. Gluconic and α-ketobutirric acids also overcame the ASIR line in four samplings out of five. A variability of the respiration profile was recorded among the samplings, but α-ketoglutaric acid was always the most respired substrate, except for A soil in October 2014, where it was the second most respired, after L glutamic acid. In October 2014, a general drop in respiration was recorded for all substrates in the A soil in comparison to C soil. This gap did not appear in the successive sampling (October 2015). In June 2016, a noticeable increase in respiration was found for many substrates, especially in C soil, where the ASIR raised to 295 µg CO2 g−1 p.s. 4 h−1. The substrates showing the highest increase in respiration were citric, fumaric, α-ketobutyric, α-ketoglutaric and α-ketovaleric acids, whose oxidation produced about or even more than two times the mean production of CO2.
Figure 6 shows the results of PCA applied to the respiration responses to all substrates for all samplings. The first principal component (PC1) explains 67.06% and the second principal component (PC2) the 12.22% of the variance. The score plot (Figure 6a) shows a separation between the A and C soils in the first principal component (PC1 scores were significantly different for p < 0.001). Samplings were also significantly (p < 0.001) separated in the first principal component, with significant interaction (p < 0.001) between soils and sampling time. In particular, the C and A soils were not separated in samplings I and II, whereas the PC1 scores of the two soils were significantly different in the samplings III, IV and V. The PC2 showed a clear and significant (p < 0.001) separation of sampling V with respect to all the other samplings.
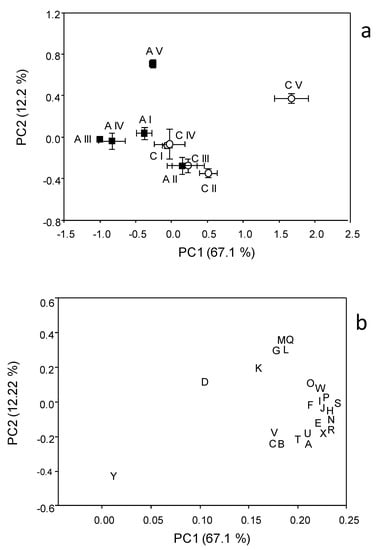
The loading plot (Figure 6b) shows that all respiration responses were correlated in the first principal component, so that all substrates tended to be more respired in C soil, confirming that the global pattern of substrate utilization was similar between A and C. Moreover, the loading plot shows that the separation of sampling V from the other samplings is mainly attributable to the higher relative increase in respiration induced by L-lysine and by ascorbic, citric, fumaric and α-ketovaleric acids.
The catabolic evenness (Table 1) was significantly higher in C than in the A soil only in samplings I and V; the values in C soil were not different among the samplings; conversely, in the A soil, CE was significantly different among the samplings, with lower values in I and V, similar to each other, whereas no differences were found among II, III and IV samplings.
3.3. Biolog Community Level Physiological Profile
The results of the CLPP obtained by the Biolog Ecoplates™ are shown in Table 2. The optical density of ten of the 31 substrates (Pyruvic acid methyl ester, Tween 40, Tween 80, D-Mannitol, N-Acetil-D-glucosamine, D-Glucosaminic acid, D-Galacturonic acid, L-Arginine, L-Asparagine, L-Serine) always exceeded the AWCD in both the C and A soils (with the only exception of Pyruvic acid methyl ester in sampling V). Similarly to what was found for the CRP, the values of OD recorded for the 31 substrates were always highly significantly correlated between the C and A soil at each sampling time (Table 2). However, with a few exceptions, for most substrates the OD showed generally higher values in C soils. This was summarized by the AWCD which, on average, was significantly (p < 0.01) higher in C (0.848) than in A (0.732) soil. This parameter also showed significant differences among samplings (p < 0.001) and interaction soil x sampling (p < 0.05). In particular, the Tukey test revealed that the differences among sampling were significant within C but not within the A soil and that the difference between the C and A soils was significant only in samplings I, II and IV.
Table 2.
Biolog Ecoplate optical densities on 31 substrates and the average well color development (AWCD) recorded for the agricultural (A) and the chestnut (C) soils in the five samplings. Bold numbers indicate values of optical density higher than the corresponding AWCD. In the last row, uppercase letters indicate statistical differences between A and C soils for each sampling, whereas lowercase letters indicate, for each soil, statistical differences among samplings. Different letters correspond to significant differences with p < 0.05.
The PCA scores (Figure 7a) showed no visible separation between the A and C soils. In fact, the scores of the A soil for the five samplings appeared nested within the scores of C soil, which were more widespread on the plot. However, the two-way ANOVA performed on the scores of the first principal component showed a significant effect of both soil and sampling, with a significant interaction (p < 0.05) between them, indicating that the difference between the A and C soils depends on which sampling is considered. In fact, according to the mean separation by Tukey test, the C and A soils differ in their Biolog CLPP in samplings I, II and IV. Moreover, the Tukey test showed that the Biolog CLPPs were not different among the samplings in the A soil, whereas within the C soil, a different profile was found between V and all the other samplings, as well as between samplings II and IV. The two-way ANOVA on the scores of the second principal component showed no significant effect of soil management, whereas differences (p < 0.001) were found among samplings (V vs. I and V; IV vs. II and III).
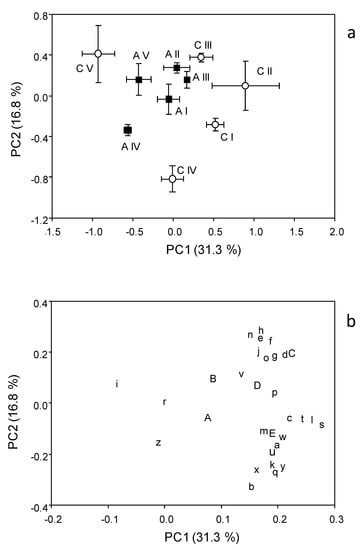
Figure 7.
Scores (a) and loading (b) plots of the principal component analysis applied to the Biolog of the chestnut (C) and agricultural (A) soils. The letters in the loading plot indicate the 31 substrates as indicated in Table 2.
The loadings plot (Figure 7b) showed that the level of utilization of most of the substrates was positively correlated with PC1.
The Shannon index H’ applied to the Biolog CLPP (Table 1) was significantly different among samplings (p < 0.001) with a significant interaction soil x sampling (p < 0.05). The Tukey test revealed that H’ significantly differed between C and A only in samplings II and V.
4. Discussion
The conversion of soil management from chestnut forest to agricultural soil determined a noticeable decrease in soil organic C content in the topsoil. This was the result of different factors, mainly that of the initial mouldboard plowing [16]. This practice was applied to incorporate deeply the layer of soil with no removable large tree roots, which would make cultivation practices impossible, but also resulted in the deep incorporation of the humus rich-topsoil and surface transport of deep layer poorer of organic matter. Successively, the cut of the forest determined the lack of the above and belowground litter deposition from trees, shrubs and herbaceous plants. In the cultivated soil, the organic matter input is almost limited to bean rhizodeposition during the crop growth, considering the removal of harvest and crop residues. Cultivation usually results in the acceleration of the decay of existing soil organic matter as a consequence of repeated tillage operations and soil disturbance [24,25,26,27,28]. However, in our study, after the dramatical drop occurred due to the initial mouldboard plowing, no evident further decrease in organic matter content was recorded over time. The reduction in organic matter content is usually the most evident impact of deforestation on soil quality, but also other soil properties such as the total N, available P, EC and water holding capacity, may be negatively affected [29]. At our study site, 5 months after conversion, the organic C, total N, C/N ratio, available P, cation exchange capacity, exchangeable Ca, Na, Mg and K, were all significantly lower in the deforested cultured soil [16], indicating a marked change in various aspects of the soil physico-chemical environment.
The composition of the soil organic matter pool and the quantity, quality and distribution of litter fall over the year, together with other soil physico-chemical properties, are the main drivers of the microbial community composition and the orientation of their metabolic processes, which in turn determine the microbial functional biodiversity.
The most evident information given by the catabolic response profiles recorded by the method of Degens and Harrys [13] as well as by the Biolog Ecoplates is that the conversion of use change reduced the overall level of substrate utilization but did not disturb the general trend of substrate utilization. This means that the two soils have the same order of preference for the administered substrates. The similarity of the trend of substrate utilization profiles recorded between the C and A soils by both methods, are remarked by the high value of their correlation coefficients, especially for Degens and Harrys CRP, for which it was almost always higher than 0.9. This may suggest that the metabolic functions of the soil microbial community of the studied soils are tightly related to the specific pedogenetic characteristics of the site and/or that, in the elapsed time, the deforestation and the successive management practices, while decreasing the quantity of organic matter, did not alter its properties and composition to the point of changing the physiological characteristics of the soil microbial community.
Bisset et al. [30] suggest that the soil microbial function may often be limited by factors other than community composition and that such limiting factors may over-ride any effects of potential disturbance. However, this does not mean that no changes occur in the microbial structure and species composition. In fact, a peculiarity of soil microbial communities is their functional redundance, consisting in the similarity of functions driven by different microbial species. This implies that a reduction in any group of species has little effect on the overall processes in the soil, because other microorganisms can take on its function [31]. Bisset et al. [30] also did not found different Biolog CLPP between the cultivated and uncultivated soils, despite the differences in the physico-chemical soil properties and in the structure of microbial community. According to Degens et al. [19], the functional diversity of the microbial community in terms of substrate utilization may reflect the quality of organic compounds availability in the soil environment. Before the land use change, our sites have a common history of more than 50 years as undisturbed chestnut forest [16] and it is possible that during the relatively short term from the conversion, the decrease in the quantity of organic resources did not correspond to the modification of its quality to the extent to modify the metabolic profile of microbial community.
Despite the similarity in the hierarchic preference of the different substrates, the most used indexes to calculate the functional biodiversity from the substrate utilization data, i.e., Simpson Yule for Degens and Harris CRP and Shannon for Biolog, indicate some differences in how much each substrate concur to the overall level of substrate utilization. The catabolic evenness was, on average, reduced by 2 units from the chestnut (18.5) to the agricultural soil (16.1). Using 25 substrates, the maximum levels that CE can assume is 25, which occurs when all the substrates concur to the same extent to the total respiration. The more this value lower is than 25, the more the metabolic profile can be considered affected by the disturbance and/or by a reduction in organic matter quality. Degens et al. [19] indicated 18 as the threshold of catabolic evenness below which the metabolic profile should be considered unbalanced. According to this assumption, the chestnut and the agricultural soils have CE values falling, respectively, above and below this threshold, indicating the occurrence of stress conditions in the latter. However, only in the two Spring samplings, the lowering of catabolic evenness in the agricultural soil was statistically significant. Noteworthy is the time fluctuation of these indices in the agricultural soil in contraposition to the quite constant values found in chestnut soil, which may indicate more unstable conditions in the first, as a consequence of the dramatic simplification of the ecosystem. Between the two indices, the catabolic evenness is in accordance with Chaer et al. [32], which found the lower functional stability of the microbial community in a deforested and long-term cultivated compared to a paired undisturbed forest soil. Graham and Haynes [15] also compared the two methods to investigate the microbial community diversity in soils under different land uses and found that the CRP method was able to better discriminate the soil types.
Within each sampling, rather than the metabolic profile, the soil use change appeared to reduce the overall level of activity, independent of the substrate. This was evident with both CRP and Biolog and was highlighted by the differences found in ASIR and AWCD between the two soils, as well as by the trend between the PC1 and the substrate loadings for both methods. The fall of substrate utilization in the agricultural with respect to the native chestnut soil, particularly evident with CRP in the last three years, was most likely a consequence of the reduction in microbial biomass linked to the reduction in organic carbon. Five months after the conversion, the microbial biomass resulted 52% lowered in the agricultural soil [16] and it remained lower over the study (unpublished data).
Despite the similarity of the substrate utilization profiles between the two soils within each sampling, some differences of the profiles are evident overtime. One reason could be the climatic conditions in the period of sampling. This was particularly evident for sampling V where a rise of temperature likely stimulated the metabolic activity of the microbial community, determining a general increase in substrate utilization. However, not all the substrates responded with the same magnitude and some substrates such as urocanic acid, did not appear more utilized than previous samplings at all. This may suggest that some populations of the soil microbial community or specific metabolic pathways respond differently than others to the seasonal dynamics of climatic factors.
Comparing the results of the two analytical methods, the Degens CRP appears to be more able to discriminate between the two systems, whereas the Biolog appears more able to highlight the variability among samplings, showing a lower time variability in the cultivated soil, attributable to the simplification of its biological system.
5. Conclusions
The two approaches used in this study showed that, despite the deep modifications of soil environment, the conversion of the chestnut into agricultural soil affects to a modest extent the functional diversity of the soil microbial community assessed as the substrate utilization profiles which, instead, showed some seasonal variability. Much more evident are the effects on the general level of physiological activity, which showed a marked decrease in the agricultural soil, attributable to the reduction in organic matter as a consequence of deforestation and use change.
Author Contributions
Conceptualization, P.I. and M.Z.; data curation, P.I.; formal analysis, P.I.; funding acquisition, M.Z.; investigation, P.I. and R.S.; methodology, P.I. and M.Z.; project administration, M.Z.; resources, M.Z.; software, P.I.; supervision, M.Z.; validation, P.I., R.S. and M.Z.; visualization, P.I., R.S. and M.Z.; writing—original draft, P.I.; writing—review and editing, P.I., R.S. and M.Z. All authors have read and agreed to the published version of the manuscript.
Funding
This research received no external funding.
Informed Consent Statement
Not applicable.
Acknowledgments
Authors are thankful to Anna Alfani from University of Salerno (Italy) for hosting them in her lab for the CO2 measurements and for revising the manuscript.
Conflicts of Interest
The authors declaring no conflict of interest.
References
- Köhl, M.; Lasco, R.; Cifuentes, M.; Jonsson, Ö.; Korhonen, K.T.; Mundhenk, P.; de Jesus Navar, J.; Stinson, G. Changes in forest production, biomass and carbon: Results from the UN FAO Global Forest Resource Assessment. For. Ecol. Manag. 2015, 352, 21–34. [Google Scholar] [CrossRef]
- Dixon, R.K.; Brown, S.; Houghton, R.A.; Solomon, A.M.; Trexler, M.C.; Wisniewski, J. Carbon pools and flux of global forest ecosystems. Sci. New Ser. 1994, 263, 185–190. [Google Scholar] [CrossRef]
- Schoene, D.; Killmann, W.; von Lüpke, H.; Loyche-Wilkie, M. Definitional Issues Related to Reducing Emissions from Deforestation in Developing Countries; Forests and Climate Change Working Paper. No. 5; FAO: Rome, Italy, 2007. [Google Scholar]
- Bradford, A. Deforestation: Facts, Causes and Effects. Available online: www.livescience.com/27692-deforestation.html (accessed on 15 October 2020).
- Kissinger, G.; Herold, M.; De Sy, V. Drivers of Deforestation and Forest Degradation: A Synthesis Report for REDD+ Policymakers; Lexeme Consulting: Vancouver, BC, Canada, 2012. [Google Scholar]
- FAO. State of the World’s Forests 2016. Forests and Agriculture: Land-Use Challenges and Opportunities. Available online: http://www.fao.org/3/a-i5588e.pdf (accessed on 15 October 2020).
- Chakravarty, S.; Ghosh, S.K.; Suresh, C.P.; Dey, A.N.; Shukla, G. Deforestation: Causes, Effects and Control Strategies. In Global Perspectives on Sustainable Forest Management; InTech: Rijeka, Croatia, 2012; Available online: http://www.intechopen.com/books/globalperspectives-on-sustainable-forest-management/deforestation-causes-effects-and-control-strategies (accessed on 15 October 2020).
- Gaertner, M.A.; Christensen, O.B.; Prego, J.A.; Polcher, J.; Gallardo, C.; Castro, M. The impact of deforestation on the hydrological cycle in the western Mediterranean: An ensemble study with two regional climate models. Clim. Dyn. 2001, 17, 857–873. [Google Scholar] [CrossRef]
- Mongabay. Deforestation Statistics for Italy. Available online: rainforests.mongabay.com (accessed on 15 October 2020).
- Hajabbasi, M.A.; Jalalian, A.; Karimzadeh, H.R. Deforestation effects on soil physical and chemical properties, Lordegan, Iran. Plant Soil 1997, 190, 301–308. [Google Scholar] [CrossRef]
- Attiwill, P.M.; Adams, M.A. Tansley review No. 50. Nutrient cycling in forests. New Phytol. 1993, 124, 561–582. [Google Scholar] [CrossRef]
- Kiikkilä, O.; Kitunen, V.; Smolander, A. Dissolved soil organic matter from surface organic horizons under birch and conifers: Degradation in relation to chemical characteristics. Soil Biol. Biochem. 2006, 38, 737–746. [Google Scholar] [CrossRef]
- Degens, B.P.; Harris, J.A. Development of a physiological approach to measuring the catabolic diversity of soil microbial communities. Soil Biol. Biochem. 1997, 29, 1309–1320. [Google Scholar] [CrossRef]
- Stefanowicz, A. The Biolog plates technique as a tool in ecological studies of microbial communities. Pol. J. Environ. Stud. 2006, 15, 669–676. [Google Scholar]
- Graham, M.H.; Haynes, R.J. Catabolic diversity of soil communities under sugarcane and other land uses estimated by Biolog and substrate-induced respiration methods. Appl. Soil Ecol. 2005, 29, 155–164. [Google Scholar] [CrossRef]
- Scotti, R.; Iovieno, P.; Zaccardelli, M. Comparative assessment of enzyme activities and soil microbial communities in paired chestnut forest and agricultural soils. Biol. Fertil. Soils 2015, 51, 1013–1019. [Google Scholar] [CrossRef]
- Walkley, A.J.; Black, I.A. Estimation of soil organic carbon by the chromic acid titration method. Soil Sci. 1934, 37, 29–38. [Google Scholar] [CrossRef]
- Garland, J.L.; Mills, A.L. Classification and characterization of heterotrophic microbial communities on the basis of patterns of community-level sole-carbon-source utilization. Appl. Environ. Microbiol. 1991, 57, 2351–2359. [Google Scholar] [CrossRef] [PubMed]
- Degens, B.P.; Schipper, L.A.; Sparling, G.P.; Vojvodic-Vukovic, M. Decreases in organic C reserves in soils can reduce the catabolic diversity of soil microbial communities. Soil Biol. Biochem. 2000, 32, 189–196. [Google Scholar] [CrossRef]
- Bartelt-Ryser, J.; Joshi, J.; Schmid, B.; Brandl, H.; Balser, T. Soil feedbacks of plant-diversity on soil microbial communities and subsequent plant growth. Perspect. Plant Ecol. 2005, 7, 27–49. [Google Scholar] [CrossRef]
- Yao, H.; He, Z.; Wilson, M.J.; Campbell, C.D. Microbial Biomass and Community Structure in a Sequence of Soils with Increasing Fertility and Changing Land Use. Microb. Ecol. 2000, 40, 223–237. [Google Scholar] [CrossRef] [PubMed]
- Fulthorpe, R.R.; Allen, D.G. Evaluation of biolog MT plates for aromatic and chloroaromatic substrate utilization tests. Can. J. Microbiol. 1994, 40, 1067–1071. [Google Scholar] [CrossRef]
- Staddon, W.J.; Duchensne, L.C.; Trevors, J.T. Microbial diversity and community structure of post-disturbance forest soils as determined by sole carbon-source utilization patterns. Microb. Ecol. 1997, 34, 125–130. [Google Scholar] [CrossRef]
- Guo, Y.J.; Ni, Y.; Han, J.G. The influence of land use change on chemical and biological properties of steppe soils in northern China. Arid Land Res. Manag. 2009, 23, 197–212. [Google Scholar] [CrossRef]
- Katsalirou, E.; Deng, S.; Nofziger, D.L.; Gerakis, A. Long-term management effects on organic C and N pools and activities of C-transforming enzymes in prairie soils. Eur. J. Soil Biol. 2010, 46, 335–341. [Google Scholar] [CrossRef]
- Qiu, L.; Wei, X.; Zhang, X.; Cheng, J.; Gale, W.; Guo, C.; Long, T. Soil organic carbon losses due to land use change in a semiarid grassland. Plant Soil 2012, 355, 299–309. [Google Scholar] [CrossRef]
- Ding, F.; Hu, Y.L.; Li, L.J.; Li, A.; Shi, S.; Lian, P.Y.; Zeng, D.H. Changes in soil organic carbon and total nitrogen stocks after conversion of meadow to cropland in Northeast China. Plant Soil 2013, 373, 659–672. [Google Scholar] [CrossRef]
- Lal, R. Land use and soil management effects on soil organic matter dynamics on Alfisols in Western Nigeria. In Soil Processes and the Carbon Cycle; CRC Press LLC: Boca Raton, FL, USA, 1997; pp. 109–126. [Google Scholar]
- Haque, S.M.S.; Das Gupta, S.; Miah, S. Deforestation effects on biological and other important soil properties in an upland watershed of Bangladesh. J. For. Res. 2014, 25, 877–885. [Google Scholar] [CrossRef]
- Bissett, A.; Richardson, A.E.; Baker, G.; Peter, H.; Thrall, P.H. Long-term land use effects on soil microbial community structure and function. Appl. Soil Ecol. 2011, 5, 66–78. [Google Scholar] [CrossRef]
- Nannipieri, P.; Ascher, J.; Ceccherini, M.T.; Landi, L.; Pietramellara, G.; Renella, G. Microbial diversity and soil functions. Eur. J. Soil Sci. 2017, 68, 12–26. [Google Scholar] [CrossRef]
- Chaer, G.; Fernandes, M.; Myrold, D.; Bottomley, P. Comparative resistance and resilience of soil microbial communities and enzyme activities in adjacent native forest and agricultural soils. Microb. Ecol. 2009, 58, 414–424. [Google Scholar] [CrossRef] [PubMed]


Publisher’s Note: MDPI stays neutral with regard to jurisdictional claims in published maps and institutional affiliations. |
© 2021 by the authors. Licensee MDPI, Basel, Switzerland. This article is an open access article distributed under the terms and conditions of the Creative Commons Attribution (CC BY) license (http://creativecommons.org/licenses/by/4.0/).